Embed Size (px)
Citation preview
HISTORICAL CHANGES IN THE MISSISSIPPI-ALABAMA BARRIER ISLANDS AND THE ROLES OF EXTREME STORMS, SEA LEVEL, AND HUMAN ACTIVITIES
Robert A. Morton
88∞30'0"W
88∞30'0"W
88∞28'0"W
88∞28'0"W
88∞26'0"W
88∞26'0"W
88∞24'0"W
88∞24'0"W
88∞22'0"W
88∞22'0"W
88∞20'0"W
88∞20'0"W
88∞18'0"W
88∞18'0"W
30∞10'0"N
30∞10'0"N
30∞12'0"N
30∞12'0"N
30∞14'0"N
30∞14'0"N
30∞16'0"N
30∞16'0"N
30∞18'0"N
30∞18'0"N
0 1 2 3 4 5Kilometers
Petit Bois Island
1986
1950
1996
2005
1917
1848
Dauphin Island
2005
88∞46'0"W
88∞46'0"W
88∞44'0"W
88∞44'0"W
88∞42'0"W
88∞42'0"W
88∞40'0"W
88∞40'0"W
88∞38'0"W
88∞38'0"W
88∞36'0"W
88∞36'0"W
88∞34'0"W
88∞34'0"W
88∞32'0"W
88∞32'0"W
30∞12'0"N
30∞12'0"N
30∞14'0"N
30∞14'0"N
30∞16'0"N
30∞16'0"N
30∞18'0"N
30∞18'0"N
30∞20'0"N
30∞20'0"N
1986
1966
1950
1917
1849
1996
2005
Horn Island
88∞58'0"W
88∞58'0"W
88∞56'0"W
88∞56'0"W
88∞54'0"W
88∞54'0"W
88∞52'0"W
88∞52'0"W
30∞12'0"N
30∞12'0"N
30∞14'0"N
30∞14'0"N
30∞16'0"N
30∞16'0"N
0 1 2 3Kilometers
Ship Island
1986
1966
1950
1917
1848
1996
2005
FortMassachusetts
89∞10'0"W
89∞10'0"W
89∞8'0"W
89∞8'0"W
89∞6'0"W
89∞6'0"W
89∞4'0"W
89∞4'0"W
30∞12'0"N
30∞12'0"N
30∞14'0"N
30∞14'0"N
0 1 2 3Kilometers
Cat Island
1986
1966
1950
1917
1848
1995
2005
0 1 2 3 4 5Kilometers
Open-File Report 2007-1161
U.S. Department of the InteriorU.S. Geological Survey
HISTORICAL CHANGES IN THE MISSISSIPPI-ALABAMA BARRIER ISLANDS AND THE ROLES OF EXTREME STORMS, SEA LEVEL, AND HUMAN ACTIVITIES
By Robert A. MortonU.S. Geological SurveyFlorida Integrated Science CenterCoastal and Watershed Science TeamSt. Petersburg Florida 33701
U.S. Geological SurveyCoastal and Marine Geology Program
Open File Report 2007-1161
U.S. Department of the InteriorU.S. Geological Survey
Open-File Report 2007-1161 iii
Contents
SUMMARY ...........................................................................................................................................................................1INTRODUCTION...................................................................................................................................................................1COASTAL PROCESSES AND BARRIER ISLAND SETTINGS .........................................................................................2GEOLOGIC HISTORY OF THE MISSISSIPPI-ALABAMA BARRIERS ...........................................................................2HISTORICAL CHANGES IN THE MISSISSIPPI-ALABAMA BARRIER ISLANDS .......................................................4
Prior Geomorphic Studies ........................................................................................................................................4Materials and Methods.............................................................................................................................................5Morphological Changes and Rates of Change .....................................................................................................5
Dauphin Island................................................................................................................................................... 5Petit Bois Island ................................................................................................................................................ 6Horn Island ......................................................................................................................................................... 7Isle of Caprice.................................................................................................................................................... 7Ship Island.......................................................................................................................................................... 8Cat Island............................................................................................................................................................ 8
Patterns and Processes of Land Loss ....................................................................................................................9IMPACTS OF EXTREME STORMS ON THE MISSISSIPPI-ALABAMA BARRIERS ..................................................10
Reported Impacts of 18th and Early 19th Century Storms ...................................................................................101851, 1852, and 1888 Hurricanes ............................................................................................................................111916 Hurricane .........................................................................................................................................................121947 and 1948 Hurricanes .......................................................................................................................................14Hurricane Ethel (1960) .............................................................................................................................................14Hurricane Camille (1969) .........................................................................................................................................14Hurricane Frederic (1979) .......................................................................................................................................161985 Hurricanes........................................................................................................................................................17Hurricane Danny (1997)...........................................................................................................................................17Hurricane Georges (1998) .......................................................................................................................................17Hurricane Ivan (2004) ..............................................................................................................................................18Hurricane Katrina (2005) .........................................................................................................................................19Comparisons of Extreme Storm Impacts .............................................................................................................21
HISTORY OF HUMAN MODIFICATIONS TO THE MS-AL BARRIERS ........................................................................21Mobile Ship Channel (Mobile Bay Entrance) ......................................................................................................21Horn Island Pass (Pascagoula Channel) .............................................................................................................22Ship Island Pass (Gulfport Harbor) .......................................................................................................................22Ship Island Restoration ...........................................................................................................................................22Management of Dredged Material .......................................................................................................................23
ASSESSMENT OF FACTORS CONTROLLING BARRIER ISLAND LAND LOSS .........................................................23PREDICTION OF FUTURE BARRIER ISLAND TRENDS ................................................................................................24DISCUSSION AND CONCLUSIONS ................................................................................................................................26ACKNOWLEDGEMENTS ..................................................................................................................................................27REFERENCES......................................................................................................................................................................28
Open-File Report 2007-1161 iv
Figures
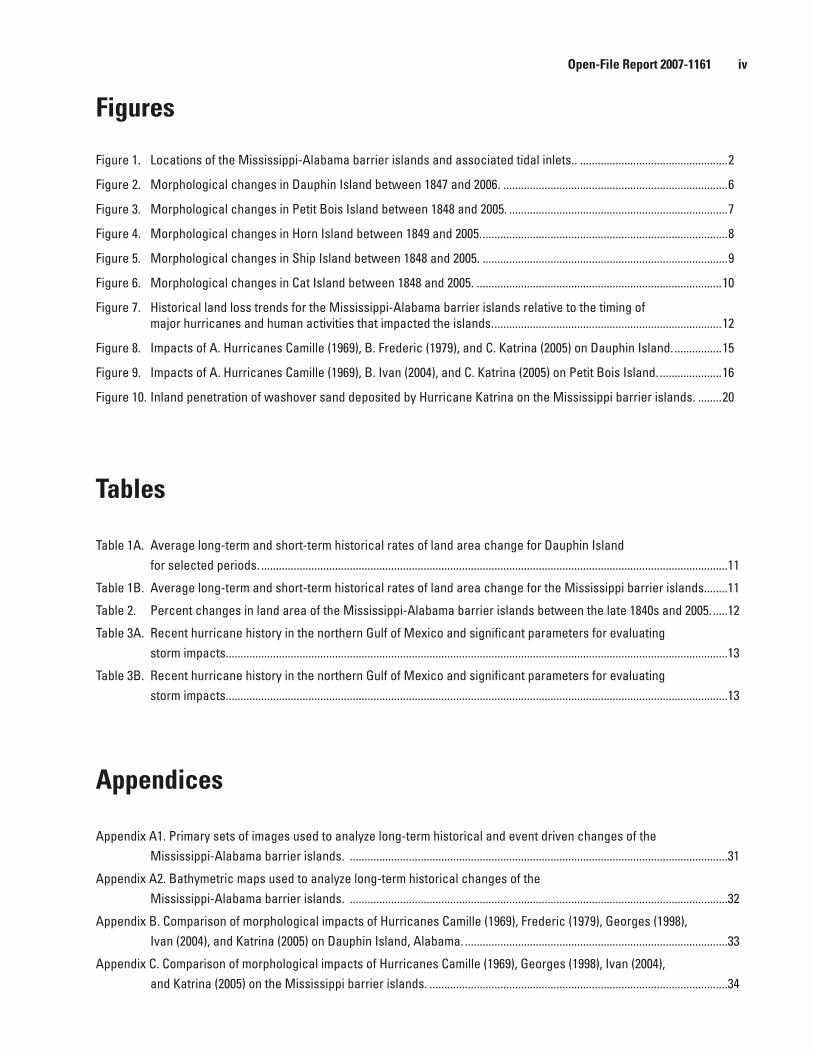
Figure 1. Locations of the Mississippi-Alabama barrier islands and associated tidal inlets.. ..................................................2
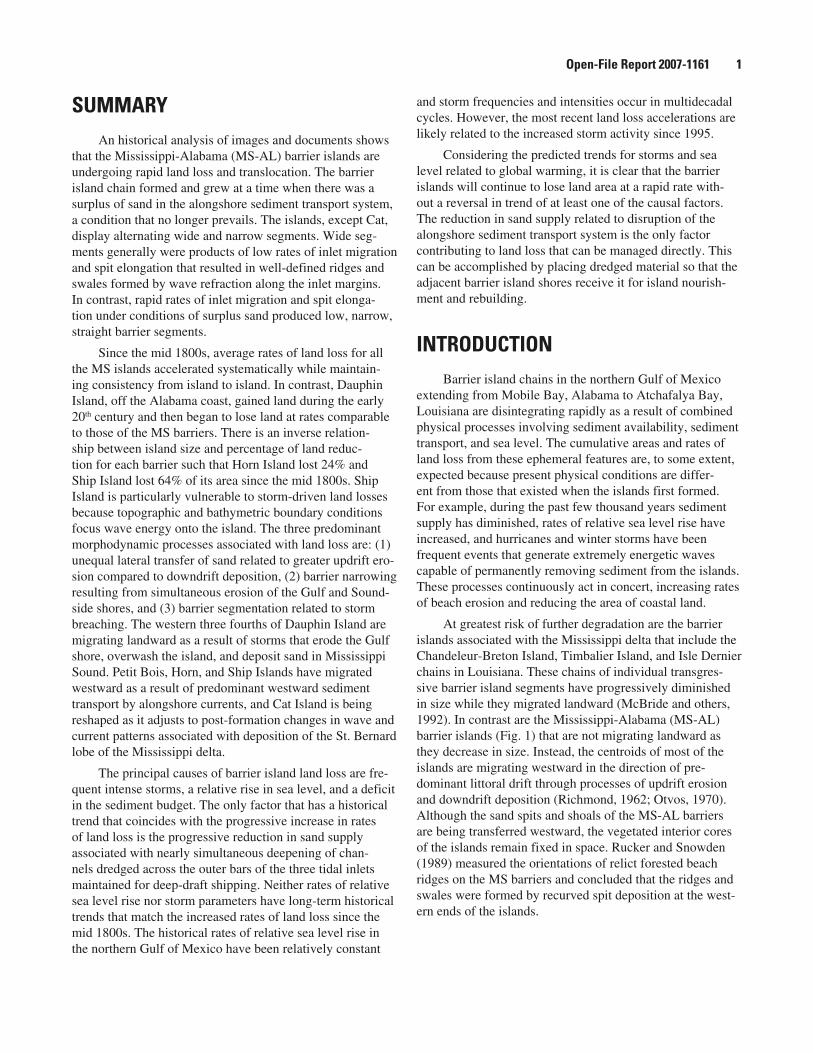
Figure 2. Morphological changes in Dauphin Island between 1847 and 2006. ............................................................................6
Figure 3. Morphological changes in Petit Bois Island between 1848 and 2005. ..........................................................................7
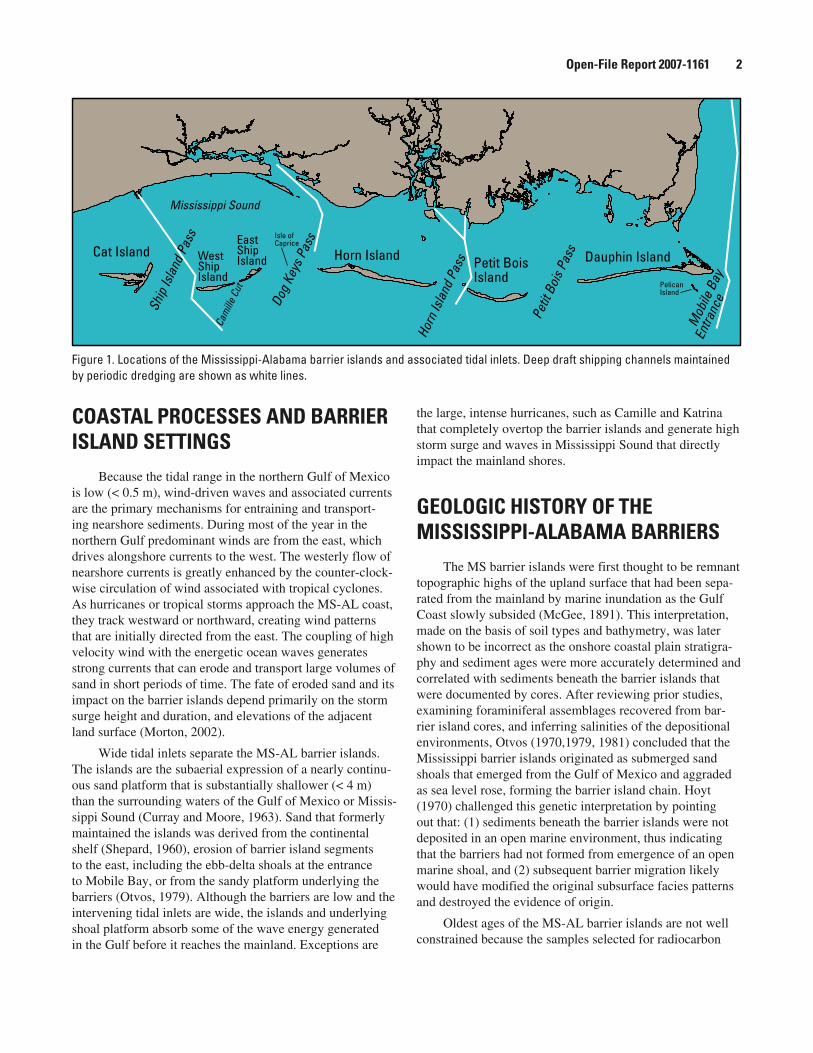
Figure 4. Morphological changes in Horn Island between 1849 and 2005. ...................................................................................8
Figure 5. Morphological changes in Ship Island between 1848 and 2005. ...................................................................................9
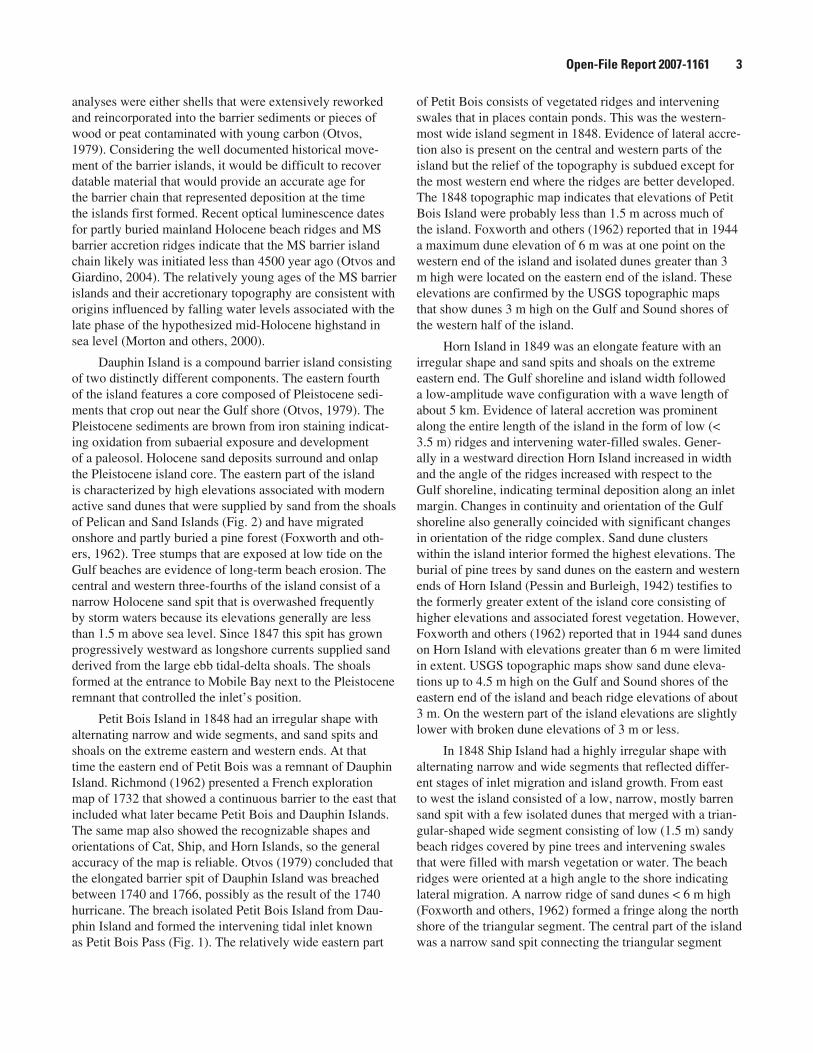
Figure 6. Morphological changes in Cat Island between 1848 and 2005. ...................................................................................10
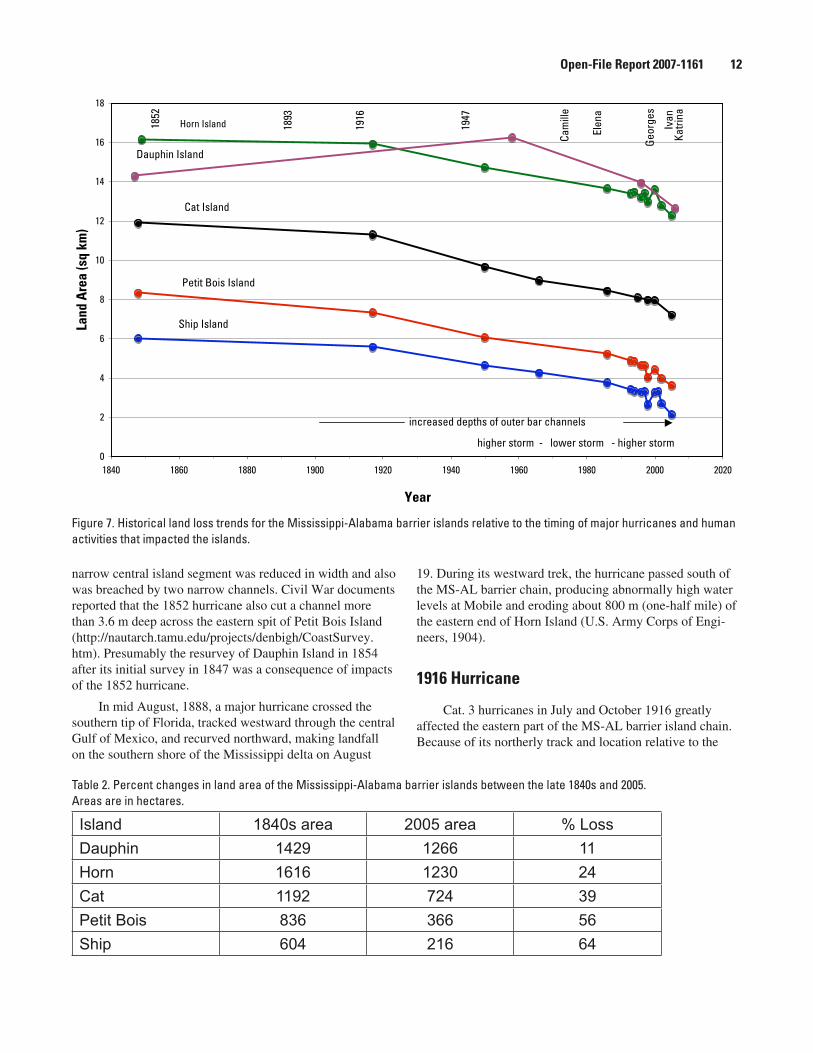
Figure 7. Historical land loss trends for the Mississippi-Alabama barrier islands relative to the timing of major hurricanes and human activities that impacted the islands. .............................................................................12
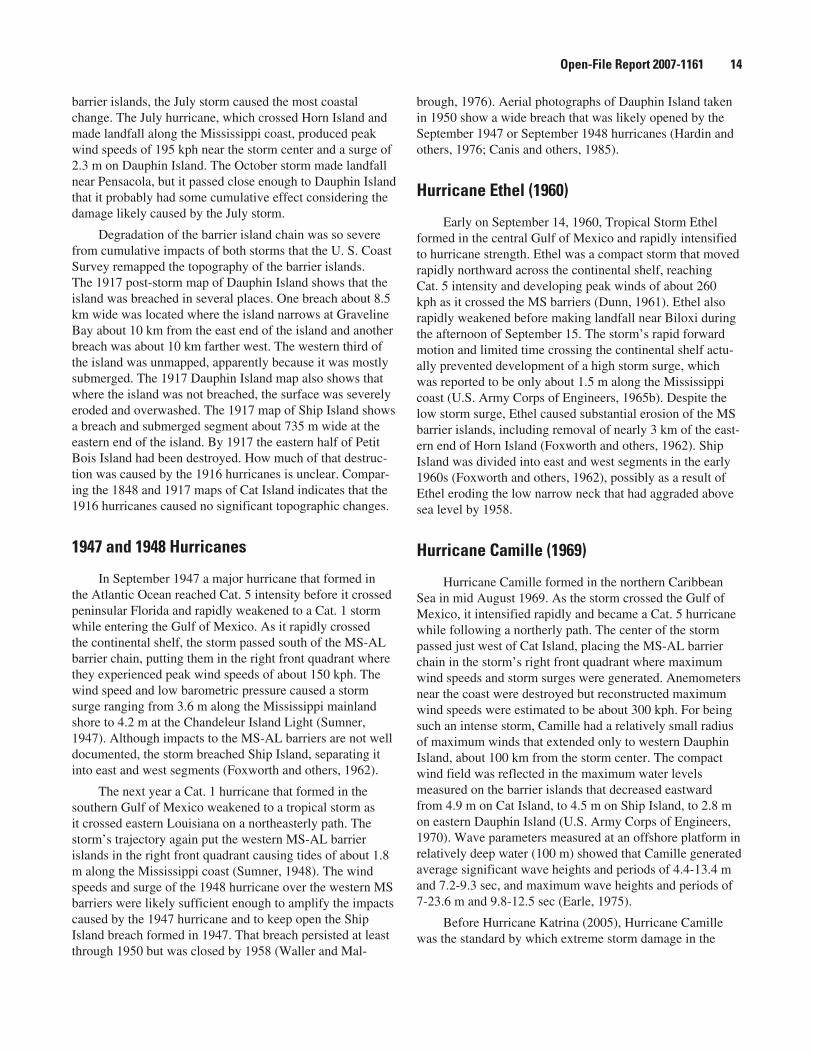
Figure 8. Impacts of A. Hurricanes Camille (1969), B. Frederic (1979), and C. Katrina (2005) on Dauphin Island. ................15
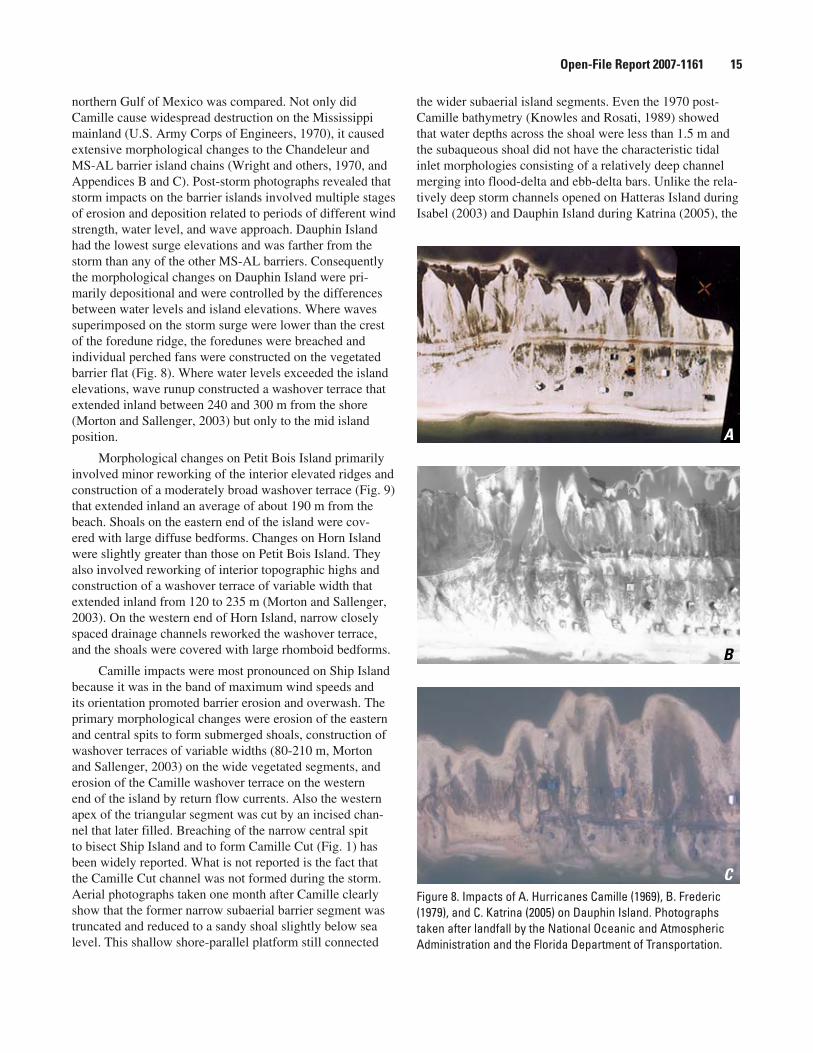
Figure 9. Impacts of A. Hurricanes Camille (1969), B. Ivan (2004), and C. Katrina (2005) on Petit Bois Island. .....................16
Figure 10. Inland penetration of washover sand deposited by Hurricane Katrina on the Mississippi barrier islands. ........20
Tables
Table 1A. Average long-term and short-term historical rates of land area change for Dauphin Island for selected periods. ..............................................................................................................................................................11
Table 1B. Average long-term and short-term historical rates of land area change for the Mississippi barrier islands. .......11
Table 2. Percent changes in land area of the Mississippi-Alabama barrier islands between the late 1840s and 2005. .....12
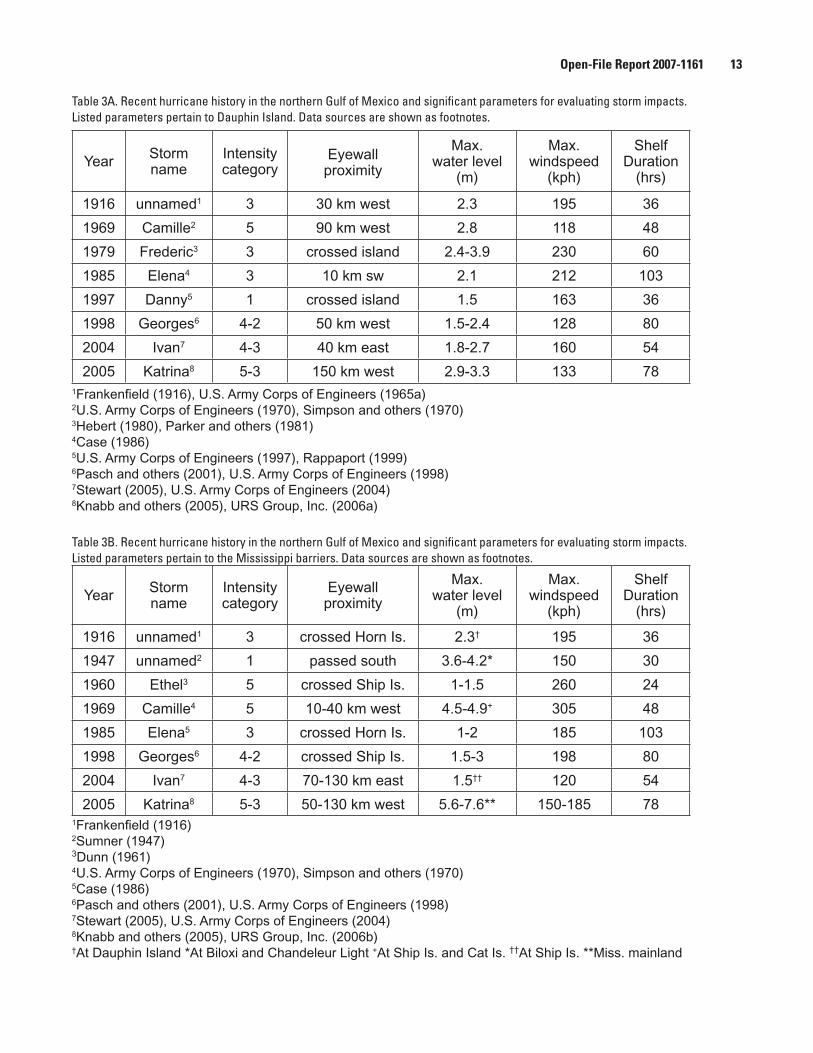
Table 3A. Recent hurricane history in the northern Gulf of Mexico and significant parameters for evaluating storm impacts. .........................................................................................................................................................................13
Table 3B. Recent hurricane history in the northern Gulf of Mexico and significant parameters for evaluating storm impacts. .........................................................................................................................................................................13
Appendices
Appendix A1. Primary sets of images used to analyze long-term historical and event driven changes of the Mississippi-Alabama barrier islands. ................................................................................................................................31
Appendix A2. Bathymetric maps used to analyze long-term historical changes of the Mississippi-Alabama barrier islands. ................................................................................................................................32
Appendix B. Comparison of morphological impacts of Hurricanes Camille (1969), Frederic (1979), Georges (1998), Ivan (2004), and Katrina (2005) on Dauphin Island, Alabama. .........................................................................................33
Appendix C. Comparison of morphological impacts of Hurricanes Camille (1969), Georges (1998), Ivan (2004), and Katrina (2005) on the Mississippi barrier islands. .....................................................................................................34
Open-File Report 2007-1161 1
SUMMARYAn historical analysis of images and documents shows
that the Mississippi-Alabama (MS-AL) barrier islands are undergoing rapid land loss and translocation. The barrier island chain formed and grew at a time when there was a surplus of sand in the alongshore sediment transport system, a condition that no longer prevails. The islands, except Cat, display alternating wide and narrow segments. Wide seg-ments generally were products of low rates of inlet migration and spit elongation that resulted in well-defined ridges and swales formed by wave refraction along the inlet margins. In contrast, rapid rates of inlet migration and spit elonga-tion under conditions of surplus sand produced low, narrow, straight barrier segments.
Since the mid 1800s, average rates of land loss for all the MS islands accelerated systematically while maintain-ing consistency from island to island. In contrast, Dauphin Island, off the Alabama coast, gained land during the early 20th century and then began to lose land at rates comparable to those of the MS barriers. There is an inverse relation-ship between island size and percentage of land reduc-tion for each barrier such that Horn Island lost 24% and Ship Island lost 64% of its area since the mid 1800s. Ship Island is particularly vulnerable to storm-driven land losses because topographic and bathymetric boundary conditions focus wave energy onto the island. The three predominant morphodynamic processes associated with land loss are: (1) unequal lateral transfer of sand related to greater updrift ero-sion compared to downdrift deposition, (2) barrier narrowing resulting from simultaneous erosion of the Gulf and Sound-side shores, and (3) barrier segmentation related to storm breaching. The western three fourths of Dauphin Island are migrating landward as a result of storms that erode the Gulf shore, overwash the island, and deposit sand in Mississippi Sound. Petit Bois, Horn, and Ship Islands have migrated westward as a result of predominant westward sediment transport by alongshore currents, and Cat Island is being reshaped as it adjusts to post-formation changes in wave and current patterns associated with deposition of the St. Bernard lobe of the Mississippi delta.
The principal causes of barrier island land loss are fre-quent intense storms, a relative rise in sea level, and a deficit in the sediment budget. The only factor that has a historical trend that coincides with the progressive increase in rates of land loss is the progressive reduction in sand supply associated with nearly simultaneous deepening of chan-nels dredged across the outer bars of the three tidal inlets maintained for deep-draft shipping. Neither rates of relative sea level rise nor storm parameters have long-term historical trends that match the increased rates of land loss since the mid 1800s. The historical rates of relative sea level rise in the northern Gulf of Mexico have been relatively constant
and storm frequencies and intensities occur in multidecadal cycles. However, the most recent land loss accelerations are likely related to the increased storm activity since 1995.
Considering the predicted trends for storms and sea level related to global warming, it is clear that the barrier islands will continue to lose land area at a rapid rate with-out a reversal in trend of at least one of the causal factors. The reduction in sand supply related to disruption of the alongshore sediment transport system is the only factor contributing to land loss that can be managed directly. This can be accomplished by placing dredged material so that the adjacent barrier island shores receive it for island nourish-ment and rebuilding.
INTRODUCTIONBarrier island chains in the northern Gulf of Mexico
extending from Mobile Bay, Alabama to Atchafalya Bay, Louisiana are disintegrating rapidly as a result of combined physical processes involving sediment availability, sediment transport, and sea level. The cumulative areas and rates of land loss from these ephemeral features are, to some extent, expected because present physical conditions are differ-ent from those that existed when the islands first formed. For example, during the past few thousand years sediment supply has diminished, rates of relative sea level rise have increased, and hurricanes and winter storms have been frequent events that generate extremely energetic waves capable of permanently removing sediment from the islands. These processes continuously act in concert, increasing rates of beach erosion and reducing the area of coastal land.
At greatest risk of further degradation are the barrier islands associated with the Mississippi delta that include the Chandeleur-Breton Island, Timbalier Island, and Isle Dernier chains in Louisiana. These chains of individual transgres-sive barrier island segments have progressively diminished in size while they migrated landward (McBride and others, 1992). In contrast are the Mississippi-Alabama (MS-AL) barrier islands (Fig. 1) that are not migrating landward as they decrease in size. Instead, the centroids of most of the islands are migrating westward in the direction of pre-dominant littoral drift through processes of updrift erosion and downdrift deposition (Richmond, 1962; Otvos, 1970). Although the sand spits and shoals of the MS-AL barriers are being transferred westward, the vegetated interior cores of the islands remain fixed in space. Rucker and Snowden (1989) measured the orientations of relict forested beach ridges on the MS barriers and concluded that the ridges and swales were formed by recurved spit deposition at the west-ern ends of the islands.
Open-File Report 2007-1161 2
COASTAL PROCESSES AND BARRIER ISLAND SETTINGS
Because the tidal range in the northern Gulf of Mexico is low (< 0.5 m), wind-driven waves and associated currents are the primary mechanisms for entraining and transport-ing nearshore sediments. During most of the year in the northern Gulf predominant winds are from the east, which drives alongshore currents to the west. The westerly flow of nearshore currents is greatly enhanced by the counter-clock-wise circulation of wind associated with tropical cyclones. As hurricanes or tropical storms approach the MS-AL coast, they track westward or northward, creating wind patterns that are initially directed from the east. The coupling of high velocity wind with the energetic ocean waves generates strong currents that can erode and transport large volumes of sand in short periods of time. The fate of eroded sand and its impact on the barrier islands depend primarily on the storm surge height and duration, and elevations of the adjacent land surface (Morton, 2002).
Wide tidal inlets separate the MS-AL barrier islands. The islands are the subaerial expression of a nearly continu-ous sand platform that is substantially shallower (< 4 m) than the surrounding waters of the Gulf of Mexico or Missis-sippi Sound (Curray and Moore, 1963). Sand that formerly maintained the islands was derived from the continental shelf (Shepard, 1960), erosion of barrier island segments to the east, including the ebb-delta shoals at the entrance to Mobile Bay, or from the sandy platform underlying the barriers (Otvos, 1979). Although the barriers are low and the intervening tidal inlets are wide, the islands and underlying shoal platform absorb some of the wave energy generated in the Gulf before it reaches the mainland. Exceptions are
the large, intense hurricanes, such as Camille and Katrina that completely overtop the barrier islands and generate high storm surge and waves in Mississippi Sound that directly impact the mainland shores.
GEOLOGIC HISTORY OF THE MISSISSIPPI-ALABAMA BARRIERS
The MS barrier islands were first thought to be remnant topographic highs of the upland surface that had been sepa-rated from the mainland by marine inundation as the Gulf Coast slowly subsided (McGee, 1891). This interpretation, made on the basis of soil types and bathymetry, was later shown to be incorrect as the onshore coastal plain stratigra-phy and sediment ages were more accurately determined and correlated with sediments beneath the barrier islands that were documented by cores. After reviewing prior studies, examining foraminiferal assemblages recovered from bar-rier island cores, and inferring salinities of the depositional environments, Otvos (1970,1979, 1981) concluded that the Mississippi barrier islands originated as submerged sand shoals that emerged from the Gulf of Mexico and aggraded as sea level rose, forming the barrier island chain. Hoyt (1970) challenged this genetic interpretation by pointing out that: (1) sediments beneath the barrier islands were not deposited in an open marine environment, thus indicating that the barriers had not formed from emergence of an open marine shoal, and (2) subsequent barrier migration likely would have modified the original subsurface facies patterns and destroyed the evidence of origin.
Oldest ages of the MS-AL barrier islands are not well constrained because the samples selected for radiocarbon
Cat Island West ShipIsland
Ship
Isla
nd P
ass
Dog
Keys
Pas
s
Horn
Isla
nd P
ass
Petit
Boi
s Pas
s
Mob
ile B
ay
Entra
nce
Mississippi Sound
EastShipIsland
Cam
ille C
ut
Horn Island Petit BoisIsland
Dauphin Island
Isle of Caprice
PelicanIsland
Figure 1. Locations of the Mississippi-Alabama barrier islands and associated tidal inlets. Deep draft shipping channels maintained by periodic dredging are shown as white lines.
Open-File Report 2007-1161 �
analyses were either shells that were extensively reworked and reincorporated into the barrier sediments or pieces of wood or peat contaminated with young carbon (Otvos, 1979). Considering the well documented historical move-ment of the barrier islands, it would be difficult to recover datable material that would provide an accurate age for the barrier chain that represented deposition at the time the islands first formed. Recent optical luminescence dates for partly buried mainland Holocene beach ridges and MS barrier accretion ridges indicate that the MS barrier island chain likely was initiated less than 4500 year ago (Otvos and Giardino, 2004). The relatively young ages of the MS barrier islands and their accretionary topography are consistent with origins influenced by falling water levels associated with the late phase of the hypothesized mid-Holocene highstand in sea level (Morton and others, 2000).
Dauphin Island is a compound barrier island consisting of two distinctly different components. The eastern fourth of the island features a core composed of Pleistocene sedi-ments that crop out near the Gulf shore (Otvos, 1979). The Pleistocene sediments are brown from iron staining indicat-ing oxidation from subaerial exposure and development of a paleosol. Holocene sand deposits surround and onlap the Pleistocene island core. The eastern part of the island is characterized by high elevations associated with modern active sand dunes that were supplied by sand from the shoals of Pelican and Sand Islands (Fig. 2) and have migrated onshore and partly buried a pine forest (Foxworth and oth-ers, 1962). Tree stumps that are exposed at low tide on the Gulf beaches are evidence of long-term beach erosion. The central and western three-fourths of the island consist of a narrow Holocene sand spit that is overwashed frequently by storm waters because its elevations generally are less than 1.5 m above sea level. Since 1847 this spit has grown progressively westward as longshore currents supplied sand derived from the large ebb tidal-delta shoals. The shoals formed at the entrance to Mobile Bay next to the Pleistocene remnant that controlled the inlet’s position.
Petit Bois Island in 1848 had an irregular shape with alternating narrow and wide segments, and sand spits and shoals on the extreme eastern and western ends. At that time the eastern end of Petit Bois was a remnant of Dauphin Island. Richmond (1962) presented a French exploration map of 1732 that showed a continuous barrier to the east that included what later became Petit Bois and Dauphin Islands. The same map also showed the recognizable shapes and orientations of Cat, Ship, and Horn Islands, so the general accuracy of the map is reliable. Otvos (1979) concluded that the elongated barrier spit of Dauphin Island was breached between 1740 and 1766, possibly as the result of the 1740 hurricane. The breach isolated Petit Bois Island from Dau-phin Island and formed the intervening tidal inlet known as Petit Bois Pass (Fig. 1). The relatively wide eastern part
of Petit Bois consists of vegetated ridges and intervening swales that in places contain ponds. This was the western-most wide island segment in 1848. Evidence of lateral accre-tion also is present on the central and western parts of the island but the relief of the topography is subdued except for the most western end where the ridges are better developed. The 1848 topographic map indicates that elevations of Petit Bois Island were probably less than 1.5 m across much of the island. Foxworth and others (1962) reported that in 1944 a maximum dune elevation of 6 m was at one point on the western end of the island and isolated dunes greater than 3 m high were located on the eastern end of the island. These elevations are confirmed by the USGS topographic maps that show dunes 3 m high on the Gulf and Sound shores of the western half of the island.
Horn Island in 1849 was an elongate feature with an irregular shape and sand spits and shoals on the extreme eastern end. The Gulf shoreline and island width followed a low-amplitude wave configuration with a wave length of about 5 km. Evidence of lateral accretion was prominent along the entire length of the island in the form of low (< 3.5 m) ridges and intervening water-filled swales. Gener-ally in a westward direction Horn Island increased in width and the angle of the ridges increased with respect to the Gulf shoreline, indicating terminal deposition along an inlet margin. Changes in continuity and orientation of the Gulf shoreline also generally coincided with significant changes in orientation of the ridge complex. Sand dune clusters within the island interior formed the highest elevations. The burial of pine trees by sand dunes on the eastern and western ends of Horn Island (Pessin and Burleigh, 1942) testifies to the formerly greater extent of the island core consisting of higher elevations and associated forest vegetation. However, Foxworth and others (1962) reported that in 1944 sand dunes on Horn Island with elevations greater than 6 m were limited in extent. USGS topographic maps show sand dune eleva-tions up to 4.5 m high on the Gulf and Sound shores of the eastern end of the island and beach ridge elevations of about 3 m. On the western part of the island elevations are slightly lower with broken dune elevations of 3 m or less.
In 1848 Ship Island had a highly irregular shape with alternating narrow and wide segments that reflected differ-ent stages of inlet migration and island growth. From east to west the island consisted of a low, narrow, mostly barren sand spit with a few isolated dunes that merged with a trian-gular-shaped wide segment consisting of low (1.5 m) sandy beach ridges covered by pine trees and intervening swales that were filled with marsh vegetation or water. The beach ridges were oriented at a high angle to the shore indicating lateral migration. A narrow ridge of sand dunes < 6 m high (Foxworth and others, 1962) formed a fringe along the north shore of the triangular segment. The central part of the island was a narrow sand spit connecting the triangular segment
Open-File Report 2007-1161 �
with a smaller oval-shaped segment that was offset to the south and formed the western part of the island. In the early 1960’s, before Hurricane Camille, a narrow low-tide bar separated the two main segments of Ship Island (Foxworth and others, 1962). The oval-shaped segment was gener-ally less than 1.5 m high except for the active dune fields that supported elevations up to 5 m (Foxworth and others, 1962). Fort Massachusetts, which was constructed on the oval shaped segment between 1859 and1866, was eventually threatened by storm damage and chronic beach erosion along the Mississippi Sound shore.
Cat Island is a compound barrier that consists of two east-west densely vegetated segments separated by a nar-row lagoon. The more northerly and primary island seg-ment consists of multiple beach ridges that are 1.5 to 3 m high covered by pine forests (Penfound and O’Neill, 1934), whereas the smaller, more southerly segment consists mostly of marsh with elevations < 1.5 m. The parallel east-west seg-ments are truncated by a sparsely vegetated sandy segment oriented northeast-southwest that is retreating westward. The contrasting orientations of island segments that give Cat Island its characteristic T shape record different stages of island growth and subsequent reworking influenced by construction of the St. Bernard lobe of the Mississippi delta (Waller and Malbrough, 1976; Otvos, 1979; Rucker and Snowden, 1989). The east-west beach-ridge segments record seaward advancement of Cat Island when open waters of the Gulf of Mexico extended substantially farther west. After progradation of the St. Bernard subdelta, wave refraction patterns were altered and open-ocean waves, now predomi-nately from the southeast, were focused on the eastern end of Cat Island causing erosion of the sandy beach ridges and construction of the north and south spits. The 1848 topo-graphic map shows that the northeast-southwest segment was short and wide on the north end. The east-facing shore tapered to a narrow elongate spit to the south. Penfound and O’Neill (1934) photographed and described a black peaty soil extending more than 30 m offshore and dead pine and oak forest remnants that were clear evidence of prolonged beach erosion along eastern Cat Island. Both Penfound and O’Neill (1934) and Pessin and Burleigh (1942) described sand dunes burying trees to depths of 10-12 m on Horn and Cat Islands, which suggests that island elevations along the shore before Hurricane Camille may have been higher than those measured today.
Except for Cat Island, which has a unique history of construction and evolution, the MS-AL barrier islands origi-nally exhibited a lateral succession of alternating narrow and wide segments. Relative rates of lateral inlet migration and attendant spit accretion can be inferred from the dimensions and shapes of the island segments. Rapid lateral accretion on the downdrift end of an island and attendant rapid inlet migration resulted in low, narrow, shore-parallel elongate
spits. The spit elevations and configurations are products of wind and wave reworking of sand. Rapid lateral spit accre-tion prevents wave and tidal current reworking at the spit terminus and minimizes wind reworking and the forma-tion of dunes. In contrast, slower lateral accretion and inlet migration resulted in high, wide, and shore-oblique spits that constructed wide barrier segments. The ridge and swale complexes that form the wide island cores probably were constructed at times of slow inlet migration. Slow lateral spit accretion promotes wave refraction at the spit terminus and construction of recurved segments that point landward. Slow accretion also allows more influence of eolian processes and the inland transport of sand from the beach, resulting in accumulation of dunes that aggrade with continued sand supply. The ridges have slightly higher elevations associated with the backbeach dunes.
HISTORICAL CHANGES IN THE MISSISSIPPI-ALABAMA BARRIER ISLANDS
Prior Geomorphic Studies
The MS-AL barrier islands are so dynamic and the magnitudes of their movement so great that changes in their positions and land areas have been topics of scientific inves-tigation since the 1960s (Shepard, 1960; Richmond, 1962). Several regional studies have dealt with changes in shoreline position of the offshore islands. For example, Waller and Malbrough (1976) compiled the perimeters that outlined the Mississippi islands using shorelines depicted on topo-graphic maps (T-sheets) published by the U.S. Coast Survey (1848/49-1917) and the U.S. Geological Survey (1940s and 1950s) and on aerial photographs available for 1973. They reported rates of shoreline change at transects around the islands that included shores facing both the Gulf of Mexico and Mississippi Sound. The transects also allowed them to measure the sequential magnitudes and rates of updrift island erosion and downdrift island accretion. Knowles and Rosati (1989) used some of the same maps and additional aerial photographs to document morphological and bathymetric changes around Ship Island between 1848 and 1986. Their bathymetric comparisons for successive periods revealed the alterations in Mississippi Sound related to dredging of the Gulfport Ship Channel. Byrnes and others (1991) digitized the shapes and positions of the Mississippi barrier islands and western Dauphin Island from the original geo-referenced T-sheets (1848/49-1966) and supplemented those data with shorelines obtained from aerial photographs taken in 1976 and 1986. They incorporated the digital files into a geo-graphic information system (GIS) that facilitated comparing
Open-File Report 2007-1161 �
the island shapes in a coordinate framework and calculat-ing rates of subaerial change. McBride and others (1995) extended the work of Byrnes and others (1991) by develop-ing a morphological classification of long-term responses that recognized eight types of island change including in-situ narrowing, lateral movement, and breakup.
Materials and Methods
For the present study several different approaches were used to document (1) long-term historical changes in bar-rier island shape, size, and position, and (2) the impacts of individual extreme storms on the barrier islands. The first approach involved GIS comparisons of shoreline perimeters obtained from various sources, whereas the second approach utilized immediate post-storm maps, aerial photographs, and compilation of parameters for each significant storm event. A list of data sets and their sources used in the study is provided in Appendix A. The aerial photographs examined for the 1980s and 1990s are available from the USGS EROS Data Center. Hydrographic charts provide reliable water depths for the dates of the bathymetric surveys, but the bar-rier island shorelines typically are transferred from another source and are not reliable for the same dates as the hydro-graphic data. For example, for Dauphin Island, the shoreline of 1847 appears on the 1899 hydrographic chart and the 1917 shoreline appears on the 1929 hydrographic chart.
Most of the island perimeters (shorelines) used to investigate long-term subaerial changes in the Mississippi barrier islands were acquired from the Mississippi Office of Geology (http://geology.deq.state.ms.us/coastal/Coastal-Data_GIS.htm). The electronic data sets included shorelines digitized from the historical topographic sheets (T-sheets) that were prepared by the U. S. Coast Survey (Appendix A) and shorelines surveyed in the 1990s using global position-ing system (GPS) equipment (Schmid, 2001a, 2001b, 2003). The 2005 perimeters (zero elevation contours) of the Missis-sippi barrier islands were derived from USGS/NASA lidar surveys conducted on September 14 and 16, two weeks after Hurricane Katrina.
Each of the shoreline positions has some uncertainty associated with the original data sources. In general, the older shoreline perimeters have the greatest positioning errors and the most recent shoreline perimeters have the least error. According to Shalowitz (1964), positioning errors for the late 1840s shorelines were within 10 m. Metadata for the shorelines provided by Schmid (2001a, 2001b, 2003) indi-cate that the GPS surveyed shorelines were within 5 m, and error analyses for the lidar surveys indicate that they were within about 1 m of their true position (Stockdon and others, 2002). Additional uncertainty is introduced by digitizing the pre-GPS shorelines. This error component cannot be adequately evaluated because it involves equipment limita-
tions and personnel skills. Prior assessments of digitizing errors using similar data sources and techniques have been found to be minimal (Anders and Byrnes, 1991; Crowell and others, 1991).
Land areas derived from the island surveys and the length of time (periods) between the surveys served as the basis for calculating magnitudes and rates of land change (Figs. 2-6, Table 1). Fractional years (months) were not available for most of the survey dates, so whole years were used to calculate the average rates of change. Fractional years are insignificant for long periods and are only criti-cal for short periods (< 10 years). Results of the historical comparisons are considered to be relatively accurate and adequate for establishing regional historical trends and rela-tive rates of change because the magnitudes of the changes in island shapes and positions greatly exceed the errors of the methods used to detect the changes.
The present study extends the GIS-based land area comparisons of Byrnes and others (1991) by incorporating shoreline perimeters between 1986 and 2005. Because the historical island perimeters are from different sources, care was taken to maintain consistency in definitions to eliminate apparent land area changes that were related only to differ-ences in land-water classification, especially with respect to marginal Soundside water bodies. For example, the appar-ent increase in land area for Horn Island between 1848 and 1917, illustrated by Byrnes and others (1991), is largely an artifact of excluding the areas covered by marginal water bodies in 1848 but including them as land areas in 1917.
Morphological Changes and Rates of Change
Each of the MS-AL barrier islands has had a unique evolution that has dramatically altered its shape, position, and vulnerability to storm impacts. The most significant changes are evident from sequential comparison of the island geometries (Figs. 2-6) and rates of areal change (Fig. 7 and Table 1).
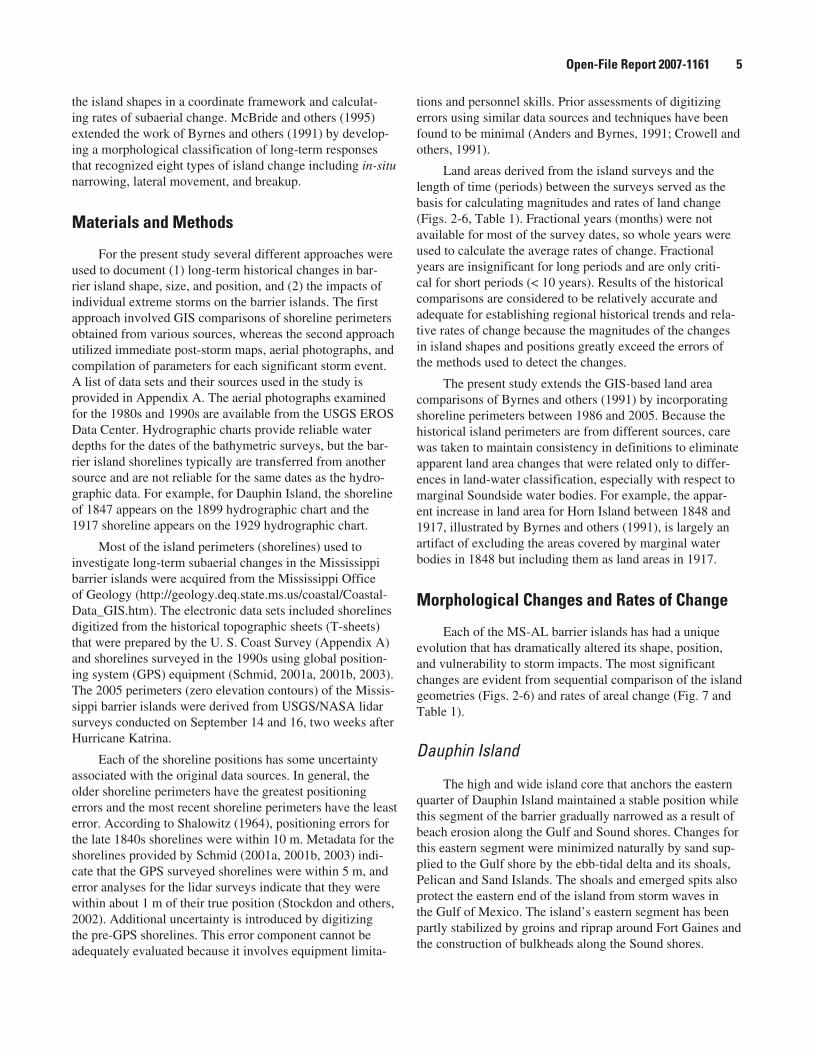
Dauphin Island
The high and wide island core that anchors the eastern quarter of Dauphin Island maintained a stable position while this segment of the barrier gradually narrowed as a result of beach erosion along the Gulf and Sound shores. Changes for this eastern segment were minimized naturally by sand sup-plied to the Gulf shore by the ebb-tidal delta and its shoals, Pelican and Sand Islands. The shoals and emerged spits also protect the eastern end of the island from storm waves in the Gulf of Mexico. The island’s eastern segment has been partly stabilized by groins and riprap around Fort Gaines and the construction of bulkheads along the Sound shores.
Open-File Report 2007-1161 6
Before Petit Bois Island separated and migrated west-ward in the 18th century, Dauphin Island was the largest island of the MS-AL island chain. Those events significantly reduced the size of Dauphin Island and provided space for its subsequent growth. In contrast to the relatively stable eastern end, the narrow western three-fourths of the island has changed dramatically as a result of two independent processes. The island has grown westward at its western ter-minus as a result of lateral spit accretion and inlet migration (Fig. 2). In fact the downdrift end of the island has grown so far westward that it overlaps the former eastern end of Petit Bois Island in the mid 1800s (Fig. 3). Also the narrow island segment has migrated landward primarily as a result of Gulf beach erosion and storm overwash fan deposition. Waves and currents generated in the Sound subsequently rework the fans and much of the washover sand is incorporated into the sandy shoal platform and molded into large subaqueous bed-forms. The topographic map of 1853/54 shows that Dauphin Island was breached in two places by wide inlets opened as a result of hurricanes in the northern Gulf in 1851 and 1852 that caused abnormally high tides at Mobile (U.S. Army Corps of Engineers, 1965a). The breaches were not open at the time of the 1847 topographic survey.
Areal changes for Dauphin Island during the early 1900s are not well defined because inclusion of the 1917 shoreline perimeter would have greatly biased the land change trend as a result of the submerged conditions mapped
immediately after the 1916 hurricane. Unlike the other barriers, the area of Dauphin Island increased between 1847 and 1958 at an average rate of 1.8 ha/yr as a result of spit accretion on the western end of the island (Fig. 2, Table 2). But after 1958 the island entered a net erosional phase that has persisted and most recently accelerated. Rates of land loss between 1958 and 1996 averaged 6.1 ha/yr and between 1996 and 2006 averaged 12.9 ha/yr. The most recent high rates of loss are somewhat biased because Hurricane Katrina formed a breach approximately 2 km wide, removing a 40 ha segment of the barrier.
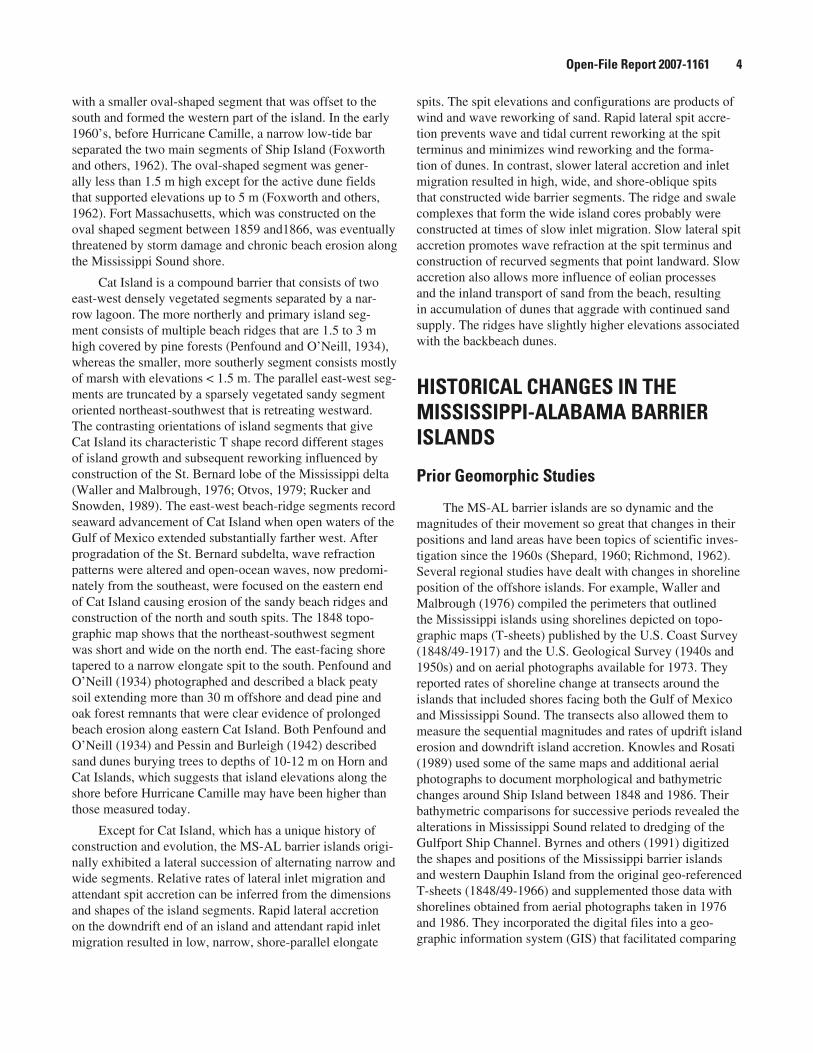
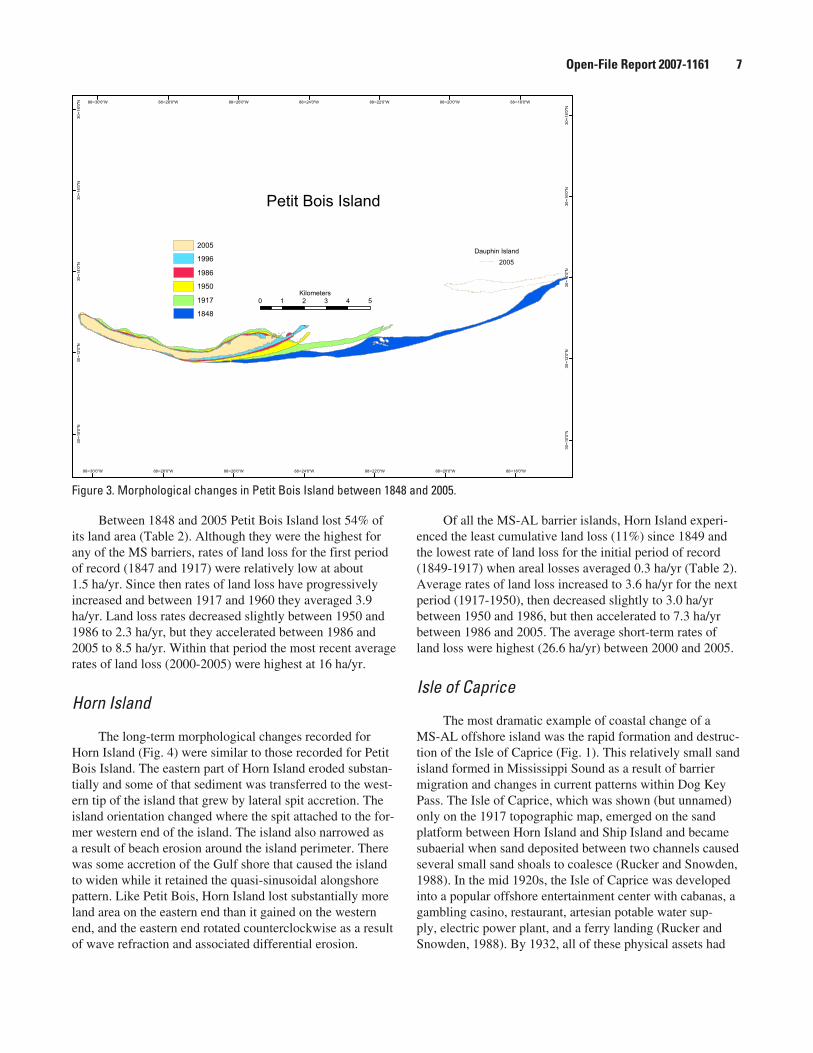
Petit Bois Island
The barrier island that underwent the most rapid and radical historical changes was Petit Bois. This is illustrated by monitoring the wide triangular segment of the island, which was located on its extreme western end in 1848 (Fig. 3). By 1917 the eastern part of the island had eroded and retreated so much that the wide triangular segment was located in the center of the island. Subsequent erosion of the eastern spit and extension of the western spit caused the stable wide segment to form the eastern end of the island by 1950. Since then, Petit Bois has continued to narrow and the eastern shore has rotated counterclockwise as a result of wave refraction and associated differential erosion and overwash along the eastern Gulf beach.
88∞18'0"W
88∞18'0"W
88∞15'0"W
88∞15'0"W
88∞12'0"W
88∞12'0"W
88∞9'0"W
88∞9'0"W
88∞6'0"W
88∞6'0"W
30∞12'0"N
30∞12'0"N
30∞15'0"N
30∞15'0"N
30∞18'0"N
30∞18'0"N
2006
1996
1958
1847
0 4 82Kilometers
Dauphin Island
Pelican
Island
SandIsland
Figure 2. Morphological changes in Dauphin Island between 1847 and 2006.
Open-File Report 2007-1161 7
Between 1848 and 2005 Petit Bois Island lost 54% of its land area (Table 2). Although they were the highest for any of the MS barriers, rates of land loss for the first period of record (1847 and 1917) were relatively low at about 1.5 ha/yr. Since then rates of land loss have progressively increased and between 1917 and 1960 they averaged 3.9 ha/yr. Land loss rates decreased slightly between 1950 and 1986 to 2.3 ha/yr, but they accelerated between 1986 and 2005 to 8.5 ha/yr. Within that period the most recent average rates of land loss (2000-2005) were highest at 16 ha/yr.
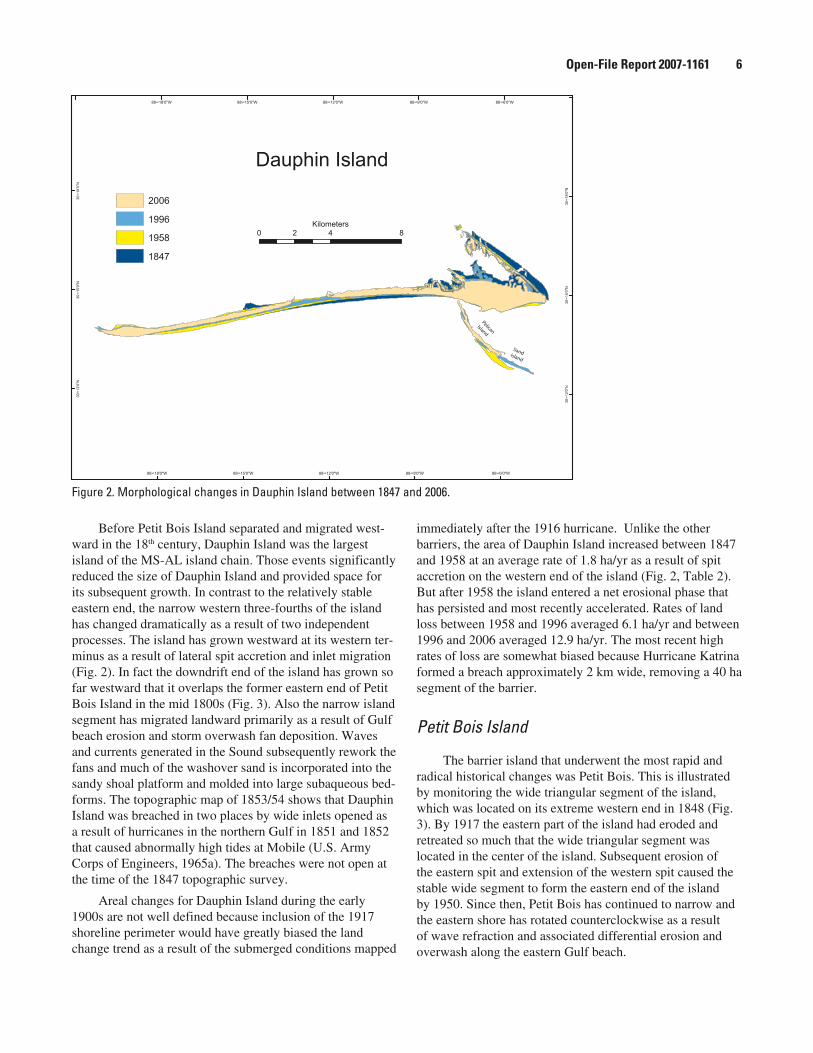
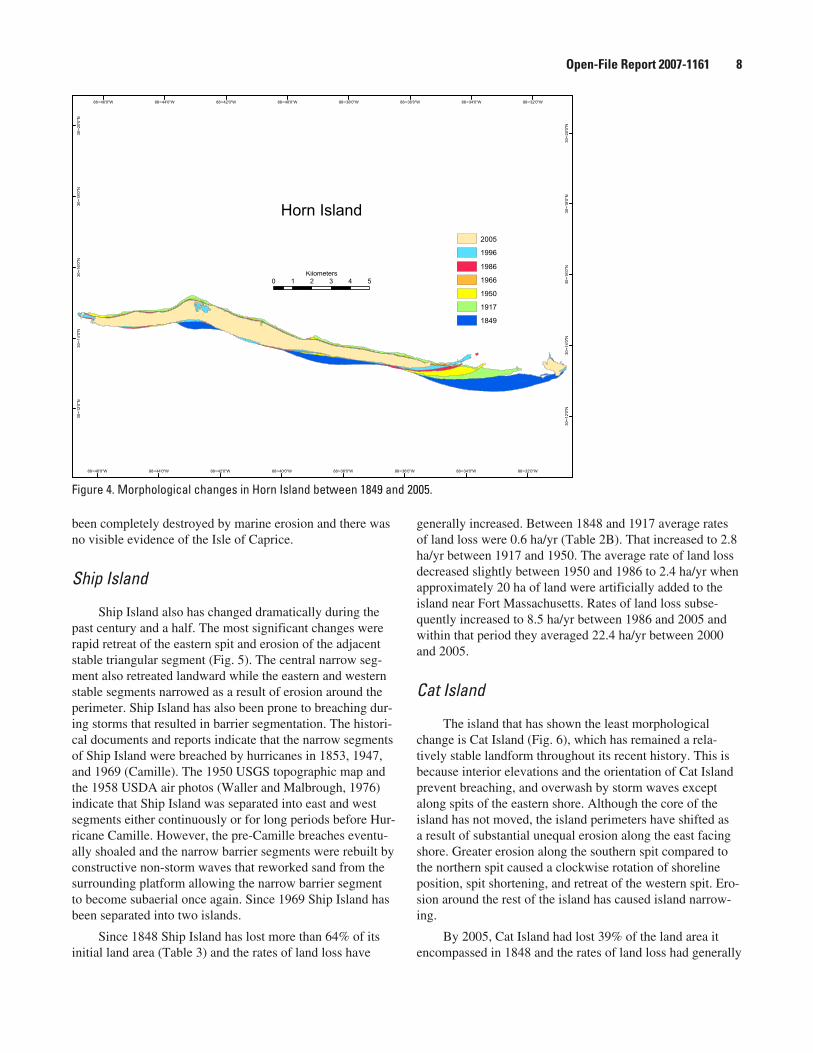
Horn Island
The long-term morphological changes recorded for Horn Island (Fig. 4) were similar to those recorded for Petit Bois Island. The eastern part of Horn Island eroded substan-tially and some of that sediment was transferred to the west-ern tip of the island that grew by lateral spit accretion. The island orientation changed where the spit attached to the for-mer western end of the island. The island also narrowed as a result of beach erosion around the island perimeter. There was some accretion of the Gulf shore that caused the island to widen while it retained the quasi-sinusoidal alongshore pattern. Like Petit Bois, Horn Island lost substantially more land area on the eastern end than it gained on the western end, and the eastern end rotated counterclockwise as a result of wave refraction and associated differential erosion.
Of all the MS-AL barrier islands, Horn Island experi-enced the least cumulative land loss (11%) since 1849 and the lowest rate of land loss for the initial period of record (1849-1917) when areal losses averaged 0.3 ha/yr (Table 2). Average rates of land loss increased to 3.6 ha/yr for the next period (1917-1950), then decreased slightly to 3.0 ha/yr between 1950 and 1986, but then accelerated to 7.3 ha/yr between 1986 and 2005. The average short-term rates of land loss were highest (26.6 ha/yr) between 2000 and 2005.
Isle of Caprice
The most dramatic example of coastal change of a MS-AL offshore island was the rapid formation and destruc-tion of the Isle of Caprice (Fig. 1). This relatively small sand island formed in Mississippi Sound as a result of barrier migration and changes in current patterns within Dog Key Pass. The Isle of Caprice, which was shown (but unnamed) only on the 1917 topographic map, emerged on the sand platform between Horn Island and Ship Island and became subaerial when sand deposited between two channels caused several small sand shoals to coalesce (Rucker and Snowden, 1988). In the mid 1920s, the Isle of Caprice was developed into a popular offshore entertainment center with cabanas, a gambling casino, restaurant, artesian potable water sup-ply, electric power plant, and a ferry landing (Rucker and Snowden, 1988). By 1932, all of these physical assets had
88∞30'0"W
88∞30'0"W
88∞28'0"W
88∞28'0"W
88∞26'0"W
88∞26'0"W
88∞24'0"W
88∞24'0"W
88∞22'0"W
88∞22'0"W
88∞20'0"W
88∞20'0"W
88∞18'0"W
88∞18'0"W
30∞10'0"N
30∞10'0"N
30∞12'0"N
30∞12'0"N
30∞14'0"N
30∞14'0"N
30∞16'0"N
30∞16'0"N
30∞18'0"N
30∞18'0"N
0 1 2 3 4 5Kilometers
Petit Bois Island
1986
1950
1996
2005
1917
1848
Dauphin Island
2005
Figure 3. Morphological changes in Petit Bois Island between 1848 and 2005.
Open-File Report 2007-1161 �
been completely destroyed by marine erosion and there was no visible evidence of the Isle of Caprice.
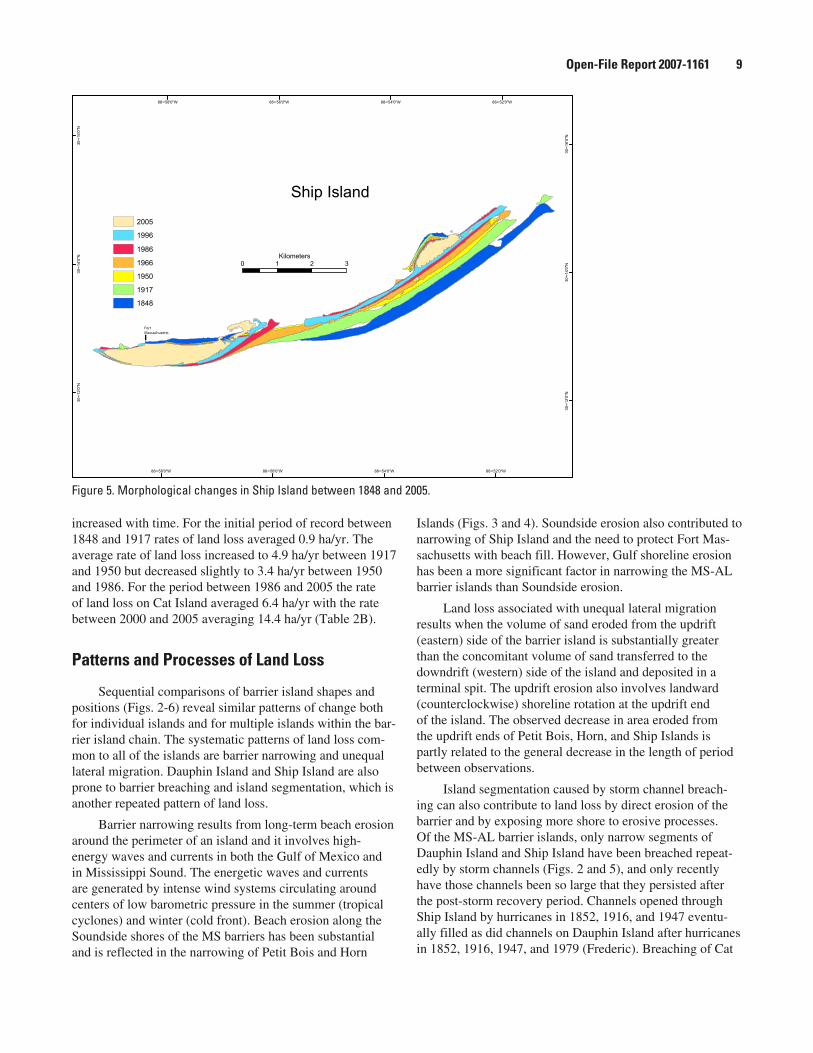
Ship Island
Ship Island also has changed dramatically during the past century and a half. The most significant changes were rapid retreat of the eastern spit and erosion of the adjacent stable triangular segment (Fig. 5). The central narrow seg-ment also retreated landward while the eastern and western stable segments narrowed as a result of erosion around the perimeter. Ship Island has also been prone to breaching dur-ing storms that resulted in barrier segmentation. The histori-cal documents and reports indicate that the narrow segments of Ship Island were breached by hurricanes in 1853, 1947, and 1969 (Camille). The 1950 USGS topographic map and the 1958 USDA air photos (Waller and Malbrough, 1976) indicate that Ship Island was separated into east and west segments either continuously or for long periods before Hur-ricane Camille. However, the pre-Camille breaches eventu-ally shoaled and the narrow barrier segments were rebuilt by constructive non-storm waves that reworked sand from the surrounding platform allowing the narrow barrier segment to become subaerial once again. Since 1969 Ship Island has been separated into two islands.
Since 1848 Ship Island has lost more than 64% of its initial land area (Table 3) and the rates of land loss have
generally increased. Between 1848 and 1917 average rates of land loss were 0.6 ha/yr (Table 2B). That increased to 2.8 ha/yr between 1917 and 1950. The average rate of land loss decreased slightly between 1950 and 1986 to 2.4 ha/yr when approximately 20 ha of land were artificially added to the island near Fort Massachusetts. Rates of land loss subse-quently increased to 8.5 ha/yr between 1986 and 2005 and within that period they averaged 22.4 ha/yr between 2000 and 2005.
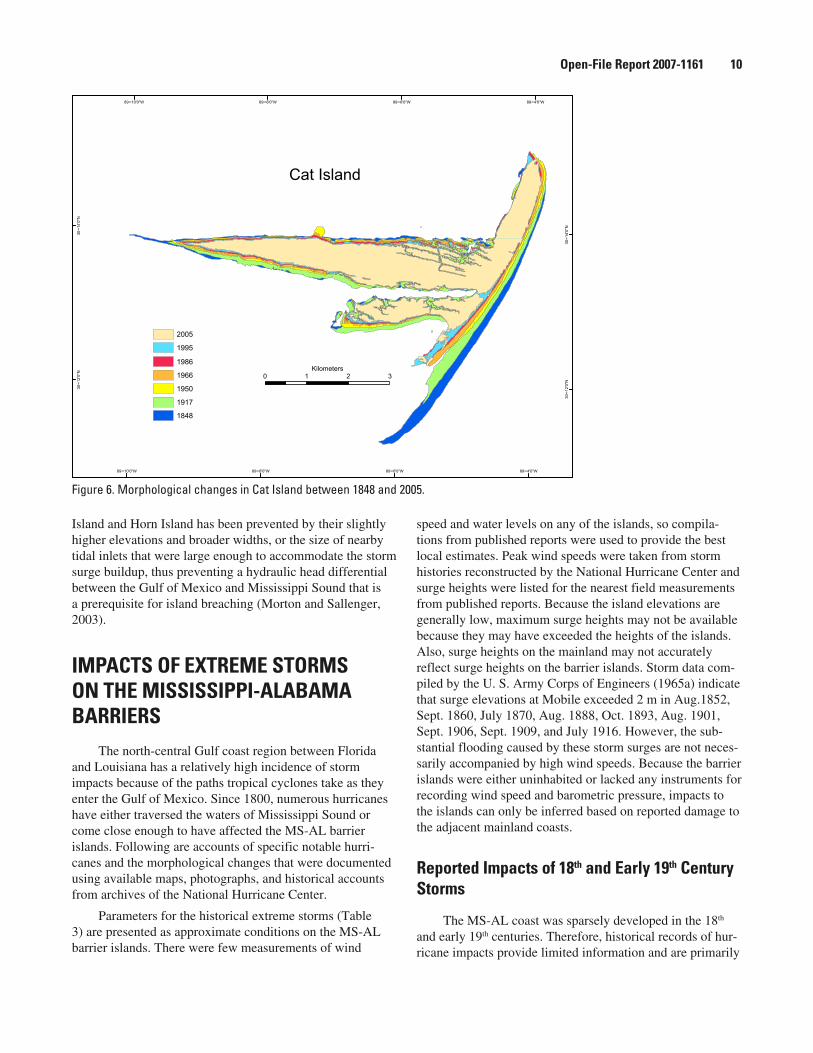
Cat Island
The island that has shown the least morphological change is Cat Island (Fig. 6), which has remained a rela-tively stable landform throughout its recent history. This is because interior elevations and the orientation of Cat Island prevent breaching, and overwash by storm waves except along spits of the eastern shore. Although the core of the island has not moved, the island perimeters have shifted as a result of substantial unequal erosion along the east facing shore. Greater erosion along the southern spit compared to the northern spit caused a clockwise rotation of shoreline position, spit shortening, and retreat of the western spit. Ero-sion around the rest of the island has caused island narrow-ing.
By 2005, Cat Island had lost 39% of the land area it encompassed in 1848 and the rates of land loss had generally
0 1 2 3 4 5Kilometers
88∞46'0"W
88∞46'0"W
88∞44'0"W
88∞44'0"W
88∞42'0"W
88∞42'0"W
88∞40'0"W
88∞40'0"W
88∞38'0"W
88∞38'0"W
88∞36'0"W
88∞36'0"W
88∞34'0"W
88∞34'0"W
88∞32'0"W
88∞32'0"W
30∞12'0"N
30∞12'0"N
30∞14'0"N
30∞14'0"N
30∞16'0"N
30∞16'0"N
30∞18'0"N
30∞18'0"N
30∞20'0"N
30∞20'0"N
1986
1966
1950
1917
1849
1996
2005
Horn Island
Figure 4. Morphological changes in Horn Island between 1849 and 2005.
Open-File Report 2007-1161 �
increased with time. For the initial period of record between 1848 and 1917 rates of land loss averaged 0.9 ha/yr. The average rate of land loss increased to 4.9 ha/yr between 1917 and 1950 but decreased slightly to 3.4 ha/yr between 1950 and 1986. For the period between 1986 and 2005 the rate of land loss on Cat Island averaged 6.4 ha/yr with the rate between 2000 and 2005 averaging 14.4 ha/yr (Table 2B).
Patterns and Processes of Land Loss
Sequential comparisons of barrier island shapes and positions (Figs. 2-6) reveal similar patterns of change both for individual islands and for multiple islands within the bar-rier island chain. The systematic patterns of land loss com-mon to all of the islands are barrier narrowing and unequal lateral migration. Dauphin Island and Ship Island are also prone to barrier breaching and island segmentation, which is another repeated pattern of land loss.
Barrier narrowing results from long-term beach erosion around the perimeter of an island and it involves high-energy waves and currents in both the Gulf of Mexico and in Mississippi Sound. The energetic waves and currents are generated by intense wind systems circulating around centers of low barometric pressure in the summer (tropical cyclones) and winter (cold front). Beach erosion along the Soundside shores of the MS barriers has been substantial and is reflected in the narrowing of Petit Bois and Horn
Islands (Figs. 3 and 4). Soundside erosion also contributed to narrowing of Ship Island and the need to protect Fort Mas-sachusetts with beach fill. However, Gulf shoreline erosion has been a more significant factor in narrowing the MS-AL barrier islands than Soundside erosion.
Land loss associated with unequal lateral migration results when the volume of sand eroded from the updrift (eastern) side of the barrier island is substantially greater than the concomitant volume of sand transferred to the downdrift (western) side of the island and deposited in a terminal spit. The updrift erosion also involves landward (counterclockwise) shoreline rotation at the updrift end of the island. The observed decrease in area eroded from the updrift ends of Petit Bois, Horn, and Ship Islands is partly related to the general decrease in the length of period between observations.
Island segmentation caused by storm channel breach-ing can also contribute to land loss by direct erosion of the barrier and by exposing more shore to erosive processes. Of the MS-AL barrier islands, only narrow segments of Dauphin Island and Ship Island have been breached repeat-edly by storm channels (Figs. 2 and 5), and only recently have those channels been so large that they persisted after the post-storm recovery period. Channels opened through Ship Island by hurricanes in 1852, 1916, and 1947 eventu-ally filled as did channels on Dauphin Island after hurricanes in 1852, 1916, 1947, and 1979 (Frederic). Breaching of Cat
88∞58'0"W
88∞58'0"W
88∞56'0"W
88∞56'0"W
88∞54'0"W
88∞54'0"W
88∞52'0"W
88∞52'0"W
30∞12'0"N
30∞12'0"N
30∞14'0"N
30∞14'0"N
30∞16'0"N
30∞16'0"N
0 1 2 3Kilometers
Ship Island
1986
1966
1950
1917
1848
1996
2005
FortMassachusetts
Figure 5. Morphological changes in Ship Island between 1848 and 2005.
Open-File Report 2007-1161 10
Island and Horn Island has been prevented by their slightly higher elevations and broader widths, or the size of nearby tidal inlets that were large enough to accommodate the storm surge buildup, thus preventing a hydraulic head differential between the Gulf of Mexico and Mississippi Sound that is a prerequisite for island breaching (Morton and Sallenger, 2003).
IMPACTS OF EXTREME STORMS ON THE MISSISSIPPI-ALABAMA BARRIERS
The north-central Gulf coast region between Florida and Louisiana has a relatively high incidence of storm impacts because of the paths tropical cyclones take as they enter the Gulf of Mexico. Since 1800, numerous hurricanes have either traversed the waters of Mississippi Sound or come close enough to have affected the MS-AL barrier islands. Following are accounts of specific notable hurri-canes and the morphological changes that were documented using available maps, photographs, and historical accounts from archives of the National Hurricane Center.
Parameters for the historical extreme storms (Table 3) are presented as approximate conditions on the MS-AL barrier islands. There were few measurements of wind
speed and water levels on any of the islands, so compila-tions from published reports were used to provide the best local estimates. Peak wind speeds were taken from storm histories reconstructed by the National Hurricane Center and surge heights were listed for the nearest field measurements from published reports. Because the island elevations are generally low, maximum surge heights may not be available because they may have exceeded the heights of the islands. Also, surge heights on the mainland may not accurately reflect surge heights on the barrier islands. Storm data com-piled by the U. S. Army Corps of Engineers (1965a) indicate that surge elevations at Mobile exceeded 2 m in Aug.1852, Sept. 1860, July 1870, Aug. 1888, Oct. 1893, Aug. 1901, Sept. 1906, Sept. 1909, and July 1916. However, the sub-stantial flooding caused by these storm surges are not neces-sarily accompanied by high wind speeds. Because the barrier islands were either uninhabited or lacked any instruments for recording wind speed and barometric pressure, impacts to the islands can only be inferred based on reported damage to the adjacent mainland coasts.
Reported Impacts of 1�th and Early 1�th Century Storms
The MS-AL coast was sparsely developed in the 18th and early 19th centuries. Therefore, historical records of hur-ricane impacts provide limited information and are primarily
89∞10'0"W
89∞10'0"W
89∞8'0"W
89∞8'0"W
89∞6'0"W
89∞6'0"W
89∞4'0"W
89∞4'0"W
30∞12'0"N
30∞12'0"N
30∞14'0"N
30∞14'0"N
0 1 2 3Kilometers
Cat Island
1986
1966
1950
1917
1848
1995
2005
Figure 6. Morphological changes in Cat Island between 1848 and 2005.
Open-File Report 2007-1161 11
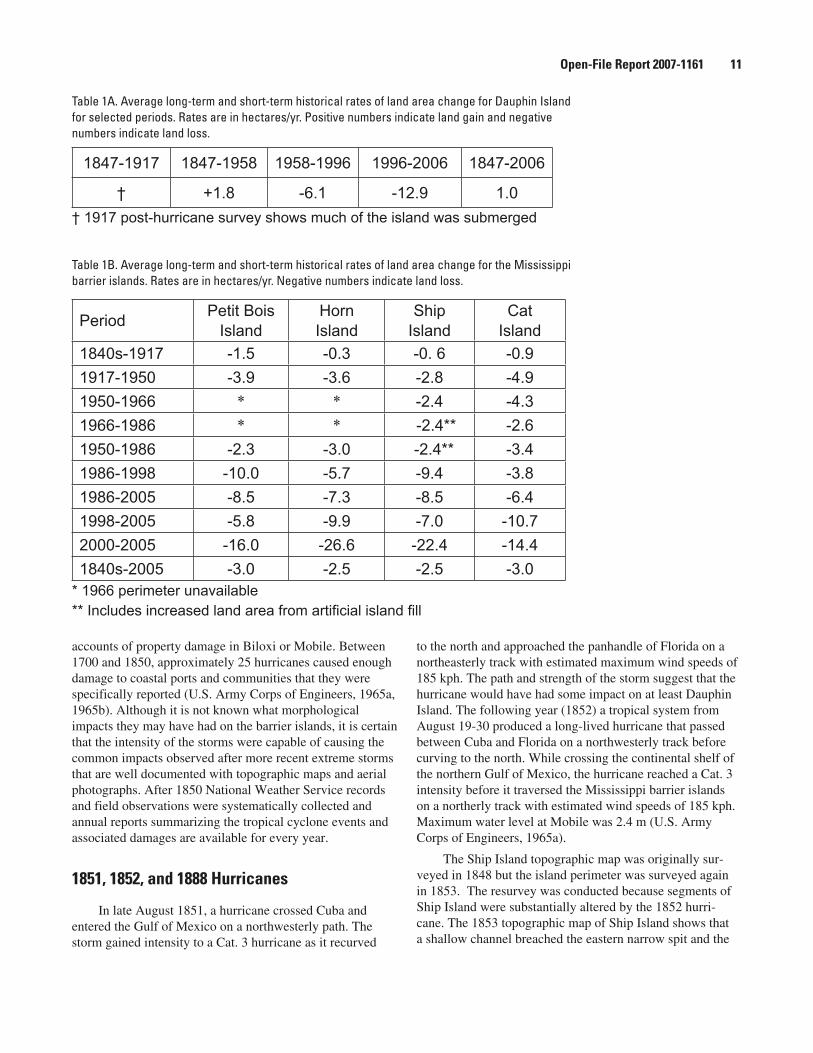
Table 1A. Average long-term and short-term historical rates of land area change for Dauphin Island for selected periods. Rates are in hectares/yr. Positive numbers indicate land gain and negative numbers indicate land loss.
1847-1917 1847-1958 1958-1996 1996-2006 1847-2006
† +1.8 -6.1 -12.9 1.0
† 1917 post-hurricane survey shows much of the island was submerged
Table 1B. Average long-term and short-term historical rates of land area change for the Mississippi barrier islands. Rates are in hectares/yr. Negative numbers indicate land loss.
PeriodPetit Bois
IslandHornIsland
ShipIsland
CatIsland
1840s-1917 -1.5 -0.3 -0. 6 -0.9
1917-1950 -3.9 -3.6 -2.8 -4.9
1950-1966 * * -2.4 -4.3
1966-1986 * * -2.4** -2.6
1950-1986 -2.3 -3.0 -2.4** -3.4
1986-1998 -10.0 -5.7 -9.4 -3.8
1986-2005 -8.5 -7.3 -8.5 -6.4
1998-2005 -5.8 -9.9 -7.0 -10.7
2000-2005 -16.0 -26.6 -22.4 -14.4
1840s-2005 -3.0 -2.5 -2.5 -3.0* 1966 perimeter unavailable** Includes increased land area from artificial island fill
accounts of property damage in Biloxi or Mobile. Between 1700 and 1850, approximately 25 hurricanes caused enough damage to coastal ports and communities that they were specifically reported (U.S. Army Corps of Engineers, 1965a, 1965b). Although it is not known what morphological impacts they may have had on the barrier islands, it is certain that the intensity of the storms were capable of causing the common impacts observed after more recent extreme storms that are well documented with topographic maps and aerial photographs. After 1850 National Weather Service records and field observations were systematically collected and annual reports summarizing the tropical cyclone events and associated damages are available for every year.
1��1, 1��2, and 1��� Hurricanes
In late August 1851, a hurricane crossed Cuba and entered the Gulf of Mexico on a northwesterly path. The storm gained intensity to a Cat. 3 hurricane as it recurved
to the north and approached the panhandle of Florida on a northeasterly track with estimated maximum wind speeds of 185 kph. The path and strength of the storm suggest that the hurricane would have had some impact on at least Dauphin Island. The following year (1852) a tropical system from August 19-30 produced a long-lived hurricane that passed between Cuba and Florida on a northwesterly track before curving to the north. While crossing the continental shelf of the northern Gulf of Mexico, the hurricane reached a Cat. 3 intensity before it traversed the Mississippi barrier islands on a northerly track with estimated wind speeds of 185 kph. Maximum water level at Mobile was 2.4 m (U.S. Army Corps of Engineers, 1965a).
The Ship Island topographic map was originally sur-veyed in 1848 but the island perimeter was surveyed again in 1853. The resurvey was conducted because segments of Ship Island were substantially altered by the 1852 hurri-cane. The 1853 topographic map of Ship Island shows that a shallow channel breached the eastern narrow spit and the
Open-File Report 2007-1161 12
0
2
4
6
8
10
12
14
16
18
1840 1860 1880 1900 1920 1940 1960 1980 2000 2020
Land
Are
a (s
q km
)
Horn Island
Cat Island
Petit Bois Island
Ship Island
1916
1947
Elen
a
Cam
ille
Katri
naIv
an
Geor
ges
1852
1893
Dauphin Island
higher storm - lower storm - higher storm
increased depths of outer bar channels
Year
Figure 7. Historical land loss trends for the Mississippi-Alabama barrier islands relative to the timing of major hurricanes and human activities that impacted the islands.
narrow central island segment was reduced in width and also was breached by two narrow channels. Civil War documents reported that the 1852 hurricane also cut a channel more than 3.6 m deep across the eastern spit of Petit Bois Island (http://nautarch.tamu.edu/projects/denbigh/CoastSurvey.htm). Presumably the resurvey of Dauphin Island in 1854 after its initial survey in 1847 was a consequence of impacts of the 1852 hurricane.
In mid August, 1888, a major hurricane crossed the southern tip of Florida, tracked westward through the central Gulf of Mexico, and recurved northward, making landfall on the southern shore of the Mississippi delta on August
19. During its westward trek, the hurricane passed south of the MS-AL barrier chain, producing abnormally high water levels at Mobile and eroding about 800 m (one-half mile) of the eastern end of Horn Island (U.S. Army Corps of Engi-neers, 1904).
1�16 Hurricane
Cat. 3 hurricanes in July and October 1916 greatly affected the eastern part of the MS-AL barrier island chain. Because of its northerly track and location relative to the
Table 2. Percent changes in land area of the Mississippi-Alabama barrier islands between the late 1840s and 2005. Areas are in hectares.
Island 1840s area 2005 area % Loss
Dauphin 1429 1266 11
Horn 1616 1230 24
Cat 1192 724 39
Petit Bois 836 366 56
Ship 604 216 64
Open-File Report 2007-1161 1�
Table 3A. Recent hurricane history in the northern Gulf of Mexico and significant parameters for evaluating storm impacts. Listed parameters pertain to Dauphin Island. Data sources are shown as footnotes.
Year Stormname
Intensitycategory
Eyewallproximity
Max. water level
(m)
Max.windspeed
(kph)
ShelfDuration
(hrs)
1916 unnamed1 3 30 km west 2.3 195 36
1969 Camille2 5 90 km west 2.8 118 48
1979 Frederic3 3 crossed island 2.4-3.9 230 60
1985 Elena4 3 10 km sw 2.1 212 103
1997 Danny5 1 crossed island 1.5 163 36
1998 Georges6 4-2 50 km west 1.5-2.4 128 80
2004 Ivan7 4-3 40 km east 1.8-2.7 160 54
2005 Katrina8 5-3 150 km west 2.9-3.3 133 781Frankenfield (1916), U.S. Army Corps of Engineers (1965a)2U.S. Army Corps of Engineers (1970), Simpson and others (1970)3Hebert (1980), Parker and others (1981) 4Case (1986)5U.S. Army Corps of Engineers (1997), Rappaport (1999)6Pasch and others (2001), U.S. Army Corps of Engineers (1998)7Stewart (2005), U.S. Army Corps of Engineers (2004)8Knabb and others (2005), URS Group, Inc. (2006a)
Table 3B. Recent hurricane history in the northern Gulf of Mexico and significant parameters for evaluating storm impacts. Listed parameters pertain to the Mississippi barriers. Data sources are shown as footnotes.
Year Stormname
Intensitycategory
Eyewallproximity
Max. water level
(m)
Max.windspeed
(kph)
ShelfDuration
(hrs)
1916 unnamed1 3 crossed Horn Is. 2.3† 195 36
1947 unnamed2 1 passed south 3.6-4.2* 150 30
1960 Ethel3 5 crossed Ship Is. 1-1.5 260 24
1969 Camille4 5 10-40 km west 4.5-4.9+ 305 48
1985 Elena5 3 crossed Horn Is. 1-2 185 103
1998 Georges6 4-2 crossed Ship Is. 1.5-3 198 80
2004 Ivan7 4-3 70-130 km east 1.5†† 120 54
2005 Katrina8 5-3 50-130 km west 5.6-7.6** 150-185 781Frankenfield (1916)2Sumner (1947)3Dunn (1961)4U.S. Army Corps of Engineers (1970), Simpson and others (1970)5Case (1986)6Pasch and others (2001), U.S. Army Corps of Engineers (1998)7Stewart (2005), U.S. Army Corps of Engineers (2004)8Knabb and others (2005), URS Group, Inc. (2006b)†At Dauphin Island *At Biloxi and Chandeleur Light +At Ship Is. and Cat Is. ††At Ship Is. **Miss. mainland
Open-File Report 2007-1161 1�
barrier islands, the July storm caused the most coastal change. The July hurricane, which crossed Horn Island and made landfall along the Mississippi coast, produced peak wind speeds of 195 kph near the storm center and a surge of 2.3 m on Dauphin Island. The October storm made landfall near Pensacola, but it passed close enough to Dauphin Island that it probably had some cumulative effect considering the damage likely caused by the July storm.
Degradation of the barrier island chain was so severe from cumulative impacts of both storms that the U. S. Coast Survey remapped the topography of the barrier islands. The 1917 post-storm map of Dauphin Island shows that the island was breached in several places. One breach about 8.5 km wide was located where the island narrows at Graveline Bay about 10 km from the east end of the island and another breach was about 10 km farther west. The western third of the island was unmapped, apparently because it was mostly submerged. The 1917 Dauphin Island map also shows that where the island was not breached, the surface was severely eroded and overwashed. The 1917 map of Ship Island shows a breach and submerged segment about 735 m wide at the eastern end of the island. By 1917 the eastern half of Petit Bois Island had been destroyed. How much of that destruc-tion was caused by the 1916 hurricanes is unclear. Compar-ing the 1848 and 1917 maps of Cat Island indicates that the 1916 hurricanes caused no significant topographic changes.
1��7 and 1��� Hurricanes
In September 1947 a major hurricane that formed in the Atlantic Ocean reached Cat. 5 intensity before it crossed peninsular Florida and rapidly weakened to a Cat. 1 storm while entering the Gulf of Mexico. As it rapidly crossed the continental shelf, the storm passed south of the MS-AL barrier chain, putting them in the right front quadrant where they experienced peak wind speeds of about 150 kph. The wind speed and low barometric pressure caused a storm surge ranging from 3.6 m along the Mississippi mainland shore to 4.2 m at the Chandeleur Island Light (Sumner, 1947). Although impacts to the MS-AL barriers are not well documented, the storm breached Ship Island, separating it into east and west segments (Foxworth and others, 1962).
The next year a Cat. 1 hurricane that formed in the southern Gulf of Mexico weakened to a tropical storm as it crossed eastern Louisiana on a northeasterly path. The storm’s trajectory again put the western MS-AL barrier islands in the right front quadrant causing tides of about 1.8 m along the Mississippi coast (Sumner, 1948). The wind speeds and surge of the 1948 hurricane over the western MS barriers were likely sufficient enough to amplify the impacts caused by the 1947 hurricane and to keep open the Ship Island breach formed in 1947. That breach persisted at least through 1950 but was closed by 1958 (Waller and Mal-
brough, 1976). Aerial photographs of Dauphin Island taken in 1950 show a wide breach that was likely opened by the September 1947 or September 1948 hurricanes (Hardin and others, 1976; Canis and others, 1985).
Hurricane Ethel (1�60)
Early on September 14, 1960, Tropical Storm Ethel formed in the central Gulf of Mexico and rapidly intensified to hurricane strength. Ethel was a compact storm that moved rapidly northward across the continental shelf, reaching Cat. 5 intensity and developing peak winds of about 260 kph as it crossed the MS barriers (Dunn, 1961). Ethel also rapidly weakened before making landfall near Biloxi during the afternoon of September 15. The storm’s rapid forward motion and limited time crossing the continental shelf actu-ally prevented development of a high storm surge, which was reported to be only about 1.5 m along the Mississippi coast (U.S. Army Corps of Engineers, 1965b). Despite the low storm surge, Ethel caused substantial erosion of the MS barrier islands, including removal of nearly 3 km of the east-ern end of Horn Island (Foxworth and others, 1962). Ship Island was divided into east and west segments in the early 1960s (Foxworth and others, 1962), possibly as a result of Ethel eroding the low narrow neck that had aggraded above sea level by 1958.
Hurricane Camille (1�6�)
Hurricane Camille formed in the northern Caribbean Sea in mid August 1969. As the storm crossed the Gulf of Mexico, it intensified rapidly and became a Cat. 5 hurricane while following a northerly path. The center of the storm passed just west of Cat Island, placing the MS-AL barrier chain in the storm’s right front quadrant where maximum wind speeds and storm surges were generated. Anemometers near the coast were destroyed but reconstructed maximum wind speeds were estimated to be about 300 kph. For being such an intense storm, Camille had a relatively small radius of maximum winds that extended only to western Dauphin Island, about 100 km from the storm center. The compact wind field was reflected in the maximum water levels measured on the barrier islands that decreased eastward from 4.9 m on Cat Island, to 4.5 m on Ship Island, to 2.8 m on eastern Dauphin Island (U.S. Army Corps of Engineers, 1970). Wave parameters measured at an offshore platform in relatively deep water (100 m) showed that Camille generated average significant wave heights and periods of 4.4-13.4 m and 7.2-9.3 sec, and maximum wave heights and periods of 7-23.6 m and 9.8-12.5 sec (Earle, 1975).
Before Hurricane Katrina (2005), Hurricane Camille was the standard by which extreme storm damage in the
Open-File Report 2007-1161 1�
northern Gulf of Mexico was compared. Not only did Camille cause widespread destruction on the Mississippi mainland (U.S. Army Corps of Engineers, 1970), it caused extensive morphological changes to the Chandeleur and MS-AL barrier island chains (Wright and others, 1970, and Appendices B and C). Post-storm photographs revealed that storm impacts on the barrier islands involved multiple stages of erosion and deposition related to periods of different wind strength, water level, and wave approach. Dauphin Island had the lowest surge elevations and was farther from the storm than any of the other MS-AL barriers. Consequently the morphological changes on Dauphin Island were pri-marily depositional and were controlled by the differences between water levels and island elevations. Where waves superimposed on the storm surge were lower than the crest of the foredune ridge, the foredunes were breached and individual perched fans were constructed on the vegetated barrier flat (Fig. 8). Where water levels exceeded the island elevations, wave runup constructed a washover terrace that extended inland between 240 and 300 m from the shore (Morton and Sallenger, 2003) but only to the mid island position.
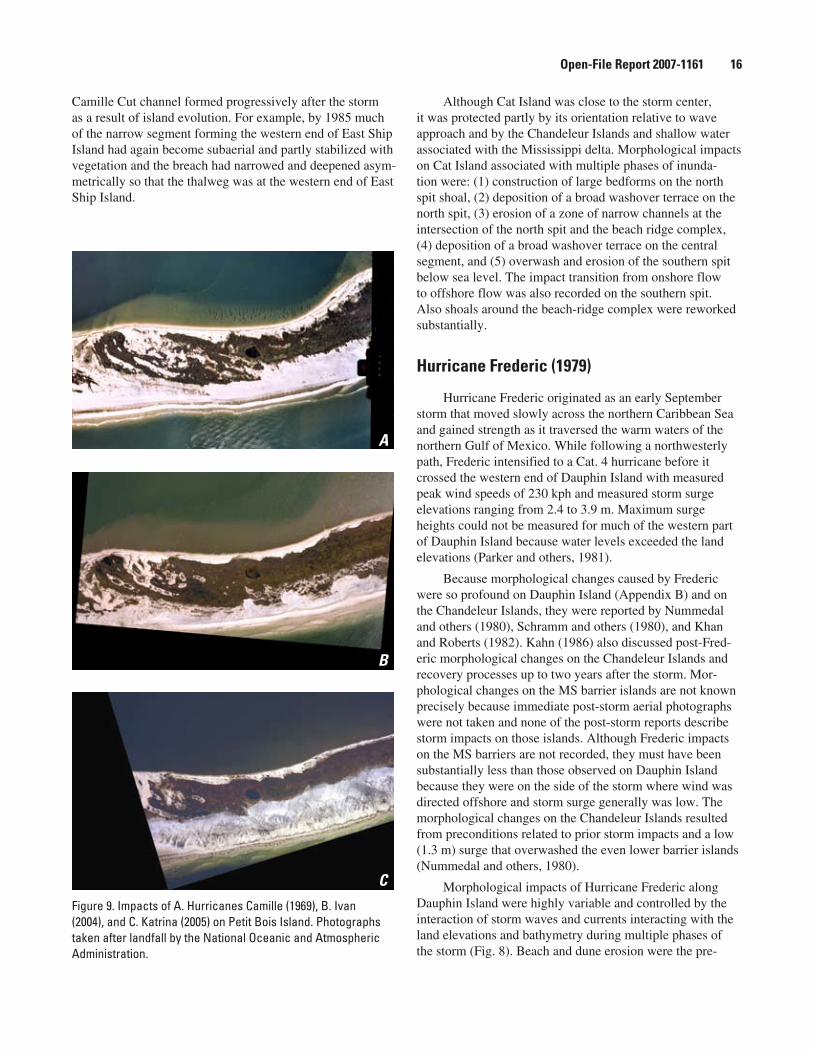
Morphological changes on Petit Bois Island primarily involved minor reworking of the interior elevated ridges and construction of a moderately broad washover terrace (Fig. 9) that extended inland an average of about 190 m from the beach. Shoals on the eastern end of the island were cov-ered with large diffuse bedforms. Changes on Horn Island were slightly greater than those on Petit Bois Island. They also involved reworking of interior topographic highs and construction of a washover terrace of variable width that extended inland from 120 to 235 m (Morton and Sallenger, 2003). On the western end of Horn Island, narrow closely spaced drainage channels reworked the washover terrace, and the shoals were covered with large rhomboid bedforms.
Camille impacts were most pronounced on Ship Island because it was in the band of maximum wind speeds and its orientation promoted barrier erosion and overwash. The primary morphological changes were erosion of the eastern and central spits to form submerged shoals, construction of washover terraces of variable widths (80-210 m, Morton and Sallenger, 2003) on the wide vegetated segments, and erosion of the Camille washover terrace on the western end of the island by return flow currents. Also the western apex of the triangular segment was cut by an incised chan-nel that later filled. Breaching of the narrow central spit to bisect Ship Island and to form Camille Cut (Fig. 1) has been widely reported. What is not reported is the fact that the Camille Cut channel was not formed during the storm. Aerial photographs taken one month after Camille clearly show that the former narrow subaerial barrier segment was truncated and reduced to a sandy shoal slightly below sea level. This shallow shore-parallel platform still connected
the wider subaerial island segments. Even the 1970 post-Camille bathymetry (Knowles and Rosati, 1989) showed that water depths across the shoal were less than 1.5 m and the subaqueous shoal did not have the characteristic tidal inlet morphologies consisting of a relatively deep channel merging into flood-delta and ebb-delta bars. Unlike the rela-tively deep storm channels opened on Hatteras Island during Isabel (2003) and Dauphin Island during Katrina (2005), the
A
B
CFigure 8. Impacts of A. Hurricanes Camille (1969), B. Frederic (1979), and C. Katrina (2005) on Dauphin Island. Photographs taken after landfall by the National Oceanic and Atmospheric Administration and the Florida Department of Transportation.
Open-File Report 2007-1161 16
Camille Cut channel formed progressively after the storm as a result of island evolution. For example, by 1985 much of the narrow segment forming the western end of East Ship Island had again become subaerial and partly stabilized with vegetation and the breach had narrowed and deepened asym-metrically so that the thalweg was at the western end of East Ship Island.
Although Cat Island was close to the storm center, it was protected partly by its orientation relative to wave approach and by the Chandeleur Islands and shallow water associated with the Mississippi delta. Morphological impacts on Cat Island associated with multiple phases of inunda-tion were: (1) construction of large bedforms on the north spit shoal, (2) deposition of a broad washover terrace on the north spit, (3) erosion of a zone of narrow channels at the intersection of the north spit and the beach ridge complex, (4) deposition of a broad washover terrace on the central segment, and (5) overwash and erosion of the southern spit below sea level. The impact transition from onshore flow to offshore flow was also recorded on the southern spit. Also shoals around the beach-ridge complex were reworked substantially.
Hurricane Frederic (1�7�)
Hurricane Frederic originated as an early September storm that moved slowly across the northern Caribbean Sea and gained strength as it traversed the warm waters of the northern Gulf of Mexico. While following a northwesterly path, Frederic intensified to a Cat. 4 hurricane before it crossed the western end of Dauphin Island with measured peak wind speeds of 230 kph and measured storm surge elevations ranging from 2.4 to 3.9 m. Maximum surge heights could not be measured for much of the western part of Dauphin Island because water levels exceeded the land elevations (Parker and others, 1981).
Because morphological changes caused by Frederic were so profound on Dauphin Island (Appendix B) and on the Chandeleur Islands, they were reported by Nummedal and others (1980), Schramm and others (1980), and Khan and Roberts (1982). Kahn (1986) also discussed post-Fred-eric morphological changes on the Chandeleur Islands and recovery processes up to two years after the storm. Mor-phological changes on the MS barrier islands are not known precisely because immediate post-storm aerial photographs were not taken and none of the post-storm reports describe storm impacts on those islands. Although Frederic impacts on the MS barriers are not recorded, they must have been substantially less than those observed on Dauphin Island because they were on the side of the storm where wind was directed offshore and storm surge generally was low. The morphological changes on the Chandeleur Islands resulted from preconditions related to prior storm impacts and a low (1.3 m) surge that overwashed the even lower barrier islands (Nummedal and others, 1980).
Morphological impacts of Hurricane Frederic along Dauphin Island were highly variable and controlled by the interaction of storm waves and currents interacting with the land elevations and bathymetry during multiple phases of the storm (Fig. 8). Beach and dune erosion were the pre-
A
B
C
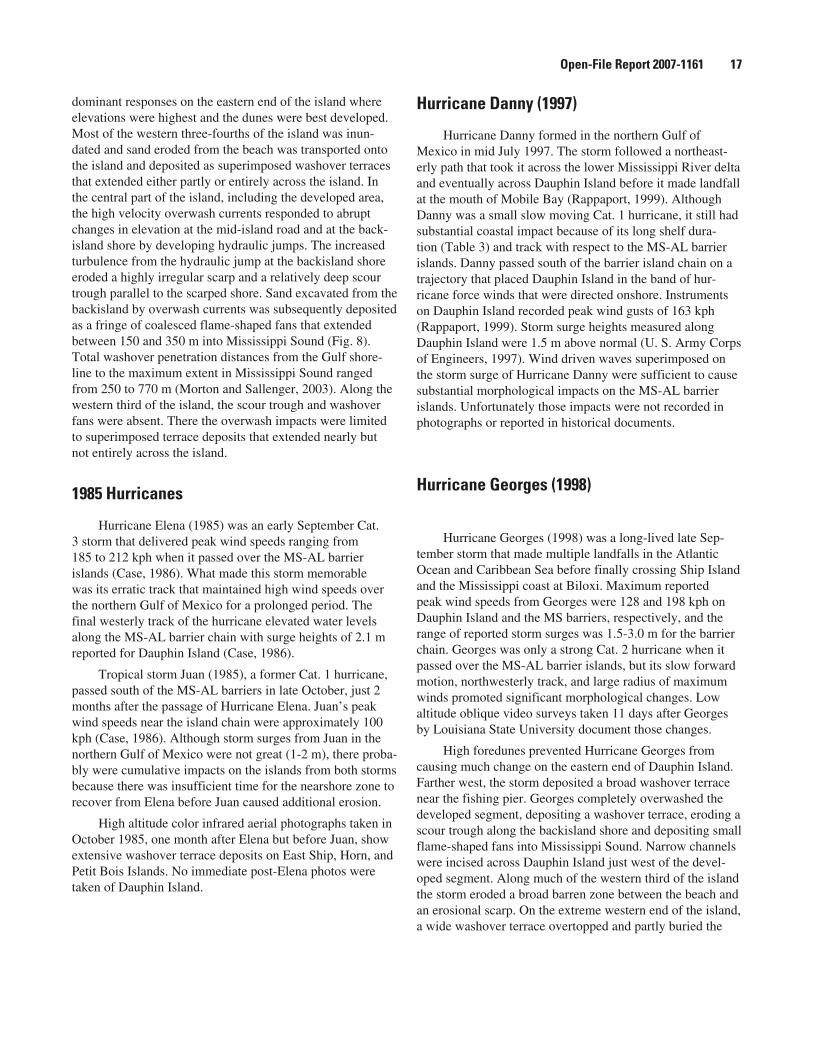
Figure 9. Impacts of A. Hurricanes Camille (1969), B. Ivan (2004), and C. Katrina (2005) on Petit Bois Island. Photographs taken after landfall by the National Oceanic and Atmospheric Administration.
Open-File Report 2007-1161 17
dominant responses on the eastern end of the island where elevations were highest and the dunes were best developed. Most of the western three-fourths of the island was inun-dated and sand eroded from the beach was transported onto the island and deposited as superimposed washover terraces that extended either partly or entirely across the island. In the central part of the island, including the developed area, the high velocity overwash currents responded to abrupt changes in elevation at the mid-island road and at the back-island shore by developing hydraulic jumps. The increased turbulence from the hydraulic jump at the backisland shore eroded a highly irregular scarp and a relatively deep scour trough parallel to the scarped shore. Sand excavated from the backisland by overwash currents was subsequently deposited as a fringe of coalesced flame-shaped fans that extended between 150 and 350 m into Mississippi Sound (Fig. 8). Total washover penetration distances from the Gulf shore-line to the maximum extent in Mississippi Sound ranged from 250 to 770 m (Morton and Sallenger, 2003). Along the western third of the island, the scour trough and washover fans were absent. There the overwash impacts were limited to superimposed terrace deposits that extended nearly but not entirely across the island.
1��� Hurricanes
Hurricane Elena (1985) was an early September Cat. 3 storm that delivered peak wind speeds ranging from 185 to 212 kph when it passed over the MS-AL barrier islands (Case, 1986). What made this storm memorable was its erratic track that maintained high wind speeds over the northern Gulf of Mexico for a prolonged period. The final westerly track of the hurricane elevated water levels along the MS-AL barrier chain with surge heights of 2.1 m reported for Dauphin Island (Case, 1986).
Tropical storm Juan (1985), a former Cat. 1 hurricane, passed south of the MS-AL barriers in late October, just 2 months after the passage of Hurricane Elena. Juan’s peak wind speeds near the island chain were approximately 100 kph (Case, 1986). Although storm surges from Juan in the northern Gulf of Mexico were not great (1-2 m), there proba-bly were cumulative impacts on the islands from both storms because there was insufficient time for the nearshore zone to recover from Elena before Juan caused additional erosion.
High altitude color infrared aerial photographs taken in October 1985, one month after Elena but before Juan, show extensive washover terrace deposits on East Ship, Horn, and Petit Bois Islands. No immediate post-Elena photos were taken of Dauphin Island.
Hurricane Danny (1��7)
Hurricane Danny formed in the northern Gulf of Mexico in mid July 1997. The storm followed a northeast-erly path that took it across the lower Mississippi River delta and eventually across Dauphin Island before it made landfall at the mouth of Mobile Bay (Rappaport, 1999). Although Danny was a small slow moving Cat. 1 hurricane, it still had substantial coastal impact because of its long shelf dura-tion (Table 3) and track with respect to the MS-AL barrier islands. Danny passed south of the barrier island chain on a trajectory that placed Dauphin Island in the band of hur-ricane force winds that were directed onshore. Instruments on Dauphin Island recorded peak wind gusts of 163 kph (Rappaport, 1999). Storm surge heights measured along Dauphin Island were 1.5 m above normal (U. S. Army Corps of Engineers, 1997). Wind driven waves superimposed on the storm surge of Hurricane Danny were sufficient to cause substantial morphological impacts on the MS-AL barrier islands. Unfortunately those impacts were not recorded in photographs or reported in historical documents.
Hurricane Georges (1���)
Hurricane Georges (1998) was a long-lived late Sep-tember storm that made multiple landfalls in the Atlantic Ocean and Caribbean Sea before finally crossing Ship Island and the Mississippi coast at Biloxi. Maximum reported peak wind speeds from Georges were 128 and 198 kph on Dauphin Island and the MS barriers, respectively, and the range of reported storm surges was 1.5-3.0 m for the barrier chain. Georges was only a strong Cat. 2 hurricane when it passed over the MS-AL barrier islands, but its slow forward motion, northwesterly track, and large radius of maximum winds promoted significant morphological changes. Low altitude oblique video surveys taken 11 days after Georges by Louisiana State University document those changes.
High foredunes prevented Hurricane Georges from causing much change on the eastern end of Dauphin Island. Farther west, the storm deposited a broad washover terrace near the fishing pier. Georges completely overwashed the developed segment, depositing a washover terrace, eroding a scour trough along the backisland shore and depositing small flame-shaped fans into Mississippi Sound. Narrow channels were incised across Dauphin Island just west of the devel-oped segment. Along much of the western third of the island the storm eroded a broad barren zone between the beach and an erosional scarp. On the extreme western end of the island, a wide washover terrace overtopped and partly buried the
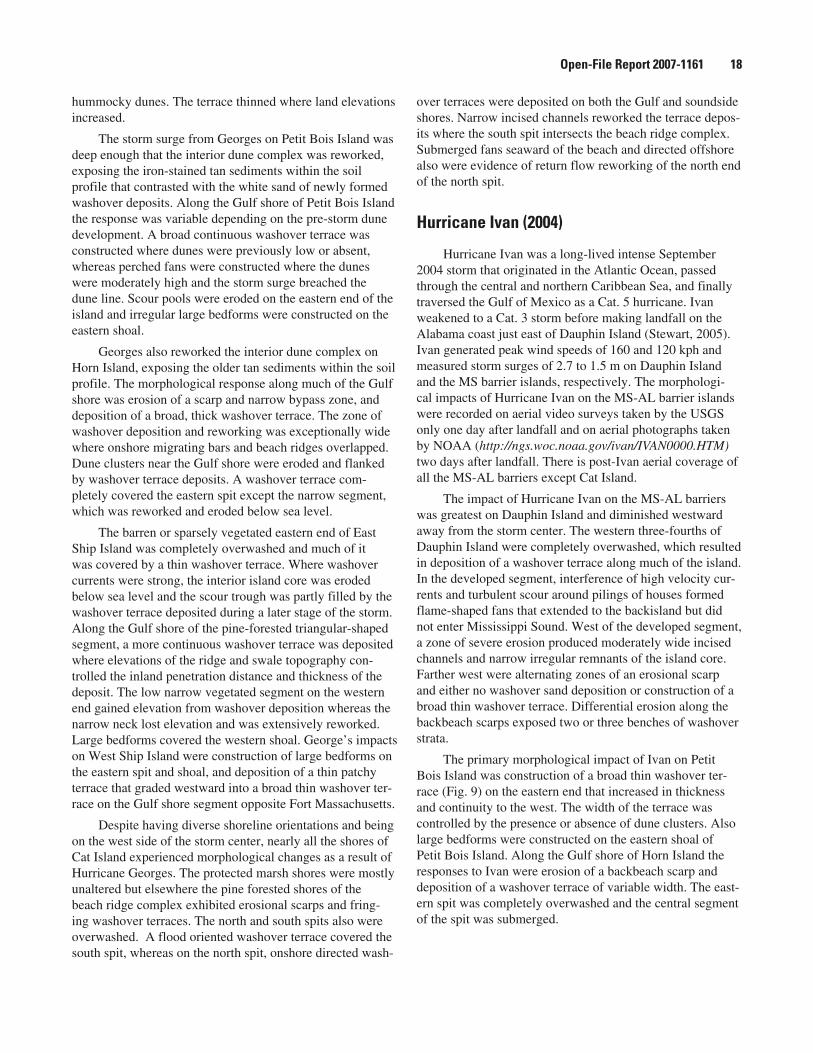
Open-File Report 2007-1161 1�
hummocky dunes. The terrace thinned where land elevations increased.
The storm surge from Georges on Petit Bois Island was deep enough that the interior dune complex was reworked, exposing the iron-stained tan sediments within the soil profile that contrasted with the white sand of newly formed washover deposits. Along the Gulf shore of Petit Bois Island the response was variable depending on the pre-storm dune development. A broad continuous washover terrace was constructed where dunes were previously low or absent, whereas perched fans were constructed where the dunes were moderately high and the storm surge breached the dune line. Scour pools were eroded on the eastern end of the island and irregular large bedforms were constructed on the eastern shoal.
Georges also reworked the interior dune complex on Horn Island, exposing the older tan sediments within the soil profile. The morphological response along much of the Gulf shore was erosion of a scarp and narrow bypass zone, and deposition of a broad, thick washover terrace. The zone of washover deposition and reworking was exceptionally wide where onshore migrating bars and beach ridges overlapped. Dune clusters near the Gulf shore were eroded and flanked by washover terrace deposits. A washover terrace com-pletely covered the eastern spit except the narrow segment, which was reworked and eroded below sea level.
The barren or sparsely vegetated eastern end of East Ship Island was completely overwashed and much of it was covered by a thin washover terrace. Where washover currents were strong, the interior island core was eroded below sea level and the scour trough was partly filled by the washover terrace deposited during a later stage of the storm. Along the Gulf shore of the pine-forested triangular-shaped segment, a more continuous washover terrace was deposited where elevations of the ridge and swale topography con-trolled the inland penetration distance and thickness of the deposit. The low narrow vegetated segment on the western end gained elevation from washover deposition whereas the narrow neck lost elevation and was extensively reworked. Large bedforms covered the western shoal. George’s impacts on West Ship Island were construction of large bedforms on the eastern spit and shoal, and deposition of a thin patchy terrace that graded westward into a broad thin washover ter-race on the Gulf shore segment opposite Fort Massachusetts.
Despite having diverse shoreline orientations and being on the west side of the storm center, nearly all the shores of Cat Island experienced morphological changes as a result of Hurricane Georges. The protected marsh shores were mostly unaltered but elsewhere the pine forested shores of the beach ridge complex exhibited erosional scarps and fring-ing washover terraces. The north and south spits also were overwashed. A flood oriented washover terrace covered the south spit, whereas on the north spit, onshore directed wash-
over terraces were deposited on both the Gulf and soundside shores. Narrow incised channels reworked the terrace depos-its where the south spit intersects the beach ridge complex. Submerged fans seaward of the beach and directed offshore also were evidence of return flow reworking of the north end of the north spit.
Hurricane Ivan (200�)
Hurricane Ivan was a long-lived intense September 2004 storm that originated in the Atlantic Ocean, passed through the central and northern Caribbean Sea, and finally traversed the Gulf of Mexico as a Cat. 5 hurricane. Ivan weakened to a Cat. 3 storm before making landfall on the Alabama coast just east of Dauphin Island (Stewart, 2005). Ivan generated peak wind speeds of 160 and 120 kph and measured storm surges of 2.7 to 1.5 m on Dauphin Island and the MS barrier islands, respectively. The morphologi-cal impacts of Hurricane Ivan on the MS-AL barrier islands were recorded on aerial video surveys taken by the USGS only one day after landfall and on aerial photographs taken by NOAA (http://ngs.woc.noaa.gov/ivan/IVAN0000.HTM) two days after landfall. There is post-Ivan aerial coverage of all the MS-AL barriers except Cat Island.
The impact of Hurricane Ivan on the MS-AL barriers was greatest on Dauphin Island and diminished westward away from the storm center. The western three-fourths of Dauphin Island were completely overwashed, which resulted in deposition of a washover terrace along much of the island. In the developed segment, interference of high velocity cur-rents and turbulent scour around pilings of houses formed flame-shaped fans that extended to the backisland but did not enter Mississippi Sound. West of the developed segment, a zone of severe erosion produced moderately wide incised channels and narrow irregular remnants of the island core. Farther west were alternating zones of an erosional scarp and either no washover sand deposition or construction of a broad thin washover terrace. Differential erosion along the backbeach scarps exposed two or three benches of washover strata.
The primary morphological impact of Ivan on Petit Bois Island was construction of a broad thin washover ter-race (Fig. 9) on the eastern end that increased in thickness and continuity to the west. The width of the terrace was controlled by the presence or absence of dune clusters. Also large bedforms were constructed on the eastern shoal of Petit Bois Island. Along the Gulf shore of Horn Island the responses to Ivan were erosion of a backbeach scarp and deposition of a washover terrace of variable width. The east-ern spit was completely overwashed and the central segment of the spit was submerged.
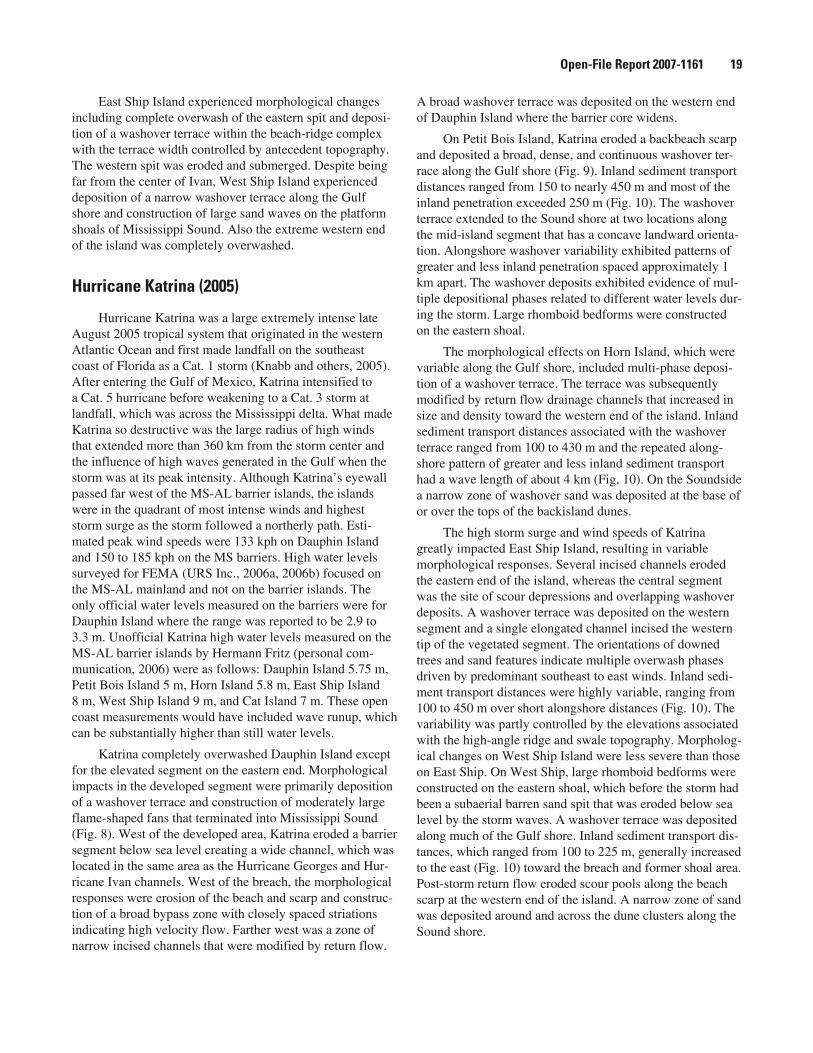
Open-File Report 2007-1161 1�
East Ship Island experienced morphological changes including complete overwash of the eastern spit and deposi-tion of a washover terrace within the beach-ridge complex with the terrace width controlled by antecedent topography. The western spit was eroded and submerged. Despite being far from the center of Ivan, West Ship Island experienced deposition of a narrow washover terrace along the Gulf shore and construction of large sand waves on the platform shoals of Mississippi Sound. Also the extreme western end of the island was completely overwashed.
Hurricane Katrina (200�)
Hurricane Katrina was a large extremely intense late August 2005 tropical system that originated in the western Atlantic Ocean and first made landfall on the southeast coast of Florida as a Cat. 1 storm (Knabb and others, 2005). After entering the Gulf of Mexico, Katrina intensified to a Cat. 5 hurricane before weakening to a Cat. 3 storm at landfall, which was across the Mississippi delta. What made Katrina so destructive was the large radius of high winds that extended more than 360 km from the storm center and the influence of high waves generated in the Gulf when the storm was at its peak intensity. Although Katrina’s eyewall passed far west of the MS-AL barrier islands, the islands were in the quadrant of most intense winds and highest storm surge as the storm followed a northerly path. Esti-mated peak wind speeds were 133 kph on Dauphin Island and 150 to 185 kph on the MS barriers. High water levels surveyed for FEMA (URS Inc., 2006a, 2006b) focused on the MS-AL mainland and not on the barrier islands. The only official water levels measured on the barriers were for Dauphin Island where the range was reported to be 2.9 to 3.3 m. Unofficial Katrina high water levels measured on the MS-AL barrier islands by Hermann Fritz (personal com-munication, 2006) were as follows: Dauphin Island 5.75 m, Petit Bois Island 5 m, Horn Island 5.8 m, East Ship Island 8 m, West Ship Island 9 m, and Cat Island 7 m. These open coast measurements would have included wave runup, which can be substantially higher than still water levels.
Katrina completely overwashed Dauphin Island except for the elevated segment on the eastern end. Morphological impacts in the developed segment were primarily deposition of a washover terrace and construction of moderately large flame-shaped fans that terminated into Mississippi Sound (Fig. 8). West of the developed area, Katrina eroded a barrier segment below sea level creating a wide channel, which was located in the same area as the Hurricane Georges and Hur-ricane Ivan channels. West of the breach, the morphological responses were erosion of the beach and scarp and construc-tion of a broad bypass zone with closely spaced striations indicating high velocity flow. Farther west was a zone of narrow incised channels that were modified by return flow.
A broad washover terrace was deposited on the western end of Dauphin Island where the barrier core widens.
On Petit Bois Island, Katrina eroded a backbeach scarp and deposited a broad, dense, and continuous washover ter-race along the Gulf shore (Fig. 9). Inland sediment transport distances ranged from 150 to nearly 450 m and most of the inland penetration exceeded 250 m (Fig. 10). The washover terrace extended to the Sound shore at two locations along the mid-island segment that has a concave landward orienta-tion. Alongshore washover variability exhibited patterns of greater and less inland penetration spaced approximately 1 km apart. The washover deposits exhibited evidence of mul-tiple depositional phases related to different water levels dur-ing the storm. Large rhomboid bedforms were constructed on the eastern shoal.
The morphological effects on Horn Island, which were variable along the Gulf shore, included multi-phase deposi-tion of a washover terrace. The terrace was subsequently modified by return flow drainage channels that increased in size and density toward the western end of the island. Inland sediment transport distances associated with the washover terrace ranged from 100 to 430 m and the repeated along-shore pattern of greater and less inland sediment transport had a wave length of about 4 km (Fig, 10). On the Soundside a narrow zone of washover sand was deposited at the base of or over the tops of the backisland dunes.
The high storm surge and wind speeds of Katrina greatly impacted East Ship Island, resulting in variable morphological responses. Several incised channels eroded the eastern end of the island, whereas the central segment was the site of scour depressions and overlapping washover deposits. A washover terrace was deposited on the western segment and a single elongated channel incised the western tip of the vegetated segment. The orientations of downed trees and sand features indicate multiple overwash phases driven by predominant southeast to east winds. Inland sedi-ment transport distances were highly variable, ranging from 100 to 450 m over short alongshore distances (Fig. 10). The variability was partly controlled by the elevations associated with the high-angle ridge and swale topography. Morpholog-ical changes on West Ship Island were less severe than those on East Ship. On West Ship, large rhomboid bedforms were constructed on the eastern shoal, which before the storm had been a subaerial barren sand spit that was eroded below sea level by the storm waves. A washover terrace was deposited along much of the Gulf shore. Inland sediment transport dis-tances, which ranged from 100 to 225 m, generally increased to the east (Fig. 10) toward the breach and former shoal area. Post-storm return flow eroded scour pools along the beach scarp at the western end of the island. A narrow zone of sand was deposited around and across the dune clusters along the Sound shore.
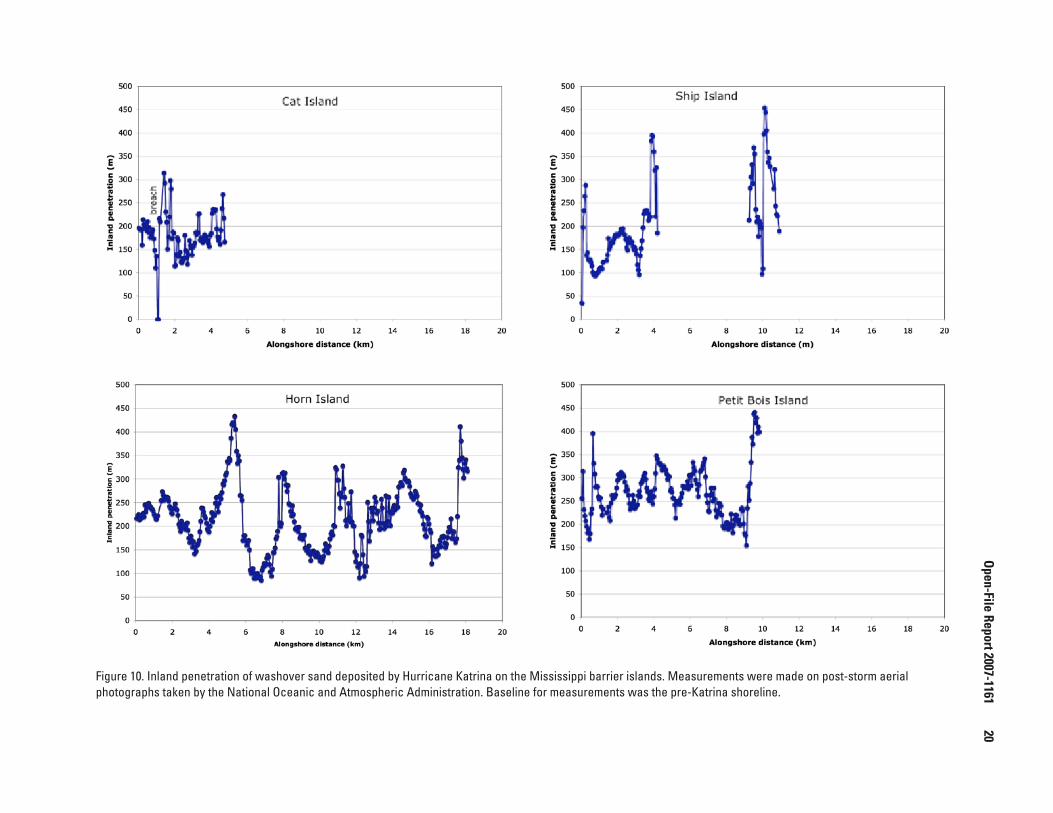
Open-File Report 2007-1161
20
Figure 10. Inland penetration of washover sand deposited by Hurricane Katrina on the Mississippi barrier islands. Measurements were made on post-storm aerial photographs taken by the National Oceanic and Atmospheric Administration. Baseline for measurements was the pre-Katrina shoreline.
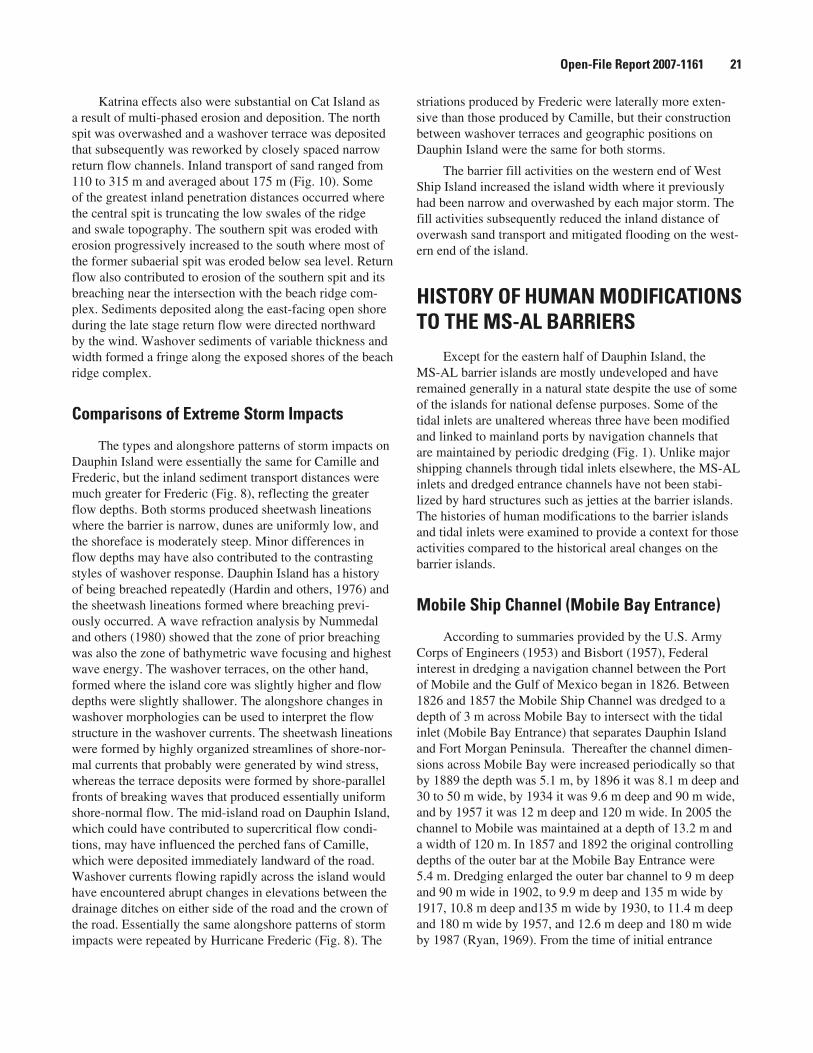
Open-File Report 2007-1161 21
Katrina effects also were substantial on Cat Island as a result of multi-phased erosion and deposition. The north spit was overwashed and a washover terrace was deposited that subsequently was reworked by closely spaced narrow return flow channels. Inland transport of sand ranged from 110 to 315 m and averaged about 175 m (Fig. 10). Some of the greatest inland penetration distances occurred where the central spit is truncating the low swales of the ridge and swale topography. The southern spit was eroded with erosion progressively increased to the south where most of the former subaerial spit was eroded below sea level. Return flow also contributed to erosion of the southern spit and its breaching near the intersection with the beach ridge com-plex. Sediments deposited along the east-facing open shore during the late stage return flow were directed northward by the wind. Washover sediments of variable thickness and width formed a fringe along the exposed shores of the beach ridge complex.
Comparisons of Extreme Storm Impacts
The types and alongshore patterns of storm impacts on Dauphin Island were essentially the same for Camille and Frederic, but the inland sediment transport distances were much greater for Frederic (Fig. 8), reflecting the greater flow depths. Both storms produced sheetwash lineations where the barrier is narrow, dunes are uniformly low, and the shoreface is moderately steep. Minor differences in flow depths may have also contributed to the contrasting styles of washover response. Dauphin Island has a history of being breached repeatedly (Hardin and others, 1976) and the sheetwash lineations formed where breaching previ-ously occurred. A wave refraction analysis by Nummedal and others (1980) showed that the zone of prior breaching was also the zone of bathymetric wave focusing and highest wave energy. The washover terraces, on the other hand, formed where the island core was slightly higher and flow depths were slightly shallower. The alongshore changes in washover morphologies can be used to interpret the flow structure in the washover currents. The sheetwash lineations were formed by highly organized streamlines of shore-nor-mal currents that probably were generated by wind stress, whereas the terrace deposits were formed by shore-parallel fronts of breaking waves that produced essentially uniform shore-normal flow. The mid-island road on Dauphin Island, which could have contributed to supercritical flow condi-tions, may have influenced the perched fans of Camille, which were deposited immediately landward of the road. Washover currents flowing rapidly across the island would have encountered abrupt changes in elevations between the drainage ditches on either side of the road and the crown of the road. Essentially the same alongshore patterns of storm impacts were repeated by Hurricane Frederic (Fig. 8). The
striations produced by Frederic were laterally more exten-sive than those produced by Camille, but their construction between washover terraces and geographic positions on Dauphin Island were the same for both storms.
The barrier fill activities on the western end of West Ship Island increased the island width where it previously had been narrow and overwashed by each major storm. The fill activities subsequently reduced the inland distance of overwash sand transport and mitigated flooding on the west-ern end of the island.
HISTORY OF HUMAN MODIFICATIONS TO THE MS-AL BARRIERS
Except for the eastern half of Dauphin Island, the MS-AL barrier islands are mostly undeveloped and have remained generally in a natural state despite the use of some of the islands for national defense purposes. Some of the tidal inlets are unaltered whereas three have been modified and linked to mainland ports by navigation channels that are maintained by periodic dredging (Fig. 1). Unlike major shipping channels through tidal inlets elsewhere, the MS-AL inlets and dredged entrance channels have not been stabi-lized by hard structures such as jetties at the barrier islands. The histories of human modifications to the barrier islands and tidal inlets were examined to provide a context for those activities compared to the historical areal changes on the barrier islands.
Mobile Ship Channel (Mobile Bay Entrance)
According to summaries provided by the U.S. Army Corps of Engineers (1953) and Bisbort (1957), Federal interest in dredging a navigation channel between the Port of Mobile and the Gulf of Mexico began in 1826. Between 1826 and 1857 the Mobile Ship Channel was dredged to a depth of 3 m across Mobile Bay to intersect with the tidal inlet (Mobile Bay Entrance) that separates Dauphin Island and Fort Morgan Peninsula. Thereafter the channel dimen-sions across Mobile Bay were increased periodically so that by 1889 the depth was 5.1 m, by 1896 it was 8.1 m deep and 30 to 50 m wide, by 1934 it was 9.6 m deep and 90 m wide, and by 1957 it was 12 m deep and 120 m wide. In 2005 the channel to Mobile was maintained at a depth of 13.2 m and a width of 120 m. In 1857 and 1892 the original controlling depths of the outer bar at the Mobile Bay Entrance were 5.4 m. Dredging enlarged the outer bar channel to 9 m deep and 90 m wide in 1902, to 9.9 m deep and 135 m wide by 1917, 10.8 m deep and135 m wide by 1930, to 11.4 m deep and 180 m wide by 1957, and 12.6 m deep and 180 m wide by 1987 (Ryan, 1969). From the time of initial entrance
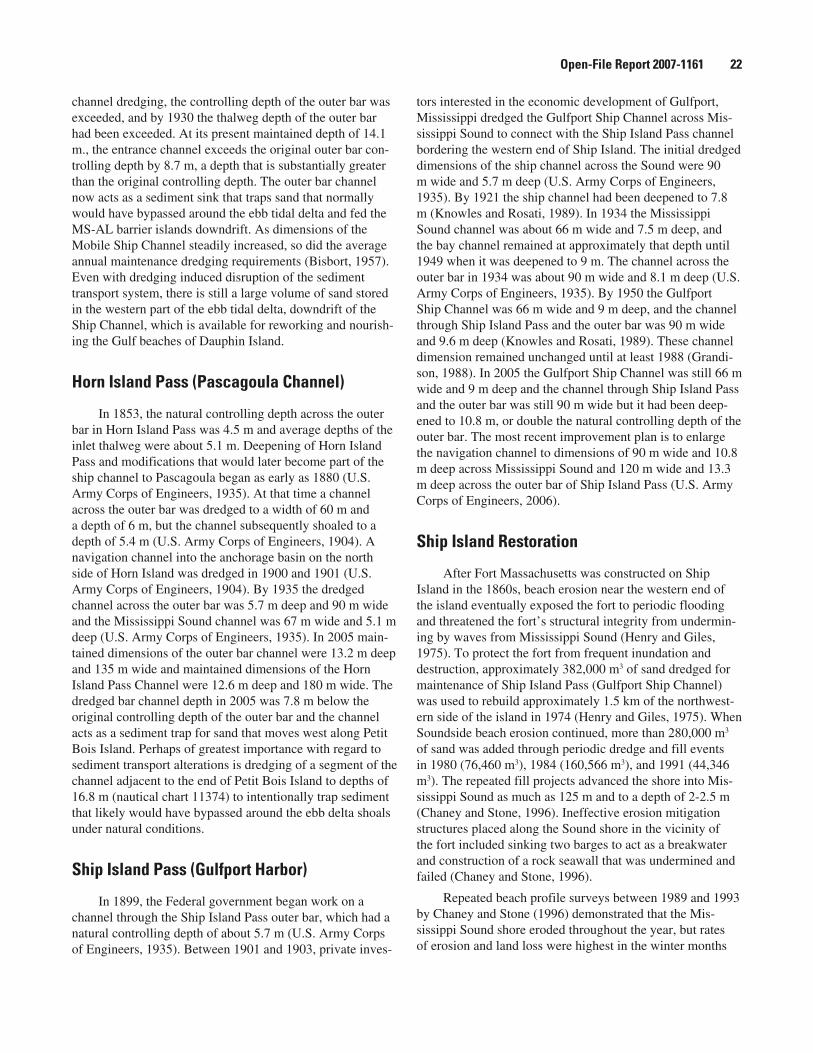
Open-File Report 2007-1161 22
channel dredging, the controlling depth of the outer bar was exceeded, and by 1930 the thalweg depth of the outer bar had been exceeded. At its present maintained depth of 14.1 m., the entrance channel exceeds the original outer bar con-trolling depth by 8.7 m, a depth that is substantially greater than the original controlling depth. The outer bar channel now acts as a sediment sink that traps sand that normally would have bypassed around the ebb tidal delta and fed the MS-AL barrier islands downdrift. As dimensions of the Mobile Ship Channel steadily increased, so did the average annual maintenance dredging requirements (Bisbort, 1957). Even with dredging induced disruption of the sediment transport system, there is still a large volume of sand stored in the western part of the ebb tidal delta, downdrift of the Ship Channel, which is available for reworking and nourish-ing the Gulf beaches of Dauphin Island.
Horn Island Pass (Pascagoula Channel)
In 1853, the natural controlling depth across the outer bar in Horn Island Pass was 4.5 m and average depths of the inlet thalweg were about 5.1 m. Deepening of Horn Island Pass and modifications that would later become part of the ship channel to Pascagoula began as early as 1880 (U.S. Army Corps of Engineers, 1935). At that time a channel across the outer bar was dredged to a width of 60 m and a depth of 6 m, but the channel subsequently shoaled to a depth of 5.4 m (U.S. Army Corps of Engineers, 1904). A navigation channel into the anchorage basin on the north side of Horn Island was dredged in 1900 and 1901 (U.S. Army Corps of Engineers, 1904). By 1935 the dredged channel across the outer bar was 5.7 m deep and 90 m wide and the Mississippi Sound channel was 67 m wide and 5.1 m deep (U.S. Army Corps of Engineers, 1935). In 2005 main-tained dimensions of the outer bar channel were 13.2 m deep and 135 m wide and maintained dimensions of the Horn Island Pass Channel were 12.6 m deep and 180 m wide. The dredged bar channel depth in 2005 was 7.8 m below the original controlling depth of the outer bar and the channel acts as a sediment trap for sand that moves west along Petit Bois Island. Perhaps of greatest importance with regard to sediment transport alterations is dredging of a segment of the channel adjacent to the end of Petit Bois Island to depths of 16.8 m (nautical chart 11374) to intentionally trap sediment that likely would have bypassed around the ebb delta shoals under natural conditions.
Ship Island Pass (Gulfport Harbor)
In 1899, the Federal government began work on a channel through the Ship Island Pass outer bar, which had a natural controlling depth of about 5.7 m (U.S. Army Corps of Engineers, 1935). Between 1901 and 1903, private inves-
tors interested in the economic development of Gulfport, Mississippi dredged the Gulfport Ship Channel across Mis-sissippi Sound to connect with the Ship Island Pass channel bordering the western end of Ship Island. The initial dredged dimensions of the ship channel across the Sound were 90 m wide and 5.7 m deep (U.S. Army Corps of Engineers, 1935). By 1921 the ship channel had been deepened to 7.8 m (Knowles and Rosati, 1989). In 1934 the Mississippi Sound channel was about 66 m wide and 7.5 m deep, and the bay channel remained at approximately that depth until 1949 when it was deepened to 9 m. The channel across the outer bar in 1934 was about 90 m wide and 8.1 m deep (U.S. Army Corps of Engineers, 1935). By 1950 the Gulfport Ship Channel was 66 m wide and 9 m deep, and the channel through Ship Island Pass and the outer bar was 90 m wide and 9.6 m deep (Knowles and Rosati, 1989). These channel dimension remained unchanged until at least 1988 (Grandi-son, 1988). In 2005 the Gulfport Ship Channel was still 66 m wide and 9 m deep and the channel through Ship Island Pass and the outer bar was still 90 m wide but it had been deep-ened to 10.8 m, or double the natural controlling depth of the outer bar. The most recent improvement plan is to enlarge the navigation channel to dimensions of 90 m wide and 10.8 m deep across Mississippi Sound and 120 m wide and 13.3 m deep across the outer bar of Ship Island Pass (U.S. Army Corps of Engineers, 2006).
Ship Island Restoration
After Fort Massachusetts was constructed on Ship Island in the 1860s, beach erosion near the western end of the island eventually exposed the fort to periodic flooding and threatened the fort’s structural integrity from undermin-ing by waves from Mississippi Sound (Henry and Giles, 1975). To protect the fort from frequent inundation and destruction, approximately 382,000 m3 of sand dredged for maintenance of Ship Island Pass (Gulfport Ship Channel) was used to rebuild approximately 1.5 km of the northwest-ern side of the island in 1974 (Henry and Giles, 1975). When Soundside beach erosion continued, more than 280,000 m3
of sand was added through periodic dredge and fill events in 1980 (76,460 m3), 1984 (160,566 m3), and 1991 (44,346 m3). The repeated fill projects advanced the shore into Mis-sissippi Sound as much as 125 m and to a depth of 2-2.5 m (Chaney and Stone, 1996). Ineffective erosion mitigation structures placed along the Sound shore in the vicinity of the fort included sinking two barges to act as a breakwater and construction of a rock seawall that was undermined and failed (Chaney and Stone, 1996).
Repeated beach profile surveys between 1989 and 1993 by Chaney and Stone (1996) demonstrated that the Mis-sissippi Sound shore eroded throughout the year, but rates of erosion and land loss were highest in the winter months
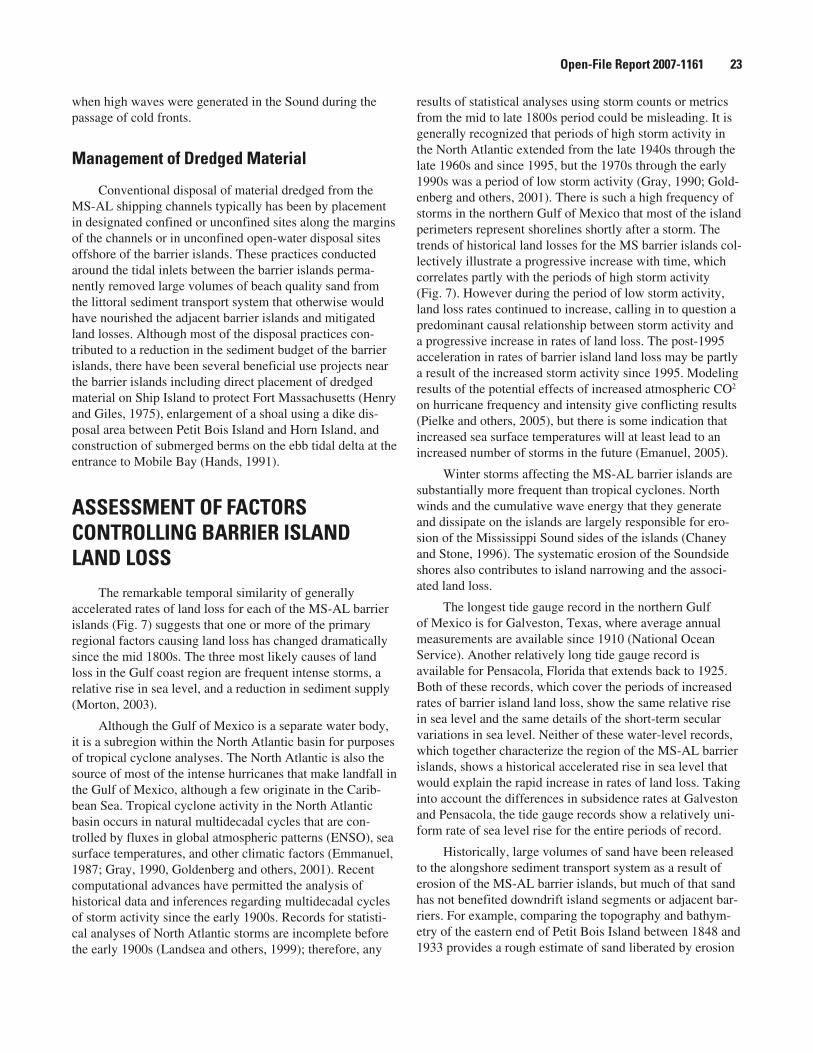
Open-File Report 2007-1161 2�
when high waves were generated in the Sound during the passage of cold fronts.
Management of Dredged Material
Conventional disposal of material dredged from the MS-AL shipping channels typically has been by placement in designated confined or unconfined sites along the margins of the channels or in unconfined open-water disposal sites offshore of the barrier islands. These practices conducted around the tidal inlets between the barrier islands perma-nently removed large volumes of beach quality sand from the littoral sediment transport system that otherwise would have nourished the adjacent barrier islands and mitigated land losses. Although most of the disposal practices con-tributed to a reduction in the sediment budget of the barrier islands, there have been several beneficial use projects near the barrier islands including direct placement of dredged material on Ship Island to protect Fort Massachusetts (Henry and Giles, 1975), enlargement of a shoal using a dike dis-posal area between Petit Bois Island and Horn Island, and construction of submerged berms on the ebb tidal delta at the entrance to Mobile Bay (Hands, 1991).
ASSESSMENT OF FACTORS CONTROLLING BARRIER ISLAND LAND LOSS
The remarkable temporal similarity of generally accelerated rates of land loss for each of the MS-AL barrier islands (Fig. 7) suggests that one or more of the primary regional factors causing land loss has changed dramatically since the mid 1800s. The three most likely causes of land loss in the Gulf coast region are frequent intense storms, a relative rise in sea level, and a reduction in sediment supply (Morton, 2003).
Although the Gulf of Mexico is a separate water body, it is a subregion within the North Atlantic basin for purposes of tropical cyclone analyses. The North Atlantic is also the source of most of the intense hurricanes that make landfall in the Gulf of Mexico, although a few originate in the Carib-bean Sea. Tropical cyclone activity in the North Atlantic basin occurs in natural multidecadal cycles that are con-trolled by fluxes in global atmospheric patterns (ENSO), sea surface temperatures, and other climatic factors (Emmanuel, 1987; Gray, 1990, Goldenberg and others, 2001). Recent computational advances have permitted the analysis of historical data and inferences regarding multidecadal cycles of storm activity since the early 1900s. Records for statisti-cal analyses of North Atlantic storms are incomplete before the early 1900s (Landsea and others, 1999); therefore, any
results of statistical analyses using storm counts or metrics from the mid to late 1800s period could be misleading. It is generally recognized that periods of high storm activity in the North Atlantic extended from the late 1940s through the late 1960s and since 1995, but the 1970s through the early 1990s was a period of low storm activity (Gray, 1990; Gold-enberg and others, 2001). There is such a high frequency of storms in the northern Gulf of Mexico that most of the island perimeters represent shorelines shortly after a storm. The trends of historical land losses for the MS barrier islands col-lectively illustrate a progressive increase with time, which correlates partly with the periods of high storm activity (Fig. 7). However during the period of low storm activity, land loss rates continued to increase, calling in to question a predominant causal relationship between storm activity and a progressive increase in rates of land loss. The post-1995 acceleration in rates of barrier island land loss may be partly a result of the increased storm activity since 1995. Modeling results of the potential effects of increased atmospheric CO2 on hurricane frequency and intensity give conflicting results (Pielke and others, 2005), but there is some indication that increased sea surface temperatures will at least lead to an increased number of storms in the future (Emanuel, 2005).
Winter storms affecting the MS-AL barrier islands are substantially more frequent than tropical cyclones. North winds and the cumulative wave energy that they generate and dissipate on the islands are largely responsible for ero-sion of the Mississippi Sound sides of the islands (Chaney and Stone, 1996). The systematic erosion of the Soundside shores also contributes to island narrowing and the associ-ated land loss.
The longest tide gauge record in the northern Gulf of Mexico is for Galveston, Texas, where average annual measurements are available since 1910 (National Ocean Service). Another relatively long tide gauge record is available for Pensacola, Florida that extends back to 1925. Both of these records, which cover the periods of increased rates of barrier island land loss, show the same relative rise in sea level and the same details of the short-term secular variations in sea level. Neither of these water-level records, which together characterize the region of the MS-AL barrier islands, shows a historical accelerated rise in sea level that would explain the rapid increase in rates of land loss. Taking into account the differences in subsidence rates at Galveston and Pensacola, the tide gauge records show a relatively uni-form rate of sea level rise for the entire periods of record.
Historically, large volumes of sand have been released to the alongshore sediment transport system as a result of erosion of the MS-AL barrier islands, but much of that sand has not benefited downdrift island segments or adjacent bar-riers. For example, comparing the topography and bathym-etry of the eastern end of Petit Bois Island between 1848 and 1933 provides a rough estimate of sand liberated by erosion
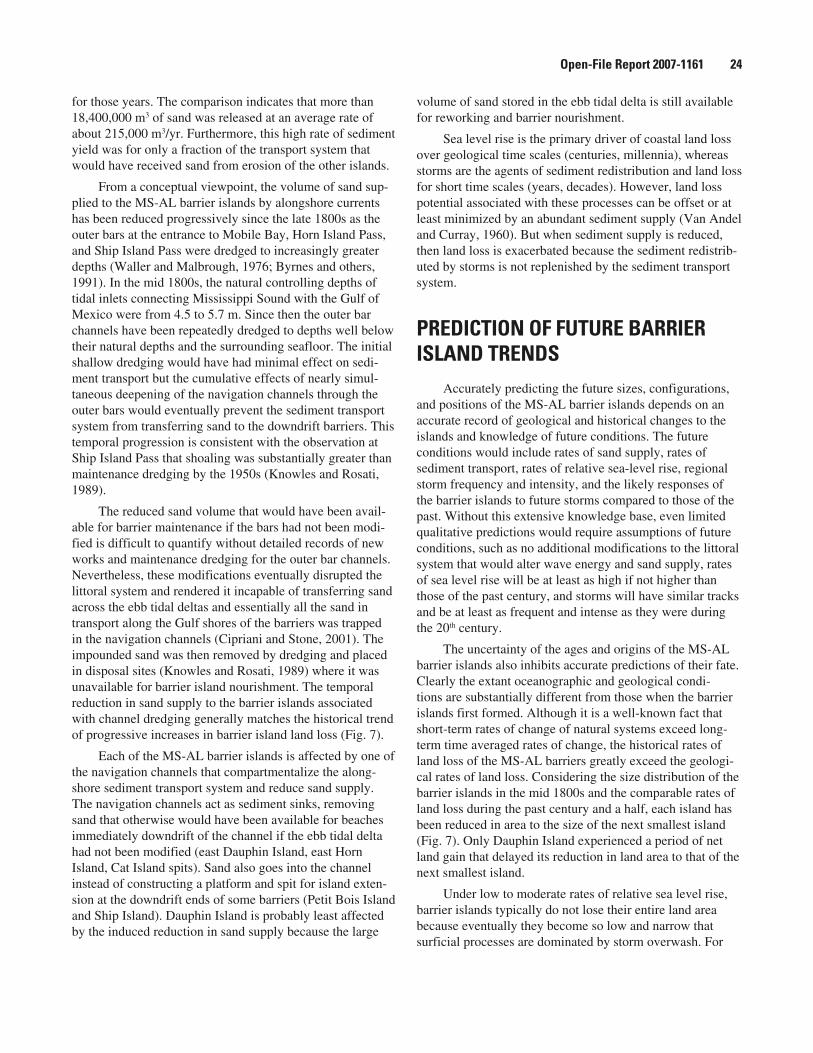
Open-File Report 2007-1161 2�
for those years. The comparison indicates that more than 18,400,000 m3 of sand was released at an average rate of about 215,000 m3/yr. Furthermore, this high rate of sediment yield was for only a fraction of the transport system that would have received sand from erosion of the other islands.
From a conceptual viewpoint, the volume of sand sup-plied to the MS-AL barrier islands by alongshore currents has been reduced progressively since the late 1800s as the outer bars at the entrance to Mobile Bay, Horn Island Pass, and Ship Island Pass were dredged to increasingly greater depths (Waller and Malbrough, 1976; Byrnes and others, 1991). In the mid 1800s, the natural controlling depths of tidal inlets connecting Mississippi Sound with the Gulf of Mexico were from 4.5 to 5.7 m. Since then the outer bar channels have been repeatedly dredged to depths well below their natural depths and the surrounding seafloor. The initial shallow dredging would have had minimal effect on sedi-ment transport but the cumulative effects of nearly simul-taneous deepening of the navigation channels through the outer bars would eventually prevent the sediment transport system from transferring sand to the downdrift barriers. This temporal progression is consistent with the observation at Ship Island Pass that shoaling was substantially greater than maintenance dredging by the 1950s (Knowles and Rosati, 1989).
The reduced sand volume that would have been avail-able for barrier maintenance if the bars had not been modi-fied is difficult to quantify without detailed records of new works and maintenance dredging for the outer bar channels. Nevertheless, these modifications eventually disrupted the littoral system and rendered it incapable of transferring sand across the ebb tidal deltas and essentially all the sand in transport along the Gulf shores of the barriers was trapped in the navigation channels (Cipriani and Stone, 2001). The impounded sand was then removed by dredging and placed in disposal sites (Knowles and Rosati, 1989) where it was unavailable for barrier island nourishment. The temporal reduction in sand supply to the barrier islands associated with channel dredging generally matches the historical trend of progressive increases in barrier island land loss (Fig. 7).
Each of the MS-AL barrier islands is affected by one of the navigation channels that compartmentalize the along-shore sediment transport system and reduce sand supply. The navigation channels act as sediment sinks, removing sand that otherwise would have been available for beaches immediately downdrift of the channel if the ebb tidal delta had not been modified (east Dauphin Island, east Horn Island, Cat Island spits). Sand also goes into the channel instead of constructing a platform and spit for island exten-sion at the downdrift ends of some barriers (Petit Bois Island and Ship Island). Dauphin Island is probably least affected by the induced reduction in sand supply because the large
volume of sand stored in the ebb tidal delta is still available for reworking and barrier nourishment.
Sea level rise is the primary driver of coastal land loss over geological time scales (centuries, millennia), whereas storms are the agents of sediment redistribution and land loss for short time scales (years, decades). However, land loss potential associated with these processes can be offset or at least minimized by an abundant sediment supply (Van Andel and Curray, 1960). But when sediment supply is reduced, then land loss is exacerbated because the sediment redistrib-uted by storms is not replenished by the sediment transport system.
PREDICTION OF FUTURE BARRIER ISLAND TRENDS
Accurately predicting the future sizes, configurations, and positions of the MS-AL barrier islands depends on an accurate record of geological and historical changes to the islands and knowledge of future conditions. The future conditions would include rates of sand supply, rates of sediment transport, rates of relative sea-level rise, regional storm frequency and intensity, and the likely responses of the barrier islands to future storms compared to those of the past. Without this extensive knowledge base, even limited qualitative predictions would require assumptions of future conditions, such as no additional modifications to the littoral system that would alter wave energy and sand supply, rates of sea level rise will be at least as high if not higher than those of the past century, and storms will have similar tracks and be at least as frequent and intense as they were during the 20th century.
The uncertainty of the ages and origins of the MS-AL barrier islands also inhibits accurate predictions of their fate. Clearly the extant oceanographic and geological condi-tions are substantially different from those when the barrier islands first formed. Although it is a well-known fact that short-term rates of change of natural systems exceed long-term time averaged rates of change, the historical rates of land loss of the MS-AL barriers greatly exceed the geologi-cal rates of land loss. Considering the size distribution of the barrier islands in the mid 1800s and the comparable rates of land loss during the past century and a half, each island has been reduced in area to the size of the next smallest island (Fig. 7). Only Dauphin Island experienced a period of net land gain that delayed its reduction in land area to that of the next smallest island.
Under low to moderate rates of relative sea level rise, barrier islands typically do not lose their entire land area because eventually they become so low and narrow that surficial processes are dominated by storm overwash. For
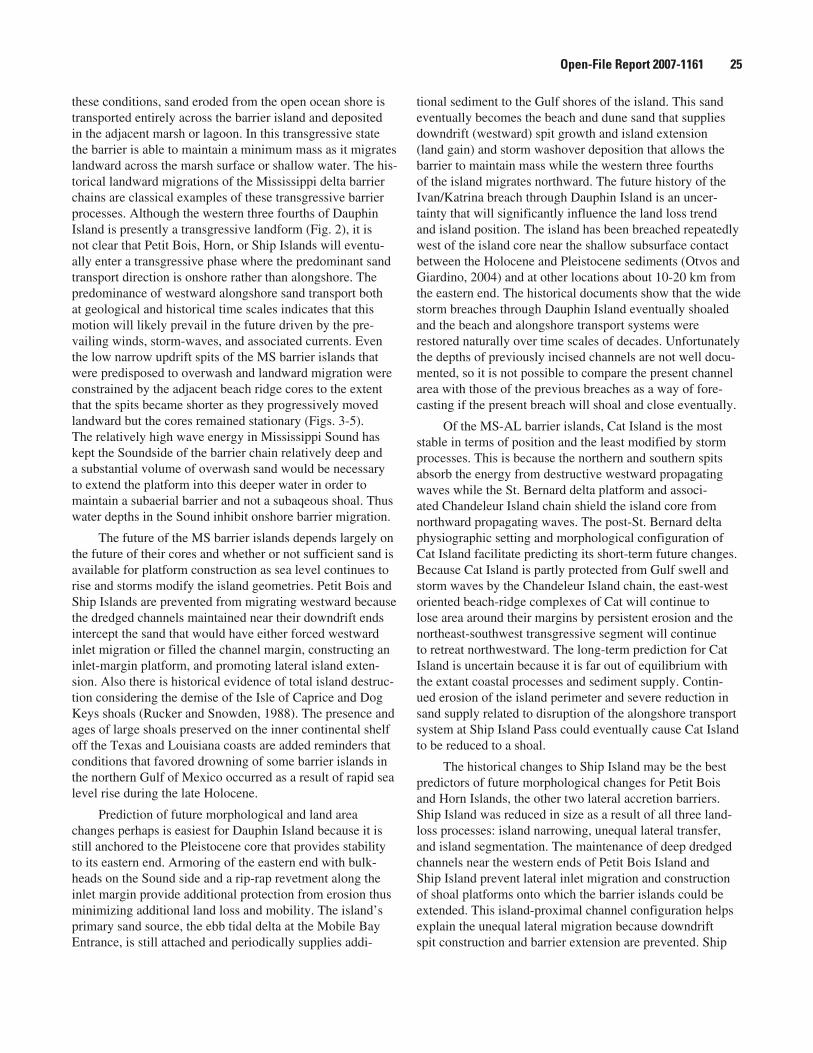
Open-File Report 2007-1161 2�
these conditions, sand eroded from the open ocean shore is transported entirely across the barrier island and deposited in the adjacent marsh or lagoon. In this transgressive state the barrier is able to maintain a minimum mass as it migrates landward across the marsh surface or shallow water. The his-torical landward migrations of the Mississippi delta barrier chains are classical examples of these transgressive barrier processes. Although the western three fourths of Dauphin Island is presently a transgressive landform (Fig. 2), it is not clear that Petit Bois, Horn, or Ship Islands will eventu-ally enter a transgressive phase where the predominant sand transport direction is onshore rather than alongshore. The predominance of westward alongshore sand transport both at geological and historical time scales indicates that this motion will likely prevail in the future driven by the pre-vailing winds, storm-waves, and associated currents. Even the low narrow updrift spits of the MS barrier islands that were predisposed to overwash and landward migration were constrained by the adjacent beach ridge cores to the extent that the spits became shorter as they progressively moved landward but the cores remained stationary (Figs. 3-5). The relatively high wave energy in Mississippi Sound has kept the Soundside of the barrier chain relatively deep and a substantial volume of overwash sand would be necessary to extend the platform into this deeper water in order to maintain a subaerial barrier and not a subaqeous shoal. Thus water depths in the Sound inhibit onshore barrier migration.
The future of the MS barrier islands depends largely on the future of their cores and whether or not sufficient sand is available for platform construction as sea level continues to rise and storms modify the island geometries. Petit Bois and Ship Islands are prevented from migrating westward because the dredged channels maintained near their downdrift ends intercept the sand that would have either forced westward inlet migration or filled the channel margin, constructing an inlet-margin platform, and promoting lateral island exten-sion. Also there is historical evidence of total island destruc-tion considering the demise of the Isle of Caprice and Dog Keys shoals (Rucker and Snowden, 1988). The presence and ages of large shoals preserved on the inner continental shelf off the Texas and Louisiana coasts are added reminders that conditions that favored drowning of some barrier islands in the northern Gulf of Mexico occurred as a result of rapid sea level rise during the late Holocene.
Prediction of future morphological and land area changes perhaps is easiest for Dauphin Island because it is still anchored to the Pleistocene core that provides stability to its eastern end. Armoring of the eastern end with bulk-heads on the Sound side and a rip-rap revetment along the inlet margin provide additional protection from erosion thus minimizing additional land loss and mobility. The island’s primary sand source, the ebb tidal delta at the Mobile Bay Entrance, is still attached and periodically supplies addi-
tional sediment to the Gulf shores of the island. This sand eventually becomes the beach and dune sand that supplies downdrift (westward) spit growth and island extension (land gain) and storm washover deposition that allows the barrier to maintain mass while the western three fourths of the island migrates northward. The future history of the Ivan/Katrina breach through Dauphin Island is an uncer-tainty that will significantly influence the land loss trend and island position. The island has been breached repeatedly west of the island core near the shallow subsurface contact between the Holocene and Pleistocene sediments (Otvos and Giardino, 2004) and at other locations about 10-20 km from the eastern end. The historical documents show that the wide storm breaches through Dauphin Island eventually shoaled and the beach and alongshore transport systems were restored naturally over time scales of decades. Unfortunately the depths of previously incised channels are not well docu-mented, so it is not possible to compare the present channel area with those of the previous breaches as a way of fore-casting if the present breach will shoal and close eventually.
Of the MS-AL barrier islands, Cat Island is the most stable in terms of position and the least modified by storm processes. This is because the northern and southern spits absorb the energy from destructive westward propagating waves while the St. Bernard delta platform and associ-ated Chandeleur Island chain shield the island core from northward propagating waves. The post-St. Bernard delta physiographic setting and morphological configuration of Cat Island facilitate predicting its short-term future changes. Because Cat Island is partly protected from Gulf swell and storm waves by the Chandeleur Island chain, the east-west oriented beach-ridge complexes of Cat will continue to lose area around their margins by persistent erosion and the northeast-southwest transgressive segment will continue to retreat northwestward. The long-term prediction for Cat Island is uncertain because it is far out of equilibrium with the extant coastal processes and sediment supply. Contin-ued erosion of the island perimeter and severe reduction in sand supply related to disruption of the alongshore transport system at Ship Island Pass could eventually cause Cat Island to be reduced to a shoal.
The historical changes to Ship Island may be the best predictors of future morphological changes for Petit Bois and Horn Islands, the other two lateral accretion barriers. Ship Island was reduced in size as a result of all three land-loss processes: island narrowing, unequal lateral transfer, and island segmentation. The maintenance of deep dredged channels near the western ends of Petit Bois Island and Ship Island prevent lateral inlet migration and construction of shoal platforms onto which the barrier islands could be extended. This island-proximal channel configuration helps explain the unequal lateral migration because downdrift spit construction and barrier extension are prevented. Ship
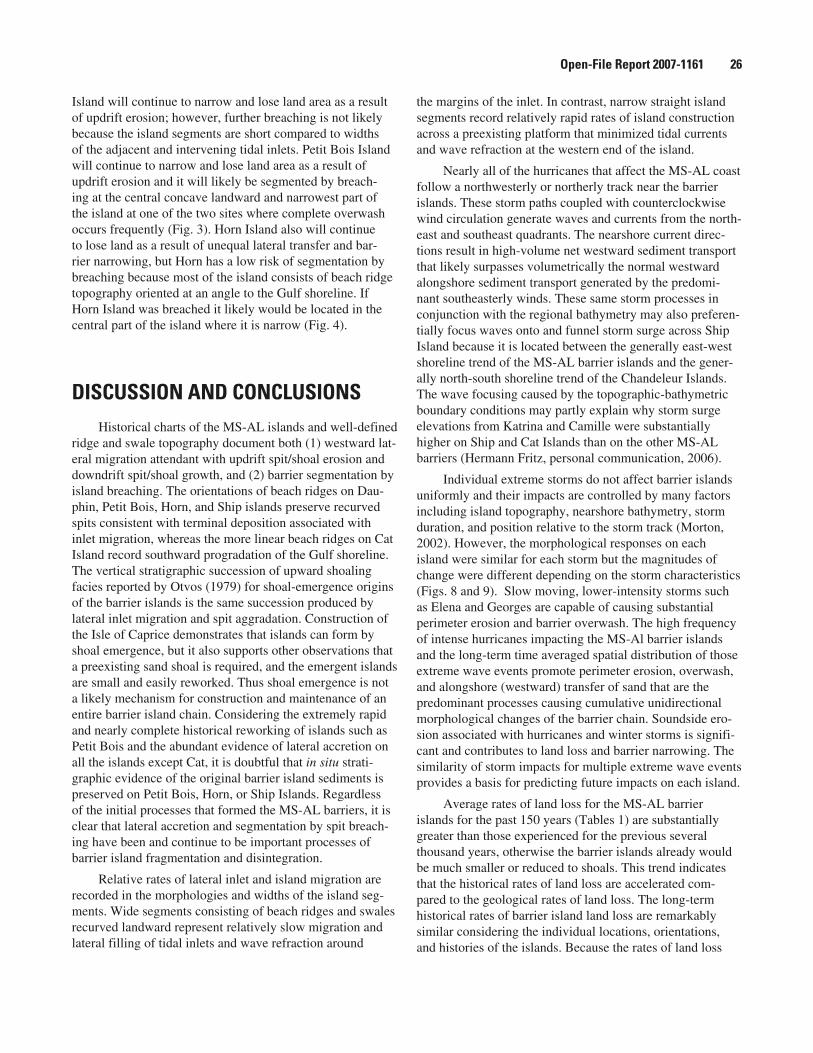
Open-File Report 2007-1161 26
Island will continue to narrow and lose land area as a result of updrift erosion; however, further breaching is not likely because the island segments are short compared to widths of the adjacent and intervening tidal inlets. Petit Bois Island will continue to narrow and lose land area as a result of updrift erosion and it will likely be segmented by breach-ing at the central concave landward and narrowest part of the island at one of the two sites where complete overwash occurs frequently (Fig. 3). Horn Island also will continue to lose land as a result of unequal lateral transfer and bar-rier narrowing, but Horn has a low risk of segmentation by breaching because most of the island consists of beach ridge topography oriented at an angle to the Gulf shoreline. If Horn Island was breached it likely would be located in the central part of the island where it is narrow (Fig. 4).
DISCUSSION AND CONCLUSIONSHistorical charts of the MS-AL islands and well-defined
ridge and swale topography document both (1) westward lat-eral migration attendant with updrift spit/shoal erosion and downdrift spit/shoal growth, and (2) barrier segmentation by island breaching. The orientations of beach ridges on Dau-phin, Petit Bois, Horn, and Ship islands preserve recurved spits consistent with terminal deposition associated with inlet migration, whereas the more linear beach ridges on Cat Island record southward progradation of the Gulf shoreline. The vertical stratigraphic succession of upward shoaling facies reported by Otvos (1979) for shoal-emergence origins of the barrier islands is the same succession produced by lateral inlet migration and spit aggradation. Construction of the Isle of Caprice demonstrates that islands can form by shoal emergence, but it also supports other observations that a preexisting sand shoal is required, and the emergent islands are small and easily reworked. Thus shoal emergence is not a likely mechanism for construction and maintenance of an entire barrier island chain. Considering the extremely rapid and nearly complete historical reworking of islands such as Petit Bois and the abundant evidence of lateral accretion on all the islands except Cat, it is doubtful that in situ strati-graphic evidence of the original barrier island sediments is preserved on Petit Bois, Horn, or Ship Islands. Regardless of the initial processes that formed the MS-AL barriers, it is clear that lateral accretion and segmentation by spit breach-ing have been and continue to be important processes of barrier island fragmentation and disintegration.
Relative rates of lateral inlet and island migration are recorded in the morphologies and widths of the island seg-ments. Wide segments consisting of beach ridges and swales recurved landward represent relatively slow migration and lateral filling of tidal inlets and wave refraction around
the margins of the inlet. In contrast, narrow straight island segments record relatively rapid rates of island construction across a preexisting platform that minimized tidal currents and wave refraction at the western end of the island.
Nearly all of the hurricanes that affect the MS-AL coast follow a northwesterly or northerly track near the barrier islands. These storm paths coupled with counterclockwise wind circulation generate waves and currents from the north-east and southeast quadrants. The nearshore current direc-tions result in high-volume net westward sediment transport that likely surpasses volumetrically the normal westward alongshore sediment transport generated by the predomi-nant southeasterly winds. These same storm processes in conjunction with the regional bathymetry may also preferen-tially focus waves onto and funnel storm surge across Ship Island because it is located between the generally east-west shoreline trend of the MS-AL barrier islands and the gener-ally north-south shoreline trend of the Chandeleur Islands. The wave focusing caused by the topographic-bathymetric boundary conditions may partly explain why storm surge elevations from Katrina and Camille were substantially higher on Ship and Cat Islands than on the other MS-AL barriers (Hermann Fritz, personal communication, 2006).
Individual extreme storms do not affect barrier islands uniformly and their impacts are controlled by many factors including island topography, nearshore bathymetry, storm duration, and position relative to the storm track (Morton, 2002). However, the morphological responses on each island were similar for each storm but the magnitudes of change were different depending on the storm characteristics (Figs. 8 and 9). Slow moving, lower-intensity storms such as Elena and Georges are capable of causing substantial perimeter erosion and barrier overwash. The high frequency of intense hurricanes impacting the MS-Al barrier islands and the long-term time averaged spatial distribution of those extreme wave events promote perimeter erosion, overwash, and alongshore (westward) transfer of sand that are the predominant processes causing cumulative unidirectional morphological changes of the barrier chain. Soundside ero-sion associated with hurricanes and winter storms is signifi-cant and contributes to land loss and barrier narrowing. The similarity of storm impacts for multiple extreme wave events provides a basis for predicting future impacts on each island.
Average rates of land loss for the MS-AL barrier islands for the past 150 years (Tables 1) are substantially greater than those experienced for the previous several thousand years, otherwise the barrier islands already would be much smaller or reduced to shoals. This trend indicates that the historical rates of land loss are accelerated com-pared to the geological rates of land loss. The long-term historical rates of barrier island land loss are remarkably similar considering the individual locations, orientations, and histories of the islands. Because the rates of land loss
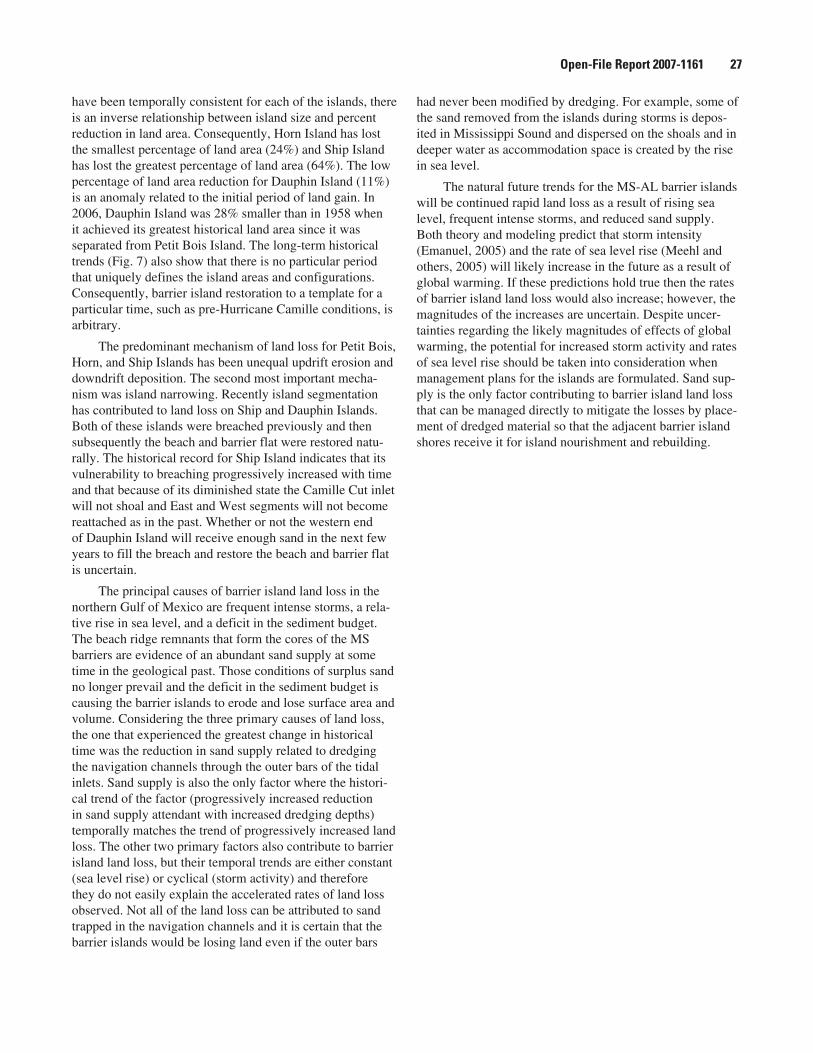
Open-File Report 2007-1161 27
have been temporally consistent for each of the islands, there is an inverse relationship between island size and percent reduction in land area. Consequently, Horn Island has lost the smallest percentage of land area (24%) and Ship Island has lost the greatest percentage of land area (64%). The low percentage of land area reduction for Dauphin Island (11%) is an anomaly related to the initial period of land gain. In 2006, Dauphin Island was 28% smaller than in 1958 when it achieved its greatest historical land area since it was separated from Petit Bois Island. The long-term historical trends (Fig. 7) also show that there is no particular period that uniquely defines the island areas and configurations. Consequently, barrier island restoration to a template for a particular time, such as pre-Hurricane Camille conditions, is arbitrary.
The predominant mechanism of land loss for Petit Bois, Horn, and Ship Islands has been unequal updrift erosion and downdrift deposition. The second most important mecha-nism was island narrowing. Recently island segmentation has contributed to land loss on Ship and Dauphin Islands. Both of these islands were breached previously and then subsequently the beach and barrier flat were restored natu-rally. The historical record for Ship Island indicates that its vulnerability to breaching progressively increased with time and that because of its diminished state the Camille Cut inlet will not shoal and East and West segments will not become reattached as in the past. Whether or not the western end of Dauphin Island will receive enough sand in the next few years to fill the breach and restore the beach and barrier flat is uncertain.
The principal causes of barrier island land loss in the northern Gulf of Mexico are frequent intense storms, a rela-tive rise in sea level, and a deficit in the sediment budget. The beach ridge remnants that form the cores of the MS barriers are evidence of an abundant sand supply at some time in the geological past. Those conditions of surplus sand no longer prevail and the deficit in the sediment budget is causing the barrier islands to erode and lose surface area and volume. Considering the three primary causes of land loss, the one that experienced the greatest change in historical time was the reduction in sand supply related to dredging the navigation channels through the outer bars of the tidal inlets. Sand supply is also the only factor where the histori-cal trend of the factor (progressively increased reduction in sand supply attendant with increased dredging depths) temporally matches the trend of progressively increased land loss. The other two primary factors also contribute to barrier island land loss, but their temporal trends are either constant (sea level rise) or cyclical (storm activity) and therefore they do not easily explain the accelerated rates of land loss observed. Not all of the land loss can be attributed to sand trapped in the navigation channels and it is certain that the barrier islands would be losing land even if the outer bars
had never been modified by dredging. For example, some of the sand removed from the islands during storms is depos-ited in Mississippi Sound and dispersed on the shoals and in deeper water as accommodation space is created by the rise in sea level.
The natural future trends for the MS-AL barrier islands will be continued rapid land loss as a result of rising sea level, frequent intense storms, and reduced sand supply. Both theory and modeling predict that storm intensity (Emanuel, 2005) and the rate of sea level rise (Meehl and others, 2005) will likely increase in the future as a result of global warming. If these predictions hold true then the rates of barrier island land loss would also increase; however, the magnitudes of the increases are uncertain. Despite uncer-tainties regarding the likely magnitudes of effects of global warming, the potential for increased storm activity and rates of sea level rise should be taken into consideration when management plans for the islands are formulated. Sand sup-ply is the only factor contributing to barrier island land loss that can be managed directly to mitigate the losses by place-ment of dredged material so that the adjacent barrier island shores receive it for island nourishment and rebuilding.
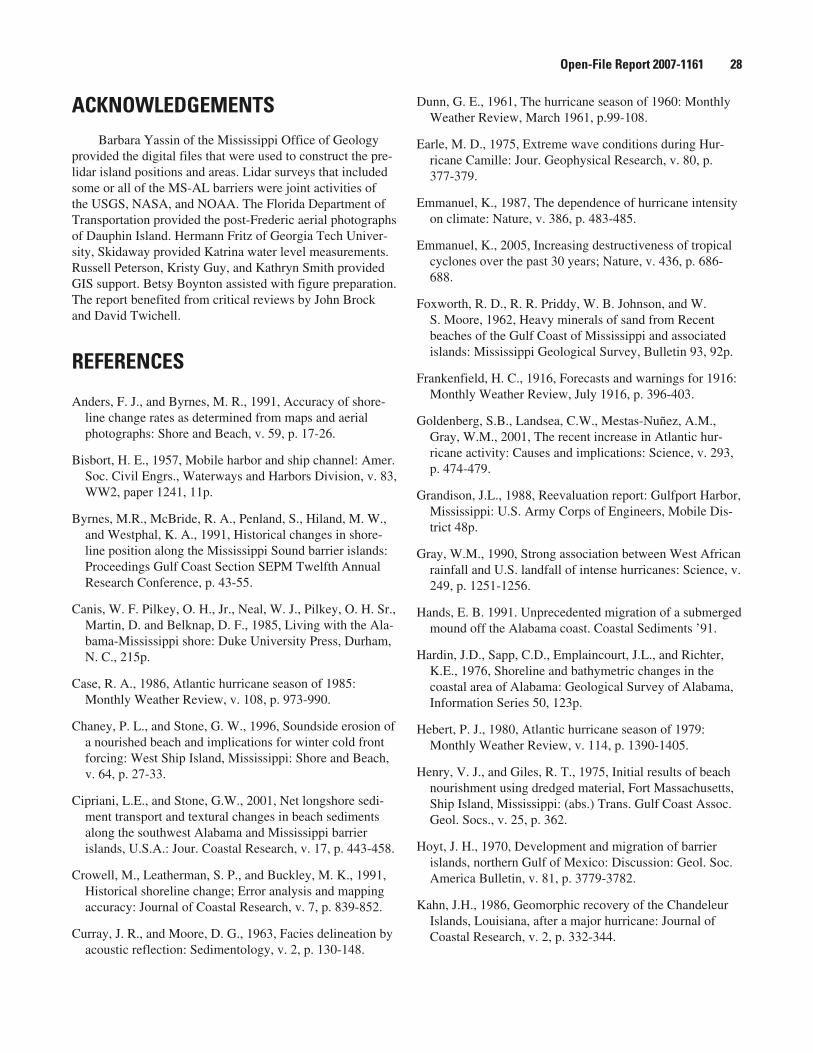
Open-File Report 2007-1161 2�
ACKNOWLEDGEMENTSBarbara Yassin of the Mississippi Office of Geology
provided the digital files that were used to construct the pre-lidar island positions and areas. Lidar surveys that included some or all of the MS-AL barriers were joint activities of the USGS, NASA, and NOAA. The Florida Department of Transportation provided the post-Frederic aerial photographs of Dauphin Island. Hermann Fritz of Georgia Tech Univer-sity, Skidaway provided Katrina water level measurements. Russell Peterson, Kristy Guy, and Kathryn Smith provided GIS support. Betsy Boynton assisted with figure preparation. The report benefited from critical reviews by John Brock and David Twichell.
REFERENCES
Anders, F. J., and Byrnes, M. R., 1991, Accuracy of shore-line change rates as determined from maps and aerial photographs: Shore and Beach, v. 59, p. 17-26.
Bisbort, H. E., 1957, Mobile harbor and ship channel: Amer. Soc. Civil Engrs., Waterways and Harbors Division, v. 83, WW2, paper 1241, 11p.
Byrnes, M.R., McBride, R. A., Penland, S., Hiland, M. W., and Westphal, K. A., 1991, Historical changes in shore-line position along the Mississippi Sound barrier islands: Proceedings Gulf Coast Section SEPM Twelfth Annual Research Conference, p. 43-55.
Canis, W. F. Pilkey, O. H., Jr., Neal, W. J., Pilkey, O. H. Sr., Martin, D. and Belknap, D. F., 1985, Living with the Ala-bama-Mississippi shore: Duke University Press, Durham, N. C., 215p.
Case, R. A., 1986, Atlantic hurricane season of 1985: Monthly Weather Review, v. 108, p. 973-990.
Chaney, P. L., and Stone, G. W., 1996, Soundside erosion of a nourished beach and implications for winter cold front forcing: West Ship Island, Mississippi: Shore and Beach, v. 64, p. 27-33.
Cipriani, L.E., and Stone, G.W., 2001, Net longshore sedi-ment transport and textural changes in beach sediments along the southwest Alabama and Mississippi barrier islands, U.S.A.: Jour. Coastal Research, v. 17, p. 443-458.
Crowell, M., Leatherman, S. P., and Buckley, M. K., 1991, Historical shoreline change; Error analysis and mapping accuracy: Journal of Coastal Research, v. 7, p. 839-852.
Curray, J. R., and Moore, D. G., 1963, Facies delineation by acoustic reflection: Sedimentology, v. 2, p. 130-148.
Dunn, G. E., 1961, The hurricane season of 1960: Monthly Weather Review, March 1961, p.99-108.
Earle, M. D., 1975, Extreme wave conditions during Hur-ricane Camille: Jour. Geophysical Research, v. 80, p. 377-379.
Emmanuel, K., 1987, The dependence of hurricane intensity on climate: Nature, v. 386, p. 483-485.
Emmanuel, K., 2005, Increasing destructiveness of tropical cyclones over the past 30 years; Nature, v. 436, p. 686-688.
Foxworth, R. D., R. R. Priddy, W. B. Johnson, and W. S. Moore, 1962, Heavy minerals of sand from Recent beaches of the Gulf Coast of Mississippi and associated islands: Mississippi Geological Survey, Bulletin 93, 92p.
Frankenfield, H. C., 1916, Forecasts and warnings for 1916: Monthly Weather Review, July 1916, p. 396-403.
Goldenberg, S.B., Landsea, C.W., Mestas-Nuñez, A.M., Gray, W.M., 2001, The recent increase in Atlantic hur-ricane activity: Causes and implications: Science, v. 293, p. 474-479.
Grandison, J.L., 1988, Reevaluation report: Gulfport Harbor, Mississippi: U.S. Army Corps of Engineers, Mobile Dis-trict 48p.
Gray, W.M., 1990, Strong association between West African rainfall and U.S. landfall of intense hurricanes: Science, v. 249, p. 1251-1256.
Hands, E. B. 1991. Unprecedented migration of a submerged mound off the Alabama coast. Coastal Sediments ’91.
Hardin, J.D., Sapp, C.D., Emplaincourt, J.L., and Richter, K.E., 1976, Shoreline and bathymetric changes in the coastal area of Alabama: Geological Survey of Alabama, Information Series 50, 123p.
Hebert, P. J., 1980, Atlantic hurricane season of 1979: Monthly Weather Review, v. 114, p. 1390-1405.
Henry, V. J., and Giles, R. T., 1975, Initial results of beach nourishment using dredged material, Fort Massachusetts, Ship Island, Mississippi: (abs.) Trans. Gulf Coast Assoc. Geol. Socs., v. 25, p. 362.
Hoyt, J. H., 1970, Development and migration of barrier islands, northern Gulf of Mexico: Discussion: Geol. Soc. America Bulletin, v. 81, p. 3779-3782.
Kahn, J.H., 1986, Geomorphic recovery of the Chandeleur Islands, Louisiana, after a major hurricane: Journal of Coastal Research, v. 2, p. 332-344.
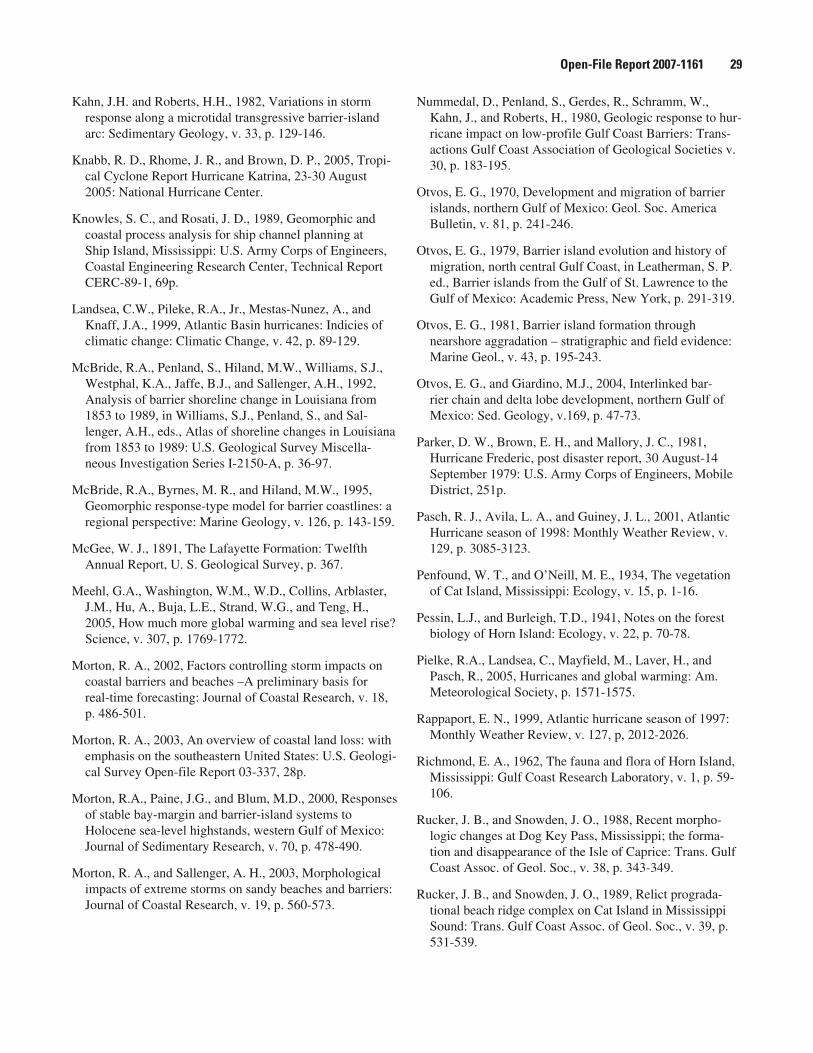
Open-File Report 2007-1161 2�
Kahn, J.H. and Roberts, H.H., 1982, Variations in storm response along a microtidal transgressive barrier-island arc: Sedimentary Geology, v. 33, p. 129-146.
Knabb, R. D., Rhome, J. R., and Brown, D. P., 2005, Tropi-cal Cyclone Report Hurricane Katrina, 23-30 August 2005: National Hurricane Center.
Knowles, S. C., and Rosati, J. D., 1989, Geomorphic and coastal process analysis for ship channel planning at Ship Island, Mississippi: U.S. Army Corps of Engineers, Coastal Engineering Research Center, Technical Report CERC-89-1, 69p.
Landsea, C.W., Pileke, R.A., Jr., Mestas-Nunez, A., and Knaff, J.A., 1999, Atlantic Basin hurricanes: Indicies of climatic change: Climatic Change, v. 42, p. 89-129.
McBride, R.A., Penland, S., Hiland, M.W., Williams, S.J., Westphal, K.A., Jaffe, B.J., and Sallenger, A.H., 1992, Analysis of barrier shoreline change in Louisiana from 1853 to 1989, in Williams, S.J., Penland, S., and Sal-lenger, A.H., eds., Atlas of shoreline changes in Louisiana from 1853 to 1989: U.S. Geological Survey Miscella-neous Investigation Series I-2150-A, p. 36-97.
McBride, R.A., Byrnes, M. R., and Hiland, M.W., 1995, Geomorphic response-type model for barrier coastlines: a regional perspective: Marine Geology, v. 126, p. 143-159.
McGee, W. J., 1891, The Lafayette Formation: Twelfth Annual Report, U. S. Geological Survey, p. 367.
Meehl, G.A., Washington, W.M., W.D., Collins, Arblaster, J.M., Hu, A., Buja, L.E., Strand, W.G., and Teng, H., 2005, How much more global warming and sea level rise? Science, v. 307, p. 1769-1772.
Morton, R. A., 2002, Factors controlling storm impacts on coastal barriers and beaches –A preliminary basis for real-time forecasting: Journal of Coastal Research, v. 18, p. 486-501.
Morton, R. A., 2003, An overview of coastal land loss: with emphasis on the southeastern United States: U.S. Geologi-cal Survey Open-file Report 03-337, 28p.
Morton, R.A., Paine, J.G., and Blum, M.D., 2000, Responses of stable bay-margin and barrier-island systems to Holocene sea-level highstands, western Gulf of Mexico: Journal of Sedimentary Research, v. 70, p. 478-490.
Morton, R. A., and Sallenger, A. H., 2003, Morphological impacts of extreme storms on sandy beaches and barriers: Journal of Coastal Research, v. 19, p. 560-573.
Nummedal, D., Penland, S., Gerdes, R., Schramm, W., Kahn, J., and Roberts, H., 1980, Geologic response to hur-ricane impact on low-profile Gulf Coast Barriers: Trans-actions Gulf Coast Association of Geological Societies v. 30, p. 183-195.
Otvos, E. G., 1970, Development and migration of barrier islands, northern Gulf of Mexico: Geol. Soc. America Bulletin, v. 81, p. 241-246.
Otvos, E. G., 1979, Barrier island evolution and history of migration, north central Gulf Coast, in Leatherman, S. P. ed., Barrier islands from the Gulf of St. Lawrence to the Gulf of Mexico: Academic Press, New York, p. 291-319.
Otvos, E. G., 1981, Barrier island formation through nearshore aggradation – stratigraphic and field evidence: Marine Geol., v. 43, p. 195-243.
Otvos, E. G., and Giardino, M.J., 2004, Interlinked bar-rier chain and delta lobe development, northern Gulf of Mexico: Sed. Geology, v.169, p. 47-73.
Parker, D. W., Brown, E. H., and Mallory, J. C., 1981, Hurricane Frederic, post disaster report, 30 August-14 September 1979: U.S. Army Corps of Engineers, Mobile District, 251p.
Pasch, R. J., Avila, L. A., and Guiney, J. L., 2001, Atlantic Hurricane season of 1998: Monthly Weather Review, v. 129, p. 3085-3123.
Penfound, W. T., and O’Neill, M. E., 1934, The vegetation of Cat Island, Mississippi: Ecology, v. 15, p. 1-16.
Pessin, L.J., and Burleigh, T.D., 1941, Notes on the forest biology of Horn Island: Ecology, v. 22, p. 70-78.
Pielke, R.A., Landsea, C., Mayfield, M., Laver, H., and Pasch, R., 2005, Hurricanes and global warming: Am. Meteorological Society, p. 1571-1575.
Rappaport, E. N., 1999, Atlantic hurricane season of 1997: Monthly Weather Review, v. 127, p, 2012-2026.
Richmond, E. A., 1962, The fauna and flora of Horn Island, Mississippi: Gulf Coast Research Laboratory, v. 1, p. 59-106.
Rucker, J. B., and Snowden, J. O., 1988, Recent morpho-logic changes at Dog Key Pass, Mississippi; the forma-tion and disappearance of the Isle of Caprice: Trans. Gulf Coast Assoc. of Geol. Soc., v. 38, p. 343-349.
Rucker, J. B., and Snowden, J. O., 1989, Relict prograda-tional beach ridge complex on Cat Island in Mississippi Sound: Trans. Gulf Coast Assoc. of Geol. Soc., v. 39, p. 531-539.
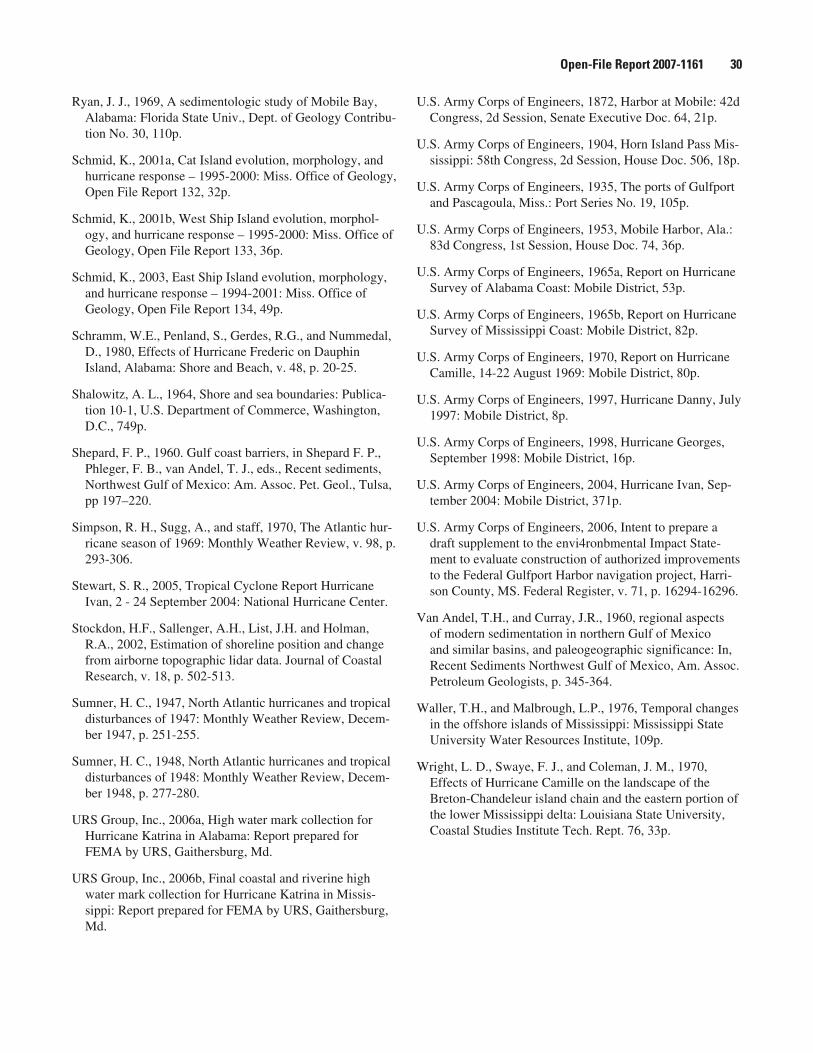
Open-File Report 2007-1161 �0
Ryan, J. J., 1969, A sedimentologic study of Mobile Bay, Alabama: Florida State Univ., Dept. of Geology Contribu-tion No. 30, 110p.
Schmid, K., 2001a, Cat Island evolution, morphology, and hurricane response – 1995-2000: Miss. Office of Geology, Open File Report 132, 32p.
Schmid, K., 2001b, West Ship Island evolution, morphol-ogy, and hurricane response – 1995-2000: Miss. Office of Geology, Open File Report 133, 36p.
Schmid, K., 2003, East Ship Island evolution, morphology, and hurricane response – 1994-2001: Miss. Office of Geology, Open File Report 134, 49p.
Schramm, W.E., Penland, S., Gerdes, R.G., and Nummedal, D., 1980, Effects of Hurricane Frederic on Dauphin Island, Alabama: Shore and Beach, v. 48, p. 20-25.
Shalowitz, A. L., 1964, Shore and sea boundaries: Publica-tion 10-1, U.S. Department of Commerce, Washington, D.C., 749p.
Shepard, F. P., 1960. Gulf coast barriers, in Shepard F. P., Phleger, F. B., van Andel, T. J., eds., Recent sediments, Northwest Gulf of Mexico: Am. Assoc. Pet. Geol., Tulsa, pp 197–220.
Simpson, R. H., Sugg, A., and staff, 1970, The Atlantic hur-ricane season of 1969: Monthly Weather Review, v. 98, p. 293-306.
Stewart, S. R., 2005, Tropical Cyclone Report Hurricane Ivan, 2 - 24 September 2004: National Hurricane Center.
Stockdon, H.F., Sallenger, A.H., List, J.H. and Holman, R.A., 2002, Estimation of shoreline position and change from airborne topographic lidar data. Journal of Coastal Research, v. 18, p. 502-513.
Sumner, H. C., 1947, North Atlantic hurricanes and tropical disturbances of 1947: Monthly Weather Review, Decem-ber 1947, p. 251-255.
Sumner, H. C., 1948, North Atlantic hurricanes and tropical disturbances of 1948: Monthly Weather Review, Decem-ber 1948, p. 277-280.
URS Group, Inc., 2006a, High water mark collection for Hurricane Katrina in Alabama: Report prepared for FEMA by URS, Gaithersburg, Md.
URS Group, Inc., 2006b, Final coastal and riverine high water mark collection for Hurricane Katrina in Missis-sippi: Report prepared for FEMA by URS, Gaithersburg, Md.
U.S. Army Corps of Engineers, 1872, Harbor at Mobile: 42d Congress, 2d Session, Senate Executive Doc. 64, 21p.
U.S. Army Corps of Engineers, 1904, Horn Island Pass Mis-sissippi: 58th Congress, 2d Session, House Doc. 506, 18p.
U.S. Army Corps of Engineers, 1935, The ports of Gulfport and Pascagoula, Miss.: Port Series No. 19, 105p.
U.S. Army Corps of Engineers, 1953, Mobile Harbor, Ala.: 83d Congress, 1st Session, House Doc. 74, 36p.
U.S. Army Corps of Engineers, 1965a, Report on Hurricane Survey of Alabama Coast: Mobile District, 53p.
U.S. Army Corps of Engineers, 1965b, Report on Hurricane Survey of Mississippi Coast: Mobile District, 82p.
U.S. Army Corps of Engineers, 1970, Report on Hurricane Camille, 14-22 August 1969: Mobile District, 80p.
U.S. Army Corps of Engineers, 1997, Hurricane Danny, July 1997: Mobile District, 8p.
U.S. Army Corps of Engineers, 1998, Hurricane Georges, September 1998: Mobile District, 16p.
U.S. Army Corps of Engineers, 2004, Hurricane Ivan, Sep-tember 2004: Mobile District, 371p.
U.S. Army Corps of Engineers, 2006, Intent to prepare a draft supplement to the envi4ronbmental Impact State-ment to evaluate construction of authorized improvements to the Federal Gulfport Harbor navigation project, Harri-son County, MS. Federal Register, v. 71, p. 16294-16296.
Van Andel, T.H., and Curray, J.R., 1960, regional aspects of modern sedimentation in northern Gulf of Mexico and similar basins, and paleogeographic significance: In, Recent Sediments Northwest Gulf of Mexico, Am. Assoc. Petroleum Geologists, p. 345-364.
Waller, T.H., and Malbrough, L.P., 1976, Temporal changes in the offshore islands of Mississippi: Mississippi State University Water Resources Institute, 109p.
Wright, L. D., Swaye, F. J., and Coleman, J. M., 1970, Effects of Hurricane Camille on the landscape of the Breton-Chandeleur island chain and the eastern portion of the lower Mississippi delta: Louisiana State University, Coastal Studies Institute Tech. Rept. 76, 33p.
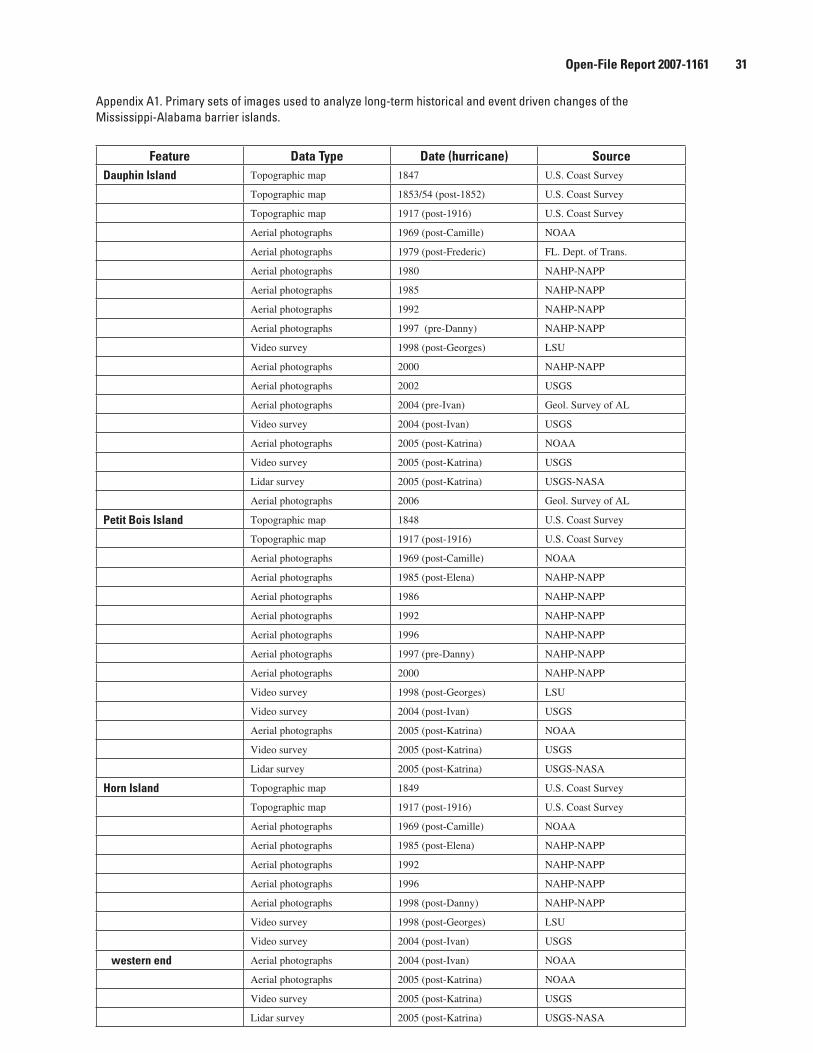
Open-File Report 2007-1161 �1
Appendix A1. Primary sets of images used to analyze long-term historical and event driven changes of the Mississippi-Alabama barrier islands.
Feature Data Type Date (hurricane) SourceDauphin Island Topographic map 1847 U.S. Coast Survey
Topographic map 1853/54 (post-1852) U.S. Coast Survey
Topographic map 1917 (post-1916) U.S. Coast Survey
Aerial photographs 1969 (post-Camille) NOAA
Aerial photographs 1979 (post-Frederic) FL. Dept. of Trans.
Aerial photographs 1980 NAHP-NAPP
Aerial photographs 1985 NAHP-NAPP
Aerial photographs 1992 NAHP-NAPP
Aerial photographs 1997 (pre-Danny) NAHP-NAPP
Video survey 1998 (post-Georges) LSU
Aerial photographs 2000 NAHP-NAPP
Aerial photographs 2002 USGS
Aerial photographs 2004 (pre-Ivan) Geol. Survey of AL
Video survey 2004 (post-Ivan) USGS
Aerial photographs 2005 (post-Katrina) NOAA
Video survey 2005 (post-Katrina) USGS
Lidar survey 2005 (post-Katrina) USGS-NASA
Aerial photographs 2006 Geol. Survey of AL
Petit Bois Island Topographic map 1848 U.S. Coast Survey
Topographic map 1917 (post-1916) U.S. Coast Survey
Aerial photographs 1969 (post-Camille) NOAA
Aerial photographs 1985 (post-Elena) NAHP-NAPP
Aerial photographs 1986 NAHP-NAPP
Aerial photographs 1992 NAHP-NAPP
Aerial photographs 1996 NAHP-NAPP
Aerial photographs 1997 (pre-Danny) NAHP-NAPP
Aerial photographs 2000 NAHP-NAPP
Video survey 1998 (post-Georges) LSU
Video survey 2004 (post-Ivan) USGS
Aerial photographs 2005 (post-Katrina) NOAA
Video survey 2005 (post-Katrina) USGS
Lidar survey 2005 (post-Katrina) USGS-NASA
Horn Island Topographic map 1849 U.S. Coast Survey
Topographic map 1917 (post-1916) U.S. Coast Survey
Aerial photographs 1969 (post-Camille) NOAA
Aerial photographs 1985 (post-Elena) NAHP-NAPP
Aerial photographs 1992 NAHP-NAPP
Aerial photographs 1996 NAHP-NAPP
Aerial photographs 1998 (post-Danny) NAHP-NAPP
Video survey 1998 (post-Georges) LSU
Video survey 2004 (post-Ivan) USGS
western end Aerial photographs 2004 (post-Ivan) NOAA
Aerial photographs 2005 (post-Katrina) NOAA
Video survey 2005 (post-Katrina) USGS
Lidar survey 2005 (post-Katrina) USGS-NASA
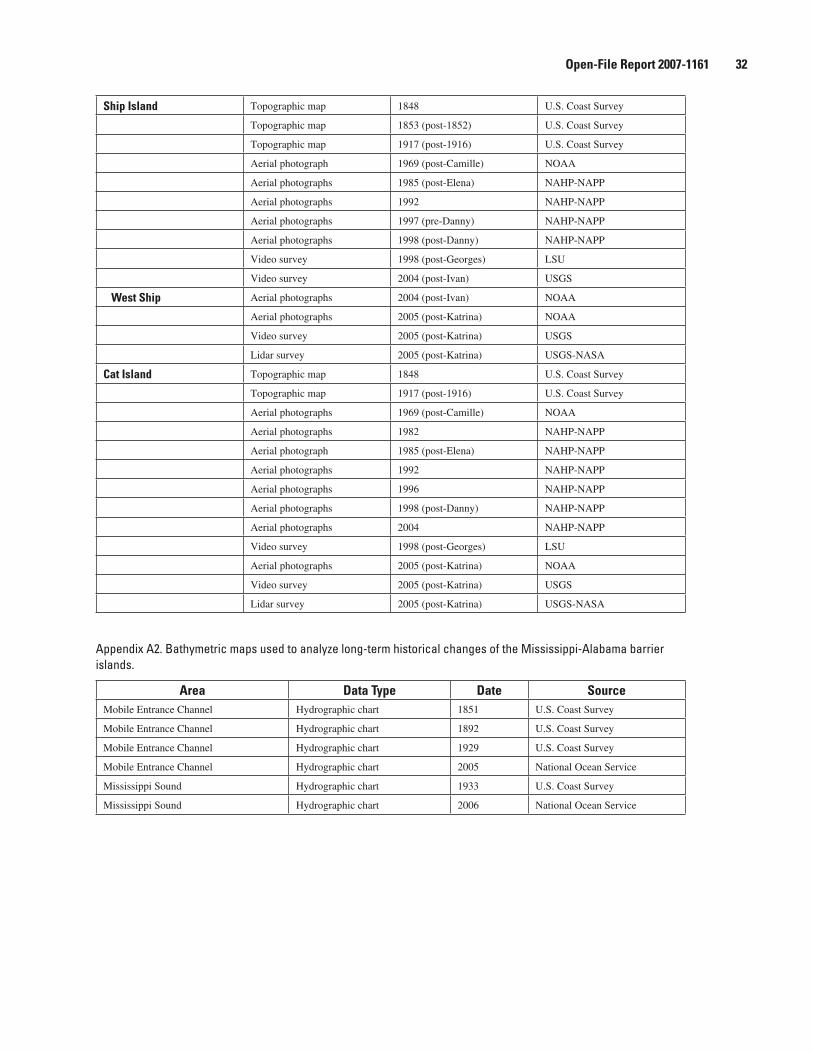
Open-File Report 2007-1161 �2
Ship Island Topographic map 1848 U.S. Coast Survey
Topographic map 1853 (post-1852) U.S. Coast Survey
Topographic map 1917 (post-1916) U.S. Coast Survey
Aerial photograph 1969 (post-Camille) NOAA
Aerial photographs 1985 (post-Elena) NAHP-NAPP
Aerial photographs 1992 NAHP-NAPP
Aerial photographs 1997 (pre-Danny) NAHP-NAPP
Aerial photographs 1998 (post-Danny) NAHP-NAPP
Video survey 1998 (post-Georges) LSU
Video survey 2004 (post-Ivan) USGS
West Ship Aerial photographs 2004 (post-Ivan) NOAA
Aerial photographs 2005 (post-Katrina) NOAA
Video survey 2005 (post-Katrina) USGS
Lidar survey 2005 (post-Katrina) USGS-NASA
Cat Island Topographic map 1848 U.S. Coast Survey
Topographic map 1917 (post-1916) U.S. Coast Survey
Aerial photographs 1969 (post-Camille) NOAA
Aerial photographs 1982 NAHP-NAPP
Aerial photograph 1985 (post-Elena) NAHP-NAPP
Aerial photographs 1992 NAHP-NAPP
Aerial photographs 1996 NAHP-NAPP
Aerial photographs 1998 (post-Danny) NAHP-NAPP
Aerial photographs 2004 NAHP-NAPP
Video survey 1998 (post-Georges) LSU
Aerial photographs 2005 (post-Katrina) NOAA
Video survey 2005 (post-Katrina) USGS
Lidar survey 2005 (post-Katrina) USGS-NASA
Appendix A2. Bathymetric maps used to analyze long-term historical changes of the Mississippi-Alabama barrier islands.
Area Data Type Date SourceMobile Entrance Channel Hydrographic chart 1851 U.S. Coast Survey
Mobile Entrance Channel Hydrographic chart 1892 U.S. Coast Survey
Mobile Entrance Channel Hydrographic chart 1929 U.S. Coast Survey
Mobile Entrance Channel Hydrographic chart 2005 National Ocean Service
Mississippi Sound Hydrographic chart 1933 U.S. Coast Survey
Mississippi Sound Hydrographic chart 2006 National Ocean Service
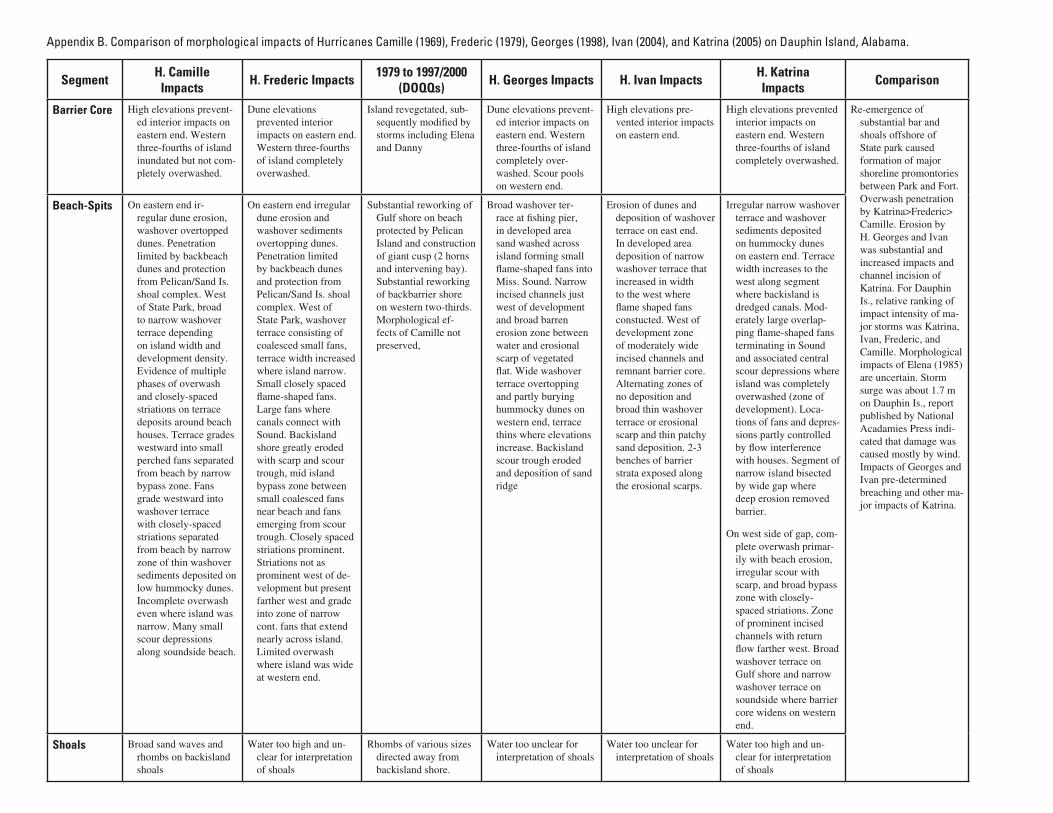
Appendix B. Comparison of morphological impacts of Hurricanes Camille (1969), Frederic (1979), Georges (1998), Ivan (2004), and Katrina (2005) on Dauphin Island, Alabama.
Segment H. Camille Impacts H. Frederic Impacts 1 7� � to 1 7/2000 ��
(DOQQs) H. Georges Impacts H. Ivan Impacts H. Katrina Impacts Comparison
Barrier Core High elevations prevent- Dune elevations Island revegetated, sub- Dune elevations prevent- High elevations pre- High elevations prevented Re-emergence of ed interior impacts on prevented interior sequently modified by ed interior impacts on vented interior impacts interior impacts on substantial bar and eastern end. Western impacts on eastern end. storms including Elena eastern end. Western on eastern end. eastern end. Western shoals offshore of three-fourths of island Western three-fourths and Danny three-fourths of island three-fourths of island State park caused inundated but not com- of island completely completely over- completely overwashed. formation of major pletely overwashed. overwashed. washed. Scour pools shoreline promontories
on western end. between Park and Fort. Overwash penetration by Katrina>Frederic> Camille. Erosion by H. Georges and Ivan was substantial and increased impacts and channel incision of Katrina. For Dauphin Is., relative ranking of impact intensity of ma-jor storms was Katrina, Ivan, Frederic, and Camille. Morphological impacts of Elena (1985) are uncertain. Storm surge was about 1.7 m on Dauphin Is., report published by National Acadamies Press indi-cated that damage was caused mostly by wind. Impacts of Georges and Ivan pre-determined breaching and other ma-jor impacts of Katrina.
Beach-Spits On eastern end ir-regular dune erosion, washover overtopped dunes. Penetration limited by backbeach dunes and protection from Pelican/Sand Is. shoal complex. West of State Park, broad to narrow washover terrace depending on island width and development density. Evidence of multiple phases of overwash and closely-spaced striations on terrace deposits around beach houses. Terrace grades westward into small perched fans separated from beach by narrow bypass zone. Fans grade westward into washover terrace
On eastern end irregular dune erosion and washover sediments overtopping dunes. Penetration limited by backbeach dunes and protection from Pelican/Sand Is. shoal complex. West of State Park, washover terrace consisting of coalesced small fans, terrace width increased where island narrow. Small closely spaced flame-shaped fans. Large fans where canals connect with Sound. Backisland shore greatly eroded with scarp and scour trough, mid island bypass zone between small coalesced fans near beach and fans
Substantial reworking of Gulf shore on beach protected by Pelican Island and construction of giant cusp (2 horns and intervening bay). Substantial reworking of backbarrier shore on western two-thirds. Morphological ef-fects of Camille not preserved,
Broad washover ter-race at fishing pier, in developed area sand washed across island forming small flame-shaped fans into Miss. Sound. Narrow incised channels just west of development and broad barren erosion zone between water and erosional scarp of vegetated flat. Wide washover terrace overtopping and partly burying hummocky dunes on western end, terrace thins where elevations increase. Backisland scour trough eroded and deposition of sand ridge
Erosion of dunes and deposition of washover terrace on east end. In developed area deposition of narrow washover terrace that increased in width to the west where flame shaped fans constucted. West of development zone of moderately wide incised channels and remnant barrier core. Alternating zones of no deposition and broad thin washover terrace or erosional scarp and thin patchy sand deposition. 2-3 benches of barrier strata exposed along the erosional scarps.
Irregular narrow washover terrace and washover sediments deposited on hummocky dunes on eastern end. Terrace width increases to the west along segment where backisland is dredged canals. Mod-erately large overlap-ping flame-shaped fans terminating in Sound and associated central scour depressions where island was completely overwashed (zone of development). Loca-tions of fans and depres-sions partly controlled by flow interference with houses. Segment of narrow island bisected by wide gap where deep erosion removed barrier.
with closely-spaced striations separated from beach by narrow zone of thin washover
emerging from scour trough. Closely spaced striations prominent. Striations not as
On west side of gap, com-plete overwash primar-ily with beach erosion,
sediments deposited on low hummocky dunes.Incomplete overwash even where island was
prominent west of de-velopment but present farther west and grade into zone of narrow
irregular scour with scarp, and broad bypass zone with closely-spaced striations. Zone
narrow. Many small scour depressions along soundside beach.
cont. fans that extend nearly across island. Limited overwash where island was wide
of prominent incised channels with return flow farther west. Broad washover terrace on
at western end. Gulf shore and narrow washover terrace on soundside where barrier core widens on western end.
Shoals Broad sand waves and Water too high and un- Rhombs of various sizes Water too unclear for Water too unclear for Water too high and un-rhombs on backisland clear for interpretation directed away from interpretation of shoals interpretation of shoals clear for interpretation shoals of shoals backisland shore. of shoals
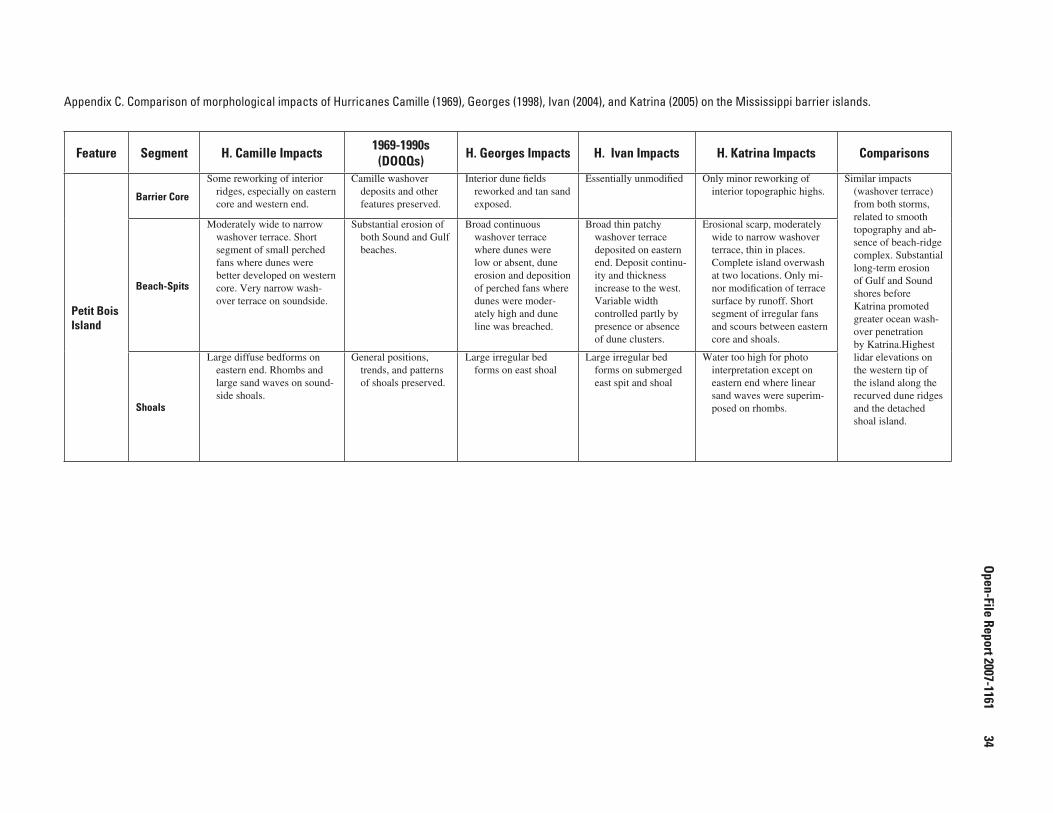
Open-File Report 2007-1161
��
Appendix C. Comparison of morphological impacts of Hurricanes Camille (1969), Georges (1998), Ivan (2004), and Katrina (2005) on the Mississippi barrier islands.
Feature Segment H. Camille Impacts 1�6�-1��0s (DOQQs) H. Georges Impacts H. Ivan Impacts H. Katrina Impacts Comparisons
Petit Bois Island
Barrier Core
Some reworking of interior ridges, especially on eastern core and western end.
Camille washover deposits and other features preserved.
Interior dune fields reworked and tan sand exposed.
Essentially unmodified Only minor reworking of interior topographic highs.
Similar impacts (washover terrace) from both storms, related to smooth topography and ab-sence of beach-ridge complex. Substantial long-term erosion of Gulf and Sound shores before Katrina promoted greater ocean wash-over penetration by Katrina.Highest lidar elevations on the western tip of the island along the recurved dune ridges and the detached shoal island.
Beach-Spits
Moderately wide to narrow washover terrace. Short segment of small perched fans where dunes were better developed on western core. Very narrow wash-over terrace on soundside.
Substantial erosion of both Sound and Gulf beaches.
Broad continuous washover terrace where dunes were low or absent, dune erosion and deposition of perched fans where dunes were moder-ately high and dune line was breached.
Broad thin patchy washover terrace deposited on eastern end. Deposit continu-ity and thickness increase to the west. Variable width controlled partly by presence or absence of dune clusters.
Erosional scarp, moderately wide to narrow washover terrace, thin in places. Complete island overwash at two locations. Only mi-nor modification of terrace surface by runoff. Short segment of irregular fans and scours between eastern core and shoals.
Shoals
Large diffuse bedforms on eastern end. Rhombs and large sand waves on sound-side shoals.
General positions, trends, and patterns of shoals preserved.
Large irregular bed forms on east shoal
Large irregular bed forms on submerged east spit and shoal
Water too high for photo interpretation except on eastern end where linear sand waves were superim-posed on rhombs.
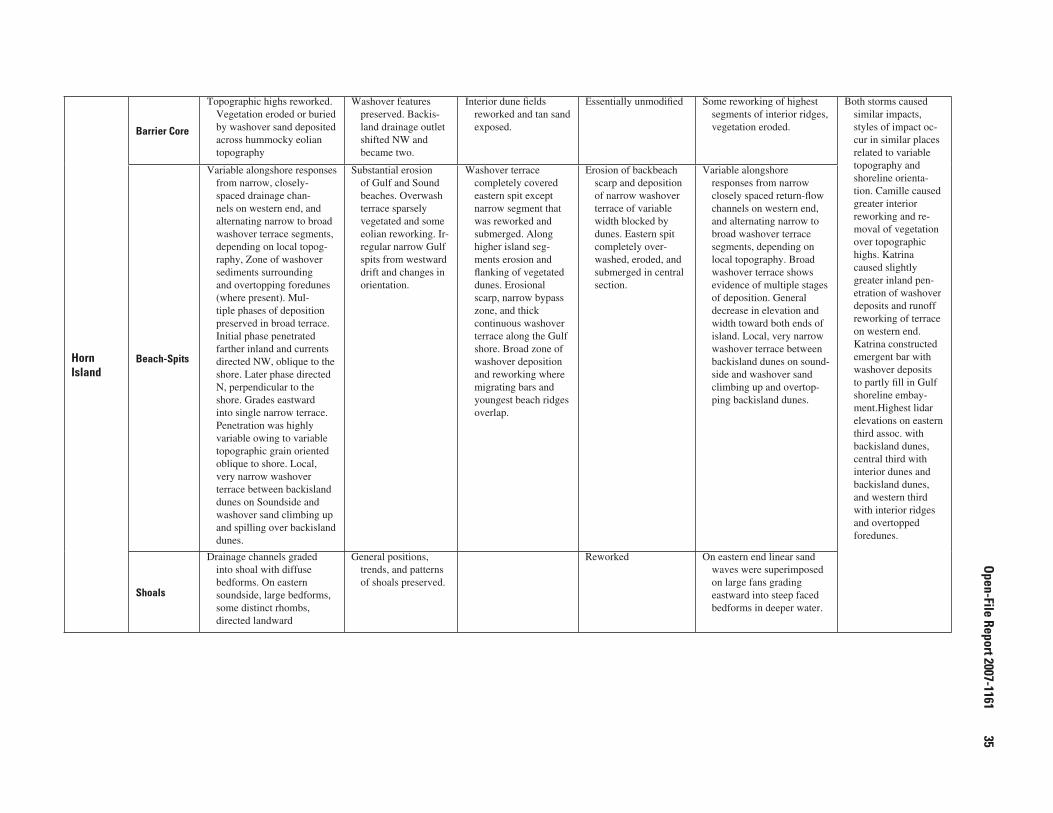
Open-File Report 2007-1161
��
HornIsland
Barrier Core
Topographic highs reworked. Vegetation eroded or buried by washover sand deposited across hummocky eolian topography
Washover features preserved. Backis-land drainage outlet shifted NW and became two.
Interior dune fields reworked and tan sand exposed.
Essentially unmodified Some reworking of highest segments of interior ridges, vegetation eroded.
Both storms caused similar impacts, styles of impact oc-cur in similar places related to variable topography and shoreline orienta-tion. Camille caused greater interior reworking and re-moval of vegetation over topographic highs. Katrina caused slightly greater inland pen-etration of washover deposits and runoff reworking of terrace on western end. Katrina constructed emergent bar with washover deposits to partly fill in Gulf shoreline embay-ment.Highest lidar elevations on eastern third assoc. with backisland dunes, central third with interior dunes and backisland dunes, and western third with interior ridges and overtopped foredunes.
Beach-Spits
Variable alongshore responses from narrow, closely-spaced drainage chan-nels on western end, and alternating narrow to broad washover terrace segments, depending on local topog-raphy, Zone of washover sediments surrounding and overtopping foredunes (where present). Mul-tiple phases of deposition preserved in broad terrace. Initial phase penetrated farther inland and currents directed NW, oblique to the shore. Later phase directed N, perpendicular to the shore. Grades eastward into single narrow terrace. Penetration was highly variable owing to variable topographic grain oriented oblique to shore. Local, very narrow washover terrace between backisland dunes on Soundside and washover sand climbing up and spilling over backisland dunes.
Substantial erosion of Gulf and Sound beaches. Overwash terrace sparsely vegetated and some eolian reworking. Ir-regular narrow Gulf spits from westward drift and changes in orientation.
Washover terrace completely covered eastern spit except narrow segment that was reworked and submerged. Along higher island seg-ments erosion and flanking of vegetated dunes. Erosional scarp, narrow bypass zone, and thick continuous washover terrace along the Gulf shore. Broad zone of washover deposition and reworking where migrating bars and youngest beach ridges overlap.
Erosion of backbeach scarp and deposition of narrow washover terrace of variable width blocked by dunes. Eastern spit completely over-washed, eroded, and submerged in central section.
Variable alongshore responses from narrow closely spaced return-flow channels on western end, and alternating narrow to broad washover terrace segments, depending on local topography. Broad washover terrace shows evidence of multiple stages of deposition. General decrease in elevation and width toward both ends of island. Local, very narrow washover terrace between backisland dunes on sound-side and washover sand climbing up and overtop-ping backisland dunes.
Shoals
Drainage channels graded into shoal with diffuse bedforms. On eastern soundside, large bedforms, some distinct rhombs, directed landward
General positions, trends, and patterns of shoals preserved.
Reworked On eastern end linear sand waves were superimposed on large fans grading eastward into steep faced bedforms in deeper water.
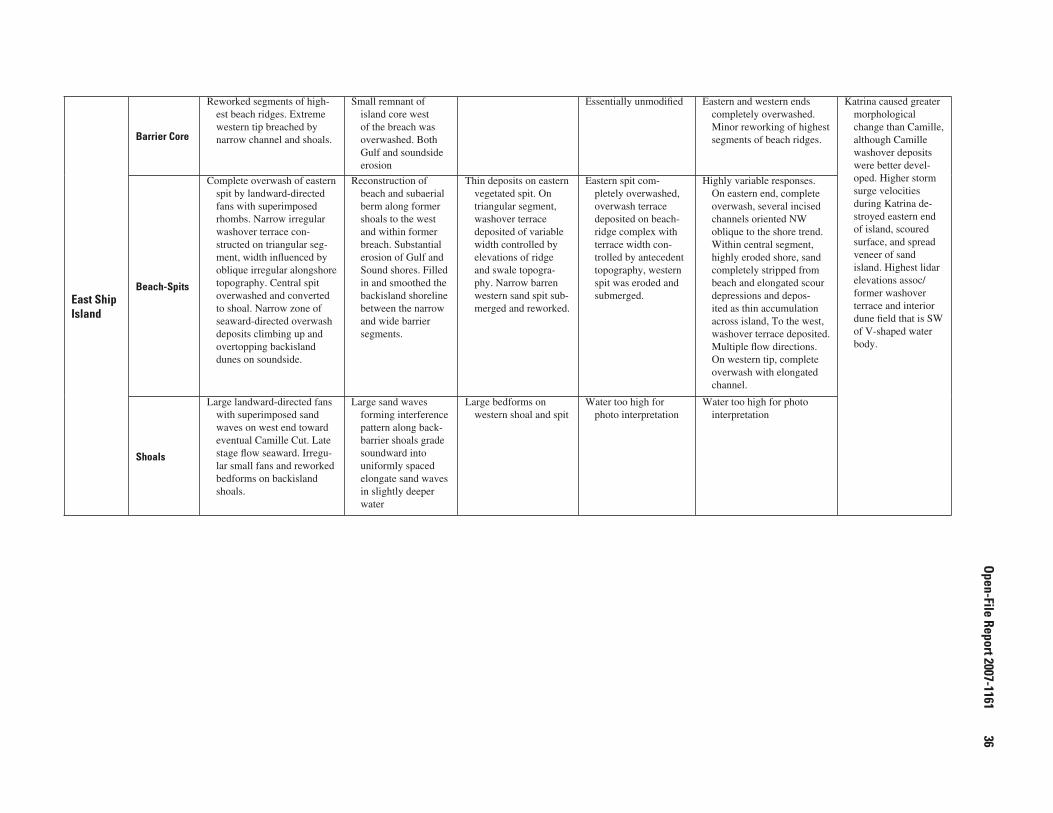
Open-File Report 2007-1161
�6
East Ship Island
Barrier Core
Reworked segments of high-est beach ridges. Extreme western tip breached by narrow channel and shoals.
Small remnant of island core west of the breach was overwashed. Both Gulf and soundside erosion
Essentially unmodified Eastern and western ends completely overwashed. Minor reworking of highest segments of beach ridges.
Katrina caused greater morphological change than Camille, although Camille washover deposits were better devel-oped. Higher storm surge velocities during Katrina de-stroyed eastern end of island, scoured surface, and spread veneer of sand island. Highest lidar elevations assoc/ former washover terrace and interior dune field that is SW of V-shaped water body.
Beach-Spits
Complete overwash of eastern spit by landward-directed fans with superimposed rhombs. Narrow irregular washover terrace con-structed on triangular seg-ment, width influenced by oblique irregular alongshore topography. Central spit overwashed and converted to shoal. Narrow zone of seaward-directed overwash deposits climbing up and overtopping backisland dunes on soundside.
Reconstruction of beach and subaerial berm along former shoals to the west and within former breach. Substantial erosion of Gulf and Sound shores. Filled in and smoothed the backisland shoreline between the narrow and wide barrier segments.
Thin deposits on eastern vegetated spit. On triangular segment, washover terrace deposited of variable width controlled by elevations of ridge and swale topogra-phy. Narrow barren western sand spit sub-merged and reworked.
Eastern spit com-pletely overwashed, overwash terrace deposited on beach-ridge complex with terrace width con-trolled by antecedent topography, western spit was eroded and submerged.
Highly variable responses. On eastern end, complete overwash, several incised channels oriented NW oblique to the shore trend. Within central segment, highly eroded shore, sand completely stripped from beach and elongated scour depressions and depos-ited as thin accumulation across island, To the west, washover terrace deposited. Multiple flow directions. On western tip, complete overwash with elongated channel.
Shoals
Large landward-directed fans with superimposed sand waves on west end toward eventual Camille Cut. Late stage flow seaward. Irregu-lar small fans and reworked bedforms on backisland shoals.
Large sand waves forming interference pattern along back-barrier shoals grade soundward into uniformly spaced elongate sand waves in slightly deeper water
Large bedforms on western shoal and spit
Water too high for photo interpretation
Water too high for photo interpretation
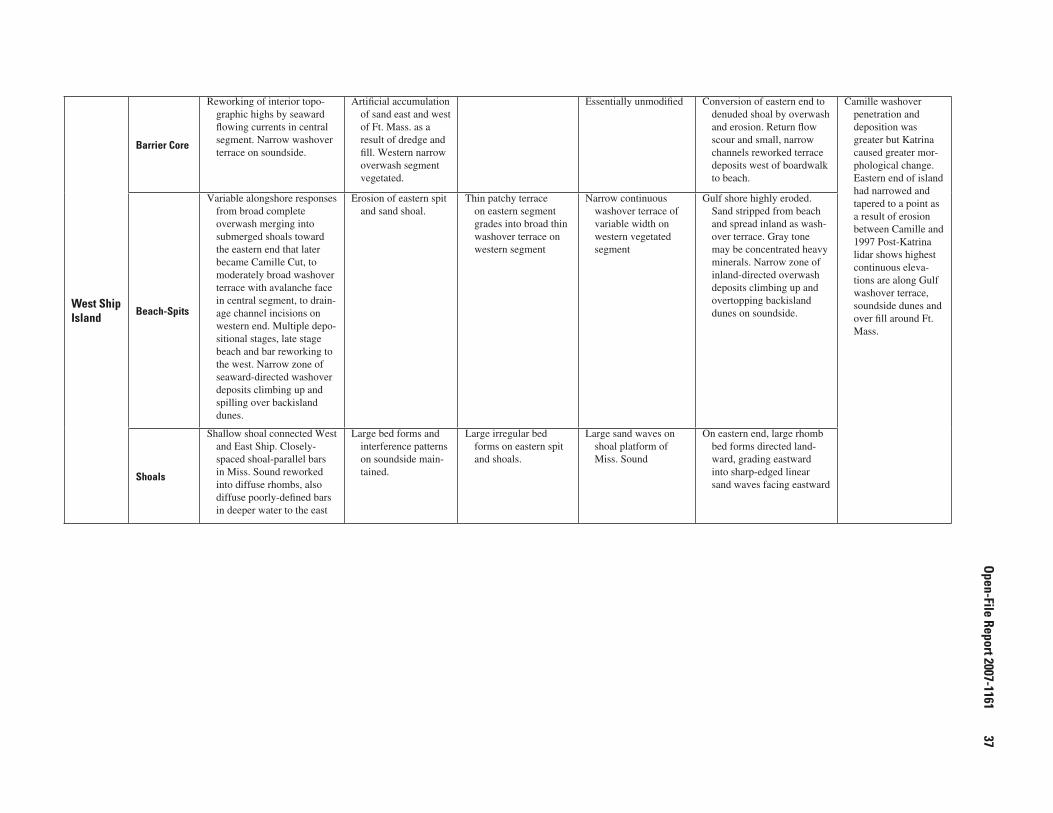
Open-File Report 2007-1161
�7
West ShipIsland
Barrier Core
Reworking of interior topo-graphic highs by seaward flowing currents in central segment. Narrow washover terrace on soundside.
Artificial accumulation of sand east and west of Ft. Mass. as a result of dredge and fill. Western narrow overwash segment vegetated.
Essentially unmodified Conversion of eastern end to denuded shoal by overwash and erosion. Return flow scour and small, narrow channels reworked terrace deposits west of boardwalk to beach.
Camille washover penetration and deposition was greater but Katrina caused greater mor-phological change. Eastern end of island had narrowed and tapered to a point as a result of erosion between Camille and 1997 Post-Katrina lidar shows highest continuous eleva-tions are along Gulf washover terrace, soundside dunes and over fill around Ft. Mass.
Beach-Spits
Variable alongshore responses from broad complete overwash merging into submerged shoals toward the eastern end that later became Camille Cut, to moderately broad washover terrace with avalanche face in central segment, to drain-age channel incisions on western end. Multiple depo-sitional stages, late stage beach and bar reworking to the west. Narrow zone of seaward-directed washover deposits climbing up and spilling over backisland dunes.
Erosion of eastern spit and sand shoal.
Thin patchy terrace on eastern segment grades into broad thin washover terrace on western segment
Narrow continuous washover terrace of variable width on western vegetated segment
Gulf shore highly eroded. Sand stripped from beach and spread inland as wash-over terrace. Gray tone may be concentrated heavy minerals. Narrow zone of inland-directed overwash deposits climbing up and overtopping backisland dunes on soundside.
Shoals
Shallow shoal connected West and East Ship. Closely-spaced shoal-parallel bars in Miss. Sound reworked into diffuse rhombs, also diffuse poorly-defined bars in deeper water to the east
Large bed forms and interference patterns on soundside main-tained.
Large irregular bed forms on eastern spit and shoals.
Large sand waves on shoal platform of Miss. Sound
On eastern end, large rhomb bed forms directed land-ward, grading eastward into sharp-edged linear sand waves facing eastward
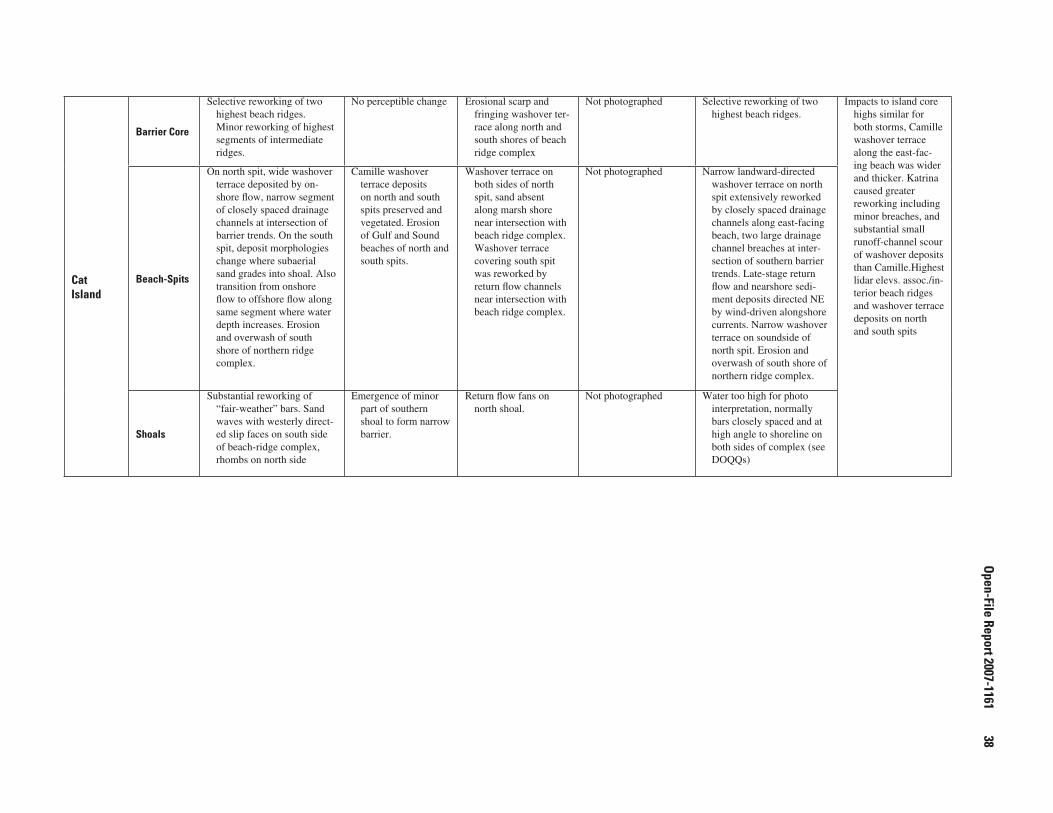
Open-File Report 2007-1161
��
CatIsland
Barrier Core
Selective reworking of two highest beach ridges. Minor reworking of highest segments of intermediate ridges.
No perceptible change Erosional scarp and fringing washover ter-race along north and south shores of beach ridge complex
Not photographed Selective reworking of two highest beach ridges.
Impacts to island core highs similar for both storms, Camille washover terrace along the east-fac-ing beach was wider and thicker. Katrina caused greater reworking including minor breaches, and substantial small runoff-channel scour of washover deposits than Camille.Highest lidar elevs. assoc./in-terior beach ridges and washover terrace deposits on north and south spits
Beach-Spits
On north spit, wide washover terrace deposited by on-shore flow, narrow segment of closely spaced drainage channels at intersection of barrier trends. On the south spit, deposit morphologies change where subaerial sand grades into shoal. Also transition from onshore flow to offshore flow along same segment where water depth increases. Erosion and overwash of south shore of northern ridge complex.
Camille washover terrace deposits on north and south spits preserved and vegetated. Erosion of Gulf and Sound beaches of north and south spits.
Washover terrace on both sides of north spit, sand absent along marsh shore near intersection with beach ridge complex. Washover terrace covering south spit was reworked by return flow channels near intersection with beach ridge complex.
Not photographed Narrow landward-directed washover terrace on north spit extensively reworked by closely spaced drainage channels along east-facing beach, two large drainage channel breaches at inter-section of southern barrier trends. Late-stage return flow and nearshore sedi-ment deposits directed NE by wind-driven alongshore currents. Narrow washover terrace on soundside of north spit. Erosion and overwash of south shore of northern ridge complex.
Shoals
Substantial reworking of “fair-weather” bars. Sand waves with westerly direct-ed slip faces on south side of beach-ridge complex, rhombs on north side
Emergence of minor part of southern shoal to form narrow barrier.
Return flow fans on north shoal.
Not photographed Water too high for photo interpretation, normally bars closely spaced and at high angle to shoreline on both sides of complex (see DOQQs)