Embed Size (px)
Citation preview
ABSTRACT: Long term well hydrographs and estimated groundwater levels derived from hydroclimatic and biological data wereused to evaluate trends within the Upper Carbonate Aquifer (UCA)near Winnipeg, Canada, during the 20th Century. Ground waterrecords from instruments have been kept since the early 1960s andare derived from piezometers in the overlying sediments and inopen boreholes in the UCA. Some boreholes extend into an underly-ing Paleozoic carbonate sequence. Shallow well hydrographs showno obvious long term trends but do exhibit variations on the orderof three to four years that are correlated with changes in annualtemperature and precipitation at lags up to 24 months. Trendsobserved in deeper wells appear to be largely related to groundwater usage patterns and show little correlation with climate overthe past 35 years. Stepwise multiple regression modeled averageannual hydraulic head in the shallow wells as a function of regionaltemperature, precipitation, and tree ring variables. Estimatedhydraulic heads had a slightly greater range prior to the 1960s,most prominently during an interval of lowered ground water levelsbetween 1930 and 1942. Regression results demonstrate that mois-ture sensitive tree ring data are viable predictors of past groundwater levels and may be useful for studies of aquifers in regionsthat lack long, high quality precipitation records.(KEY TERMS: ground water hydrology; statistical analysis; climatechange; principal component analysis; tree rings.)
Ferguson, Grant and Scott St. George, 2003. Historical and Estimated GroundWater Levels Near Winnipeg, Canada, and their Sensitivity to Climatic Variabili-ty. Journal of the American Water Resources Association (JAWRA) 39(5):1249-1259.
INTRODUCTION
Long ground water records of good quality are afundamental element of ground water resource man-agement, principally because these data are neces-sary to define the maximum rate of pumping allowed
within an aquifer (Freeze and Cherry, 1979). Howev-er, extensive ground water monitoring did not beginuntil the second half of the 20th Century in mostparts of the world. Short ground water records only afew decades in length cannot be used to identifydecadal or multidecadal trends within an aquifer,which makes it difficult to determine the long termimpact of climatic variation or ground water usage.Because it is usually necessary to examine recordsthat are several decades or centuries long to under-stand natural climate variability (Bradley, 2000), asimilar approach may be needed to improve ourunderstanding of hydrogeologic systems. Althoughthey lack the universal applicability of deterministicmodels, statistical models relating long term hydrocli-matic and proxy climate records to past ground waterlevels provide one approach to estimate the long termvariability of regional ground water resources andallow for better management of ground waterresources.
The water balance equation (Freeze and Cherry,1979) incorporates contributions from both precipita-tion and evapotranspiration, but because evapotran-spiration is linearly related to temperature (Singh,1992), fluctuations in ground water levels are oftenstrongly correlated with regional temperature andprecipitation data (e.g., Sanz Perez, 1997; Chen etal., 2002). As climate records often predate groundwater monitoring by several decades, these data canpotentially be used to estimate changes within anaquifer prior to the establishment of direct measure-ment. Other environmental parameters could alsoserve as good predictors of preinstrumental groundwater levels. For instance, although tree rings have
1Paper No. 02121 of the Journal of the American Water Resources Association. Discussions are open until April 1, 2004.2Respectively, Ph.D. Student, Department of Civil Engineering, University of Manitoba, 342 Engineering Building, 15 Gillson Street, Win-
nipeg, Manitoba, Canada R3T 3V5; and Physical Scientist, Geological Survey of Canada, 360-1395 Ellice Avenue, Winnipeg, Manitoba, Cana-da R3G 3P2 (E-Mail/Ferguson: [email protected]).
JOURNAL OF THE AMERICAN WATER RESOURCES ASSOCIATION 1249 JAWRA
JOURNAL OF THE AMERICAN WATER RESOURCES ASSOCIATIONOCTOBER AMERICAN WATER RESOURCES ASSOCIATION 2003
HISTORICAL AND ESTIMATED GROUND WATER LEVELS NEARWINNIPEG, CANADA, AND THEIR SENSITIVITY TO CLIMATIC VARIABILITY1
Grant Ferguson and Scott St. George2

most commonly been used to estimate past changes inseasonal and annual precipitation and streamflow(e.g., Fritts et al., 1979; Cook and Jacoby, 1983;Cleaveland, 2000; Woodhouse, 2001), the direct rela-tionship between tree growth and factors important torecharge suggests that dendrochronological data mayalso be useful in historical ground water modelingstudies. Ground water fluctuations have also beencited as a possible cause of interyear persistence intree rings (e.g., Loaiciga et al., 1993), and because treering networks often have a denser spatial coveragethan long term instrumental records, they may beparticularly valuable when studying large, regionalaquifers with extensive recharge areas.
The purpose of this study is to relate regionalground water trends near Winnipeg, Canada, to cli-matic variability at decadal to centennial time scales.Using long term ground water records, we evaluatehistoric patterns of ground water fluctuationsobserved directly by instrumental monitoring andidentify potential relationships between ground waterlevels and hydroclimatic parameters. Linear regres-sion techniques are used to evaluate the utility of treering data in predictive ground water models and toestimate changes in ground water levels that occurred
prior to the initiation of monitoring. Our results sug-gest that dendrochronological data can be a viablemeasure of past ground water levels and that histori-cal ground water patterns and sensitivity to climatechange are strongly influenced by hydrostratigraphicsituation.
STUDY AREA
The Upper Carbonate Aquifer (UCA) is the prima-ry source of ground water in southeastern Manitoba,including the area surrounding Winnipeg. The aquiferis not restricted to a single geologic unit but insteadfollows the erosional surface of several dipping Paleo-zoic carbonate formations, including parts of the RedRiver and Stony Mountain Formations in the Win-nipeg area (Figure 1). The aquifer occurs within theupper 15 to 30 meters of these carbonate units. Atthese depths abundant fractures and paleokarst fea-tures are present (Render, 1970). Situated beneaththe UCA, the Red River Formation and the StonyMountain Formation are much less permeable andare generally not viewed as aquifers, except for a
JAWRA 1250 JOURNAL OF THE AMERICAN WATER RESOURCES ASSOCIATION
FERGUSON AND ST. GEORGE
Figure 1. Cross Section Outlining the Regional Geology (G. Matile, personal communication, 2002) and Hydrogeology ofSoutheastern Manitoba (after Betcher et al., 1995). The dashed line indicates the lowest position of the
Upper Carbonate Aquifer. Ground water flow directions are indicated as black arrows.
small area directly overlying the Winnipeg Forma-tion. However, many industrial wells in the Winnipegarea are completed through the UCA into this lowerpermeability zone in order to increase transmissivi-ties.
The UCA is overlain by till, glaciolacustrine clay,and, in areas near the Red River, fine grained alluvi-um. This aquifer can be separated into three flow sys-tems on the basis of hydraulic head distribution andgeochemical evidence: (1) flow of saline and brackishwaters from deep within the Williston Basin to thewest; (2) freshwater recharge emanating from thearea between Lakes Manitoba and Winnipeg; and (3)freshwater recharge from the Sandilands glaciofluvialcomplex to the southeast of Winnipeg (Grasby andBetcher, 2002). Some recharge also occurs through theBirds Hill glaciofluvial complex northeast of Winnipeg(Render, 1970). As much as 10 percent of totalrecharge occurs through the glaciolacustrine claysand tills (Day, 1977). Ground water levels in the UCAshould be strongly related to local climatic variablesdue to the close proximity of its recharge areas. vander Kamp and Maathuis (1991) suggested that shal-low semiconfined aquifers such as the UCA will beimpacted by climatic variability quite quickly, at timelags ranging from one year to ten years. Furthermore,Rutulis (1989) proposed that the amount of precipita-tion received during the previous winter and currentspring has an immediate impact on annual groundwater levels in the UCA.
Large scale exploitation of the UCA began aroundWinnipeg in the late 19th Century, which led to thedevelopment of a large drawdown cone (up to 5meters at the city center) by the late 1960s (Render,1971). At present, ground water is predominantlyused in the region for air conditioning and industrialcooling. Most extracted ground water has been inject-ed back into the UCA since the introduction of aground water sewage tax during the 1940s (Render,1970). Regional hydrogeology was also altered by theconstruction of the Red River Floodway between 1962and 1968 that created an additional ground water dis-charge area. Seepage into the floodway has depressedthe potentiometric surface of the UCA in the easternpart of the study area (Render, 1970; Betcher et al.,1995).
DATA
Ground Water Monitoring Records
The monitoring well network used in this study lies along an approximately north south transect
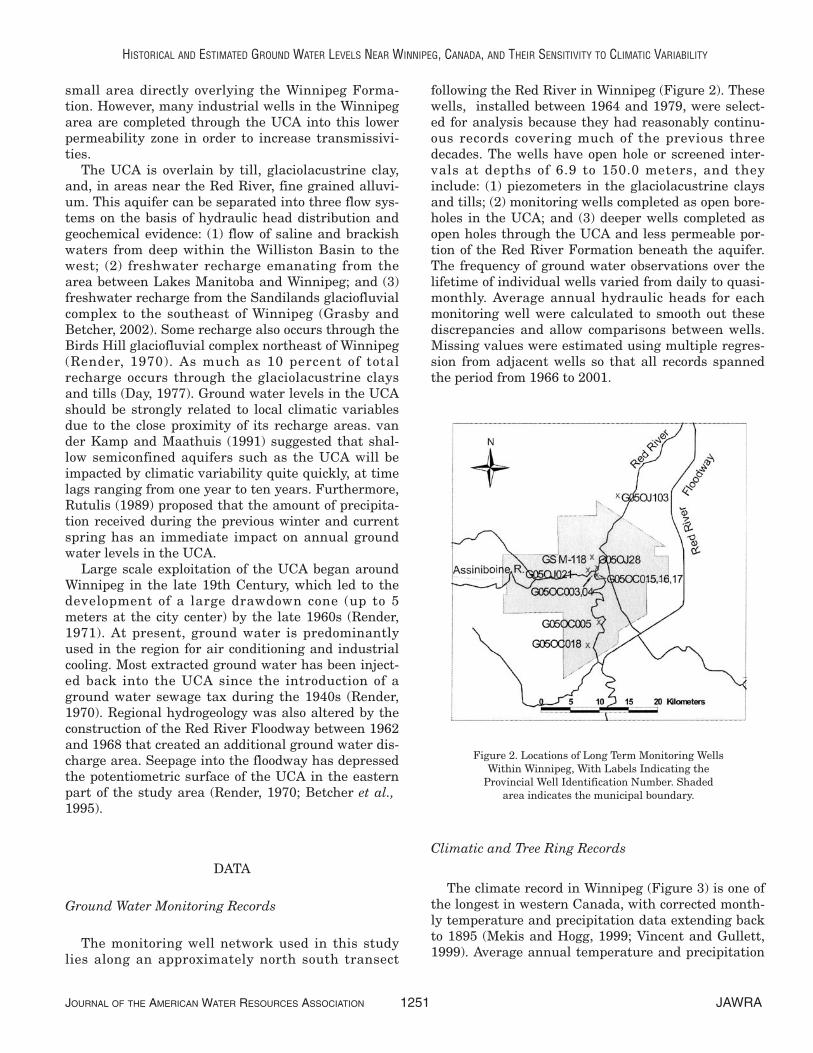
following the Red River in Winnipeg (Figure 2). Thesewells, installed between 1964 and 1979, were select-ed for analysis because they had reasonably continu-ous records covering much of the previous threedecades. The wells have open hole or screened inter-vals at depths of 6.9 to 150.0 meters, and theyinclude: (1) piezometers in the glaciolacustrine claysand tills; (2) monitoring wells completed as open bore-holes in the UCA; and (3) deeper wells completed asopen holes through the UCA and less permeable por-tion of the Red River Formation beneath the aquifer.The frequency of ground water observations over thelifetime of individual wells varied from daily to quasi-monthly. Average annual hydraulic heads for eachmonitoring well were calculated to smooth out thesediscrepancies and allow comparisons between wells.Missing values were estimated using multiple regres-sion from adjacent wells so that all records spannedthe period from 1966 to 2001.
Climatic and Tree Ring Records
The climate record in Winnipeg (Figure 3) is one ofthe longest in western Canada, with corrected month-ly temperature and precipitation data extending backto 1895 (Mekis and Hogg, 1999; Vincent and Gullett,1999). Average annual temperature and precipitation
JOURNAL OF THE AMERICAN WATER RESOURCES ASSOCIATION 1251 JAWRA
HISTORICAL AND ESTIMATED GROUND WATER LEVELS NEAR WINNIPEG, CANADA, AND THEIR SENSITIVITY TO CLIMATIC VARIABILITY
Figure 2. Locations of Long Term Monitoring WellsWithin Winnipeg, With Labels Indicating the
Provincial Well Identification Number. Shadedarea indicates the municipal boundary.
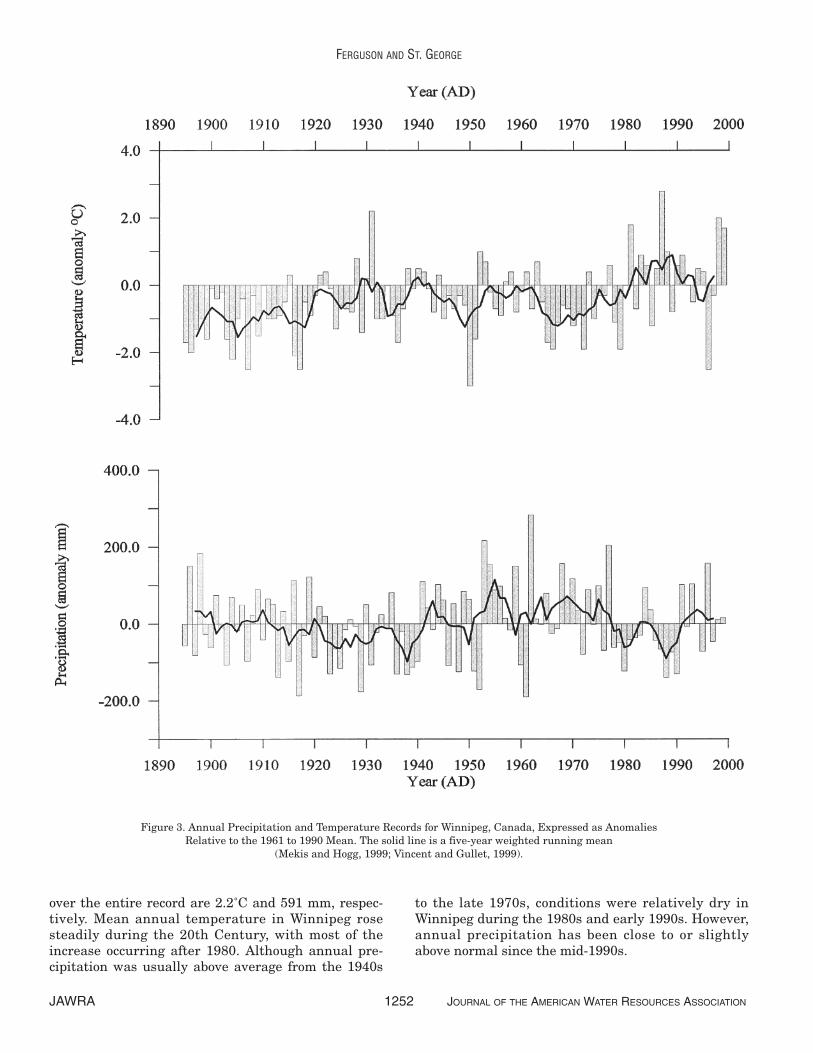
over the entire record are 2.2˚C and 591 mm, respec-tively. Mean annual temperature in Winnipeg rosesteadily during the 20th Century, with most of theincrease occurring after 1980. Although annual pre-cipitation was usually above average from the 1940s
to the late 1970s, conditions were relatively dry inWinnipeg during the 1980s and early 1990s. However,annual precipitation has been close to or slightlyabove normal since the mid-1990s.
JAWRA 1252 JOURNAL OF THE AMERICAN WATER RESOURCES ASSOCIATION
FERGUSON AND ST. GEORGE
Figure 3. Annual Precipitation and Temperature Records for Winnipeg, Canada, Expressed as AnomaliesRelative to the 1961 to 1990 Mean. The solid line is a five-year weighted running mean
(Mekis and Hogg, 1999; Vincent and Gullet, 1999).
Tree ring data were derived from a network of 16riparian forest sites along the Red River between theCanada/United States border and Winnipeg. Sampleswere collected from bur oak (Quercus macrocarpaMichx.), which is sensitive to interannual changes inprecipitation (St. George and Nielsen, 2002). Whilebur oak in southern Manitoba may attain ages ofnearly 300 years, most contemporary trees in the RedRiver valley were established in the late 19th Centu-ry. The shortest tree ring record in this data setbegins in 1907. Following principal component andcluster analysis of these data, similar tree ring siteswere aggregated into northern and southern sub-groups. The northern subgroup covers essentially thesame area as the monitoring wells in Winnipeg, whilethe southern subgroup is made up of trees collectedbetween Winnipeg and the Canada/United States bor-der.
STATISTICAL ANALYSIS
Principal Component Analysis
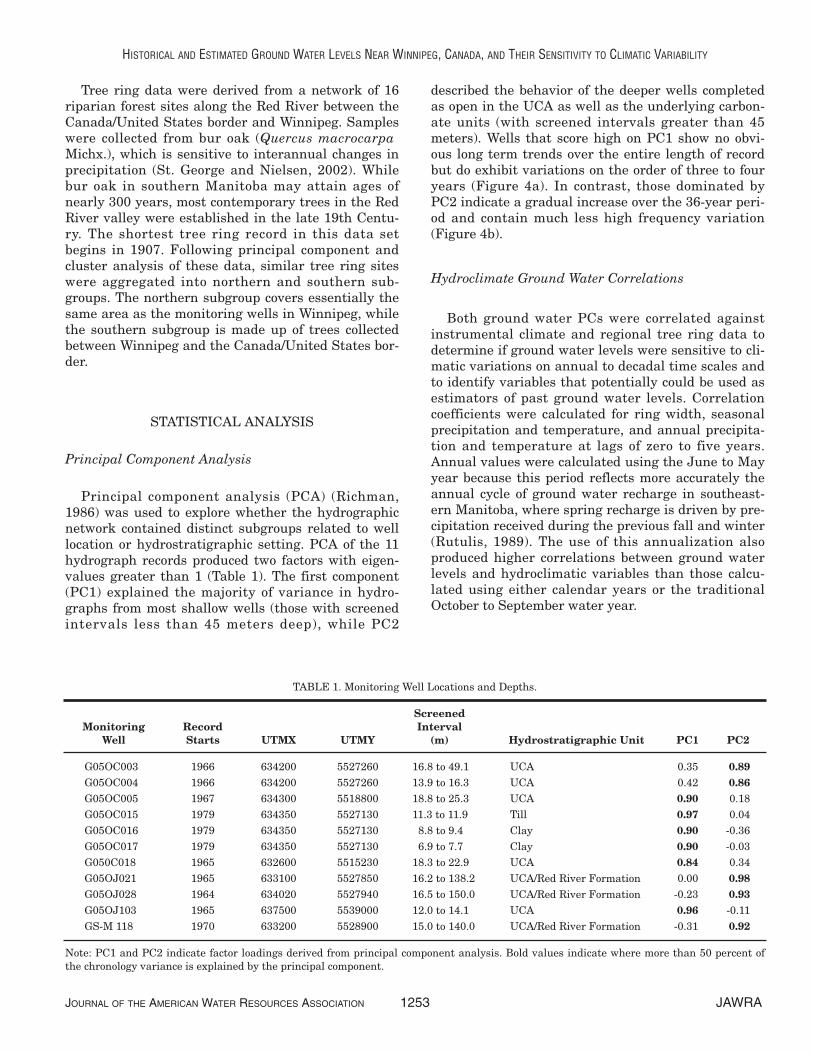
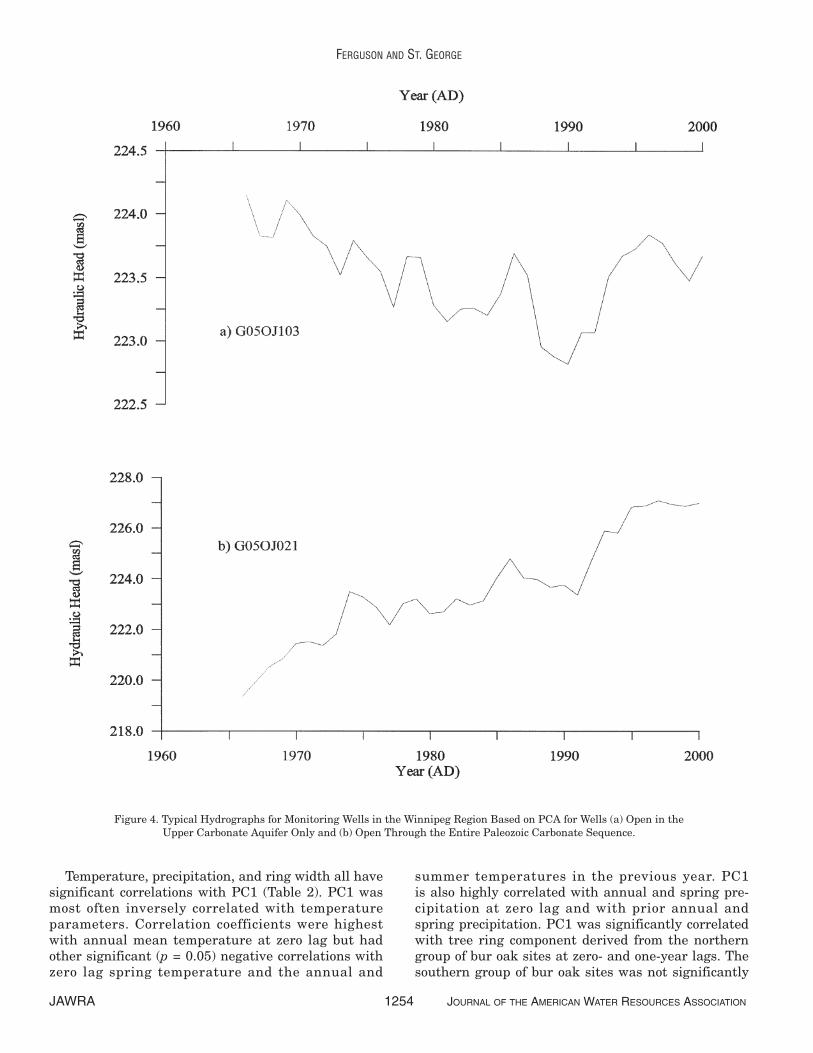
Principal component analysis (PCA) (Richman,1986) was used to explore whether the hydrographicnetwork contained distinct subgroups related to welllocation or hydrostratigraphic setting. PCA of the 11hydrograph records produced two factors with eigen-values greater than 1 (Table 1). The first component(PC1) explained the majority of variance in hydro-graphs from most shallow wells (those with screenedintervals less than 45 meters deep), while PC2
described the behavior of the deeper wells completedas open in the UCA as well as the underlying carbon-ate units (with screened intervals greater than 45meters). Wells that score high on PC1 show no obvi-ous long term trends over the entire length of recordbut do exhibit variations on the order of three to fouryears (Figure 4a). In contrast, those dominated byPC2 indicate a gradual increase over the 36-year peri-od and contain much less high frequency variation(Figure 4b).
Hydroclimate Ground Water Correlations
Both ground water PCs were correlated againstinstrumental climate and regional tree ring data todetermine if ground water levels were sensitive to cli-matic variations on annual to decadal time scales andto identify variables that potentially could be used asestimators of past ground water levels. Correlationcoefficients were calculated for ring width, seasonalprecipitation and temperature, and annual precipita-tion and temperature at lags of zero to five years.Annual values were calculated using the June to Mayyear because this period reflects more accurately theannual cycle of ground water recharge in southeast-ern Manitoba, where spring recharge is driven by pre-cipitation received during the previous fall and winter(Rutulis, 1989). The use of this annualization alsoproduced higher correlations between ground waterlevels and hydroclimatic variables than those calcu-lated using either calendar years or the traditionalOctober to September water year.
JOURNAL OF THE AMERICAN WATER RESOURCES ASSOCIATION 1253 JAWRA
HISTORICAL AND ESTIMATED GROUND WATER LEVELS NEAR WINNIPEG, CANADA, AND THEIR SENSITIVITY TO CLIMATIC VARIABILITY
TABLE 1. Monitoring Well Locations and Depths.
ScreenedMonitoring Record Interval
Well Starts UTMX UTMY (m) Hydrostratigraphic Unit PC1 PC2
G05OC003 1966 634200 5527260 16.8 to 49.1 UCA 0.35 0.89G05OC004 1966 634200 5527260 13.9 to 16.3 UCA 0.42 0.86G05OC005 1967 634300 5518800 18.8 to 25.3 UCA 0.90 0.18G05OC015 1979 634350 5527130 11.3 to 11.9 Till 0.97 0.04G05OC016 1979 634350 5527130 08.8 to 9.4 Clay 0.90 -0.36G05OC017 1979 634350 5527130 06.9 to 7.7 Clay 0.90 -0.03G050C018 1965 632600 5515230 18.3 to 22.9 UCA 0.84 0.34G05OJ021 1965 633100 5527850 16.2 to 138.2 UCA/Red River Formation 0.00 0.98G05OJ028 1964 634020 5527940 16.5 to 150.0 UCA/Red River Formation -0.23 0.93G05OJ103 1965 637500 5539000 12.0 to 14.1 UCA 0.96 -0.11GS-M 118 1970 633200 5528900 15.0 to 140.0 UCA/Red River Formation -0.31 0.92
Note: PC1 and PC2 indicate factor loadings derived from principal component analysis. Bold values indicate where more than 50 percent ofthe chronology variance is explained by the principal component.
Temperature, precipitation, and ring width all havesignificant correlations with PC1 (Table 2). PC1 wasmost often inversely correlated with temperatureparameters. Correlation coefficients were highestwith annual mean temperature at zero lag but hadother significant (p = 0.05) negative correlations withzero lag spring temperature and the annual and
summer temperatures in the previous year. PC1 is also highly correlated with annual and spring pre-cipitation at zero lag and with prior annual andspring precipitation. PC1 was significantly correlatedwith tree ring component derived from the northerngroup of bur oak sites at zero- and one-year lags. Thesouthern group of bur oak sites was not significantly
JAWRA 1254 JOURNAL OF THE AMERICAN WATER RESOURCES ASSOCIATION
FERGUSON AND ST. GEORGE
Figure 4. Typical Hydrographs for Monitoring Wells in the Winnipeg Region Based on PCA for Wells (a) Open in theUpper Carbonate Aquifer Only and (b) Open Through the Entire Paleozoic Carbonate Sequence.

correlated with PC1, likely reflecting its distance fromthe ground water monitoring wells in Winnipeg. Mostof these tree ring sites are in an area where the UCAdischarges ground water that has been rechargedthrough the tills southeast of Winnipeg, both in theSandilands area and in an area close to the Canada-United States border. The lack of correlation betweenthe southern tree ring data and ground water levelsin the Winnipeg area suggests that the UCA south ofWinnipeg may exhibit different long term trends inground water levels.
Ground water PC2 appears to have been less sensi-tive to changes in regional hydroclimate during theprevious three and a half decades. While this factordoes have significant correlations with annual tem-perature at one-year lags and winter temperatures atzero-, one-, and two-year lags, these correlations arepositive and do not follow common physical relation-ships between temperature and recharge (Freeze andCherry, 1979; Singh, 1992). We suggest that theseground water climate correlations may be spurious.PC2 is significantly correlated with the northern tree-ring group but has no significant correlations withany precipitation variables. For both ground waterPCs, few significant correlations were found at lagsgreater than two years.
Multiple Regression Ground Water Model
Correlation analysis suggested that ground waterlevels from shallow monitoring wells, as representedby PC1, are strongly linked to selected hydroclimaticparameters. We have exploited these linkages toretrodict ground water levels prior to the establish-ment of monitoring in the 1960s and to test the utilityof tree ring data as ground water predictors. Statisti-cal modeling of PC2 was not attempted due to itsweaker correlations with hydroclimatic variables dur-ing the period examined in this study.
Stepwise multiple regression was used to constructa four-parameter linear model predicting averageannual hydraulic head in the shallow wells andpiezometers. Since factors from PCA are dimension-less indices that are not easily interpreted, wells withmore than 70 percent of their total variance explainedby PC1 were averaged to develop a mean hydraulichead time series representing the shallow wells. Predictors included mean annual June to May tem-perature at zero lag, June to May precipitation at aone-year lag, and the northern group tree ring indexduring the current year and at a two-year lag. Overthe 32-year calibration period, the model explained72.2 percent of the variance, with a standard error of0.22 meters (Table 3). Our aggregate regression model
JOURNAL OF THE AMERICAN WATER RESOURCES ASSOCIATION 1255 JAWRA
HISTORICAL AND ESTIMATED GROUND WATER LEVELS NEAR WINNIPEG, CANADA, AND THEIR SENSITIVITY TO CLIMATIC VARIABILITY
TABLE 2. Correlation Coefficients Between the First Two Principal Componentsof Ground Water and Selected Hydroclimatic Variables.
Temperature Precipitation Tree RingsPC1 PC2 PC1 PC1 PC1 PC2
Annual -0.55** -0.30 -0.39* -0.08 TR1 -0.45** -0.36*
Ann-1 -0.43* -0.46** -0.48** -0.12 TR1-1 -0.45** -0.33*
Ann-2 -0.09 -0.32 -0.12 -0.06 TR1-2 -0.21 -0.20*
Winter -0.29 -0.35* -0.30 -0.15 TR2 -0.16 -0.29*
Win-1 -0.34* -0.45** -0.17 -0.02 TR2-1 -0.05 -0.27*
Win-2 -0.12 -0.35* -0.07 -0.07 TR2-2 -0.16 -0.21*
Spring -0.55** -0.07 -0.48** -0.05
Spr-1 -0.33 -0.24 -0.50** -0.10
Spr-2 -0.17 -0.26 -0.33* -0.13
Summer -0.15 -0.20 -0.05 -0.11
Sum-1 -0.39** -0.17 -0.11 -0.04
Sum-2 -0.31* -0.22 -0.25 -0.04
Fall - 0.03 -0.06 -0.12 -0.08
Fall-1 -0.07 -0.07 -0.25 -0.04
Fall-2 -0.05 -0.11 -0.14 -0.11
Note: Single asterisks indicate correlations significant at the p = 0.05 level and double asterisks indicate correlations significant at the p = 0.01 level. TR1 and TR2 refer to principal components representing tree ring data derived from northern and southern subgroups, respec-tively.
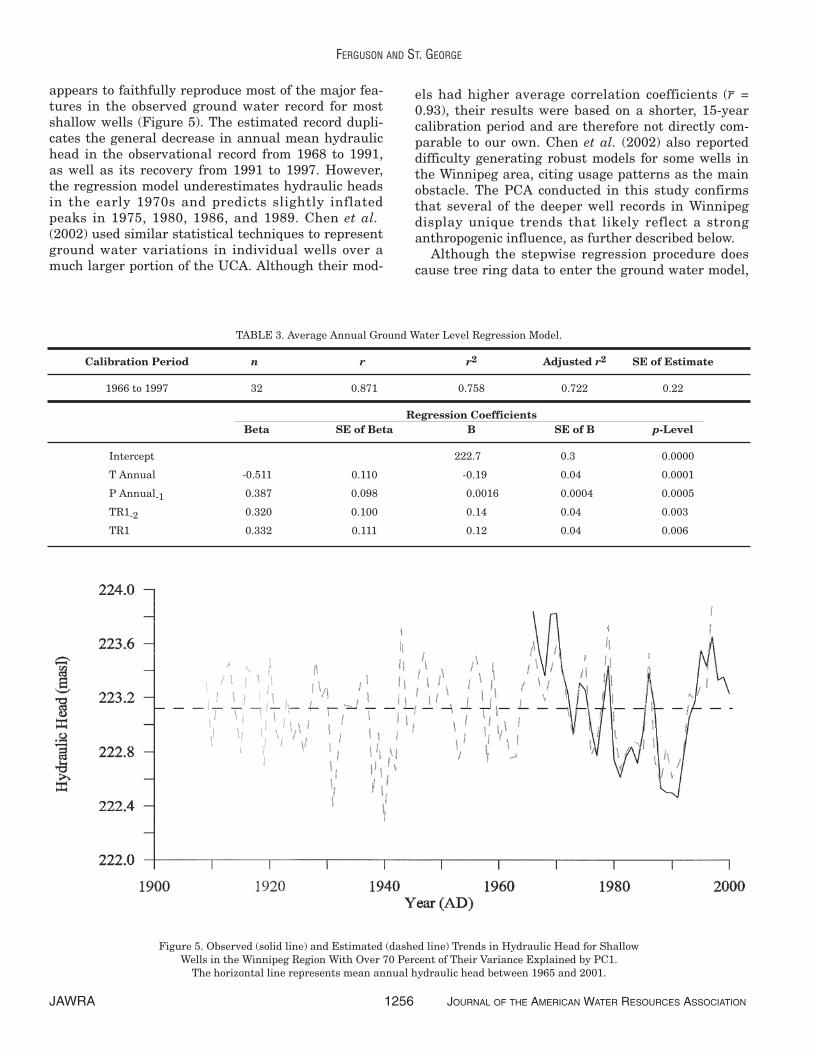
appears to faithfully reproduce most of the major fea-tures in the observed ground water record for mostshallow wells (Figure 5). The estimated record dupli-cates the general decrease in annual mean hydraulichead in the observational record from 1968 to 1991,as well as its recovery from 1991 to 1997. However,the regression model underestimates hydraulic headsin the early 1970s and predicts slightly inflated peaks in 1975, 1980, 1986, and 1989. Chen et al.(2002) used similar statistical techniques to representground water variations in individual wells over amuch larger portion of the UCA. Although their mod-
els had higher average correlation coefficients (r– =0.93), their results were based on a shorter, 15-yearcalibration period and are therefore not directly com-parable to our own. Chen et al. (2002) also reporteddifficulty generating robust models for some wells inthe Winnipeg area, citing usage patterns as the mainobstacle. The PCA conducted in this study confirmsthat several of the deeper well records in Winnipegdisplay unique trends that likely reflect a stronganthropogenic influence, as further described below.
Although the stepwise regression procedure doescause tree ring data to enter the ground water model,
JAWRA 1256 JOURNAL OF THE AMERICAN WATER RESOURCES ASSOCIATION
FERGUSON AND ST. GEORGE
Figure 5. Observed (solid line) and Estimated (dashed line) Trends in Hydraulic Head for ShallowWells in the Winnipeg Region With Over 70 Percent of Their Variance Explained by PC1.
The horizontal line represents mean annual hydraulic head between 1965 and 2001.
TABLE 3. Average Annual Ground Water Level Regression Model.
Calibration Period n r r2 Adjusted r2 SE of Estimate
1966 to 1997 32 0.871 0.758 0.722 0.22
Regression CoefficientsBeta SE of Beta B SE of B p-Level
Intercept 222.7 0.3 0.0000
T Annual -0.511 0.110 -0.19 0.04 0.0001
P Annual-1 0.387 0.098 0.0016 0.0004 0.0005
TR1-2 0.320 0.100 0.14 0.04 0.003
TR1 0.332 0.111 0.12 0.04 0.006
annual temperature and precipitation are the mostimportant predictor variables. Including the pair oftree ring parameters increases the amount of vari-ance in ground water levels by approximately 12 per-cent. Given the significant correlation betweenregional oak growth and annual precipitation report-ed by St. George and Nielsen (2002), we hypothesizedthat excluding the precipitation variables from theregression model would increase the importance ofthe tree ring data. A second regression model (notshown) was developed using only temperature andtree ring parameters, and although this model onlyexplained 58 percent of the total variance, it accurate-ly represented the major trends of ground water lev-els in the UCA during the calibration period.
Estimated Ground Water Levels
The primary regression model (using precipitation,temperature, and tree ring predictors) was used toestimate changes in average hydraulic head withinshallow wells in Winnipeg between 1907 and 1965.The reconstruction suggests that ground water levelshave been relatively stable during the 20th Century,with no monotonic trends induced by hydroclimaticfactors over the entire period. The mean of the obser-vational record (223.14 masl) is not significantly dif-ferent than the 1907 to 2000 mean (223.10 masl).However, the range of hydraulic head appears to havebeen slightly greater prior to the establishment ofinstrumental monitoring. For example, estimatedhydraulic heads in 1931 and 1940 (222.4 and 222.3masl, respectively) are lower than the lowest value inthe instrumental record (222.5 masl in 1991). Thehighest modeled average annual hydraulic headoccurs in 1943 (223.7 masl) and is slightly lower thanthe highest head in the instrumental record (223.8masl in 1966). The reconstruction also contains peri-ods of prolonged elevated and depressed ground waterlevels, most notably a low interval between 1930 and1942. During this 13-year period, ground water levelswere estimated to have been above the instrumentalaverage only twice; high levels in 1943 ended this lowperiod. Hydraulic heads fell slowly through the 1950sand early 1960s. Although the highest ground waterlevels occurred at the onset of instrumental monitor-ing, the extended record suggests that this increasebegan circa 1963, with above average levels lastingfrom 1964 to 1972. Overall, levels exhibited a signifi-cant decline between 1966 and 1991, with netdecreases of roughly 1.5 meters. Aquifer levels in theshallow wells have increased by approximately 1.2meters since the early 1990s.
DISCUSSION
The historical pattern of ground water fluctuationsobserved in Winnipeg varies depending on the hydro-graphic setting of the wells under investigation. Withthe exceptions of those wells located in the center ofthe urban drawdown cone, most of the changes inground water levels recorded by shallow wells in theUCA and piezometers in the overlying clays and tillscan be attributed to climatic forcings. Decreasingground water levels through the 1970s and 1980sseem to be related to gradual warming in Winnipegsince the early 1960s. In 1978, annual precipitationshifted into a low mode that culminated with anextended dry period between 1986 and 1990. Thisinterval combined with high annual temperatures toproduce extremely low ground water levels for sixconsecutive years, 1987 through 1992. Persistentlyhigh ground water levels between 1964 and 1972appear to have been produced by a combination of lowtemperatures and above average annual precipita-tion. From 1963 to 1972, all but two years had above-average total precipitation, including 742.2 mm in1963, the second highest annual total recorded atWinnipeg.
Hydrographic records from shallow wells are signif-icantly correlated with annual temperature and pre-cipitation, which implies that recharge movesrelatively quickly through the clay and till overlyingthe UCA. Day (1977) suggested that transport ratesthrough fractures in the clay unit ranged between 4.7and 730 m/yr. Under the assumption that this route isthe dominant recharge path, hydraulic heads in theUCA should exhibit a damped response to climaticforcings, with lags of up to five years. The response ofhydraulic head to individual precipitation eventsoccurs over a much shorter period, as it is related tohydraulic diffusion rather than travel times, buttransport rates give an idea of the rate at which waterrecharges the aquifer, which is of interest from awater balance perspective. Our results suggest that,at least in the Winnipeg region, the overall responseof ground water levels to precipitation in shallow por-tions of the UCA at lags greater than 24 months areminimal.
The lack of correspondence between ground waterlevels in deeper wells and hydroclimatic variablessuggests that variations in hydraulic head in deeperflow systems are largely driven by changes in anthro-pogenic usage and were not sensitive to climatic vari-ability observed during the past three and a halfdecades. The continuous rise in the deep monitoringwells observed since 1966 is likely driven by the injec-tion of wastewater into the UCA and underlying car-bonate units. Since the 1960s, ground water use in
JOURNAL OF THE AMERICAN WATER RESOURCES ASSOCIATION 1257 JAWRA
HISTORICAL AND ESTIMATED GROUND WATER LEVELS NEAR WINNIPEG, CANADA, AND THEIR SENSITIVITY TO CLIMATIC VARIABILITY
the Winnipeg area has changed from consumptive tononconsumptive use, particularly with regard to deep-er wells installed for industrial purposes. This policyhas led to a recovery of the drawdown cone beneathcentral Winnipeg, which is clearly expressed in thedeep well hydrographs; ground water levels in wellsG05OJ021, G05OJ28, and GS-M 118 have increasedby more than 7 meters during the observation period.Although the influence of hydroclimatic forcings islikely superimposed over this continuous, anthro-pogenically driven increase in the deeper wells, theabsence of accurate withdrawal and pumping data formajor users in Winnipeg prevents any attempt tomodel the relative contribution of these two factors topast changes in ground water levels.
The model produced in this study provides an esti-mate of past changes in local ground water levelscaused by climatic forcings but does not account forpotential anthropogenic influences during the early20th Century. For example, the construction of floodprotection around Winnipeg during the 1960s influ-enced regional hydrogeology by creating an additionalground water discharge area within the WinnipegFloodway diversion channel. Since significantchanges in ground water usage and alterations of flowpaths occurred just prior to our calibration interval,our ground water model cannot account for possibleshifts in hydraulic head caused by such anthropogeniceffects. In effect, our record reflects changes in groundwater levels forced by climate only and is not an esti-mate of actual ground water levels, which includecontributions from both natural and anthropogenicforcings. Despite these limitations, our record sug-gests that the range of hydraulic heads observed dur-ing the previous 36 years does not reflect the fullrange of natural variation. Although the average levelduring the 1907 to 2001 period is not significantly dif-ferent from that of the monitoring record, modeledground water levels in the 20th Century reached theirlowest point during the 1930s and 1940s. However,the particular combination of factors that contributedto extreme ground water levels in the past appear tohave been variable. Annual temperatures in 1930were the second warmest on record (exceeded only by1988), which suggests that extremely low groundwater levels can be produced by short term warming.In contrast, annual temperatures were only 0.04degrees Celsius above normal in 1940, but because itwas preceded by four out of five successive years withannual precipitation more than 75 mm below average,ground water levels are estimated to have reachedtheir lowest ground water levels during the past 100years. Although tree ring and limnological recordssuggest that Winnipeg and the northeastern plainsexperienced an extended arid interval circa AD 1700that lasted for roughly a century (St. George and
Nielsen, 2002), our current model cannot evaluate theimpact of these periods on local ground water sup-plies. However, our results suggest that climatic forc-ing during the 20th Century produced shifts ofroughly 1.5 meters in the ground water levels of theUCA. Any future shifts in ground water levels causedby anthropogenic climatic change or modifications inlocal usage will be superimposed on this natural vari-ation. Therefore, it is likely that these influencesmust force changes in ground water level in excess of1.5 meters to provide unambiguous evidence of theirimpact.
The regression modeling results indicate that treering data are viable measures of past ground waterlevels, but their true value remains uncertain.Because the precipitation and tree ring data used inthis study are highly intercorrelated, these variablesare essentially interchangeable in the predictiveground water model. Although the inclusion of thetree ring data does increase the amount of varianceexplained by the model, we suggest that den-drochronological information might be more useful inground water studies in regions that lack long, highquality precipitation records. Assuming that the treering parameters are related to regional hydrologicalconditions, combining them with temperature datamight produce robust estimates of past changes inground water levels. In regions where long proxy tem-perature records are available, it might be possible todevelop estimated ground water records spanningseveral centuries. We have also considered only onetree ring parameter (total ring width) and one treespecies (bur oak); other species or parameters (e.g.,cell size and thickness or earlywood/latewood widths)might be more closely related to local ground waterconditions.
CONCLUSIONS
Historical ground water studies can provide valu-able insights into the degree of variability in hydroge-ological systems, due to either “natural” influences orhuman consumption. Ground water records also rep-resent the primary data needed to model the influ-ence of climatic forcings on aquifers and thus can beused to develop analogs for ground water responseunder future scenarios of climate change. In thisstudy, we have attempted to demonstrate that proper-ly selected climatological and biological datasetsmimic many of the features present in instrumentalground water data and can therefore be employed todevelop extended “proxy” ground water records. Theseextended records may be used to circumvent some ofthe challenges posed by short instrumental data and
JAWRA 1258 JOURNAL OF THE AMERICAN WATER RESOURCES ASSOCIATION
FERGUSON AND ST. GEORGE
can indicate variations in ground water levels overseveral decades. Our results also suggest that groundwater models developed using traditional climaticpredictors could be improved by the inclusion of mois-ture sensitive tree ring records from importantrecharge areas. Where precipitation records areunavailable, short, or of questionable value, groundwater studies should consider tree ring data as apotential surrogate.
ACKNOWLEDGMENTS
Monitoring well hydrographs analyzed in this study were pro-vided by the Water Branch of the Manitoba Department of Conser-vation. The authors wish to thank Erik Nielsen, Steve Grasby, BobBetcher, and Jim Teller for comments and suggestions and Gay-wood Matile and Greg Keller for providing assistance in figurepreparation. Comments by Harvey Thorleifson and four anonymousreviewers significantly improved the final version of thismanuscript. This paper is GSC contribution 2002-140.
LITERATURE CITED
Betcher, R., G. Grove, and C. Pupp, 1995. Ground Water in Manito-ba: Hydrogeology, Quality Concerns, Management. NHRI Con-tribution, No. CS-93017, March 1995.
Bradley, R., 2000. Past Global Changes and Their Significance forthe Future. Quaternary Science Reviews 19(1-5):391-402.
Chen, Z., S. Grasby, and K. G. Osadetz, 2002. Predicting AverageAnnual Groundwater Levels From Climatic Variables: AnEmpirical Model. Journal of Hydrology 260(1-4):102-117.
Cleaveland, M. K., 2000. A 963-Year Reconstruction of Summer(JJA) Streamflow in the White River, Arkansas, USA, FromTree Rings. The Holocene 10(1):31-41.
Cook, E. R. and G. C. Jacoby, 1983. Potomac River StreamflowSince 1730 as Reconstructed by Tree Rings. Journal of Climateand Applied Meteorology 22(10):1659-1672.
Day, M. J., 1977. Analysis of Movement and Hydrochemistry ofGround Water in the Fractured Clay and Till Deposits of theWinnipeg Area, Manitoba. M.Sc. Thesis, University of Waterloo.Waterloo, Ontario. Canada, pp. 210. Canadian Government Doc-ument Call No. CA2ONUW 42077A52.
Freeze, R. A. and J. A. Cherry, 1979. Groundwater. Prentice Hall,Inc, New York, New York.
Fritts, H. C., G. R. Logfren. and G. A. Gordon, 1979. Variations inClimate Since 1602 as Reconstructed From Tree Rings. Quater-nary Research 12(1):18-46.
Grasby, S. E. and R. N. Betcher, 2002. Regional Hydrogeochemistryof the Carbonate Rock Aquifer, Southern Manitoba. CanadianJournal of Earth Sciences 39(7):1053-1063.
Loaiciga, H. A., L. Haston. and J. Michaelsen, 1993. Dendrohydrol-ogy and Long-Term Hydrologic Phenomena. Reviews of Geo-physics 31(2):151-171.
Mekis, E. and W. D. Hogg, 1999. Rehabilitation and Analysis ofCanadian Daily Precipitation Time Series. Atmosphere-Ocean37(1):53-85.
Render, F. W., 1970. Geohydrology of the Metropolitan WinnipegArea as Related to Groundwater Supply and Construction.Canadian Geotechnical Journal 7(3):243-274.
Render, F. W., 1971. Electric Analog and Digital Modeling of theUpper Carbonate Aquifer in the Metropolitan Winnipeg Area:Geoscience Studies in Manitoba. Special Paper, Geological Asso-ciation of Canada 9:311-320.
Richman, M. B., 1986. Rotation of Principal Components. Journalof Climatology 6:293-335.
Rutulis, M., 1989. Groundwater Drought Sensitivity of SouthernManitoba. Canadian Water Resources Journal 14(1):18-33.
St. George, S. and E. Nielsen, 2002. Hydroclimatic Change inSouthern Manitoba Since A.D. 1409 Inferred From Tree Rings.Quaternary Research 58(2):103-111.
Sanz Perez, E., 1997. Estimation of Basin-Wide Recharge RatesUsing Spring Flow, Precipitation, and Temperature Data.Ground Water 35(6):1058-1065.
Singh. V. P., 1992. Elementary Hydrology. Prentice Hall, EnglewoodCliffs, New Jersey.
van der Kamp, G. and H. Maathuis, 1991. Annual Fluctuation ofGroundwater Levels as a Result of Loading by Surface Mois-ture. Journal of Hydrology 127(1-4):137-152.
Vincent, L. A. and D. W. Gullett, 1999. Canadian Historical andHomogeneous Temperature Datasets for Climate Change Analy-ses. International Journal of Climatology 19(12):1375-1388.
Woodhouse, C. A., 2001. A Tree-Ring Reconstruction of Streamflowfor the Colorado Front Range. Journal of the American WaterResources Association (JAWRA) 37(3):561-569.
JOURNAL OF THE AMERICAN WATER RESOURCES ASSOCIATION 1259 JAWRA
HISTORICAL AND ESTIMATED GROUND WATER LEVELS NEAR WINNIPEG, CANADA, AND THEIR SENSITIVITY TO CLIMATIC VARIABILITY