Embed Size (px)
Citation preview

Historical and Current Climate in the Rio Grande National Forest
Area
Peter Goble
Nolan Doesken
10/19/2016

Geographic Orientation

Geographic Orientation

Geographic Orientation

Rio Grande National Forest Climate Normals

Rio Grande National Forest Climate Normals
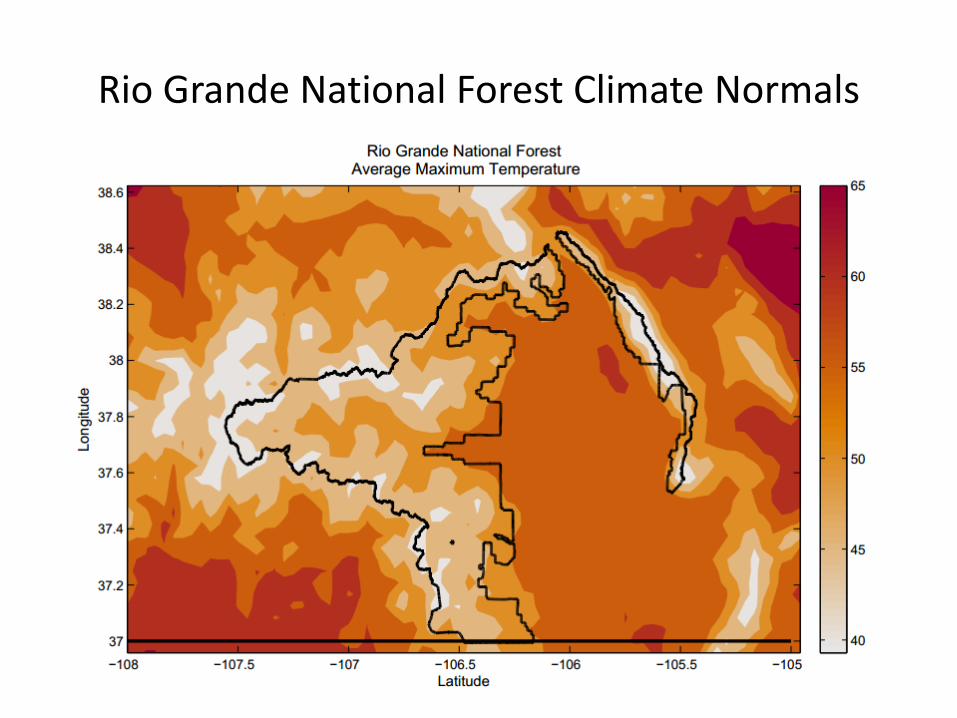
Rio Grande National Forest Climate Normals

Rio Grande National Forest Climate Normals

Rio Grande National Forest Temperature and Precipitation Extremes

Summer Frost Free Days
• Nocturnal pooling of cold air in the valleys makes for a short growing season
• The high valleys of the Rio Grande National Forest sometimes experience a frost free season shorter than a month
• Frost free days trending strongly positively over the past decade

Annual Precipitation Distribution
2002

Heaviest 24-hour Totals on Record
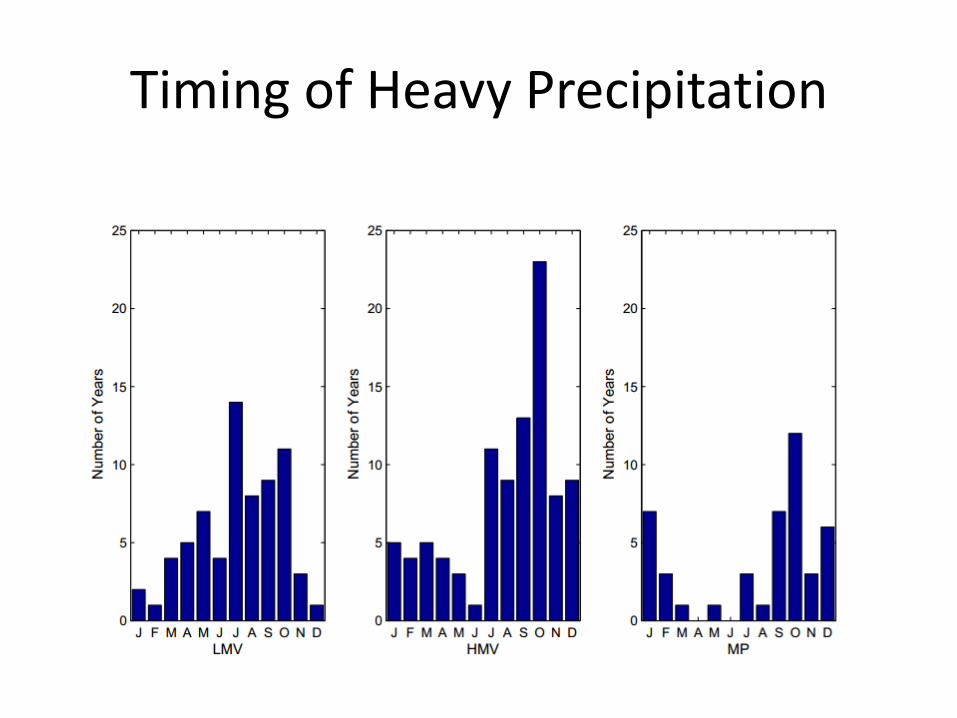
Timing of Heavy Precipitation

It’s finger-cracklingly dry

It’s cold, but very sunny
• Solar radiation received will vary largely based on mountain slope angle
• The downward enhanced downward trend in July and August presumably is related to monsoonal activity
• Potential for high downward solar flux always maximizes on the summer solstice

Gridded Mean Annual Snowfall (kind of)

Basic Climate Conclusions
• Rio Grande National Forest climate varies most primarily by latitude
• The landlocked nature of the forest leads to predominantly dry conditions and large swings in temperatures both diurnally and annually
• Due to drainage of cold air into mountain valleys the frost-free season is short
• Intense precipitation events are possible in the valleys only in summer, but for most of the year in the mountains
• Precipitation varies more absolutely in the mountains, but as a percent of normal in the valleys

35-year Precipitation Trends
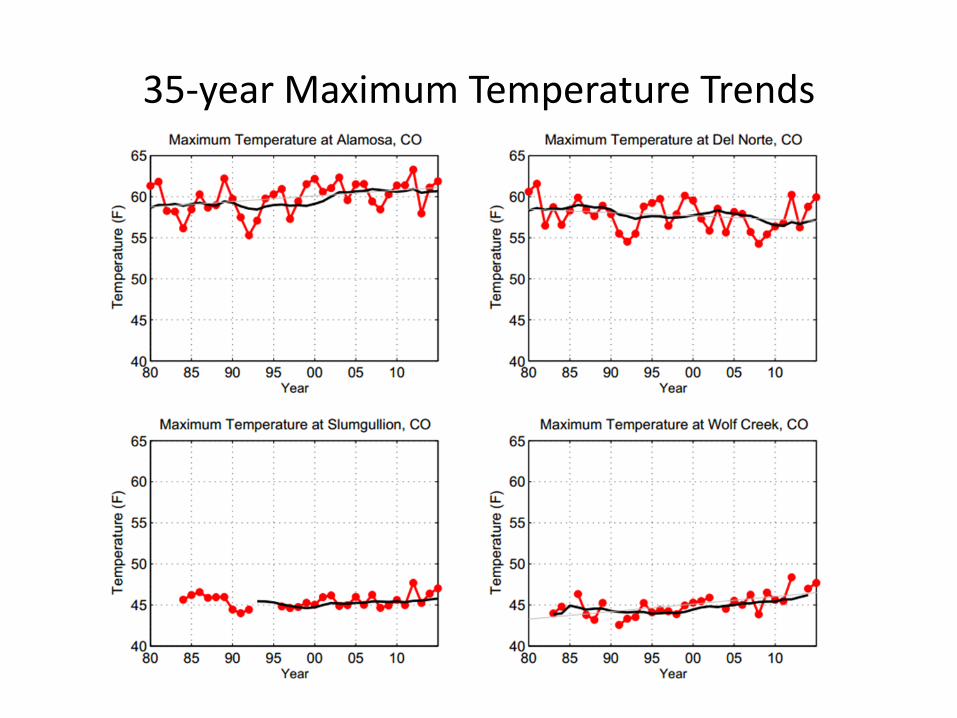
35-year Maximum Temperature Trends

35-year Minimum Temperature Trends

Long-term Climate Trends (Hermit)

Long-term Climate Trends (Del Norte)

Gridded Mean Annual Snowfall (kind of)
1
2
3
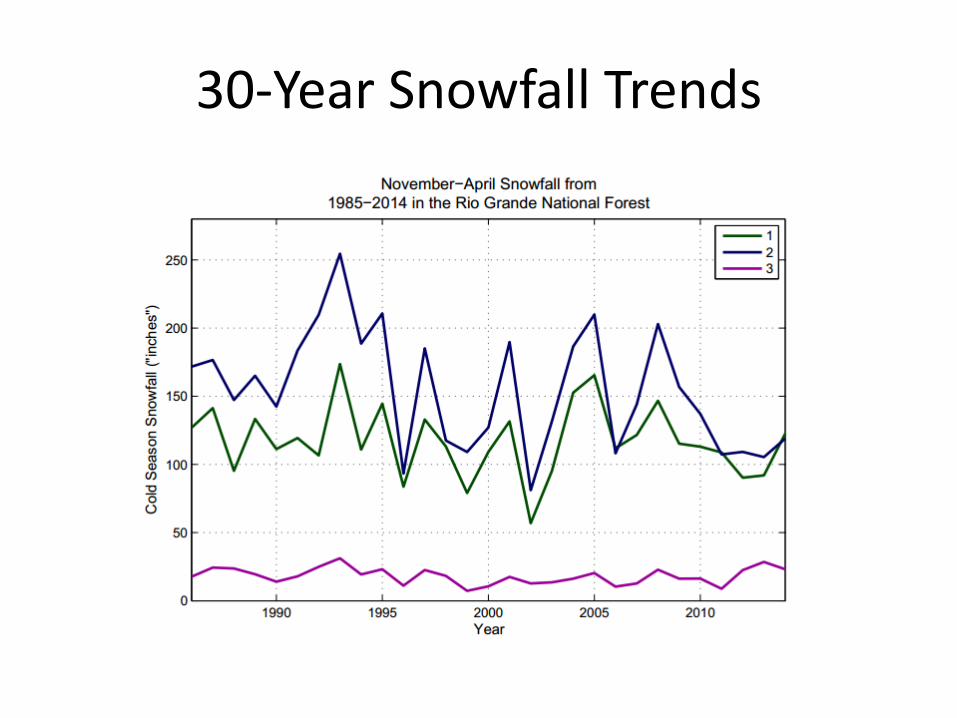
30-Year Snowfall Trends

Seasonal Snowfall Disclaimer:
• What was has actually been shown using reanalysis data is the liquid water content from snowfall multiplied by 10
• On average, 10” of fresh snowfall will melt down to 1” of water, but this is NOT a constant
• Snow:liquid ratios can vary by as much as 40:1 in champagne powder-type events to 3:1 or less in slush, or rain-snow mix events
• Numerical weather models, satellites, and automated weather stations all do not handle this well. If you want good snowfall measurements, manual measurements are still the gold standard

Snowfall: We still need ground reports!

Gridded March Mean Snowpack

Gridded Mean Annual Snowfall (kind of)

High Elevation Snowpack Trending Downwards
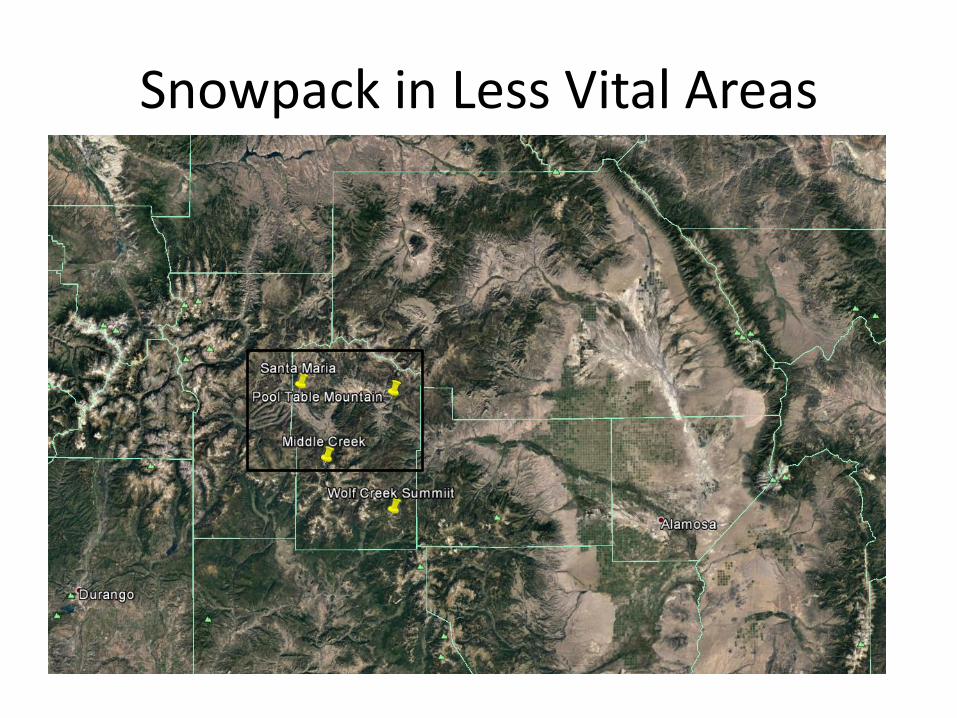
Snowpack in Less Vital Areas
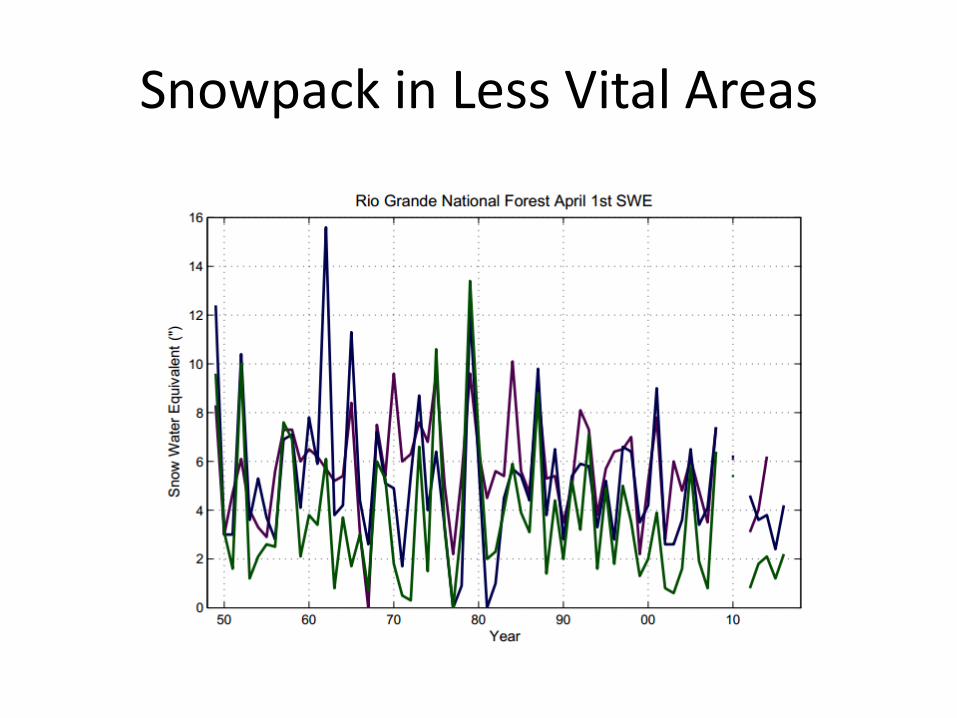
Snowpack in Less Vital Areas

• This is seasonal forecasting, so signal:noise ratio is low
• 2012 was Steamboat’s worst year in the last 30, and that was a La Niña
• 2002 was Wolf Creek’s worst year, and was near neutral

Seasonal Breakdown of Trend Significance
• High and low elevations have experienced significant warming of daily minimum temperatures over the last 30 years
• Long-term climate data in the area are sparse, and changes in observers, equipment, and location have all influenced trends
• Warming of daily maximum temperatures more significant at higher elevations, and in summer and fall
• In many cases the scale of year-to-year variability is larger than that of trends
• ENSO a poor predictor of seasonal temperature and precipitation for the Rio Grande National Forest

Streamflow
• Peak Precipitation season and peak flows uniquely out of phase
• Rain on snow flooding is rare compared to other parts of Colorado
• Summer and fall flash floods still possible

Wind Patterns of a Mountain Climate

Windward and Leeward Weather
• It is difficult for large storms to hit the forest since it is shadowed by mountains on three sides • When a storm hits, and stable air is over head warm, windy weather will occur
• As air rises over a mountain it expands and cools
• Cool air cannot hold as much water, so condensation occurs
• Condensation releases latent heat, which opposes the cooling effect

Windward and Leeward Weather
• It is difficult for large storms to hit the forest since it is shadowed by mountains on three sides • When a storm hits, and stable air is over head warm, windy weather will occur
• When air is stable on the other side of the mountain it descends
• The descending air is compressed, which has a warming effect
• This warm, dry air descends into the valleys and can melt snow quickly

Higher Elevation = More Solar Radiation
• Some sunlight passing through the atmosphere is reflected back to space by clouds, air and dust before reaching the surface
• Some sunlight is absorbed before reaching the surface
• Consequence: Higher elevations (while colder) actually receive more intense sunlight
• Wear sunscreen!

Thunderstorm Generation
5:30 AM
1 2
3 4
5
• In the early morning air has stratified according to density with cool air in the valleys (ie bubbles 1 and 2 are at the same elevation and the same density, same with 3 and 4)
• In this example prevailing winds above mountain top in what we call the “free atmosphere” are westerly

Thunderstorm Generation
11:00 AM
1 2
3 4
5
• In the late morning the sun is out, and the surface is absorbing the lion’s share of the energy
• Higher elevation surfaces have more radiation impinging on them than low elevation surfaces do
• This energy starts to warm the air nearest the ground and make it less dense

Thunderstorm Generation
1:00 PM 1
2
3 4
5
• By 1:00 PM (solar noon) a warm bubble of air has formed over the high mountains and started to rise. This air is being replaced by less dense air at the same elevation.
• The rising air saturates and forms a cloud. Condensed water has less energy than water vapor. The energy from the vapor is not destroyed, but released to the atmosphere as heat.

Thunderstorm Generation
2:30 PM 1 2
3
4
5
• By mid-afternoon the near-surface air has warmed and begun to rise at all levels.
• The air initially near the mountain top surface has become heavy with water and begins to rain. It travels back out over the plains in the direction of the prevailing winds
• This air is replaced by air from further down rushing up the mountain slope.

Thunderstorm Generation 4:00 PM
1 2 3
4
5
• Air all the way down to the valley surface rushes up the mountain slopes
• The thunderstorm propagates out over the plains in the direction of the upper-level prevailing winds
• Sun-warmed surface air is replaced by cooler air flowing out of the thunderstorm

Thunderstorm Timing
https://video.nest.com/clip/00b118b7a63e40f4b3df094bbd2a5e02.mp4

D1
Cold Air Pooling
• A snowy land surface efficiently radiates away energy during the night. This cools the near surface air
• The coolest air becomes the most dense and sinks into the mountain valleys
• Strength of these nighttime inversions may exceed 15 degrees F/thousand feet
P1 P2
4:00 PM

D1
Cold Air Pooling
• A snowy land surface efficiently radiates away energy during the night. This cools the near surface air
• The coolest air becomes the most dense and sinks into the mountain valleys
• Strength of these nighttime inversions may exceed 15 degrees F/thousand feet
P1
P2
9:00 PM

D1
Cold Air Pooling
• A snowy land surface efficiently radiates away energy during the night. This cools the near surface air
• The coolest air becomes the most dense and sinks into the mountain valleys
• Strength of these nighttime inversions may exceed 15 degrees F/thousand feet
P1
P2
3:00 AM

Cold Air Pooling
• A snowy land surface efficiently radiates away energy during the night. This cools the near surface air
• The coolest air becomes the most dense and sinks into the mountain valleys
• Strength of these nighttime inversions may exceed 15 degrees F/thousand feet

Mountain Slope Angle and Climate

Weather Safety (Lightning)

Weather Safety (Lightning)
• Each lightning bolt represents the location of a deadly strike in Colorado
• Both Crestone and Mineral do appear on the list
• Summer afternoons are the most dangerous time of day and year
• Locations above tree line are more dangerous than below tree line

Weather Safety (Floods)

Drought

Fires
• Being warm and dry in the late spring can make the forest vulnerable to fires
• There have been no fire fatalities in the Rio Grande National Forest since at least 1970 (keep it up!)
• Fire vulnerability is expected to increase in future climates (Rocca 2014)

West Fork Complex Fire
• The worst fire in the Rio Grande National Forest occurred in early July of 2013
• This fire burned over 100,000 acres
• The worst of the 2011-2012 drought had passed, but the area had receive less than 50% of normal precipitation in the 90 days leading up to the fire

We Could Use More RAWS Stations

Historic Blizzards

Conclusions

Blue Park
Bighorn
Great Sand Dunes

Precipitation Trends (“/Decade) Winter Spring Summer Fall Annual
Since 1900 0.05 0 0.04 0.04 0.13
Since 1950 0.08 -0.12 -0.03 0.11 0.09
Since 1980 0 -0.48 -0.47 -0.13 -1.06
Maximum Temperature (F/Decade) Winter Spring Summer Fall Annual
Since 1900 -0.2 0.27 0.26 0.14 0.12
Since 1950 -0.63 0.52 0.24 0.13 0.05
Since 1980 -0.54 1.4 0.78 1.12 0.67
Minimum Temperature (F/Decade) Winter Spring Summer Fall Annual
Since 1900 -0.1 0.05 0.17 0.13 0.06
Since 1950 -0.33 0.31 0.3 0.24 0.13
Since 1980 -0.07 0.64 0.5 0.44 0.37
Precipitation ("/Decade) Winter Spring Summer Fall Annual
Since 1900 0 -0.29 0 -0.06 -0.34
Since 1950 0.19 -0.26 0.1 0.17 0.2
Since 1980 0.21 -0.67 -0.23 -0.05 -0.73
Maximum Temperature (F/Decade) Winter Spring Summer Fall Annual
Since 1900 0.02 0.08 0.18 0.04 0.07
Since 1950 -0.27 0.42 0.28 -0.12 0.07
Since 1980 1.28 2.71 0.33 0.27 1.13
Minimum Temperature (F/Decade) Winter Spring Summer Fall Annual
Since 1900 0.38 0.46 0.32 0.38 0.39
Since 1950 0.33 0.22 0.18 0.64 0.34
Since 1980 0.9 1.24 -0.28 0.32 0.55

Precipitation ("/Decade) Winter Spring Summer Fall Annual
Since 1900 0.02 -0.06 -0.05 -0.04 -0.13
Since 1950 0.02 -0.15 -0.14 0.02 -0.25
Since 1980 -0.04 -0.15 -0.08 -0.03 -0.26
Maximum Temperature (F/Decade) Winter Spring Summer Fall Annual
Since 1900 0.31 0.58 0.44 0.36 0.42
Since 1950 -0.21 0.68 0.15 0.07 0.16
Since 1980 0.33 1.6 0.5 0.76 0.76
Minimum Temperature (F/Decade) Winter Spring Summer Fall Annual
Since 1900 -0.01 0.03 0.01 0.03 0.01
Since 1950 -0.36 0.07 0.01 0.03 -0.07
Since 1980 0.27 -0.03 0.05 0.32 0.15
Minimum Temperature (F/Decade) Winter Spring Summer Fall Annual
Since 1900 0.38 0.46 0.32 0.38 0.39
Since 1950 0.33 0.22 0.18 0.64 0.34
Since 1980 0.9 1.24 -0.28 0.32 0.55

15-Day Running Average Temperatures for a Rio Grande National Forest Low Mountain Valley, High Mountain Valley, and Mountain Pass

Monthly Average Temperatures for a Rio Grande National Forest Low Mountain Valley, High Mountain Valley, and Mountain Pass Station