Embed Size (px)
Citation preview
1
HISTORICAL ANALYSIS OF FOREST COVER CHANGES IN SELECTED INDIGENOUS PEOPLES’ AND LOCAL
COMMUNITY (IPLC) LANDS IN INDONESIA
Y. I Ketut Deddy MuliastraGede Aswin Yoga Putra
Anggun Detrina Napitupulu
2
Historical Analysis Of Forest Cover Changes In Selected Indigenous Peoples’
And Local Community (Iplc) Lands In Indonesia
Y. I Ketut Deddy Muliastra, Gede Aswin Yoga Putra, Anggun Detrina Napitupulu
2020
Samdhana InstituteJalan Tampomas No. 33, Bogor 16128 Jawa Barat
i
EXECUTIVE SUMMARYThis report presents additional analysis to the results of a previous report entitled ‘Technical
Support for Creating Baseline Analysis for Carbon Stock and Land Cover Change in Samdhana Institute Focal Areas (2015-2020)’. This report discusses historical changes in forest and non-for-est cover, annual land clearing, historical hotspot occurances, and historical carbon stock changes from 2005 to 2015 in selected Indigenous Peoples’ and Local Community (IPLC) lands in Indone-sia. In this analysis, Landsat 7 imagery is used for data before 2015 and a combination of Landsat 8, Sentinel 1 and Sentinel 2 for data after 2015. Land cover maps from the Ministry of Forestry in 2006 and 2009 were used as a reference to standardize the land cover maps for 2005 and 2010. Forest loss data from Mathew Hansen (University of Maryland) provided the basis and was im-proved using Landsat 7 imagery from 2005 to 2015 to produce annual land or forest clearing data.
According to the spatial analysis, IPLCs in Talang Mamak, Pulang Pisau, and Ketapang expe-rienced the most significant changes in forest and non-forest cover, deforestation rates, hotspot occurances, and reductions in carbon stock. This is probably due to the very high development activities in these three IPLC regions, whereby large concessions on estate crops and forestry have actively operated since before 2005. This condition does not occur in other IPLCs where large-scale concessions are rare. Furthermore, the location of land clearing activities and hotspots exhibited similar annual patterns. Therefore, it can be concluded that the majority of land clearing activities were caused by fires set by both the community and large-scale concessionaires for land preparation.
Following the analysis in this study, it can also be concluded that although the area claimed by IPLCs are quite large, in practice, the use of natural resources for community livelihoods does not significantly contribute to changes in land cover, both on forests and non-forests. A very large change occurred in an area where many large-scale concessions were already operating, pro-viding accessibility and an increase in land competition, not only between large concessions and IPLCs, but also between IPLCs and migrants. The results of the analysis show that fire is always used in the process of land clearing, both in forest and non-forest cover by either large conces-sions, IPLCs or other communities.
ii
CONTENTSEXECUTIVE SUMMARY ..................................................................................................... i
CONTENTS ........................................................................................................................ ii
LIST OF FIGURE ................................................................................................................ iii
LIST OF TABLES ................................................................................................................ iv
LIST OF ABBREVIATION .................................................................................................... v
1. BACKGROUND .............................................................................................................. 1
2. METHODOLOGY ............................................................................................................ 2
2.1. SELECTED INDIGENOUS PEOPLES AND LOCAL COMMUNITIES (IPLC) ............. 2
2.2. SATELLITE IMAGERY AND ANALYSIS OF LAND COVER
AND LAND CLEARANCE ........................................................................................ 10
2.3. FOREST FIRE ANALYSIS ....................................................................................... 11
2.4. CARBON STOCK ANALYSIS ................................................................................... 11
3. HISTORICAL CHANGES OF LAND COVER IN SELECTED IPLC IN INDONESIA
IN 2005-2010, 2010-2015, AND 2015-2020 PERIODS .................................................... 13
3.1. HISTORY OF FOREST COVER CHANGE ............................................................... 13
3.2. HISTORY OF CHANGES IN NON-FOREST LAND USE .......................................... 20
3.3. HISTORICAL OCCURRENCE OF HOTSPOTS ........................................................ 24
3.4. HISTORICAL CHANGES OF ABOVE GROUND CARBON STOCKS ........................ 26
4. SUMMARY AND CONCLUSION ...................................................................................... 28
REFERENCE ...................................................................................................................... 33
iii
LIST OF FIGURE Figure 1. Location of 11 selected indigenous peoples and local community territories.................................. 2
Figure 2. Current map of elevation, forest area and land cover at Mukim Lamteuba IPLC............................ 3
Figure 3. Current map of elevation, forest area and land cover at Talang Mamak IPLC................................ 3
Figure 4. Current maps of elevation, forest area, and land cover at Ketapang IPLC..................................... 4
Figure 5. Current map of elevation, forest area and land cover at Pulang Pisau IPLC.................................. 5
Figure 6. Current map of elevation, forest area and land cover at Kapuas Hulu IPLC................................... 5
Figure 7. Current map of elevation, forest area, and land cover at the Boh River IPLC............................... 6
Figure 8. Current map of elevation, forest area, and land cover at Sigi IPLC................................................ 7
Figure 9. Current map of elevation, forest area, and land cover in the Tambrauw IPLC................................ 7
Figure 10. Current map of elevation, forest area, and land cover at South Manokwari IPLC........................ 8
Figure 11. Current map of elevation, forest area, and land cover at Biak Numfor IPLC................................. 9
Figure 12. Map of elevation, forest area, and land cover of Jayapura IPLC.................................................. 9
Figure 13. The area of forest cover in each IPLC from 2005-2020................................................................ 15
Figure 14. The area of change in forest cover in each IPLC from 2005-2020............................................... 15
Figure 15. The area of forest clearing in each type of forest cover in each IPLC from 2005-2019................ 17
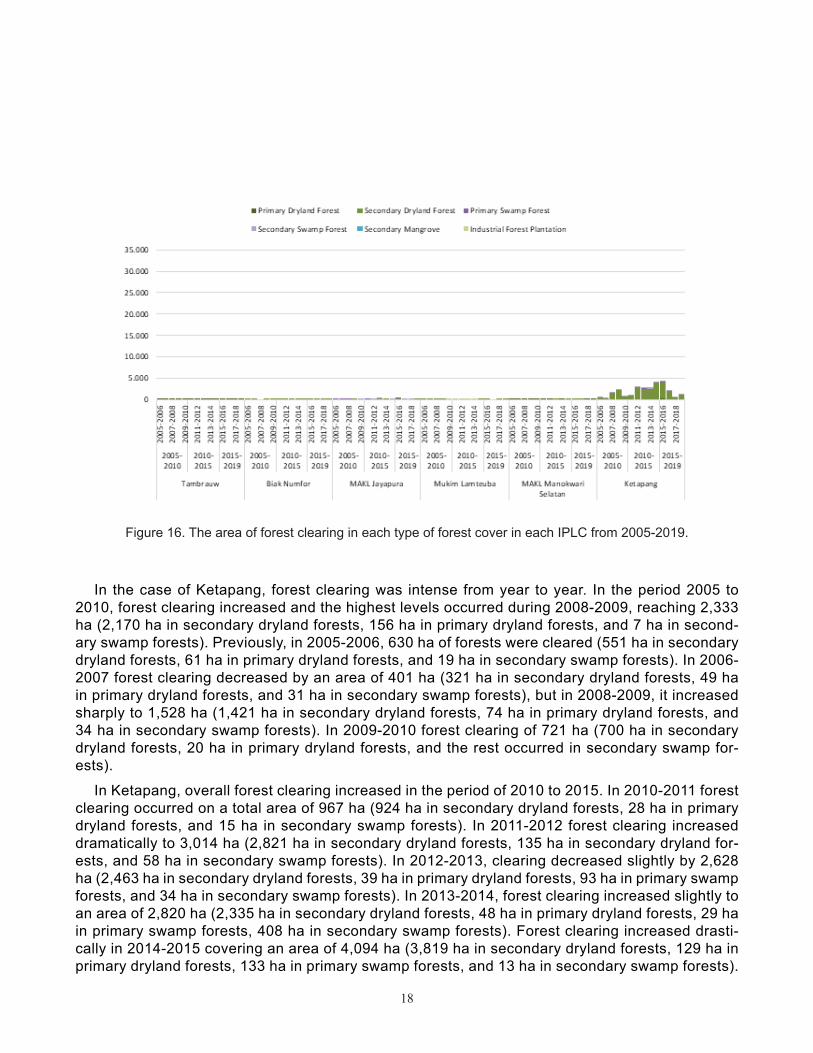
Figure 16. The area of forest clearing in each type of forest cover in each IPLC from 2005-2019................ 18
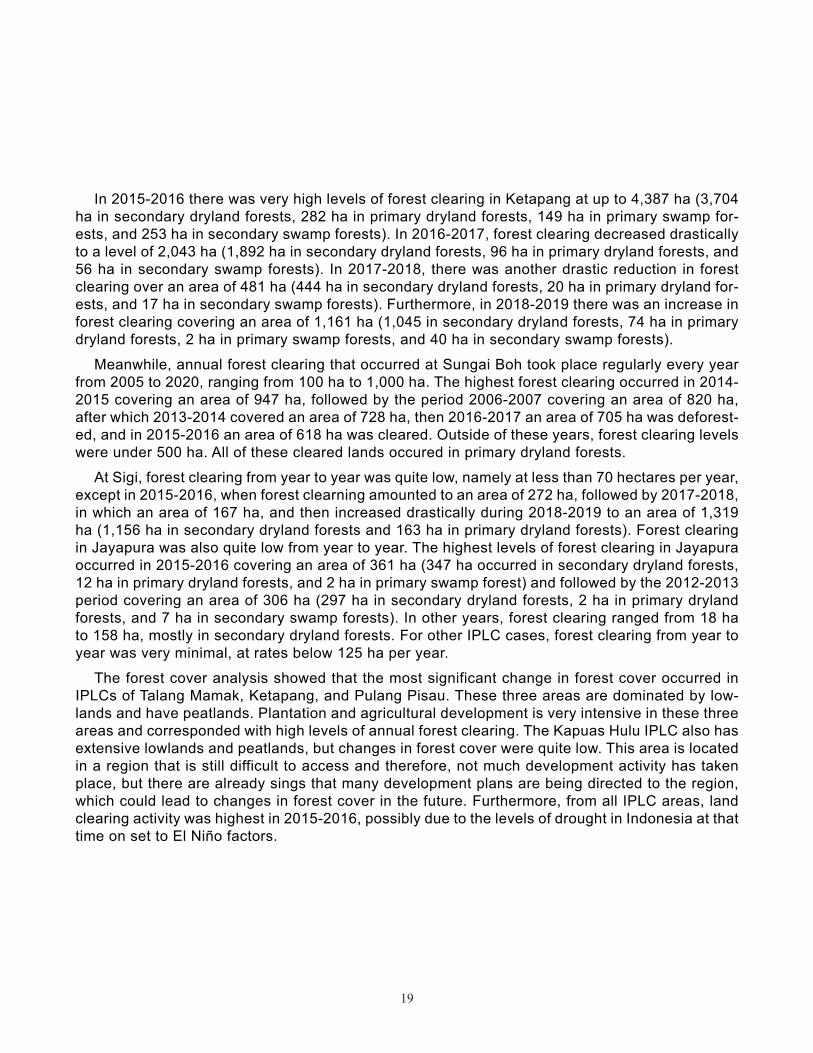
Figure 17. Non-forest cover area in each IPLC from 2005-2020................................................................... 20
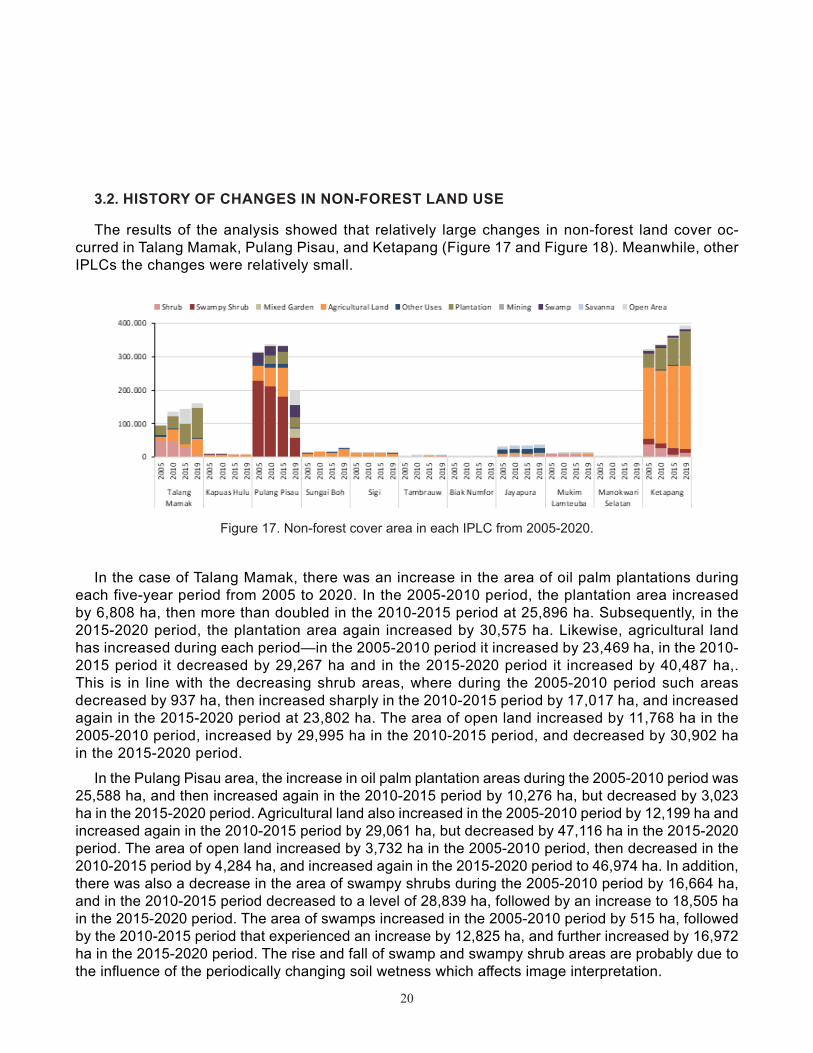
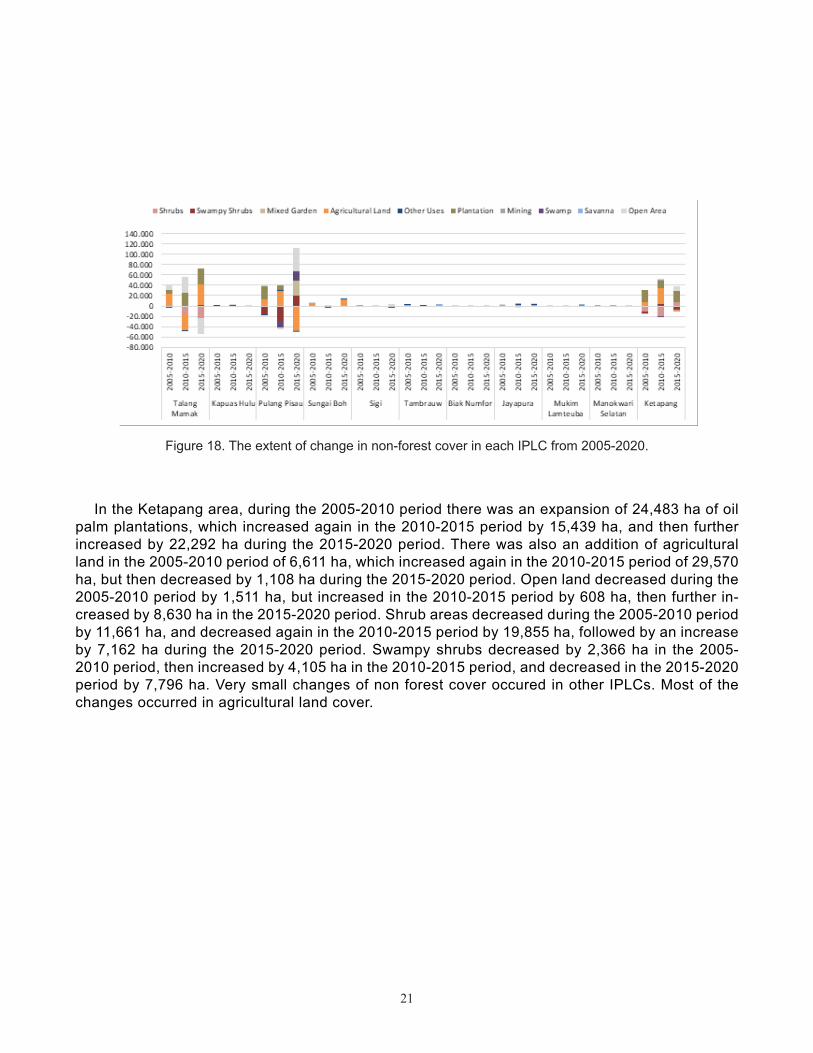
Figure 18. The extent of change in non-forest cover in each IPLC from 2005-2020..................................... 21
Figure 19. The area of land clearing at non-forest cover in each IPLC from 2005-2019............................... 22
Figure 20. The area of land clearing at non-forest cover in each IPLC during 2005-2019............................ 23
Figure 21. Hotspot incidence in each IPLC for each type of forest cover from 2005-2019............................ 24
Figure 22. Hotspot incidence in each IPLC for each type of forest cover from 2005-2019............................ 24
Figure 23. Hotspot incidence in each IPLC for each type of non-forest cover from 2005-2019.................... 25
Figure 24. Hotspot incidence in each IPLC for each type of non-forest cover from 2005-2019.................... 25
Figure 25. Changes in carbon stocks in each IPLC for each type of forest and non-forest cover from 2005-2019........ 26
Figure 26. Deforestation in Pulang Pisau from 2005 to 2020 overlaid with oil palm plantation concessions........ 29
Figure 27. Deforestation in Ketapang from 2005 to 2020 overlaid with concessionaries of industrial
forest plantations (IUPHHK-HTI), logging (IUPHHK-HA), and oil palm plantations...................... 30
Figure 28. Deforestation in Talang Mamak from 2005 to 2020 overlaid with oil palm plantation,
mining, and industrial forest / timber plantation concessions........................................................ 30
Figure 29. Forest transition curve with patterns of temporal, spatial, or institutional change......................... 31
iv
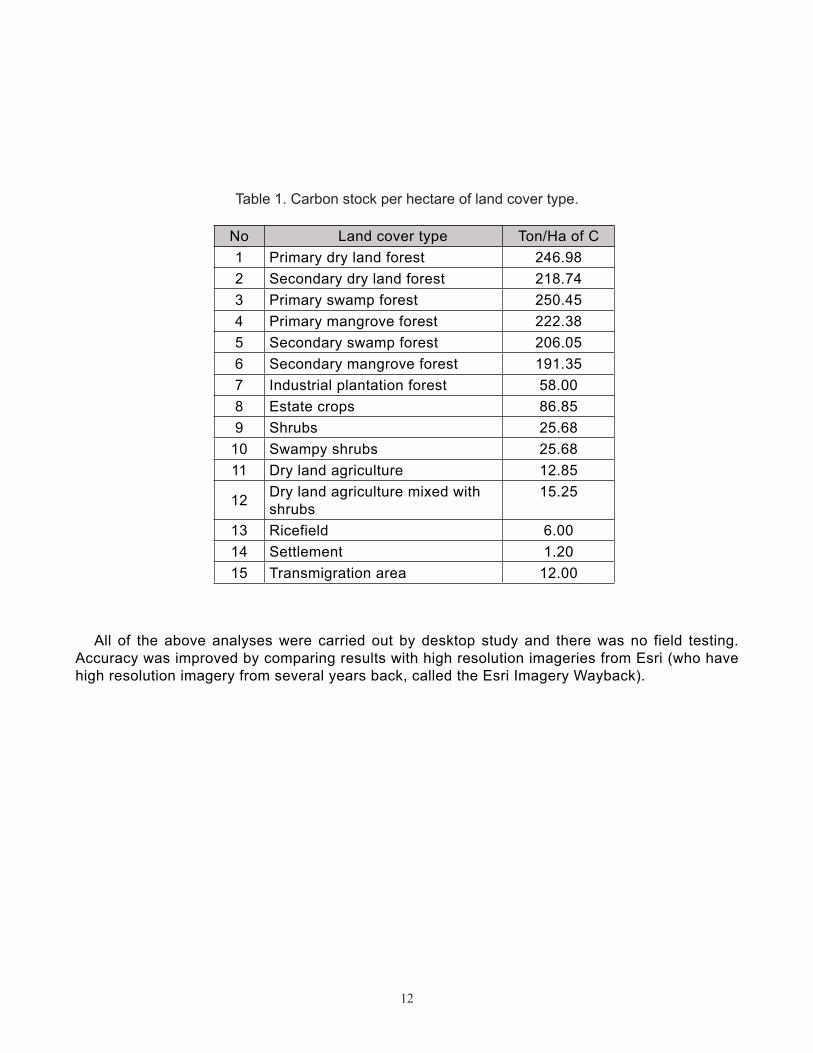
LIST OF TABLESTable 1. Carbon stock per hectare of land cover type..................................................................... 12
Table 2. Total and average amount per hectare of carbon stock in each IPLC............................... 27
Table 3. Summary of spatial analysis for each IPLC....................................................................... 32
v
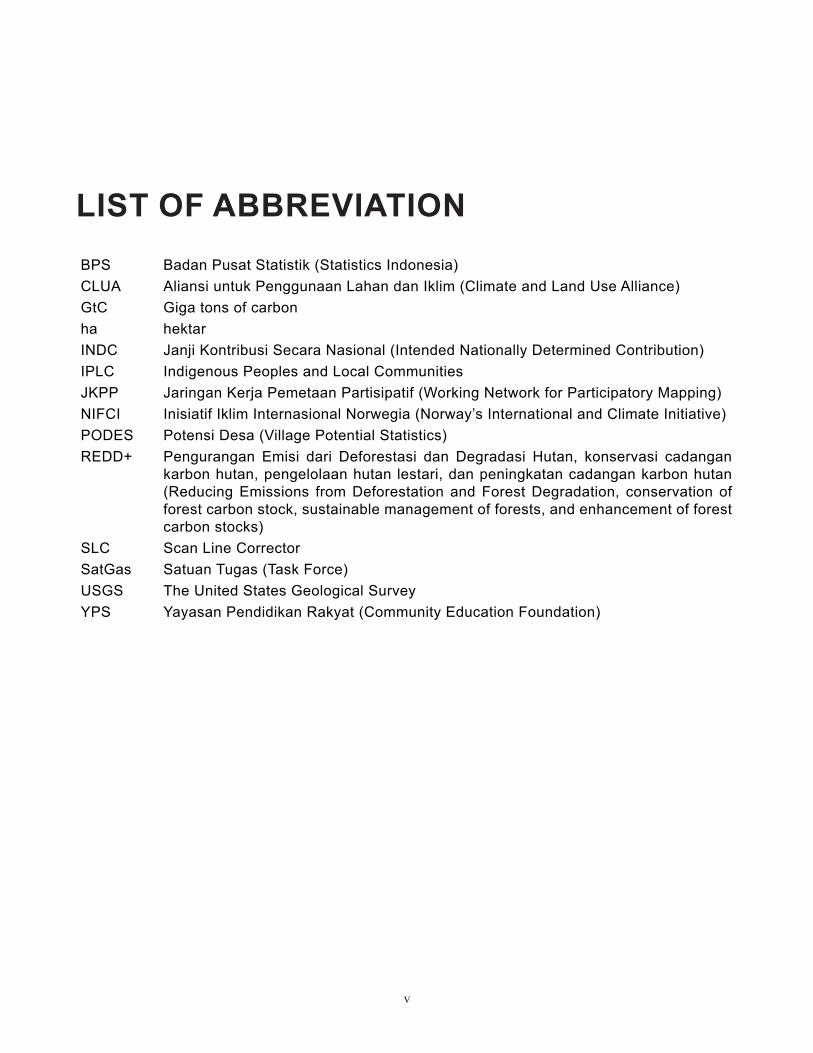
LIST OF ABBREVIATIONBPS Badan Pusat Statistik (Statistics Indonesia)CLUA Aliansi untuk Penggunaan Lahan dan Iklim (Climate and Land Use Alliance)GtC Giga tons of carbonha hektarINDC Janji Kontribusi Secara Nasional (Intended Nationally Determined Contribution)IPLC Indigenous Peoples and Local CommunitiesJKPP Jaringan Kerja Pemetaan Partisipatif (Working Network for Participatory Mapping)NIFCI Inisiatif Iklim Internasional Norwegia (Norway’s International and Climate Initiative)PODES Potensi Desa (Village Potential Statistics)REDD+ Pengurangan Emisi dari Deforestasi dan Degradasi Hutan, konservasi cadangan
karbon hutan, pengelolaan hutan lestari, dan peningkatan cadangan karbon hutan (Reducing Emissions from Deforestation and Forest Degradation, conservation of forest carbon stock, sustainable management of forests, and enhancement of forest carbon stocks)
SLC Scan Line CorrectorSatGas Satuan Tugas (Task Force)USGS The United States Geological SurveyYPS Yayasan Pendidikan Rakyat (Community Education Foundation)
1
1. BACKGROUNDSamdhana manages grants from several donor agencies, such as Norway’s International
and Climate Initiative (NICFI), the David and Lucile Packard Foundation, Climate and Land Use Alliance (CLUA), Ford Foundation, and the World Bank (through the Dedicated Grants Mechanism - Indonesia), which has an overall budget of around six million USD per year. The focus of Samdhana is to ensure and protect the rights of access for Indigenous Peoples and Local Communities (IPLC) to their land and natural resources as a source of identity and livelihood.
During the end of 2020 reflection, Samdhana set out to examine the relationship between IPLC rights and their livelihoods relative to land cover, land use change, forest fires, and car-bon stocks. Samdhana conducted a baseline analysis of historical forest cover and land use dynamics in specific locations where Samdhana had previously worked to support IPLC and/or partner civil society organizations. The analysis was carried out from the period of 2005-2020. This analysis is a continuation of the previous analysis that was carried out for the 2015-2020 period, which was then combined with the 2005-2015 period. The selection for the 2015-2020 period coincides with the beginning of President Jokowi’s administration, which from the outset expressed a strong commitment to continue the moratorium on new licenses in primary forests and peatlands; pledged national contributions (Intended Nationally Deter-mined Contribution/INDC) by taking various steps to reduce greenhouse gas emissions; ex-panded the recognition of IPLC rights through customary forest and social forestry programs; and issued a Letter of Intent with the Norwegian government for entering the transition period from the preparatory phase to the results-based payment phase.
This report describes the methodology and results of a historical analysis of forest cover change from 2005 to 2020 in the following selected IPLC lands: 1) Aceh Besar District in Aceh Province, 2) Indragiri Hulu Regency in Riau Province, 3) Ketapang Regency in West Kalimantan Province, 4) Kapuas Hulu Regency in West Kalimantan Province, 5) Pulang Pisau Regency in Central Kalimantan Province, 6) Malinau Regency in North Kalimantan Province, 7) Sigi Regency in Central Sulawesi Province, 8) Tambrau Regency in West Papua Province, 9) South Manokwari Regency in West Papua Province, 10) Biak Numfor Regency in Papua Province, and 11) Jayapura Regency in Papua Province.
2
2. METHODOLOGYThis section describes the conditions of the selected IPLC areas, the steps of collecting and
processing satellite images, and the methods used for land cover change analysis, annual land clearing analysis, hotspot occurance analysis, and carbon accounting analysis.
2.1. SELECTED INDIGENOUS PEOPLES AND LOCAL COMMUNITIES (IPLC)
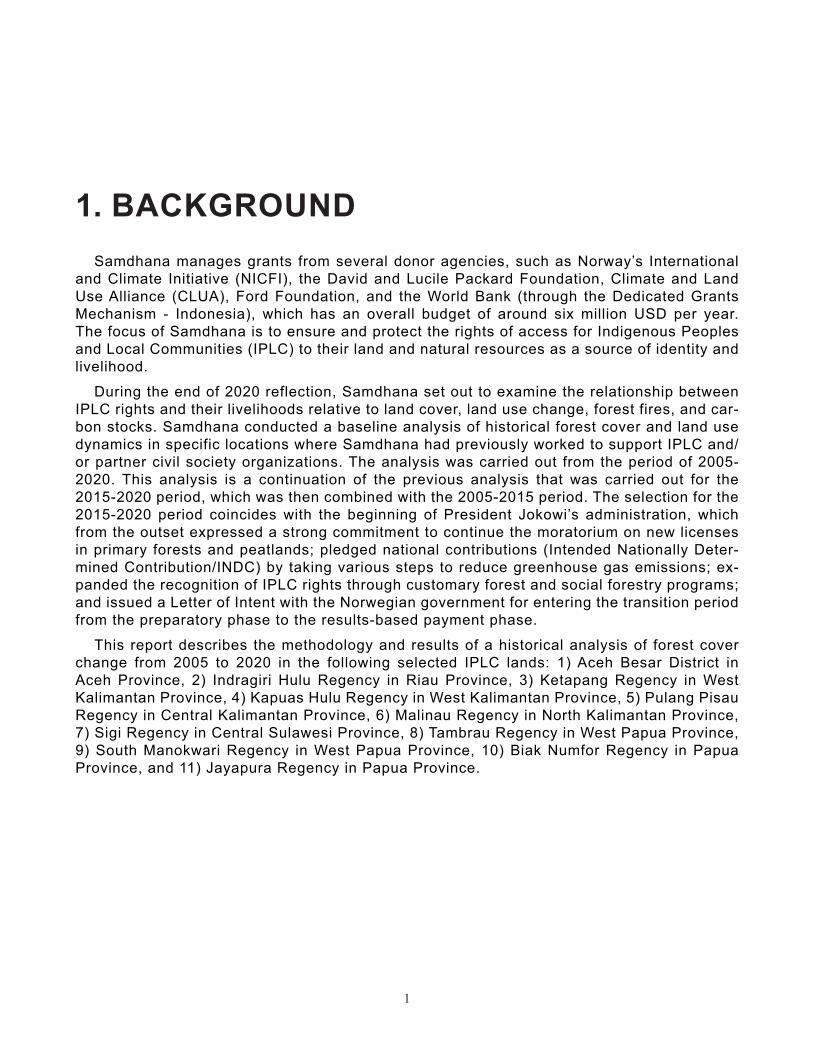
The 11 selected IPLC study areas are shown in the following figure (Figure 1) and further details on these study areas are provided below.
Figure 1. Location of 11 selected indigenous peoples and local community territories.
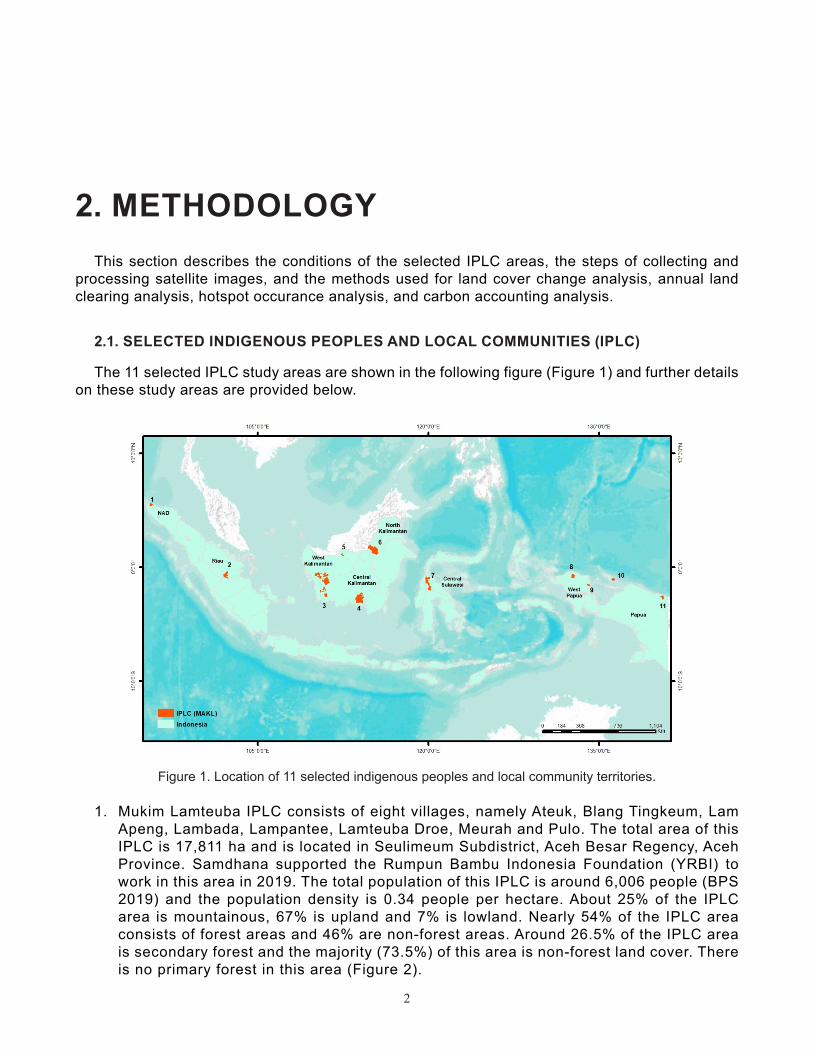
1. Mukim Lamteuba IPLC consists of eight villages, namely Ateuk, Blang Tingkeum, Lam Apeng, Lambada, Lampantee, Lamteuba Droe, Meurah and Pulo. The total area of this IPLC is 17,811 ha and is located in Seulimeum Subdistrict, Aceh Besar Regency, Aceh Province. Samdhana supported the Rumpun Bambu Indonesia Foundation (YRBI) to work in this area in 2019. The total population of this IPLC is around 6,006 people (BPS 2019) and the population density is 0.34 people per hectare. About 25% of the IPLC area is mountainous, 67% is upland and 7% is lowland. Nearly 54% of the IPLC area consists of forest areas and 46% are non-forest areas. Around 26.5% of the IPLC area is secondary forest and the majority (73.5%) of this area is non-forest land cover. There is no primary forest in this area (Figure 2).
3
Figure 2. Current map of elevation, forest area and land cover at Mukim Lamteuba IPLC.
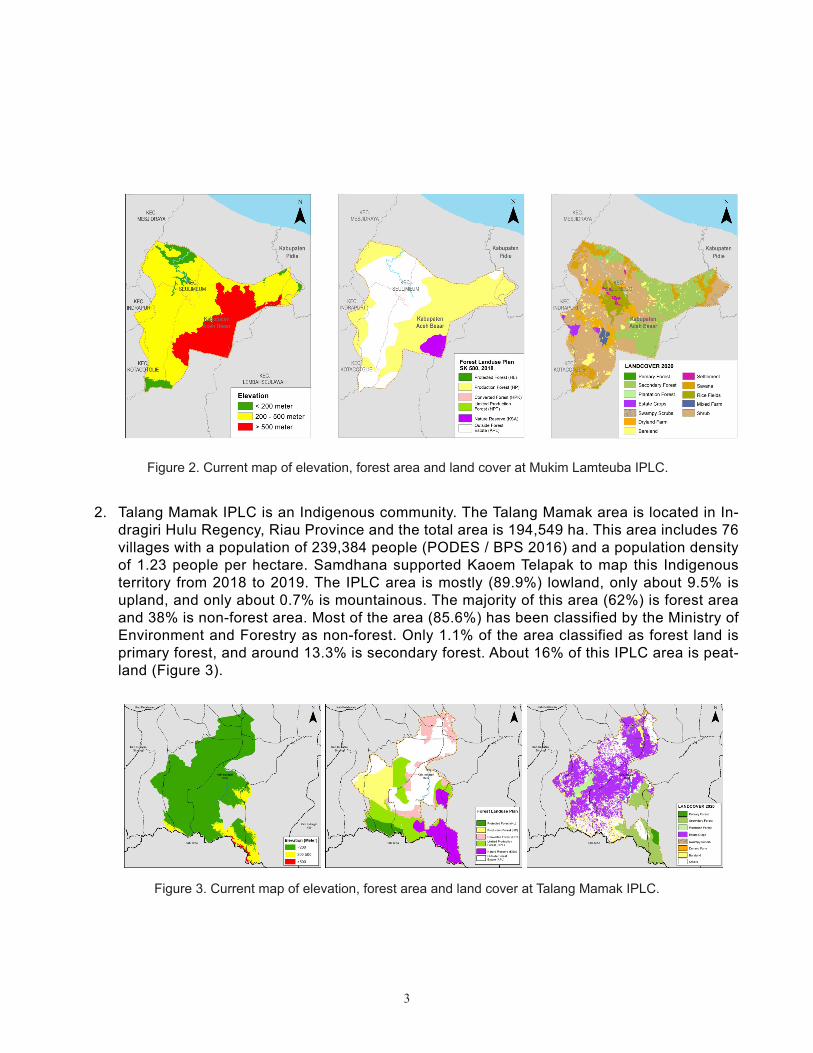
2. Talang Mamak IPLC is an Indigenous community. The Talang Mamak area is located in In-dragiri Hulu Regency, Riau Province and the total area is 194,549 ha. This area includes 76 villages with a population of 239,384 people (PODES / BPS 2016) and a population density of 1.23 people per hectare. Samdhana supported Kaoem Telapak to map this Indigenous territory from 2018 to 2019. The IPLC area is mostly (89.9%) lowland, only about 9.5% is upland, and only about 0.7% is mountainous. The majority of this area (62%) is forest area and 38% is non-forest area. Most of the area (85.6%) has been classified by the Ministry of Environment and Forestry as non-forest. Only 1.1% of the area classified as forest land is primary forest, and around 13.3% is secondary forest. About 16% of this IPLC area is peat-land (Figure 3).
Figure 3. Current map of elevation, forest area and land cover at Talang Mamak IPLC.
4
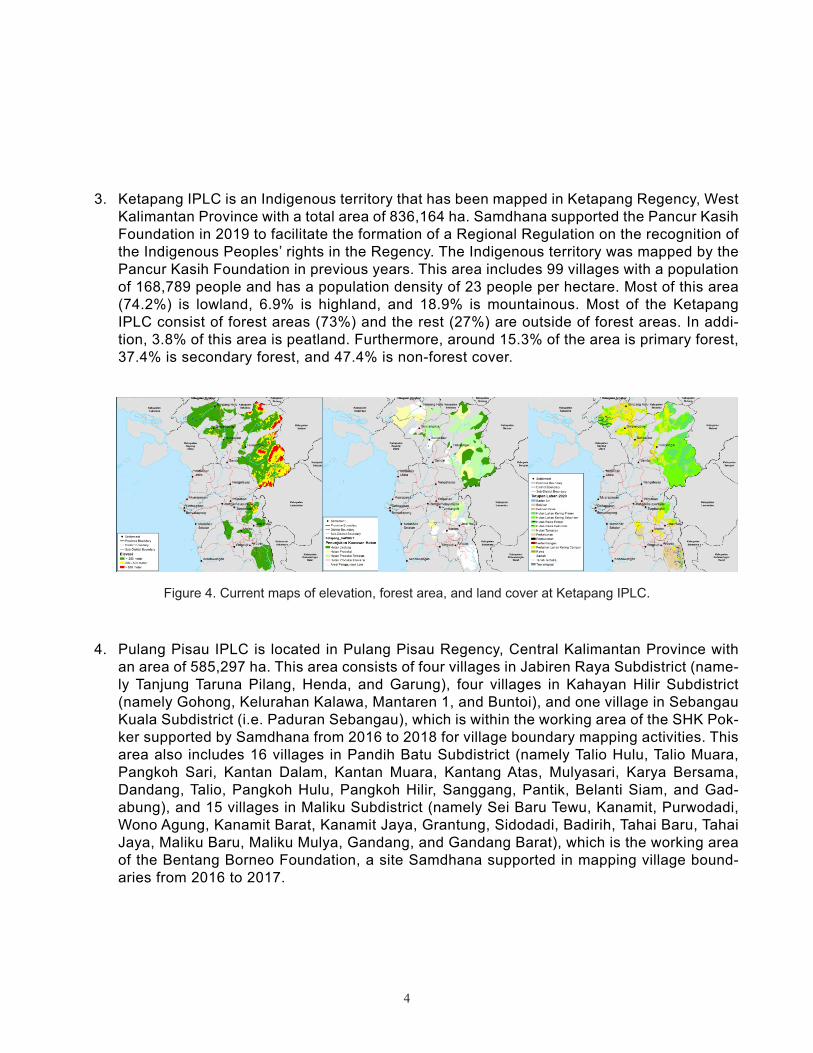
3. Ketapang IPLC is an Indigenous territory that has been mapped in Ketapang Regency, West Kalimantan Province with a total area of 836,164 ha. Samdhana supported the Pancur Kasih Foundation in 2019 to facilitate the formation of a Regional Regulation on the recognition of the Indigenous Peoples’ rights in the Regency. The Indigenous territory was mapped by the Pancur Kasih Foundation in previous years. This area includes 99 villages with a population of 168,789 people and has a population density of 23 people per hectare. Most of this area (74.2%) is lowland, 6.9% is highland, and 18.9% is mountainous. Most of the Ketapang IPLC consist of forest areas (73%) and the rest (27%) are outside of forest areas. In addi-tion, 3.8% of this area is peatland. Furthermore, around 15.3% of the area is primary forest, 37.4% is secondary forest, and 47.4% is non-forest cover.
Figure 4. Current maps of elevation, forest area, and land cover at Ketapang IPLC.
4. Pulang Pisau IPLC is located in Pulang Pisau Regency, Central Kalimantan Province with an area of 585,297 ha. This area consists of four villages in Jabiren Raya Subdistrict (name-ly Tanjung Taruna Pilang, Henda, and Garung), four villages in Kahayan Hilir Subdistrict (namely Gohong, Kelurahan Kalawa, Mantaren 1, and Buntoi), and one village in Sebangau Kuala Subdistrict (i.e. Paduran Sebangau), which is within the working area of the SHK Pok-ker supported by Samdhana from 2016 to 2018 for village boundary mapping activities. This area also includes 16 villages in Pandih Batu Subdistrict (namely Talio Hulu, Talio Muara, Pangkoh Sari, Kantan Dalam, Kantan Muara, Kantang Atas, Mulyasari, Karya Bersama, Dandang, Talio, Pangkoh Hulu, Pangkoh Hilir, Sanggang, Pantik, Belanti Siam, and Gad-abung), and 15 villages in Maliku Subdistrict (namely Sei Baru Tewu, Kanamit, Purwodadi, Wono Agung, Kanamit Barat, Kanamit Jaya, Grantung, Sidodadi, Badirih, Tahai Baru, Tahai Jaya, Maliku Baru, Maliku Mulya, Gandang, and Gandang Barat), which is the working area of the Bentang Borneo Foundation, a site Samdhana supported in mapping village bound-aries from 2016 to 2017.
5
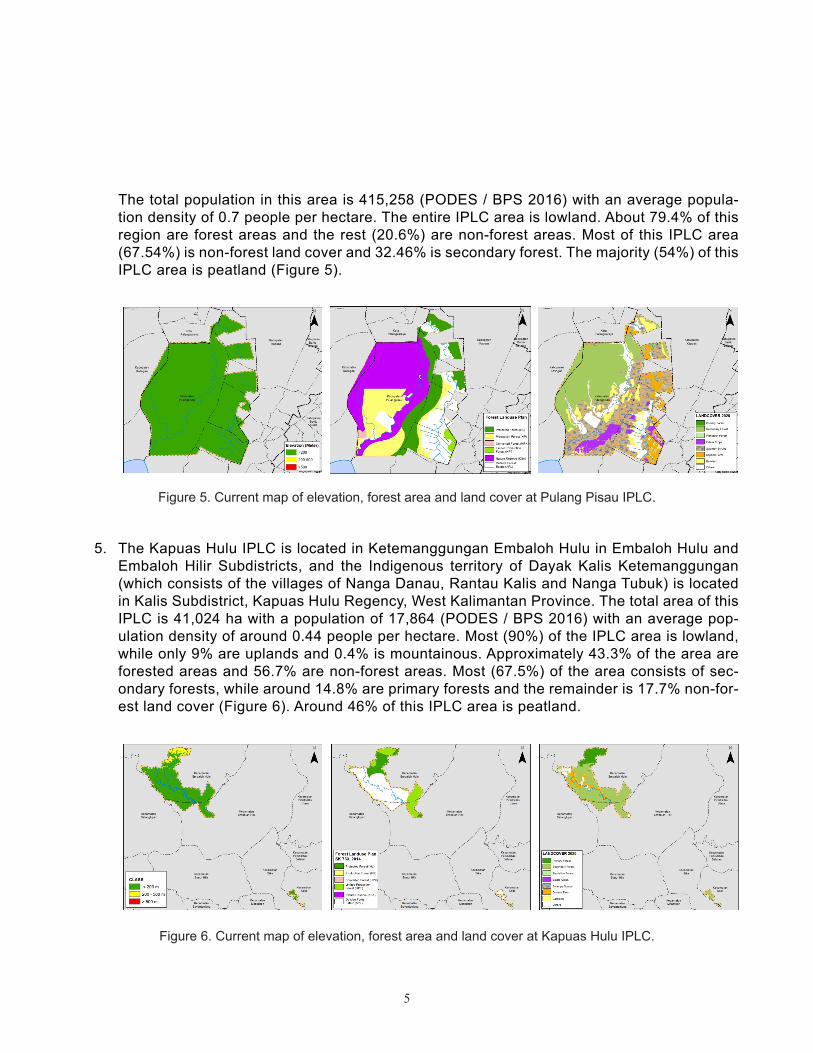
The total population in this area is 415,258 (PODES / BPS 2016) with an average popula-tion density of 0.7 people per hectare. The entire IPLC area is lowland. About 79.4% of this region are forest areas and the rest (20.6%) are non-forest areas. Most of this IPLC area (67.54%) is non-forest land cover and 32.46% is secondary forest. The majority (54%) of this IPLC area is peatland (Figure 5).
Figure 5. Current map of elevation, forest area and land cover at Pulang Pisau IPLC.
5. The Kapuas Hulu IPLC is located in Ketemanggungan Embaloh Hulu in Embaloh Hulu and Embaloh Hilir Subdistricts, and the Indigenous territory of Dayak Kalis Ketemanggungan (which consists of the villages of Nanga Danau, Rantau Kalis and Nanga Tubuk) is located in Kalis Subdistrict, Kapuas Hulu Regency, West Kalimantan Province. The total area of this IPLC is 41,024 ha with a population of 17,864 (PODES / BPS 2016) with an average pop-ulation density of around 0.44 people per hectare. Most (90%) of the IPLC area is lowland, while only 9% are uplands and 0.4% is mountainous. Approximately 43.3% of the area are forested areas and 56.7% are non-forest areas. Most (67.5%) of the area consists of sec-ondary forests, while around 14.8% are primary forests and the remainder is 17.7% non-for-est land cover (Figure 6). Around 46% of this IPLC area is peatland.
Figure 6. Current map of elevation, forest area and land cover at Kapuas Hulu IPLC.
6
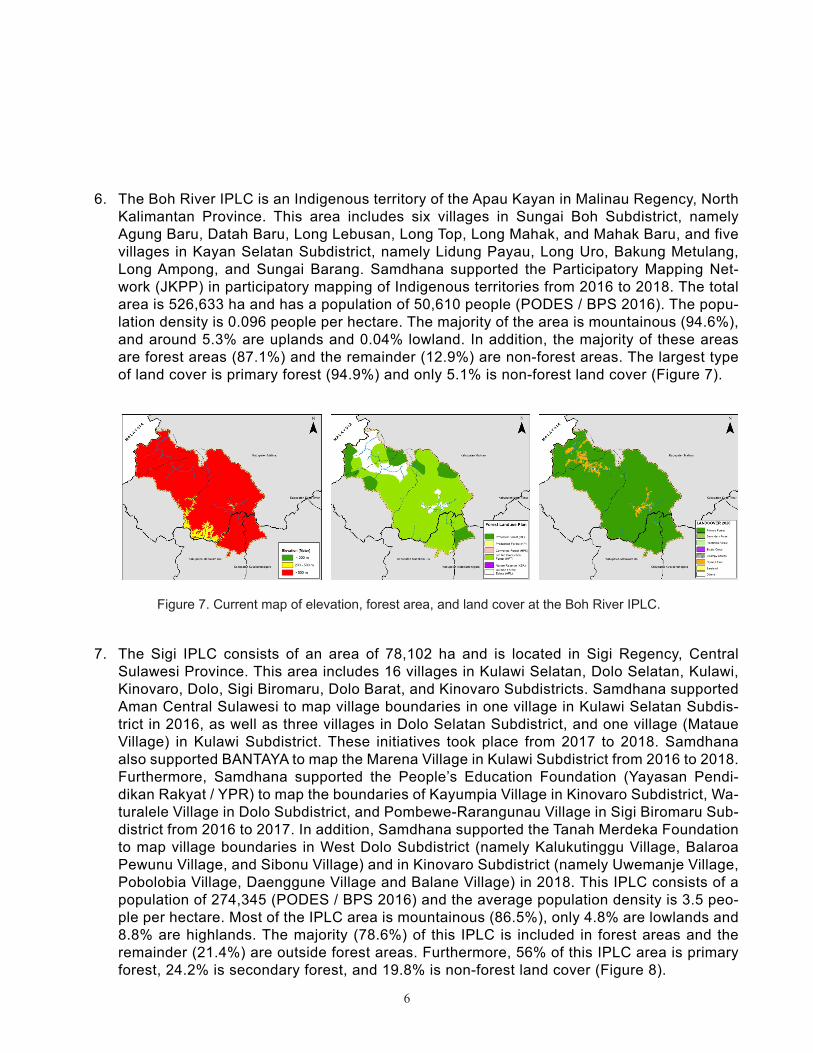
6. The Boh River IPLC is an Indigenous territory of the Apau Kayan in Malinau Regency, North Kalimantan Province. This area includes six villages in Sungai Boh Subdistrict, namely Agung Baru, Datah Baru, Long Lebusan, Long Top, Long Mahak, and Mahak Baru, and five villages in Kayan Selatan Subdistrict, namely Lidung Payau, Long Uro, Bakung Metulang, Long Ampong, and Sungai Barang. Samdhana supported the Participatory Mapping Net-work (JKPP) in participatory mapping of Indigenous territories from 2016 to 2018. The total area is 526,633 ha and has a population of 50,610 people (PODES / BPS 2016). The popu-lation density is 0.096 people per hectare. The majority of the area is mountainous (94.6%), and around 5.3% are uplands and 0.04% lowland. In addition, the majority of these areas are forest areas (87.1%) and the remainder (12.9%) are non-forest areas. The largest type of land cover is primary forest (94.9%) and only 5.1% is non-forest land cover (Figure 7).
Figure 7. Current map of elevation, forest area, and land cover at the Boh River IPLC.
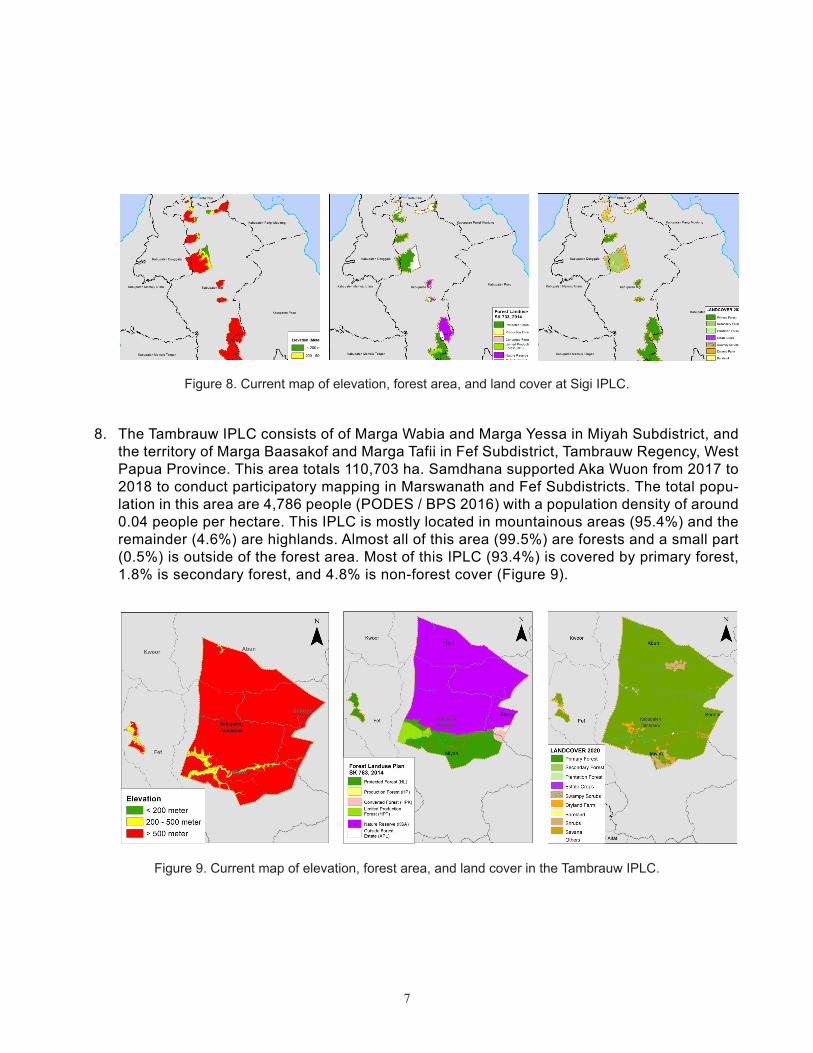
7. The Sigi IPLC consists of an area of 78,102 ha and is located in Sigi Regency, Central Sulawesi Province. This area includes 16 villages in Kulawi Selatan, Dolo Selatan, Kulawi, Kinovaro, Dolo, Sigi Biromaru, Dolo Barat, and Kinovaro Subdistricts. Samdhana supported Aman Central Sulawesi to map village boundaries in one village in Kulawi Selatan Subdis-trict in 2016, as well as three villages in Dolo Selatan Subdistrict, and one village (Mataue Village) in Kulawi Subdistrict. These initiatives took place from 2017 to 2018. Samdhana also supported BANTAYA to map the Marena Village in Kulawi Subdistrict from 2016 to 2018. Furthermore, Samdhana supported the People’s Education Foundation (Yayasan Pendi-dikan Rakyat / YPR) to map the boundaries of Kayumpia Village in Kinovaro Subdistrict, Wa-turalele Village in Dolo Subdistrict, and Pombewe-Rarangunau Village in Sigi Biromaru Sub-district from 2016 to 2017. In addition, Samdhana supported the Tanah Merdeka Foundation to map village boundaries in West Dolo Subdistrict (namely Kalukutinggu Village, Balaroa Pewunu Village, and Sibonu Village) and in Kinovaro Subdistrict (namely Uwemanje Village, Pobolobia Village, Daenggune Village and Balane Village) in 2018. This IPLC consists of a population of 274,345 (PODES / BPS 2016) and the average population density is 3.5 peo-ple per hectare. Most of the IPLC area is mountainous (86.5%), only 4.8% are lowlands and 8.8% are highlands. The majority (78.6%) of this IPLC is included in forest areas and the remainder (21.4%) are outside forest areas. Furthermore, 56% of this IPLC area is primary forest, 24.2% is secondary forest, and 19.8% is non-forest land cover (Figure 8).
7
Figure 8. Current map of elevation, forest area, and land cover at Sigi IPLC.
8. The Tambrauw IPLC consists of of Marga Wabia and Marga Yessa in Miyah Subdistrict, and the territory of Marga Baasakof and Marga Tafii in Fef Subdistrict, Tambrauw Regency, West Papua Province. This area totals 110,703 ha. Samdhana supported Aka Wuon from 2017 to 2018 to conduct participatory mapping in Marswanath and Fef Subdistricts. The total popu-lation in this area are 4,786 people (PODES / BPS 2016) with a population density of around 0.04 people per hectare. This IPLC is mostly located in mountainous areas (95.4%) and the remainder (4.6%) are highlands. Almost all of this area (99.5%) are forests and a small part (0.5%) is outside of the forest area. Most of this IPLC (93.4%) is covered by primary forest, 1.8% is secondary forest, and 4.8% is non-forest cover (Figure 9).
Figure 9. Current map of elevation, forest area, and land cover in the Tambrauw IPLC.
8
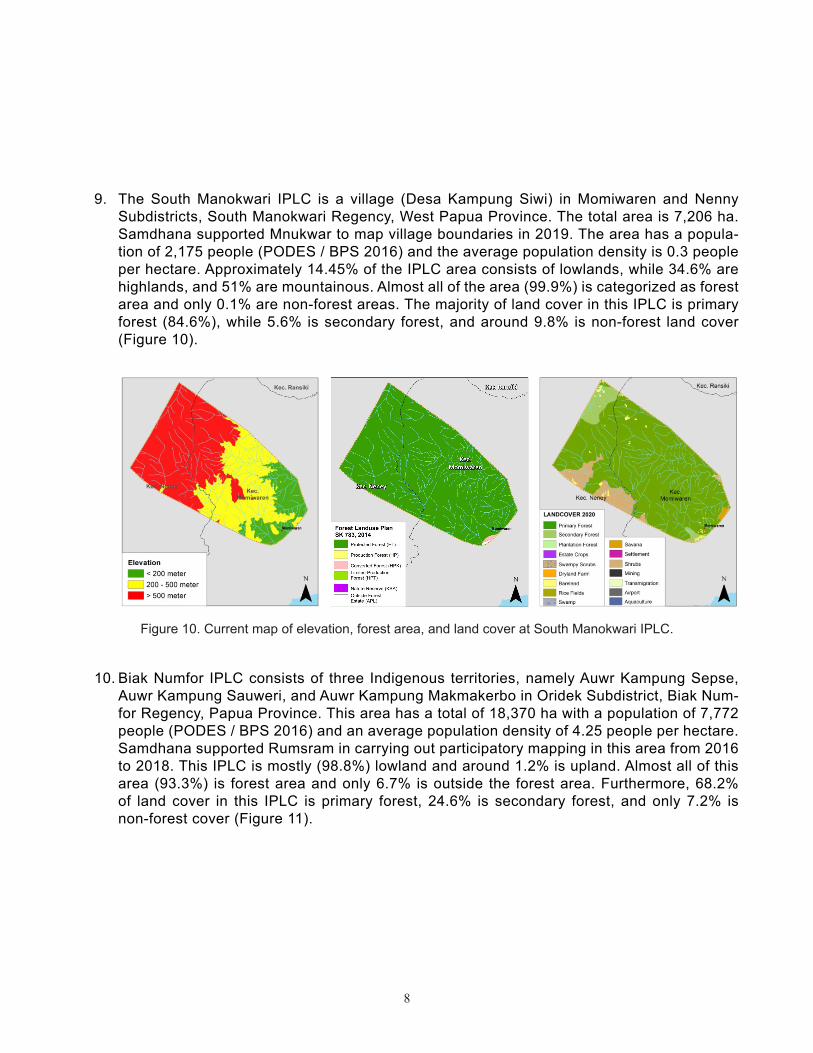
9. The South Manokwari IPLC is a village (Desa Kampung Siwi) in Momiwaren and Nenny Subdistricts, South Manokwari Regency, West Papua Province. The total area is 7,206 ha. Samdhana supported Mnukwar to map village boundaries in 2019. The area has a popula-tion of 2,175 people (PODES / BPS 2016) and the average population density is 0.3 people per hectare. Approximately 14.45% of the IPLC area consists of lowlands, while 34.6% are highlands, and 51% are mountainous. Almost all of the area (99.9%) is categorized as forest area and only 0.1% are non-forest areas. The majority of land cover in this IPLC is primary forest (84.6%), while 5.6% is secondary forest, and around 9.8% is non-forest land cover (Figure 10).
Figure 10. Current map of elevation, forest area, and land cover at South Manokwari IPLC.
10. Biak Numfor IPLC consists of three Indigenous territories, namely Auwr Kampung Sepse, Auwr Kampung Sauweri, and Auwr Kampung Makmakerbo in Oridek Subdistrict, Biak Num-for Regency, Papua Province. This area has a total of 18,370 ha with a population of 7,772 people (PODES / BPS 2016) and an average population density of 4.25 people per hectare. Samdhana supported Rumsram in carrying out participatory mapping in this area from 2016 to 2018. This IPLC is mostly (98.8%) lowland and around 1.2% is upland. Almost all of this area (93.3%) is forest area and only 6.7% is outside the forest area. Furthermore, 68.2% of land cover in this IPLC is primary forest, 24.6% is secondary forest, and only 7.2% is non-forest cover (Figure 11).

9
Figure 11. Current map of elevation, forest area, and land cover at Biak Numfor IPLC.
11. Jayapura IPLC covers 16 villages, which amounts to around 79,223 ha in East Sentani Sub-district, Jayapura Regency, Papua Province. Samdhana supported JKPP in 2019 to map village boundaries in this area. The total population of the area is 374,678 people (PODES / BPS 2016) with an average population density of around 4.7 people per hectare. Approx-imately 68.9% of the IPLC area are lowlands, 21.7% highland, and 9.4% are mountainous. Most (62%) of this area are within forest areas and 38% are outside forest areas. The area has 14.4% primary forest, 39.8% secondary forest, and 45.8% non-forest land cover (Figure 12).
Figure 12. Map of elevation, forest area, and land cover of Jayapura IPLC.
10
The Ketapang IPLC has the largest area and the highest population density in comparsion to the other ten IPLCs mentioned above. Meanwhile, South Manokwari was the IPLC with the smallest territory. Kapuas Hulu and Pulang Pisau are IPLC areas which have the largest extent of peatlands, which are close to 50% of its total area. Two other IPLC that have peatlands are Talang Mamak and Ketapang. Almost all IPLCs are located in forest areas covering more than 50% of the total area, except for Kapuas Hulu. Furthermore, Kapuas Hulu, Sungai Boh, Sigi, Tambrauw, South Manokwari, and Biak Numfor have very large forest cover areas, both primary and secondary for-est, which add up to more than 80% of the area. Meanwhile, Mukim Lamteuba and Talang Mamak have relatively low forest cover, at less than 30% of their total area.
2.2. SATELLITE IMAGERY AND ANALYSIS OF LAND COVER AND LAND CLEARANCE
Analysis of land cover change and annual land clearing applied data that was freely available and accessible through the Google Earth Engine system. Analysis of 2005 and 2010 land cover and annual land clearing from 2005 to 2015 used Landsat 7 ETM + Tier 1 Surface Reflectance imagery with a spatial resolution of 30m, provided by USGS. These images have been corrected for an atmospheric surface reflectance using LEDAPs, and information on cloud cover, shadow, water, and snow were processed with CFMASK so that the information could be used for a cloud and shadow removal process. Meanwhile, the analysis of land cover from 2015 to 2020 and annual land clearing from 2015 to 2020 used a combination of Sentinel 1 and Landsat 8 imagery products. Sentinel 1 imagery is a C-Band radar image with 10m resolution. The vv and vh bands from Sen-tinel 1, as well as ascending and descending images were collected from January 1 to the end of April 2020. All of these images were then averaged to produce images that have less ascending and descending effects. Landsat 8 imagery was a successor to Landsat 7, which provides a 30m multispectral image. The data used in this process was Landsat 8 Surface Reflectance Tier 1, and, like Landsat 7, has been corrected for geometric and atmospheric errors. Landsat 7 and 8 imagery werw processed with Google Earth Engine to clean the clouds, cloud shadows, and other cirrus using tens to hundreds of images in one year, with acquisition dates from April 1 the previous year to March 31 the following year. The median value of each pixel was then used to represent the image of each year.
The Landsat 7 satellite was launched in July 1999 and scans the same area periodically every 16 days (its temporal resolution is also 16 days). Since June 2003 all Landsat 7 imagery has blank data in the form of longitudinal lines due to the failure of the SLC (Scan Line Corrector) tool. Mean-while, Sentinel 1 has a temporal resolution of 12 days and a spatial resolution of 10 meters. The Sentinel 1 satellite entered service in September 2014. The Landsat 8 satellite was launched on 11 February 2013 and the Landsat 8 imagery has a spatial resolution of 30 meters for the multi-spectral band and a temporal resolution of 16 days. Under these conditions, the analysis of annual land cover and land clearing from 2005 to 2015 depends on Landsat 7 imagery, which experiences problems from some blank data. To improve consistency, the Ministry of Forestry’s 2006 and 2009 land cover maps were corrected using processed Landsat 7 imagery to create land cover maps for 2005 and 2010. Analysis of annual land clearing using data from Mathew Hansen (University of Maryland) on forest loss from 2005 to 2015 was corrected with Landsat 7 imagery that had been processed annually.
Analysis of land cover change for the period 2005 and 2010 used the manual method (on screen
11
digitizing and editing) by correcting Ministry of Forestry data using Landsat 7. The analysis of land clearing per year from 2005 to 2015 also used the manual method by updating forest loss data from Mathew Hansen. Whereas the analysis of land cover for 2015 and 2020, as well as annual land clearing for 2015 to 2019, used the Random Forest supervised classification method as de-scribed in SEKALA’s technical report to Samdhana with the title ‘Technical Support for Creating Baseline Analysis for Carbon Stock and Land Cover Change in Samdhana Institute Focal Areas (2015-2020) ‘. Annual land clearing indicates land clearing dynamics that may contribute to the re-duction of a certain type of land cover, but it can also be a recurring event over a certain period in a given place. The abovementioned analysis of land cover changes in the five-year period should provide a more detailed understanding of the dynamics of land cover.
2.3. FOREST FIRE ANALYSIS
Forest fire data was collected from the Fire Information for Resource Management System (FIRMS) for active fire data / thermal hotspot locations from 2005 to 2020. FIRMS provides near real-time data every three hours generated from MODIS NRT active fire products (Terra and Aqua) and VIIRS. This data was then analyzed to observe the frequency of fires per year, after which the location of the fires were identified against the type of land cover and compared to the pattern of events per year against the pattern of annual land clearing.
2.4. CARBON STOCK ANALYSIS
Estimation of carbon stocks and their changes used an estimate of the amount of carbon stock based on the type of land cover (above ground carbon stock). Below ground carbon stock was not included in this analysis for simplification to provide greater focus on land cover change. Carbon stock estimates for each type of land cover used data compiled by the REDD + Task Force (2012) and used the National Forest Inventory, as well as various studies compiled in Krisnawati et al. (2012) and Agus et al. (2012) (see Table 1).
12
Table 1. Carbon stock per hectare of land cover type.
No Land cover type Ton/Ha of C1 Primary dry land forest 246.982 Secondary dry land forest 218.743 Primary swamp forest 250.454 Primary mangrove forest 222.385 Secondary swamp forest 206.056 Secondary mangrove forest 191.357 Industrial plantation forest 58.008 Estate crops 86.859 Shrubs 25.68
10 Swampy shrubs 25.6811 Dry land agriculture 12.85
12 Dry land agriculture mixed with shrubs
15.25
13 Ricefield 6.0014 Settlement 1.2015 Transmigration area 12.00
All of the above analyses were carried out by desktop study and there was no field testing. Accuracy was improved by comparing results with high resolution imageries from Esri (who have high resolution imagery from several years back, called the Esri Imagery Wayback).
13
3. HISTORICAL CHANGES OF LAND COVER IN SELECTED IPLC IN INDONESIA IN 2005-2010, 2010-2015, AND 2015-2020 PERIODS
The following are the results of spatial analysis of selected IPLC territories in Indonesia, which include historical analysis of changes in forest cover, analysis of historical changes in non-forest land use, analysis of historical hotspot events, analysis of annual land clearing, and historical anal-ysis of changes in carbon stocks above ground from 2005 to 2020.
3.1. HISTORY OF FOREST COVER CHANGE
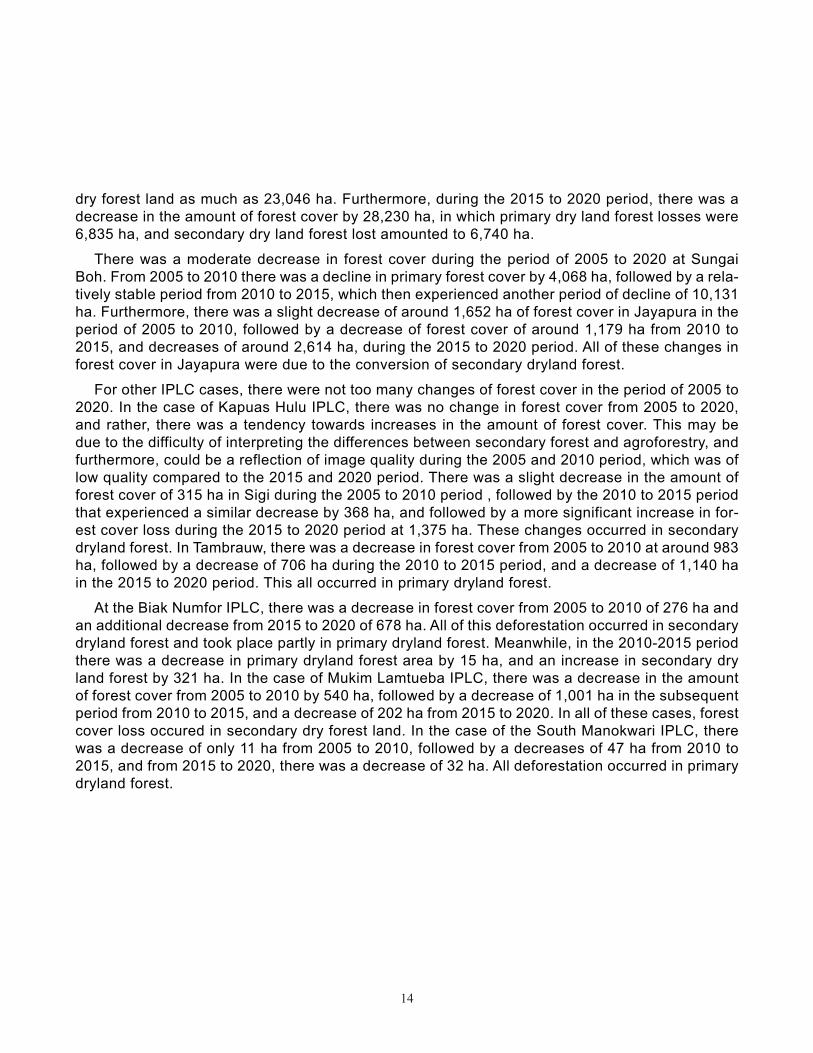
The results of the analysis of changes in forest cover for each IPLC from 2005 to 2020 are shown in Figure 13 and Figure 14 below. IPLC areas with a fairly small rate of change in forest land cover from 2005 to 2020 are those in Kapuas Hulu, Sigi, Tambrauw, Biak Numfor, Jayapu-ra, Mukim Lamteuba, and South Manokwari. Meanwhile, there were significantly large changes that took place in Talang Mamak, Pulang Pisau, and Ketapang. There has been a fairly moderate change in Sungai Boh.
Forest cover change in Talang Mamak was very large for the period 2005 to 2010 amountng to a total of around 177,230 hectares. Approximately 172,494 ha of this change resulted from the conversion1 of secondary dryland forest and around 5,996 ha resulted from the conversion of sec-ondary swamp forest. The remaining conversion occurred due to production activities in plantation forests. From 2010 to 2015 the change in forest cover decreased to 9,501 ha, of which 6,993 ha resulted from the conversion of secondary dryland forest, around 2,409 ha resulted from the con-version of secondary swamp forests, and 99 ha resulted from the conversion of primary dryland forest. Plantation forest cover increased during this period by 1,865 ha. For the period 2015 to 2020, there was a decline in forest cover of 18,318 ha, whereas conversion of secondary dry forest land took place at an order of 16,363 ha, and the remainder occurred due to production processes in plantation forests.
A decrease in forest cover occurred between 2005 to 2010 in Pulang Pisau due to the conver-sion of secondary swamp forest at about 25,369 ha. From 2010 to 2015 there was little change, but from 2015 to 2020 there was a significant conversion of secondary swamp forest, adding up to a total loss of 63,300 ha.
In Ketapang significant forest conversion also took place during the period of 2005 to 2020. The decrease in forest cover from 2005 to 2010 amounted to 15,343 ha. During this period, 39,141 ha of primary dryland forest were lost, as well as 23,466 ha of secondary dryland forest, and 331 ha of secondary swamp forest. In the period of 2010 to 2015 there was a decrease in forest cover by 28,672 ha, consisting of losses to primary dryland forest totaling 6,835 ha, and a loss of secondary
1. The conversion referred to here is the change from forest land cover to non-forest cover.
14
dry forest land as much as 23,046 ha. Furthermore, during the 2015 to 2020 period, there was a decrease in the amount of forest cover by 28,230 ha, in which primary dry land forest losses were 6,835 ha, and secondary dry land forest lost amounted to 6,740 ha.
There was a moderate decrease in forest cover during the period of 2005 to 2020 at Sungai Boh. From 2005 to 2010 there was a decline in primary forest cover by 4,068 ha, followed by a rela-tively stable period from 2010 to 2015, which then experienced another period of decline of 10,131 ha. Furthermore, there was a slight decrease of around 1,652 ha of forest cover in Jayapura in the period of 2005 to 2010, followed by a decrease of forest cover of around 1,179 ha from 2010 to 2015, and decreases of around 2,614 ha, during the 2015 to 2020 period. All of these changes in forest cover in Jayapura were due to the conversion of secondary dryland forest.
For other IPLC cases, there were not too many changes of forest cover in the period of 2005 to 2020. In the case of Kapuas Hulu IPLC, there was no change in forest cover from 2005 to 2020, and rather, there was a tendency towards increases in the amount of forest cover. This may be due to the difficulty of interpreting the differences between secondary forest and agroforestry, and furthermore, could be a reflection of image quality during the 2005 and 2010 period, which was of low quality compared to the 2015 and 2020 period. There was a slight decrease in the amount of forest cover of 315 ha in Sigi during the 2005 to 2010 period , followed by the 2010 to 2015 period that experienced a similar decrease by 368 ha, and followed by a more significant increase in for-est cover loss during the 2015 to 2020 period at 1,375 ha. These changes occurred in secondary dryland forest. In Tambrauw, there was a decrease in forest cover from 2005 to 2010 at around 983 ha, followed by a decrease of 706 ha during the 2010 to 2015 period, and a decrease of 1,140 ha in the 2015 to 2020 period. This all occurred in primary dryland forest.
At the Biak Numfor IPLC, there was a decrease in forest cover from 2005 to 2010 of 276 ha and an additional decrease from 2015 to 2020 of 678 ha. All of this deforestation occurred in secondary dryland forest and took place partly in primary dryland forest. Meanwhile, in the 2010-2015 period there was a decrease in primary dryland forest area by 15 ha, and an increase in secondary dry land forest by 321 ha. In the case of Mukim Lamtueba IPLC, there was a decrease in the amount of forest cover from 2005 to 2010 by 540 ha, followed by a decrease of 1,001 ha in the subsequent period from 2010 to 2015, and a decrease of 202 ha from 2015 to 2020. In all of these cases, forest cover loss occured in secondary dry forest land. In the case of the South Manokwari IPLC, there was a decrease of only 11 ha from 2005 to 2010, followed by a decreases of 47 ha from 2010 to 2015, and from 2015 to 2020, there was a decrease of 32 ha. All deforestation occurred in primary dryland forest.
15
Figure 13. The area of forest cover in each IPLC from 2005-2020.
Figure 14. The area of change in forest cover in each IPLC from 2005-20202.
2. The graph of land cover change with a bar chart towards the negative (downward) shows the amount of reduction in the area of a certain land cover, while in the positive direction (upward) shows the magnitude of the increase in the area of a certain land cover.
16
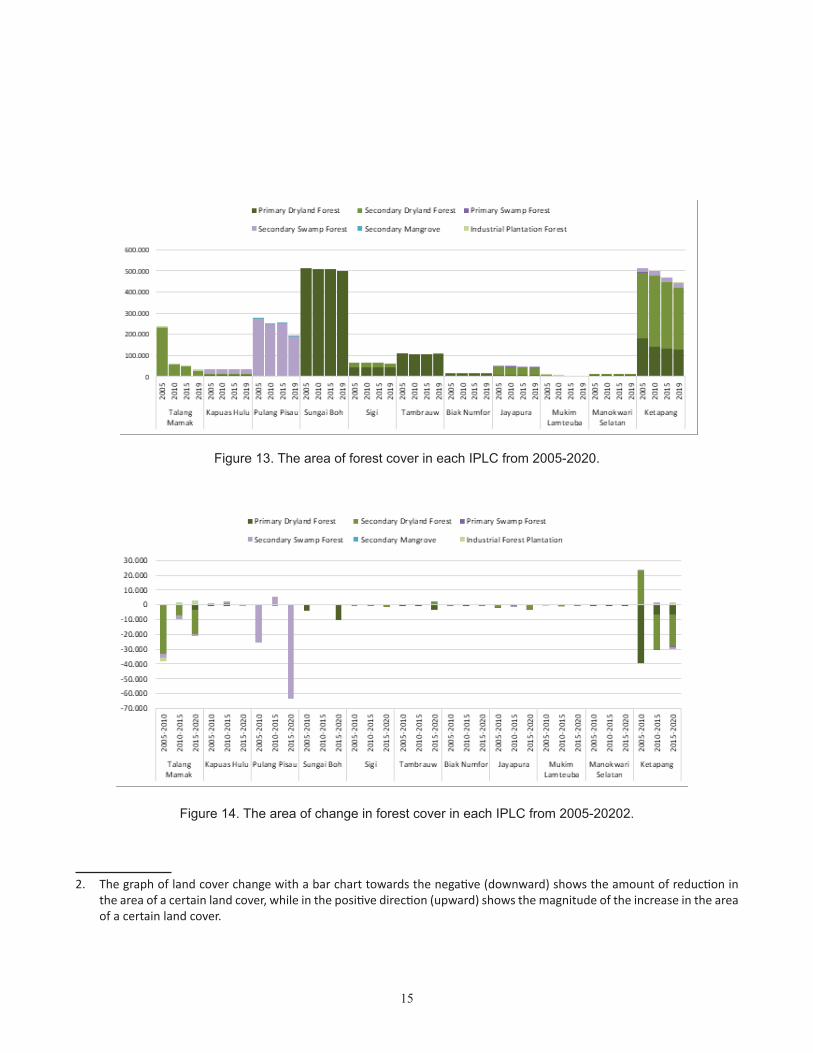
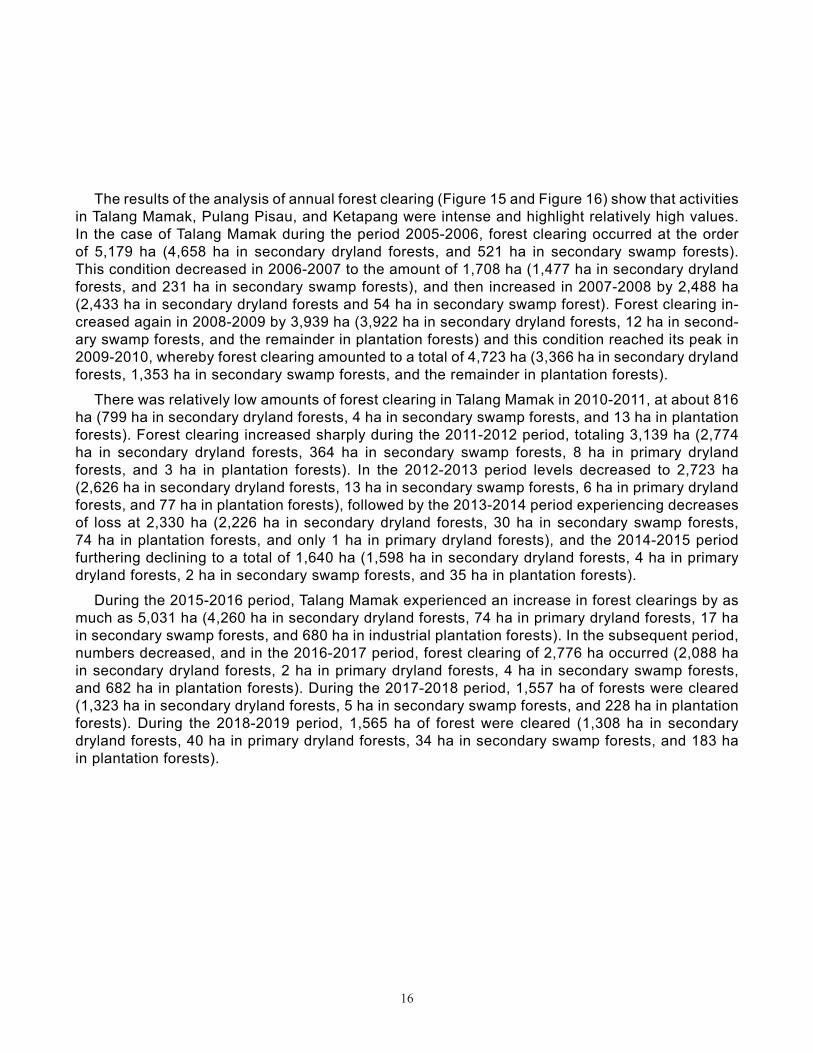
The results of the analysis of annual forest clearing (Figure 15 and Figure 16) show that activities in Talang Mamak, Pulang Pisau, and Ketapang were intense and highlight relatively high values. In the case of Talang Mamak during the period 2005-2006, forest clearing occurred at the order of 5,179 ha (4,658 ha in secondary dryland forests, and 521 ha in secondary swamp forests). This condition decreased in 2006-2007 to the amount of 1,708 ha (1,477 ha in secondary dryland forests, and 231 ha in secondary swamp forests), and then increased in 2007-2008 by 2,488 ha (2,433 ha in secondary dryland forests and 54 ha in secondary swamp forest). Forest clearing in-creased again in 2008-2009 by 3,939 ha (3,922 ha in secondary dryland forests, 12 ha in second-ary swamp forests, and the remainder in plantation forests) and this condition reached its peak in 2009-2010, whereby forest clearing amounted to a total of 4,723 ha (3,366 ha in secondary dryland forests, 1,353 ha in secondary swamp forests, and the remainder in plantation forests).
There was relatively low amounts of forest clearing in Talang Mamak in 2010-2011, at about 816 ha (799 ha in secondary dryland forests, 4 ha in secondary swamp forests, and 13 ha in plantation forests). Forest clearing increased sharply during the 2011-2012 period, totaling 3,139 ha (2,774 ha in secondary dryland forests, 364 ha in secondary swamp forests, 8 ha in primary dryland forests, and 3 ha in plantation forests). In the 2012-2013 period levels decreased to 2,723 ha (2,626 ha in secondary dryland forests, 13 ha in secondary swamp forests, 6 ha in primary dryland forests, and 77 ha in plantation forests), followed by the 2013-2014 period experiencing decreases of loss at 2,330 ha (2,226 ha in secondary dryland forests, 30 ha in secondary swamp forests, 74 ha in plantation forests, and only 1 ha in primary dryland forests), and the 2014-2015 period furthering declining to a total of 1,640 ha (1,598 ha in secondary dryland forests, 4 ha in primary dryland forests, 2 ha in secondary swamp forests, and 35 ha in plantation forests).
During the 2015-2016 period, Talang Mamak experienced an increase in forest clearings by as much as 5,031 ha (4,260 ha in secondary dryland forests, 74 ha in primary dryland forests, 17 ha in secondary swamp forests, and 680 ha in industrial plantation forests). In the subsequent period, numbers decreased, and in the 2016-2017 period, forest clearing of 2,776 ha occurred (2,088 ha in secondary dryland forests, 2 ha in primary dryland forests, 4 ha in secondary swamp forests, and 682 ha in plantation forests). During the 2017-2018 period, 1,557 ha of forests were cleared (1,323 ha in secondary dryland forests, 5 ha in secondary swamp forests, and 228 ha in plantation forests). During the 2018-2019 period, 1,565 ha of forest were cleared (1,308 ha in secondary dryland forests, 40 ha in primary dryland forests, 34 ha in secondary swamp forests, and 183 ha in plantation forests).
17
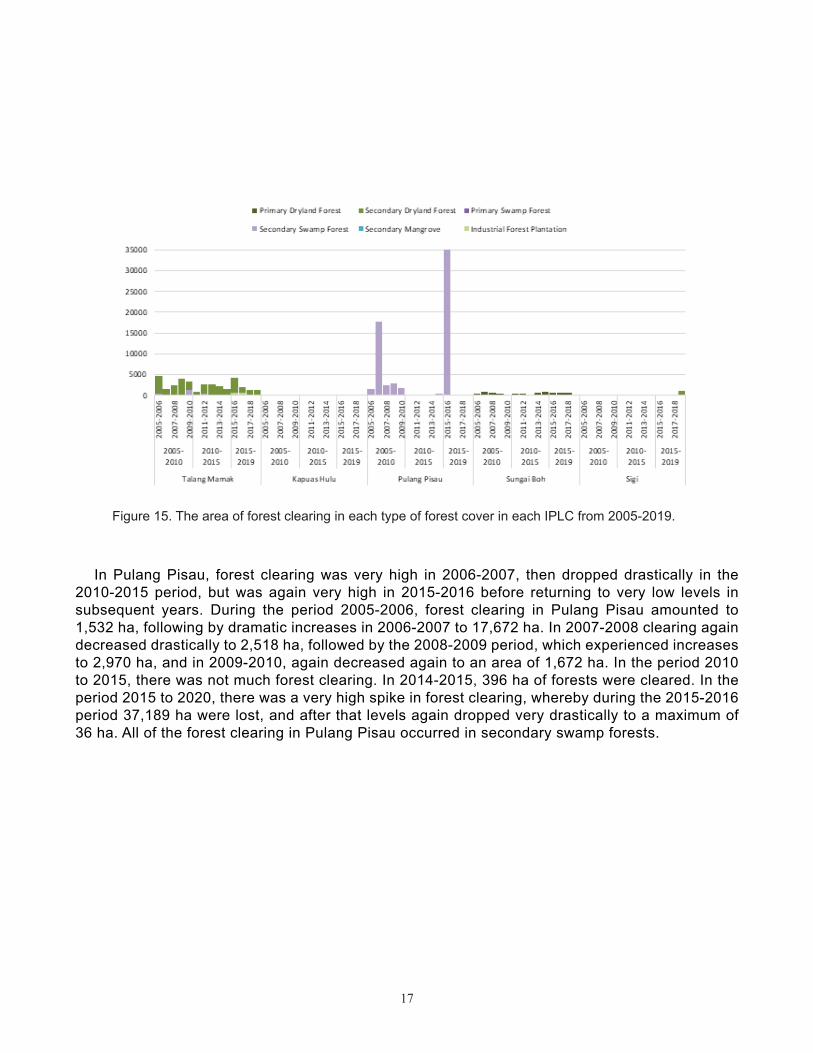
Figure 15. The area of forest clearing in each type of forest cover in each IPLC from 2005-2019.
In Pulang Pisau, forest clearing was very high in 2006-2007, then dropped drastically in the 2010-2015 period, but was again very high in 2015-2016 before returning to very low levels in subsequent years. During the period 2005-2006, forest clearing in Pulang Pisau amounted to 1,532 ha, following by dramatic increases in 2006-2007 to 17,672 ha. In 2007-2008 clearing again decreased drastically to 2,518 ha, followed by the 2008-2009 period, which experienced increases to 2,970 ha, and in 2009-2010, again decreased again to an area of 1,672 ha. In the period 2010 to 2015, there was not much forest clearing. In 2014-2015, 396 ha of forests were cleared. In the period 2015 to 2020, there was a very high spike in forest clearing, whereby during the 2015-2016 period 37,189 ha were lost, and after that levels again dropped very drastically to a maximum of 36 ha. All of the forest clearing in Pulang Pisau occurred in secondary swamp forests.
18
Figure 16. The area of forest clearing in each type of forest cover in each IPLC from 2005-2019.
In the case of Ketapang, forest clearing was intense from year to year. In the period 2005 to 2010, forest clearing increased and the highest levels occurred during 2008-2009, reaching 2,333 ha (2,170 ha in secondary dryland forests, 156 ha in primary dryland forests, and 7 ha in second-ary swamp forests). Previously, in 2005-2006, 630 ha of forests were cleared (551 ha in secondary dryland forests, 61 ha in primary dryland forests, and 19 ha in secondary swamp forests). In 2006-2007 forest clearing decreased by an area of 401 ha (321 ha in secondary dryland forests, 49 ha in primary dryland forests, and 31 ha in secondary swamp forests), but in 2008-2009, it increased sharply to 1,528 ha (1,421 ha in secondary dryland forests, 74 ha in primary dryland forests, and 34 ha in secondary swamp forests). In 2009-2010 forest clearing of 721 ha (700 ha in secondary dryland forests, 20 ha in primary dryland forests, and the rest occurred in secondary swamp for-ests).
In Ketapang, overall forest clearing increased in the period of 2010 to 2015. In 2010-2011 forest clearing occurred on a total area of 967 ha (924 ha in secondary dryland forests, 28 ha in primary dryland forests, and 15 ha in secondary swamp forests). In 2011-2012 forest clearing increased dramatically to 3,014 ha (2,821 ha in secondary dryland forests, 135 ha in secondary dryland for-ests, and 58 ha in secondary swamp forests). In 2012-2013, clearing decreased slightly by 2,628 ha (2,463 ha in secondary dryland forests, 39 ha in primary dryland forests, 93 ha in primary swamp forests, and 34 ha in secondary swamp forests). In 2013-2014, forest clearing increased slightly to an area of 2,820 ha (2,335 ha in secondary dryland forests, 48 ha in primary dryland forests, 29 ha in primary swamp forests, 408 ha in secondary swamp forests). Forest clearing increased drasti-cally in 2014-2015 covering an area of 4,094 ha (3,819 ha in secondary dryland forests, 129 ha in primary dryland forests, 133 ha in primary swamp forests, and 13 ha in secondary swamp forests).
19
In 2015-2016 there was very high levels of forest clearing in Ketapang at up to 4,387 ha (3,704 ha in secondary dryland forests, 282 ha in primary dryland forests, 149 ha in primary swamp for-ests, and 253 ha in secondary swamp forests). In 2016-2017, forest clearing decreased drastically to a level of 2,043 ha (1,892 ha in secondary dryland forests, 96 ha in primary dryland forests, and 56 ha in secondary swamp forests). In 2017-2018, there was another drastic reduction in forest clearing over an area of 481 ha (444 ha in secondary dryland forests, 20 ha in primary dryland for-ests, and 17 ha in secondary swamp forests). Furthermore, in 2018-2019 there was an increase in forest clearing covering an area of 1,161 ha (1,045 in secondary dryland forests, 74 ha in primary dryland forests, 2 ha in primary swamp forests, and 40 ha in secondary swamp forests).
Meanwhile, annual forest clearing that occurred at Sungai Boh took place regularly every year from 2005 to 2020, ranging from 100 ha to 1,000 ha. The highest forest clearing occurred in 2014-2015 covering an area of 947 ha, followed by the period 2006-2007 covering an area of 820 ha, after which 2013-2014 covered an area of 728 ha, then 2016-2017 an area of 705 ha was deforest-ed, and in 2015-2016 an area of 618 ha was cleared. Outside of these years, forest clearing levels were under 500 ha. All of these cleared lands occured in primary dryland forests.
At Sigi, forest clearing from year to year was quite low, namely at less than 70 hectares per year, except in 2015-2016, when forest clearning amounted to an area of 272 ha, followed by 2017-2018, in which an area of 167 ha, and then increased drastically during 2018-2019 to an area of 1,319 ha (1,156 ha in secondary dryland forests and 163 ha in primary dryland forests). Forest clearing in Jayapura was also quite low from year to year. The highest levels of forest clearing in Jayapura occurred in 2015-2016 covering an area of 361 ha (347 ha occurred in secondary dryland forests, 12 ha in primary dryland forests, and 2 ha in primary swamp forest) and followed by the 2012-2013 period covering an area of 306 ha (297 ha in secondary dryland forests, 2 ha in primary dryland forests, and 7 ha in secondary swamp forests). In other years, forest clearing ranged from 18 ha to 158 ha, mostly in secondary dryland forests. For other IPLC cases, forest clearing from year to year was very minimal, at rates below 125 ha per year.
The forest cover analysis showed that the most significant change in forest cover occurred in IPLCs of Talang Mamak, Ketapang, and Pulang Pisau. These three areas are dominated by low-lands and have peatlands. Plantation and agricultural development is very intensive in these three areas and corresponded with high levels of annual forest clearing. The Kapuas Hulu IPLC also has extensive lowlands and peatlands, but changes in forest cover were quite low. This area is located in a region that is still difficult to access and therefore, not much development activity has taken place, but there are already sings that many development plans are being directed to the region, which could lead to changes in forest cover in the future. Furthermore, from all IPLC areas, land clearing activity was highest in 2015-2016, possibly due to the levels of drought in Indonesia at that time on set to El Niño factors.
20
3.2. HISTORY OF CHANGES IN NON-FOREST LAND USE
The results of the analysis showed that relatively large changes in non-forest land cover oc-curred in Talang Mamak, Pulang Pisau, and Ketapang (Figure 17 and Figure 18). Meanwhile, other IPLCs the changes were relatively small.
Figure 17. Non-forest cover area in each IPLC from 2005-2020.
In the case of Talang Mamak, there was an increase in the area of oil palm plantations during each five-year period from 2005 to 2020. In the 2005-2010 period, the plantation area increased by 6,808 ha, then more than doubled in the 2010-2015 period at 25,896 ha. Subsequently, in the 2015-2020 period, the plantation area again increased by 30,575 ha. Likewise, agricultural land has increased during each period—in the 2005-2010 period it increased by 23,469 ha, in the 2010-2015 period it decreased by 29,267 ha and in the 2015-2020 period it increased by 40,487 ha,. This is in line with the decreasing shrub areas, where during the 2005-2010 period such areas decreased by 937 ha, then increased sharply in the 2010-2015 period by 17,017 ha, and increased again in the 2015-2020 period at 23,802 ha. The area of open land increased by 11,768 ha in the 2005-2010 period, increased by 29,995 ha in the 2010-2015 period, and decreased by 30,902 ha in the 2015-2020 period.
In the Pulang Pisau area, the increase in oil palm plantation areas during the 2005-2010 period was 25,588 ha, and then increased again in the 2010-2015 period by 10,276 ha, but decreased by 3,023 ha in the 2015-2020 period. Agricultural land also increased in the 2005-2010 period by 12,199 ha and increased again in the 2010-2015 period by 29,061 ha, but decreased by 47,116 ha in the 2015-2020 period. The area of open land increased by 3,732 ha in the 2005-2010 period, then decreased in the 2010-2015 period by 4,284 ha, and increased again in the 2015-2020 period to 46,974 ha. In addition, there was also a decrease in the area of swampy shrubs during the 2005-2010 period by 16,664 ha, and in the 2010-2015 period decreased to a level of 28,839 ha, followed by an increase to 18,505 ha in the 2015-2020 period. The area of swamps increased in the 2005-2010 period by 515 ha, followed by the 2010-2015 period that experienced an increase by 12,825 ha, and further increased by 16,972 ha in the 2015-2020 period. The rise and fall of swamp and swampy shrub areas are probably due to the influence of the periodically changing soil wetness which affects image interpretation.
21
Figure 18. The extent of change in non-forest cover in each IPLC from 2005-2020.
In the Ketapang area, during the 2005-2010 period there was an expansion of 24,483 ha of oil palm plantations, which increased again in the 2010-2015 period by 15,439 ha, and then further increased by 22,292 ha during the 2015-2020 period. There was also an addition of agricultural land in the 2005-2010 period of 6,611 ha, which increased again in the 2010-2015 period of 29,570 ha, but then decreased by 1,108 ha during the 2015-2020 period. Open land decreased during the 2005-2010 period by 1,511 ha, but increased in the 2010-2015 period by 608 ha, then further in-creased by 8,630 ha in the 2015-2020 period. S hrub areas decreased during the 2005-2010 period by 11,661 ha, and decreased again in the 2010-2015 period by 19,855 ha, followed by an increase by 7,162 ha during the 2015-2020 period. Swampy shrubs decreased by 2,366 ha in the 2005-2010 period, then increased by 4,105 ha in the 2010-2015 period, and decreased in the 2015-2020 period by 7,796 ha. Very small changes of non forest cover occured in other IPLCs. Most of the changes occurred in agricultural land cover.
22
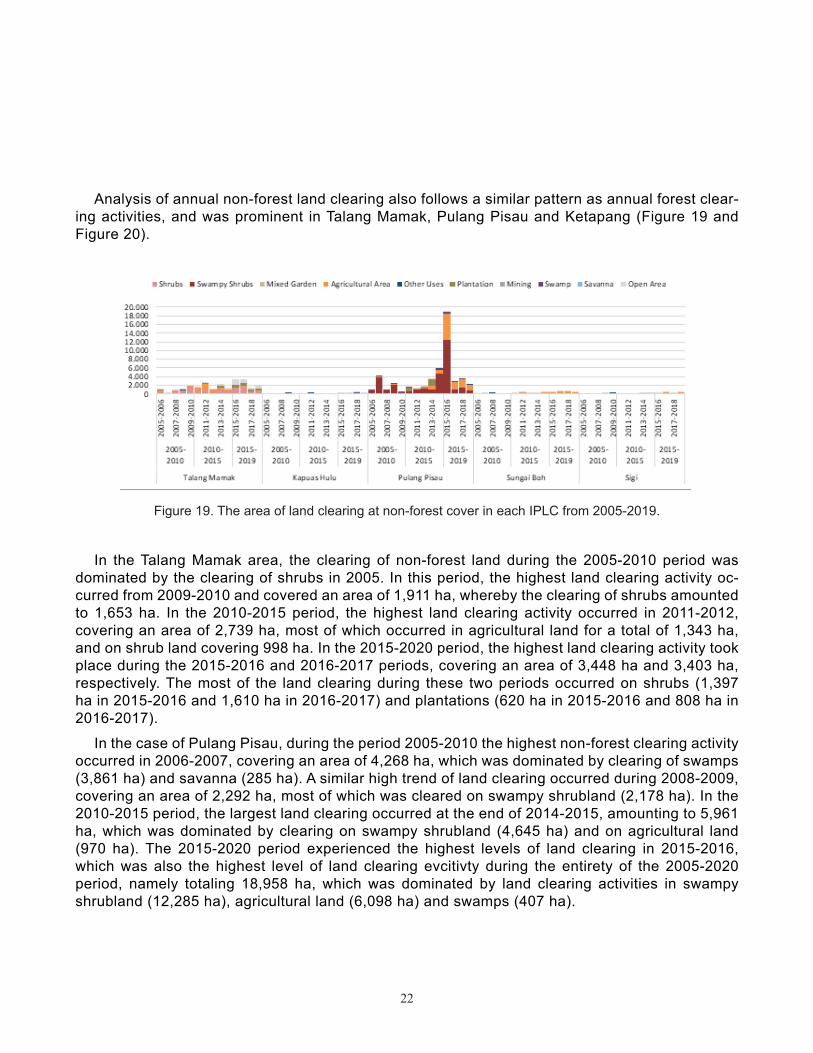
Analysis of annual non-forest land clearing also follows a similar pattern as annual forest clear-ing activities, and was prominent in Talang Mamak, Pulang Pisau and Ketapang (Figure 19 and Figure 20).
Figure 19. The area of land clearing at non-forest cover in each IPLC from 2005-2019.
In the Talang Mamak area, the clearing of non-forest land during the 2005-2010 period was dominated by the clearing of shrubs in 2005. In this period, the highest land clearing activity oc-curred from 2009-2010 and covered an area of 1,911 ha, whereby the clearing of shrubs amounted to 1,653 ha. In the 2010-2015 period, the highest land clearing activity occurred in 2011-2012, covering an area of 2,739 ha, most of which occurred in agricultural land for a total of 1,343 ha, and on shrub land covering 998 ha. In the 2015-2020 period, the highest land clearing activity took place during the 2015-2016 and 2016-2017 periods, covering an area of 3,448 ha and 3,403 ha, respectively. The most of the land clearing during these two periods occurred on shrubs (1,397 ha in 2015-2016 and 1,610 ha in 2016-2017) and plantations (620 ha in 2015-2016 and 808 ha in 2016-2017).
In the case of Pulang Pisau, during the period 2005-2010 the highest non-forest clearing activity occurred in 2006-2007, covering an area of 4,268 ha, which was dominated by clearing of swamps (3,861 ha) and savanna (285 ha). A similar high trend of land clearing occurred during 2008-2009, covering an area of 2,292 ha, most of which was cleared on swampy shrubland (2,178 ha). In the 2010-2015 period, the largest land clearing occurred at the end of 2014-2015, amounting to 5,961 ha, which was dominated by clearing on swampy shrubland (4,645 ha) and on agricultural land (970 ha). The 2015-2020 period experienced the highest levels of land clearing in 2015-2016, which was also the highest level of land clearing evcitivty during the entirety of the 2005-2020 period, namely totaling 18,958 ha, which was dominated by land clearing activities in swampy shrubland (12,285 ha), agricultural land (6,098 ha) and swamps (407 ha).
23
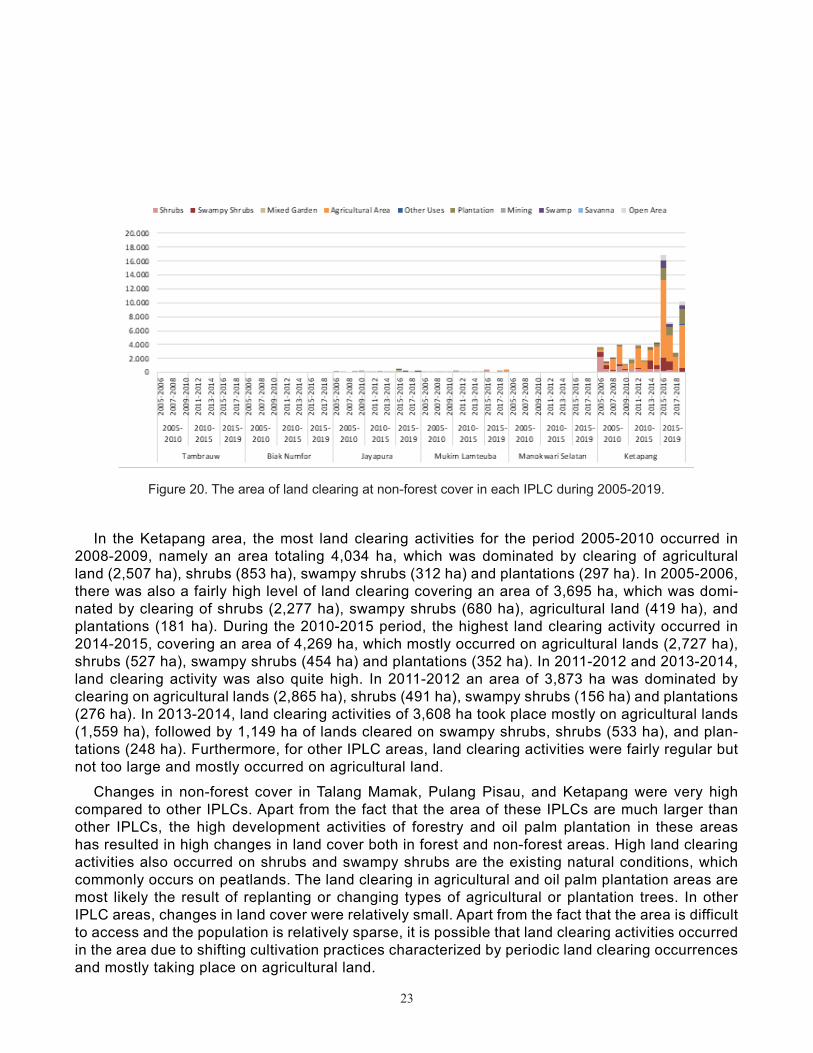
Figure 20. The area of land clearing at non-forest cover in each IPLC during 2005-2019.
In the Ketapang area, the most land clearing activities for the period 2005-2010 occurred in 2008-2009, namely an area totaling 4,034 ha, which was dominated by clearing of agricultural land (2,507 ha), shrubs (853 ha), swampy shrubs (312 ha) and plantations (297 ha). In 2005-2006, there was also a fairly high level of land clearing covering an area of 3,695 ha, which was domi-nated by clearing of shrubs (2,277 ha), swampy shrubs (680 ha), agricultural land (419 ha), and plantations (181 ha). During the 2010-2015 period, the highest land clearing activity occurred in 2014-2015, covering an area of 4,269 ha, which mostly occurred on agricultural lands (2,727 ha), shrubs (527 ha), swampy shrubs (454 ha) and plantations (352 ha). In 2011-2012 and 2013-2014, land clearing activity was also quite high. In 2011-2012 an area of 3,873 ha was dominated by clearing on agricultural lands (2,865 ha), shrubs (491 ha), swampy shrubs (156 ha) and plantations (276 ha). In 2013-2014, land clearing activities of 3,608 ha took place mostly on agricultural lands (1,559 ha), followed by 1,149 ha of lands cleared on swampy shrubs, shrubs (533 ha), and plan-tations (248 ha). Furthermore, for other IPLC areas, land clearing activities were fairly regular but not too large and mostly occurred on agricultural land.
Changes in non-forest cover in Talang Mamak, Pulang Pisau, and Ketapang were very high compared to other IPLCs. Apart from the fact that the area of these IPLCs are much larger than other IPLCs, the high development activities of forestry and oil palm plantation in these areas has resulted in high changes in land cover both in forest and non-forest areas. High land clearing activities also occurred on shrubs and swampy shrubs are the existing natural conditions, which commonly occurs on peatlands. The land clearing in agricultural and oil palm plantation areas are most likely the result of replanting or changing types of agricultural or plantation trees. In other IPLC areas, changes in land cover were relatively small. Apart from the fact that the area is difficult to access and the population is relatively sparse, it is possible that land clearing activities occurred in the area due to shifting cultivation practices characterized by periodic land clearing occurrences and mostly taking place on agricultural land.
24
3.3. HISTORICAL OCCURRENCE OF HOTSPOTS
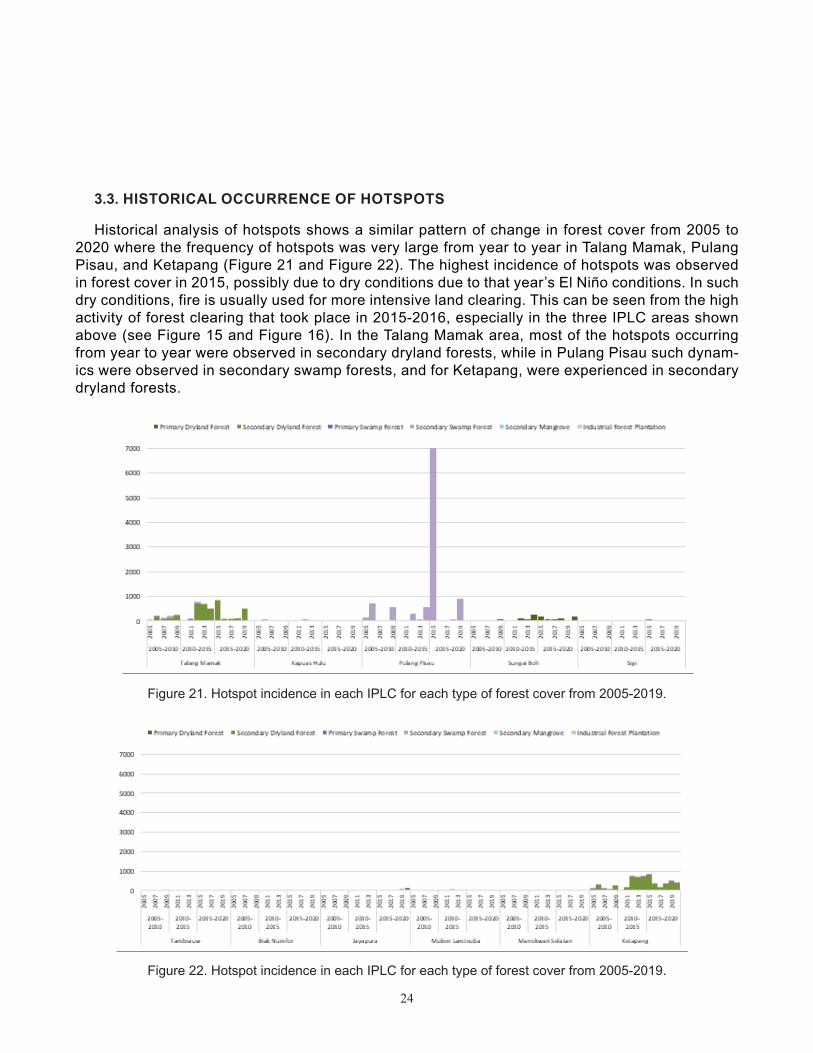
Historical analysis of hotspots shows a similar pattern of change in forest cover from 2005 to 2020 where the frequency of hotspots was very large from year to year in Talang Mamak, Pulang Pisau, and Ketapang (Figure 21 and Figure 22). The highest incidence of hotspots was observed in forest cover in 2015, possibly due to dry conditions due to that year’s El Niño conditions. In such dry conditions, fire is usually used for more intensive land clearing. This can be seen from the high activity of forest clearing that took place in 2015-2016, especially in the three IPLC areas shown above (see Figure 15 and Figure 16). In the Talang Mamak area, most of the hotspots occurring from year to year were observed in secondary dryland forests, while in Pulang Pisau such dynam-ics were observed in secondary swamp forests, and for Ketapang, were experienced in secondary dryland forests.
Figure 21. Hotspot incidence in each IPLC for each type of forest cover from 2005-2019.
Figure 22. Hotspot incidence in each IPLC for each type of forest cover from 2005-2019.
25
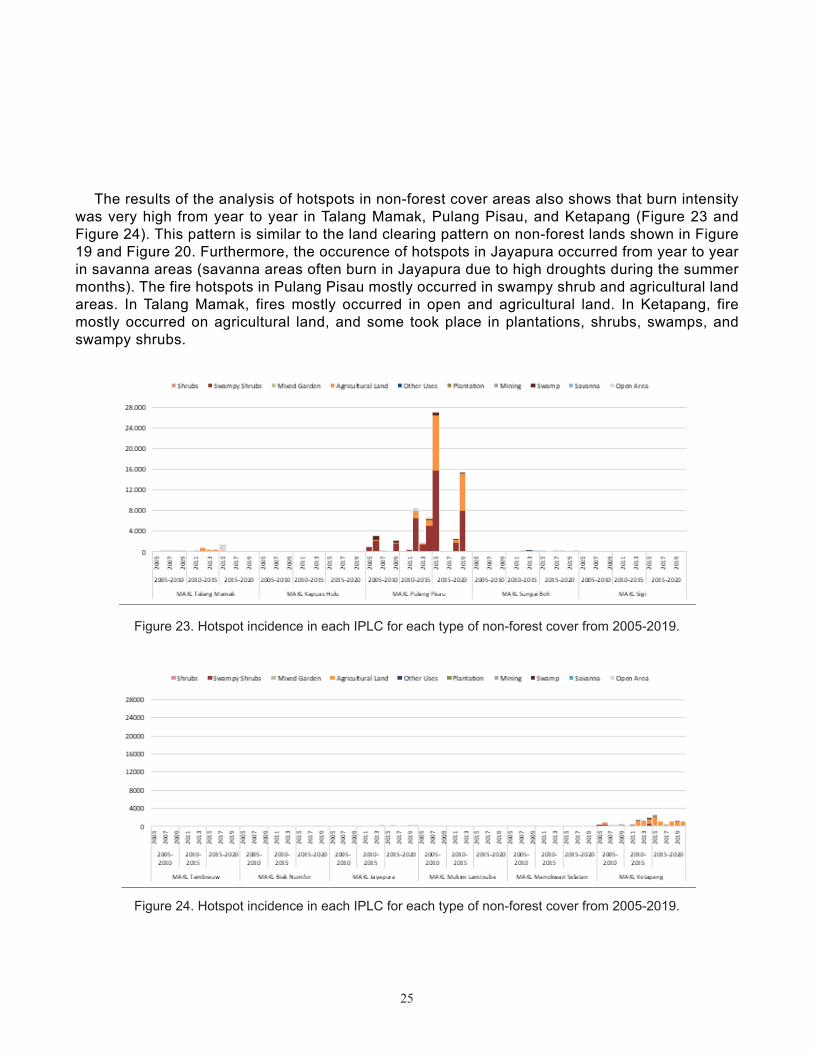
The results of the analysis of hotspots in non-forest cover areas also shows that burn intensity was very high from year to year in Talang Mamak, Pulang Pisau, and Ketapang (Figure 23 and Figure 24). This pattern is similar to the land clearing pattern on non-forest lands shown in Figure 19 and Figure 20. Furthermore, the occurence of hotspots in Jayapura occurred from year to year in savanna areas (savanna areas often burn in Jayapura due to high droughts during the summer months). The fire hotspots in Pulang Pisau mostly occurred in swampy shrub and agricultural land areas. In Talang Mamak, fires mostly occurred in open and agricultural land. In Ketapang, fire mostly occurred on agricultural land, and some took place in plantations, shrubs, swamps, and swampy shrubs.
Figure 23. Hotspot incidence in each IPLC for each type of non-forest cover from 2005-2019.
Figure 24. Hotspot incidence in each IPLC for each type of non-forest cover from 2005-2019.
26
3.4. HISTORICAL CHANGES OF ABOVE GROUND CARBON STOCKS
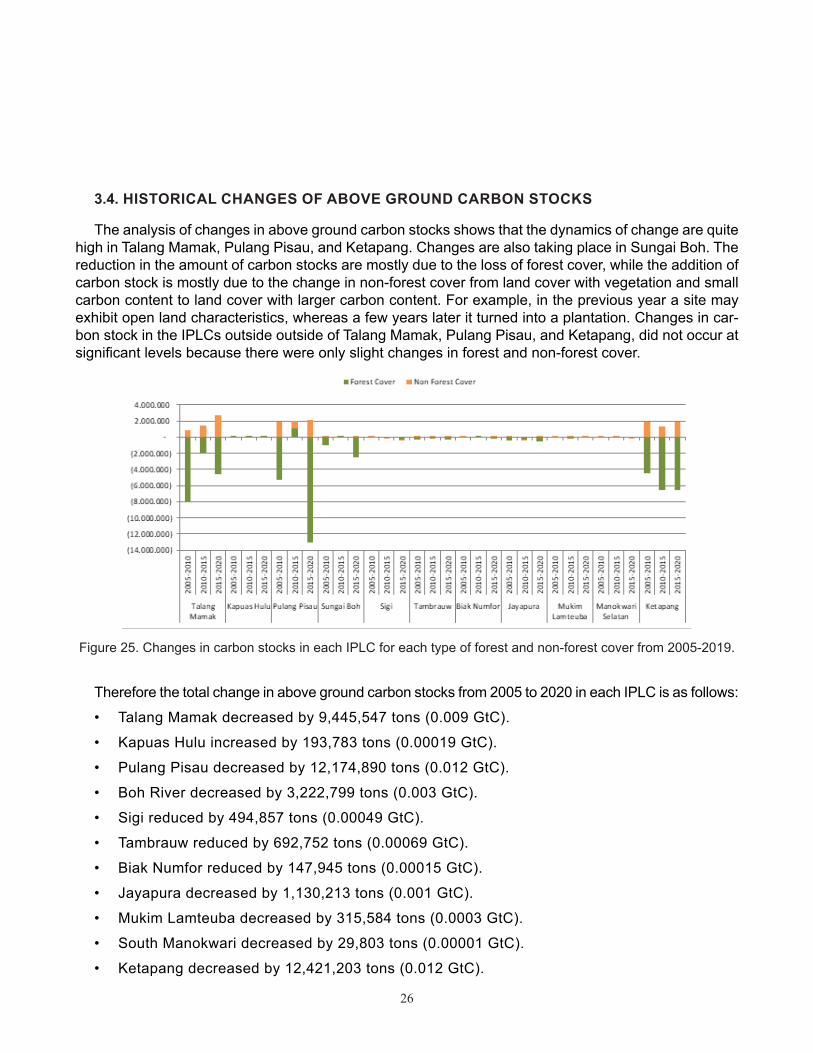
The analysis of changes in above ground carbon stocks shows that the dynamics of change are quite high in Talang Mamak, Pulang Pisau, and Ketapang. Changes are also taking place in Sungai Boh. The reduction in the amount of carbon stocks are mostly due to the loss of forest cover, while the addition of carbon stock is mostly due to the change in non-forest cover from land cover with vegetation and small carbon content to land cover with larger carbon content. For example, in the previous year a site may exhibit open land characteristics, whereas a few years later it turned into a plantation. Changes in car-bon stock in the IPLCs outside outside of Talang Mamak, Pulang Pisau, and Ketapang, did not occur at significant levels because there were only slight changes in forest and non-forest cover.
Figure 25. Changes in carbon stocks in each IPLC for each type of forest and non-forest cover from 2005-2019.
Therefore the total change in above ground carbon stocks from 2005 to 2020 in each IPLC is as follows:
• Talang Mamak decreased by 9,445,547 tons (0.009 GtC).
• Kapuas Hulu increased by 193,783 tons (0.00019 GtC).
• Pulang Pisau decreased by 12,174,890 tons (0.012 GtC).
• Boh River decreased by 3,222,799 tons (0.003 GtC).
• Sigi reduced by 494,857 tons (0.00049 GtC).
• Tambrauw reduced by 692,752 tons (0.00069 GtC).
• Biak Numfor reduced by 147,945 tons (0.00015 GtC).
• Jayapura decreased by 1,130,213 tons (0.001 GtC).
• Mukim Lamteuba decreased by 315,584 tons (0.0003 GtC).
• South Manokwari decreased by 29,803 tons (0.00001 GtC).
• Ketapang decreased by 12,421,203 tons (0.012 GtC).
27
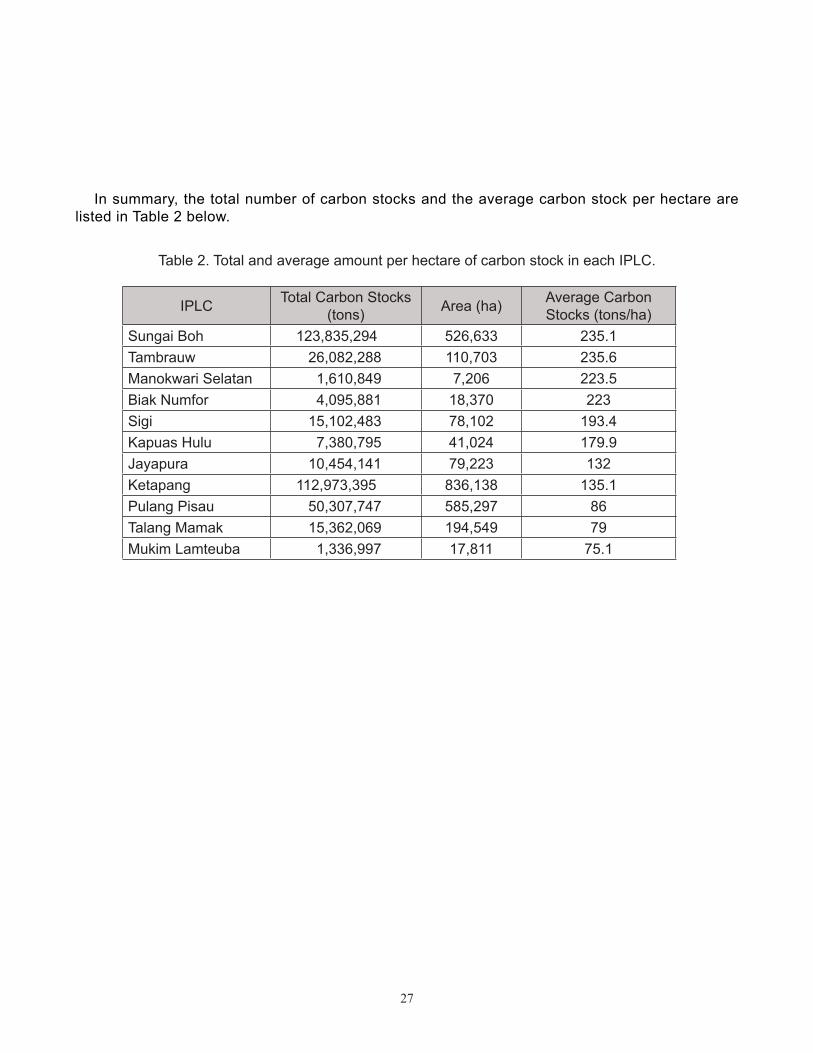
In summary, the total number of carbon stocks and the average carbon stock per hectare are listed in Table 2 below.
Table 2. Total and average amount per hectare of carbon stock in each IPLC.
IPLC Total Carbon Stocks (tons) Area (ha) Average Carbon
Stocks (tons/ha)Sungai Boh 123,835,294 526,633 235.1Tambrauw 26,082,288 110,703 235.6Manokwari Selatan 1,610,849 7,206 223.5Biak Numfor 4,095,881 18,370 223Sigi 15,102,483 78,102 193.4Kapuas Hulu 7,380,795 41,024 179.9Jayapura 10,454,141 79,223 132Ketapang 112,973,395 836,138 135.1Pulang Pisau 50,307,747 585,297 86Talang Mamak 15,362,069 194,549 79Mukim Lamteuba 1,336,997 17,811 75.1
28
4. SUMMARY AND CONCLUSIONThe use of satellite image archives from 2005 to 2020 is very effective for analyzing changes in
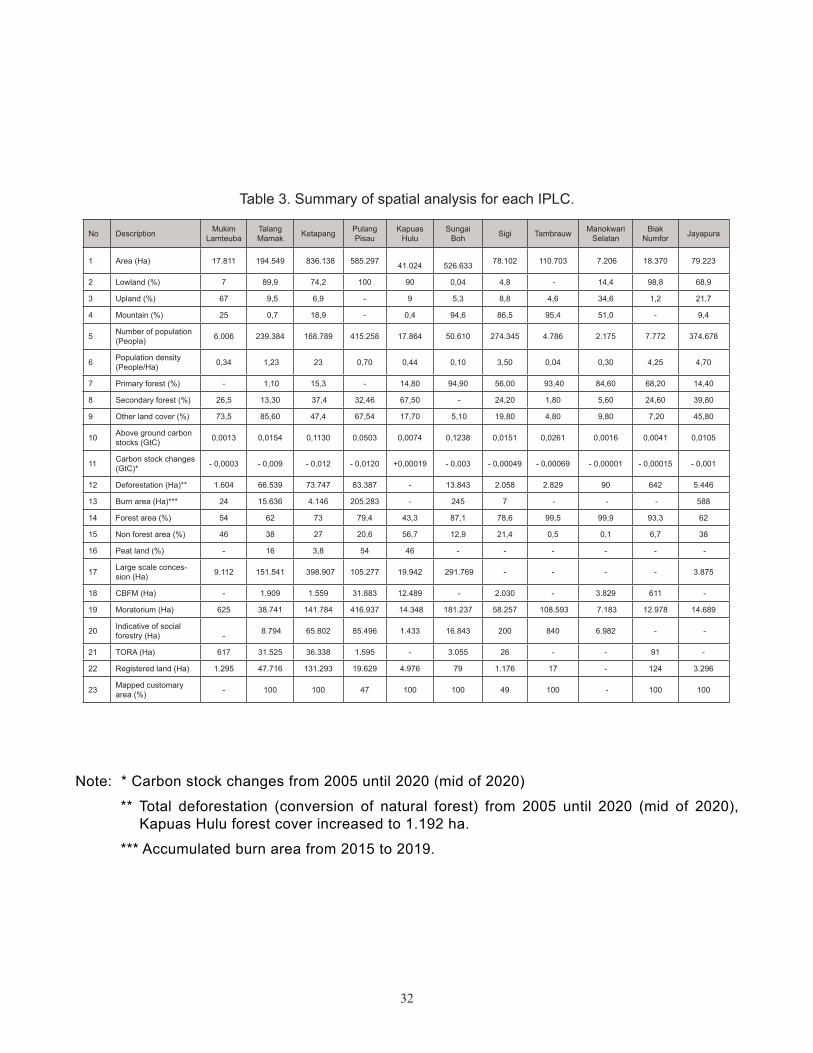
land cover and annual land clearing in both forest and non-forest cover. This report compliments the results of the analysis carried out previously in the report entitled ‘Technical Support for Cre-ating Baseline Analysis for Carbon Stock and Land Cover Change in Samdhana Institute Focal Areas (2015-2020)’. Land cover analysis was carried out to answer the question about the extent of the relationship or linkage between IPLC rights and livelihoods with dynamics of land cover, land use change, forest fires, and carbon stocks. One challenge faced in conducting this analysis was the limited availability of satellite imagery prior to 2015. The available images sufficient for cloud correction included Landsat 7, although since June 2003, all Landsat 7 images experienced blank data in the form of longitudinal lines due to the failure of the SLC (Scan Line Corrector) tool. To improve consistency, the Ministry of Forestry’s 2006 and 2009 land cover maps were also used. These maps were corrected using processed images to obtain land cover data for 2005 and 2010. Analysis of annual land clearing (forest and non-forest) using forest loss data from Mathew Hansen (Maryland University) from 2005 to 2015 was then further corrected with Landsat 7 imagery. Table 3 below summarizes the conditions of each IPLC and contains the analysis results that update the tables in the previous report.
The results of the analysis of land cover history showed that three IPLCs, namely Talang Mamak, Pulang Pisau, and Ketapang, experienced very high forest and non-forest changes, deforestation, occurance of hotspots, and a reduction in carbon stock compared to other IPLCs. This is likely due to the very high development activities in these three IPLCs, whereby large concessionaire operations were active in the plantation and forestry sector even before 2005. With its dominant lowland and upland areas, the area has long been a very attractive site for various investments demanding a large area. Forestry and non-forestry cultivation plans have been implemented and are ongoing at these sites.
The conditions are different for Kapuas Hulu in which this IPLC has a similar potential for devel-opment planning as those in Talang Mamak, Pulang Pisau, and Ketapang. The Kapuas Hulu area is also mostly lowlands and highlands, and 56.7% of the area is allocated for non-forestry. Never-theless, access into Kapuas Hulu remains limited, so that not many concessions have opened up land to begin development activities, even though there are already many permits issued by the government. Biak Numfor and Jayapura are also dominated by lowlands and highland topogra-phies, but apart from accessibility issues, the majority of the area is forested and not many large-scale concessions have been allocated in these areas. Other IPLC areas are mostly inaccessible highlands and mountains, and not many large-scale concessions have been allocated in these ar-eas. This geographic condition is probably the reason why many changes in forest and non-forest cover are taking place, namely shaping the intensity of annual land clearing, intensity of hotspots, and changes in carbon stock, which are far less than those in Talang Mamak, Pulang Pisau, and Ketapang.
The results of the analysis show the similarity of patterns of annual land clearing intensity with the intensity of annual hotspots occurring in both forest and non-forest cover. This can be seen by comparing Figures 21, 22, 23, and 24, which depict the intensity of the annual hotspots in each IPLC and contrasting with Figures 15, 16, 19, and 20, which depict the area of annual forest and
29
non-forest clearing in each IPLC. From these pattern, clear conclusions can be reached that land clearing activities cannot be separated from the use of fire both on a small scale at the community level and on a large scale for land preparation for development in large-scale concessions.
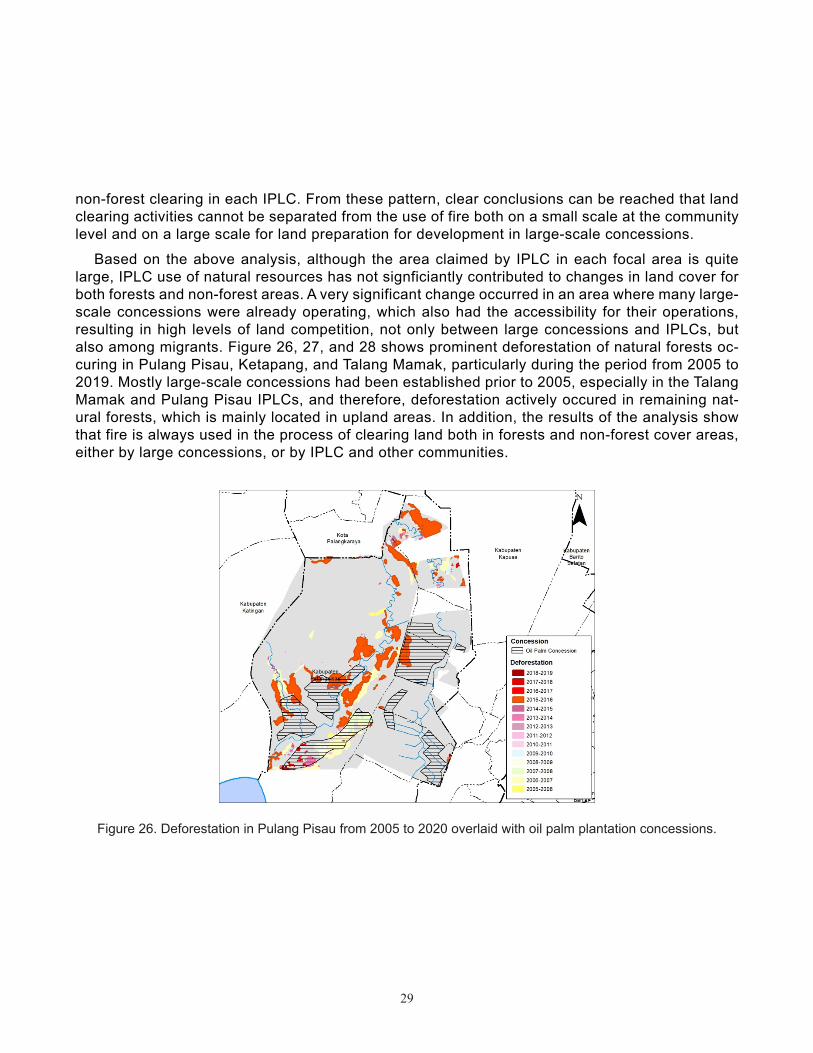
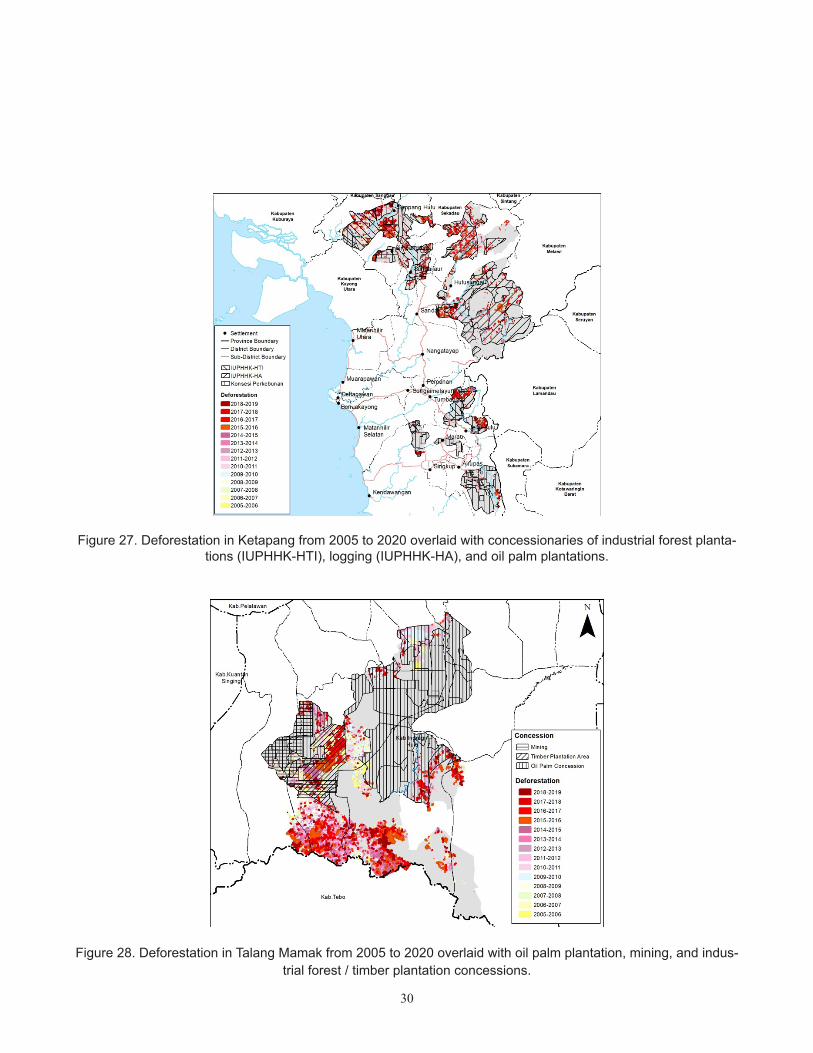
Based on the above analysis, although the area claimed by IPLC in each focal area is quite large, IPLC use of natural resources has not signficiantly contributed to changes in land cover for both forests and non-forest areas. A very significant change occurred in an area where many large-scale concessions were already operating, which also had the accessibility for their operations, resulting in high levels of land competition, not only between large concessions and IPLCs, but also among migrants. Figure 26, 27, and 28 shows prominent deforestation of natural forests oc-curing in Pulang Pisau, Ketapang, and Talang Mamak, particularly during the period from 2005 to 2019. Mostly large-scale concessions had been established prior to 2005, especially in the Talang Mamak and Pulang Pisau IPLCs, and therefore, deforestation actively occured in remaining nat-ural forests, which is mainly located in upland areas. In addition, the results of the analysis show that fire is always used in the process of clearing land both in forests and non-forest cover areas, either by large concessions, or by IPLC and other communities.
Figure 26. Deforestation in Pulang Pisau from 2005 to 2020 overlaid with oil palm plantation concessions.
30
Figure 27. Deforestation in Ketapang from 2005 to 2020 overlaid with concessionaries of industrial forest planta-tions (IUPHHK-HTI), logging (IUPHHK-HA), and oil palm plantations.
Figure 28. Deforestation in Talang Mamak from 2005 to 2020 overlaid with oil palm plantation, mining, and indus-trial forest / timber plantation concessions.
31
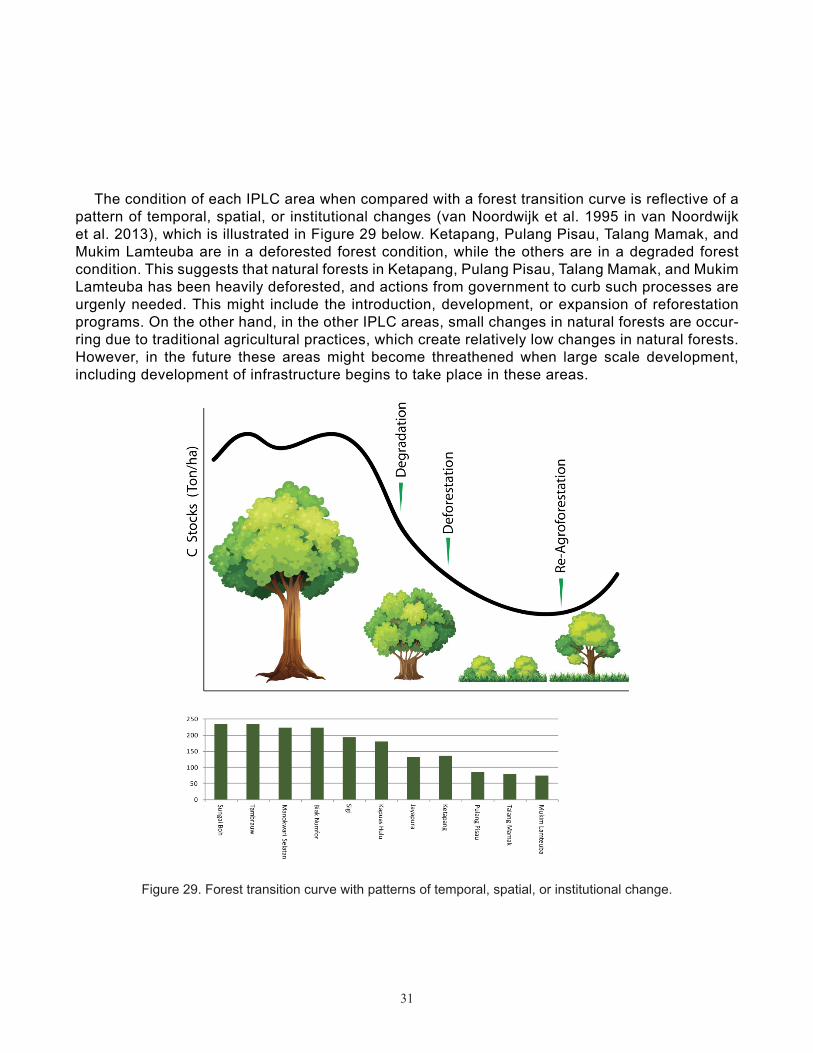
The condition of each IPLC area when compared with a forest transition curve is reflective of a pattern of temporal, spatial, or institutional changes (van Noordwijk et al. 1995 in van Noordwijk et al. 2013), which is illustrated in Figure 29 below. Ketapang, Pulang Pisau, Talang Mamak, and Mukim Lamteuba are in a deforested forest condition, while the others are in a degraded forest condition. This suggests that natural forests in Ketapang, Pulang Pisau, Talang Mamak, and Mukim Lamteuba has been heavily deforested, and actions from government to curb such processes are urgenly needed. This might include the introduction, development, or expansion of reforestation programs. On the other hand, in the other IPLC areas, small changes in natural forests are occur-ring due to traditional agricultural practices, which create relatively low changes in natural forests. However, in the future these areas might become threathened when large scale development, including development of infrastructure begins to take place in these areas.
Figure 29. Forest transition curve with patterns of temporal, spatial, or institutional change.
32
Table 3. Summary of spatial analysis for each IPLC.
No Description Mukim Lamteuba
Talang Mamak Ketapang Pulang
PisauKapuas
HuluSungai
Boh Sigi Tambrauw Manokwari Selatan
Biak Numfor Jayapura
1 Area (Ha) 17.811 194.549 836.138 585.297 41.024
526.633 78.102 110.703 7.206 18.370 79.223
2 Lowland (%) 7 89,9 74,2 100 90 0,04 4,8 - 14,4 98,8 68,9
3 Upland (%) 67 9,5 6,9 - 9 5,3 8,8 4,6 34,6 1,2 21,7
4 Mountain (%) 25 0,7 18,9 - 0,4 94,6 86,5 95,4 51,0 - 9,4
5 Number of population (Peopla) 6.006 239.384 168.789 415.258 17.864 50.610 274.345 4.786 2.175 7.772 374.678
6 Population density (People/Ha) 0,34 1,23 23 0,70 0,44 0,10 3,50 0,04 0,30 4,25 4,70
7 Primary forest (%) - 1,10 15,3 - 14,80 94,90 56,00 93,40 84,60 68,20 14,40
8 Secondary forest (%) 26,5 13,30 37,4 32,46 67,50 - 24,20 1,80 5,60 24,60 39,80
9 Other land cover (%) 73,5 85,60 47,4 67,54 17,70 5,10 19,80 4,80 9,80 7,20 45,80
10 Above ground carbon stocks (GtC) 0,0013 0,0154 0,1130 0,0503 0,0074 0,1238 0,0151 0,0261 0,0016 0,0041 0,0105
11 Carbon stock changes (GtC)* - 0,0003 - 0,009 - 0,012 - 0,0120 +0,00019 - 0,003 - 0,00049 - 0,00069 - 0,00001 - 0,00015 - 0,001
12 Deforestation (Ha)** 1.604 66.539 73.747 83.387 - 13.843 2.058 2.829 90 642 5.446
13 Burn area (Ha)*** 24 15.636 4.146 205.283 - 245 7 - - - 588
14 Forest area (%) 54 62 73 79,4 43,3 87,1 78,6 99,5 99,9 93,3 62
15 Non forest area (%) 46 38 27 20,6 56,7 12,9 21,4 0,5 0,1 6,7 38
16 Peat land (%) - 16 3,8 54 46 - - - - - -
17 Large scale conces-sion (Ha) 9.112 151.541 398.907 105.277 19.942 291.769 - - - - 3.875
18 CBFM (Ha) - 1.909 1.559 31.883 12.489 - 2.030 - 3.829 611 -
19 Moratorium (Ha) 625 38.741 141.784 416.937 14.348 181.237 58.257 108.593 7.183 12.978 14.689
20 Indicative of social forestry (Ha)
- 8.794 65.802 85.496 1.433 16.843 200 840 6.982 - -
21 TORA (Ha) 617 31.525 36.338 1.595 - 3.055 26 - - 91 -
22 Registered land (Ha) 1.295 47.716 131.293 19.629 4.976 79 1.176 17 - 124 3.296
23 Mapped customary area (%) - 100 100 47 100 100 49 100 - 100 100
Note: * Carbon stock changes from 2005 until 2020 (mid of 2020)
** Total deforestation (conversion of natural forest) from 2005 until 2020 (mid of 2020), Kapuas Hulu forest cover increased to 1.192 ha.
*** Accumulated burn area from 2015 to 2019.
33
REFERENCEAgus, F, Maswar, and Dariah, A., 2012. GHG Emissions Calculation Method in Peatlands and
Agricultural Land Resources Ministry of Agriculture, Center for Agricultural Land Resources Min-istry of Agriculture, Training materials BAU Baseline Calculation for Local Government. Bandung 21-25 May 2012.
Krisnawati, H., Adinugroho, C. & Imanuddin, R., 2012. Monograph: Allometric Models for Es-timating Aboveground Tree Biomass at Various Forest Ecosystem Types in Indonesia. Research and Development Center for Conservation and Rehabilitation, Forestry Research and Develop-ment Agency, Bogor.
Van Noordwijk, Meine & Hoang, Minh Ha & Neufeldt, H & Oborn, Ingrid & Yatich, Thomas., 2013. How trees and people can co-adapt to climate change, World Agroforestry Center.