Embed Size (px)
Citation preview

Historic Land Use in Maricopa County
Maps are from the Historic Land Use Phase 1 Report on Generalized Land Use by Kim Knowles-Yánez, Cherie Moritz, Jana Fry,
Charles L. Redman, Matt Bucchin, and Peter H McCartney from the Central Arizona — Phoenix Long-Term Ecological Research Project, ASU - Center For Environmental
Studies.(August 1999) For the full report go to: http://caplter.asu.edu/contributions/


Summary of Historic Land Use in Maricopa CountyFrom the Historic Land Use Phase 1 Report on Generalized Land Use by Kim Knowles-Yánez, Cherie Moritz, Jana Fry, Charles L. Redman, Matt Bucchin, and Peter H McCartney from the
Central Arizona — Phoenix Long-Term Ecological Research Project, ASU - Center For Environmental Studies.(August 1999) For the full report go to: http://caplter.asu.edu/contributions/
1912 General HistoryBetween 1870 – 1920 – Phoenix was the largest city in Arizona, agriculture played a dominant roleWater availability from the Salt River determined the initial development following re-excavation of the Hohokam canalsWheat, barley, and corn were the first surplus cropsLater came commercial citrus and fruit crops with alfalfa followingRoosevelt Dam was completed in 1911 and provided a reliable water source to the Valley1895 – first railroad service linked Phoenix to Southwest, Midwest, and Eastern markets
1934 General HistoryConstruction boom in the 1920’s (Roads, bridges, sewer and water lines, etc.)Agriculture is the prime economic activityCotton crop crashed in 1920s 1930s surplus corn crops sold to federal governmentAfter 1920’s Phoenix promoted itself as a place for tourism, good weather, health care, and the arts and was no longer promoted for agricultural useMost of the land consumed for urban growth was agricultural lands

1955 General HistoryPopulation more than tripled between 1940 and 1960Many high-teach companies during the post-war years and many Military personnel stationed here returned to the Valley with their families after the warAlmost all land that was becoming urbanized was former farmland, but for the first time a more desert land was being used for urbanization Farming was no longer the major industryAgriculture was the leading source of income for the last time in 1953
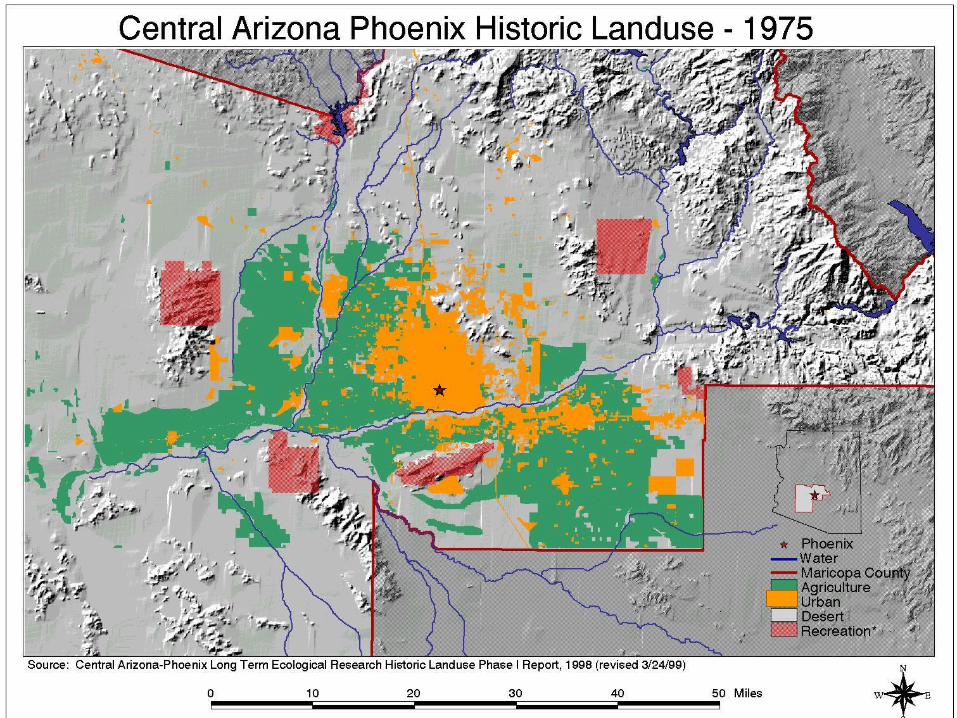
1975 General HistoryBy 1960’a growth of the city favored northwest, northeast and southeastern portions of the Valley Urban areas continued to grow while agricultural area decreased due to urbanization Boundaries of agriculture land expanded - new areas open to irrigation1973 – Agriculture was second in importance to manufacturing as a source of income1984 – Agriculture as an occupation was not dominant in any Maricopa County census tractsUrban development more than doubled between 1955 and 1975More and more desert land for urban use

1995 General HistoryFrom 1980 – 1994, Maricopa County was the third-fastest growing of the nation’s top 50 counties by number of peopleEconomy focus shifted to real estate, construction, electronics, aerospace, retirement, service, and tourismFrom 1975 – 1995, amount of land use for urban development almost tripledMajority of new development was on desert land

• Maricopa County Population (people) and Land Use (acres) Data 1912 - 1995**Land Use and population data from “Historical Land Use: Phase 1 Report on Generalized
Land Use” by Kim Knowles-Yanez, Cherie Moritz, Jana Fry, Charles L. Redman, Matt Bucchin, and Peter H. McCartney. Central Arizona — Phoenix Long-Term Ecological
Research Project, ASU - Center For Environmental Studies. August 1999
1912 1934 1955 1975 1995
Population 34,488 (1910)
150,970 (1930)
331,770 (1950)
971,228(1970)
2,551,765(1995)
Total Land in Maricopa County
2,828,644 2,828,644 2,828,644 2,828,644 2,828,644
Agriculture 253,422(9%)
442,624(16%)
391,001(14%)
453,739(16%)
319,371(11%)
Urban 4,940(<1%)
11,609(<1%)
75,582(3%)
185,497(7%)
508,326(18%)
Desert 2,570,282(91%)
2,359,097(83%)
2,327,728(82%)
2,096,042(74%)
1,876,953(66%)
Recreation 0(0%)
15,067(1%)
34,333(1%)
93,366(3%)
123,994(4%)