Embed Size (px)
DESCRIPTION
Hispanic Student Performance on Missouri Standardized Achievement Tests Cambio De Colores April 2, 2007 Kansas City, Missouri Bill Elder and Keith Jamtgaard University of Missouri--Columbia Office of Social and Economic Data Analysis. We need to close our achievement gaps - PowerPoint PPT Presentation
Citation preview
Office of Social and Economic Data AnalysisOffice of Social and Economic Data Analysis
Hispanic Student Performance on Missouri Hispanic Student Performance on Missouri Standardized Achievement TestsStandardized Achievement Tests
Cambio De ColoresCambio De Colores
April 2, 2007April 2, 2007Kansas City, MissouriKansas City, Missouri
Bill Elder and Keith JamtgaardBill Elder and Keith Jamtgaard
University of Missouri--ColumbiaUniversity of Missouri--ColumbiaOffice of Social and Economic Data AnalysisOffice of Social and Economic Data Analysis
Office of Social and Economic Data AnalysisOffice of Social and Economic Data Analysis
Overview• We need to close our achievement gaps
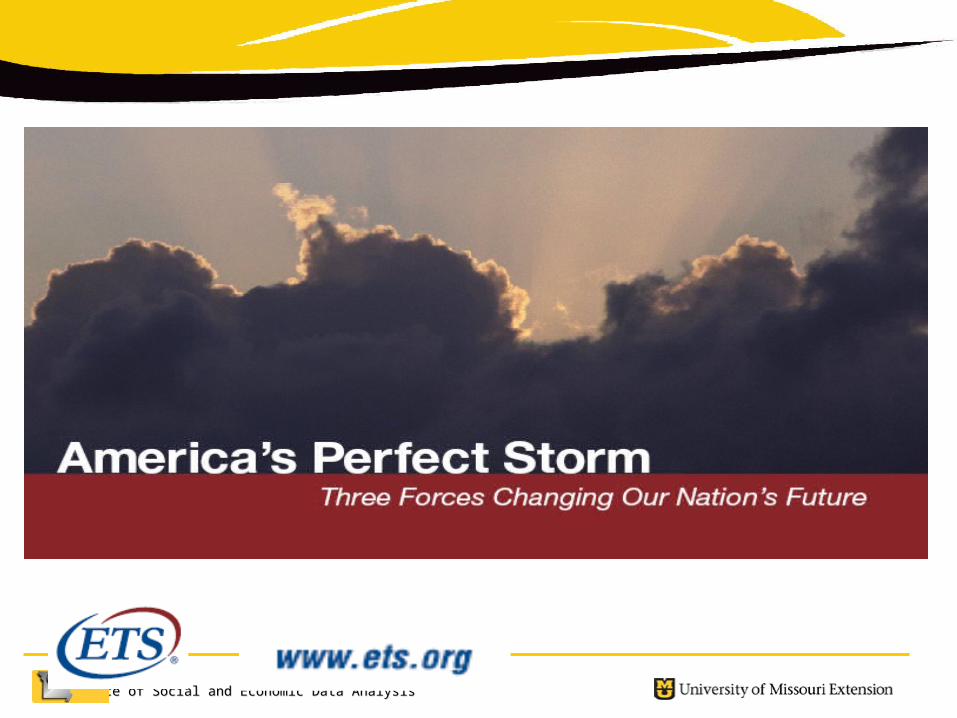
• Review of “Perfect Storm” Report
• Overview of Hispanic Students in Missouri
• Review of Performance Trends
• Discussion – Strategies to close the gap
Office of Social and Economic Data AnalysisOffice of Social and Economic Data Analysis
Educational Testing Service
Office of Social and Economic Data AnalysisOffice of Social and Economic Data Analysis
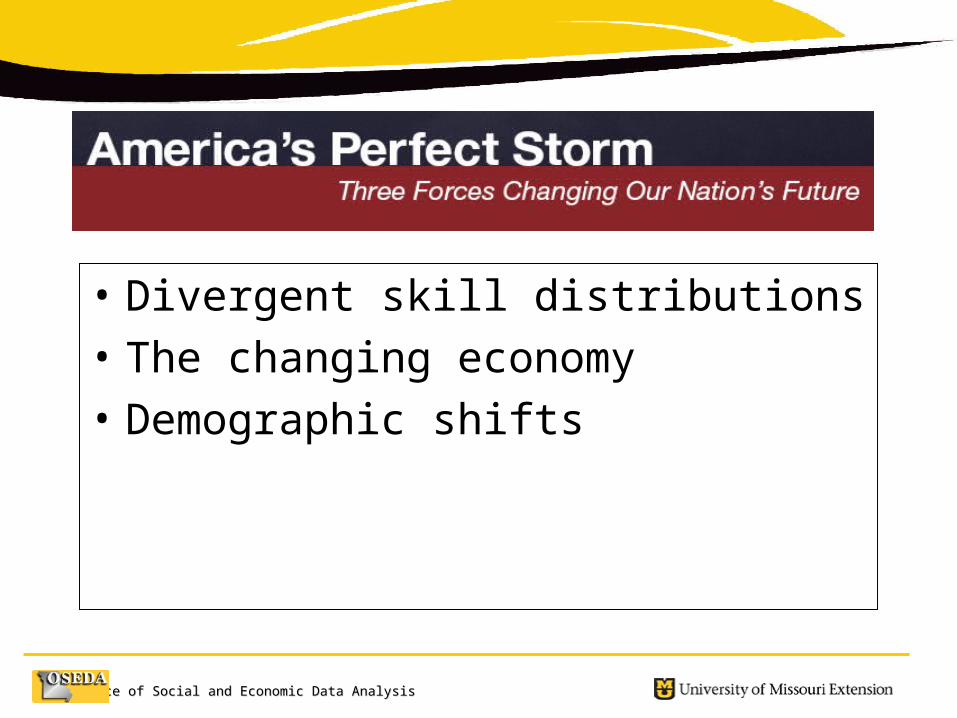
• Divergent skill distributions
• The changing economy
• Demographic shifts
Office of Social and Economic Data AnalysisOffice of Social and Economic Data Analysis
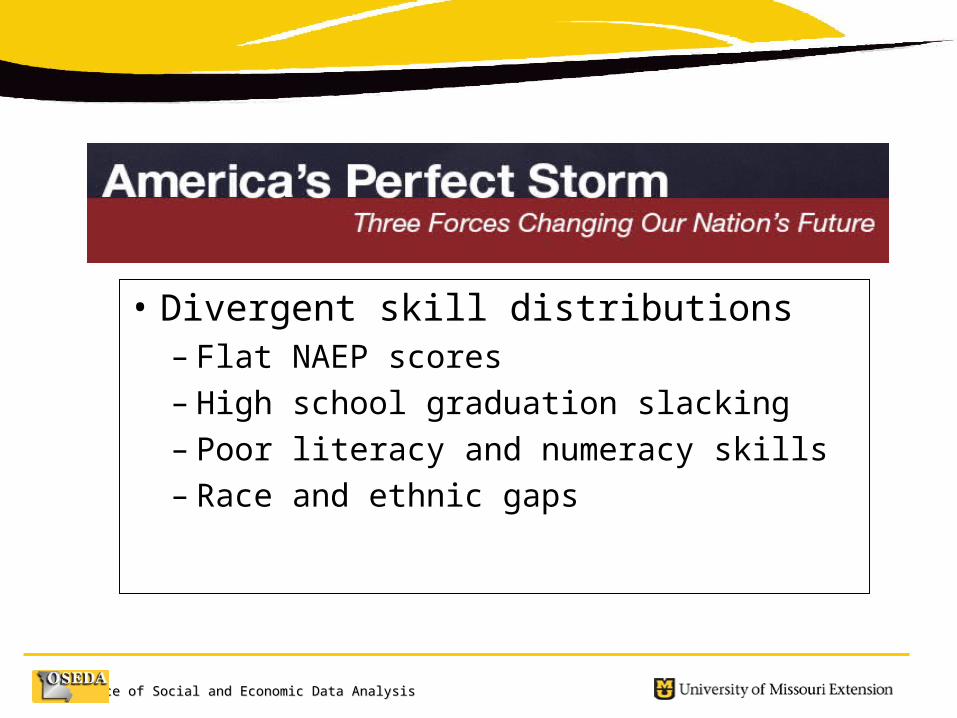
• Divergent skill distributions– Flat NAEP scores– High school graduation slacking– Poor literacy and numeracy skills– Race and ethnic gaps
Office of Social and Economic Data AnalysisOffice of Social and Economic Data Analysis
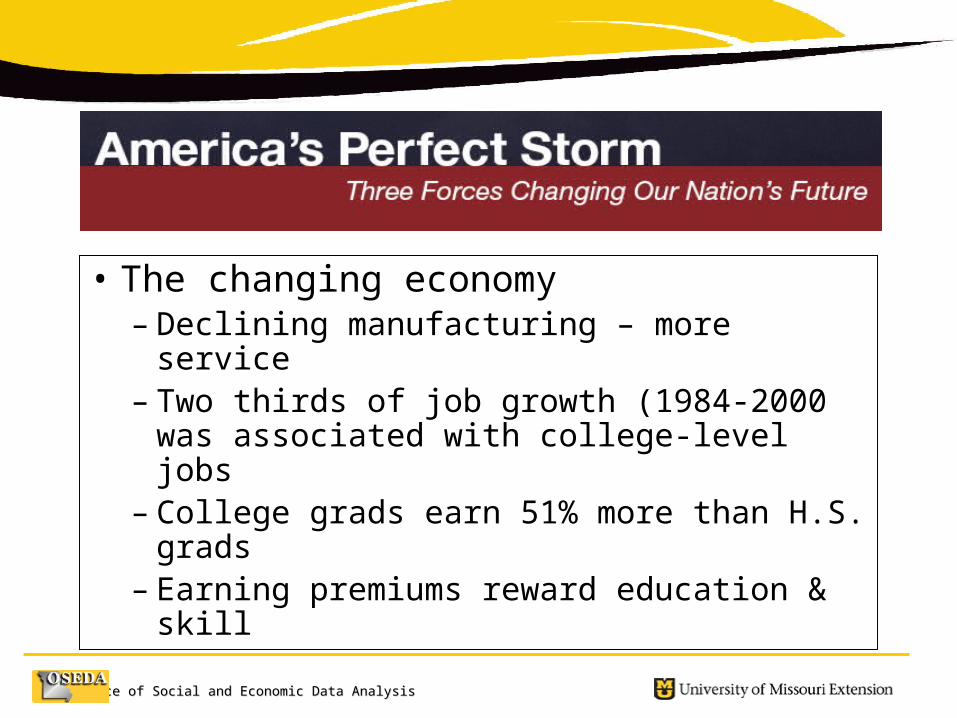
• The changing economy– Declining manufacturing – more service– Two thirds of job growth (1984-2000 was
associated with college-level jobs– College grads earn 51% more than H.S.
grads– Earning premiums reward education &
skill
Office of Social and Economic Data AnalysisOffice of Social and Economic Data Analysis
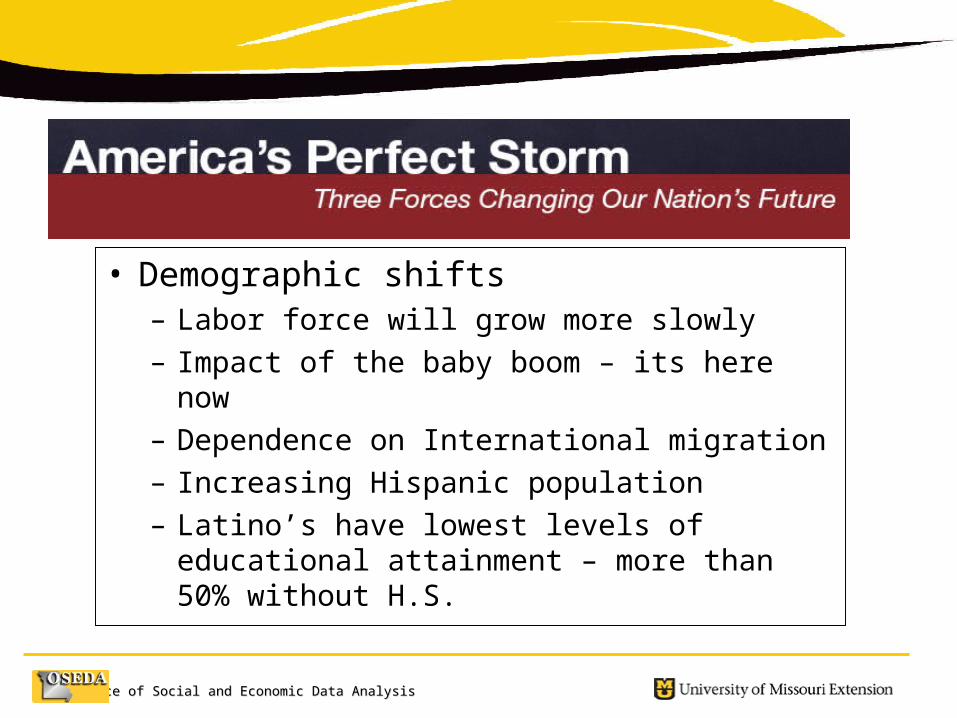
• Demographic shifts– Labor force will grow more slowly– Impact of the baby boom – its here now– Dependence on International migration– Increasing Hispanic population– Latino’s have lowest levels of educational
attainment – more than 50% without H.S.
Office of Social and Economic Data AnalysisOffice of Social and Economic Data Analysis
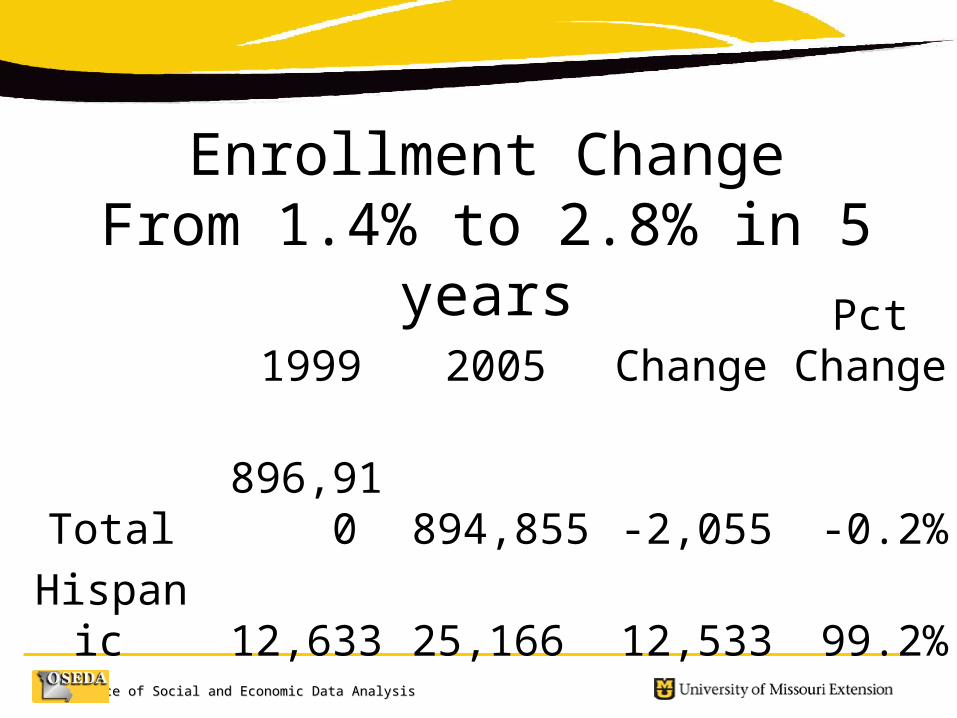
1999 2005 ChangePct
Change
Total
896,910
894,855 -2,055 -0.2%
Hispanic
12,633
25,166
12,533 99.2%
Enrollment ChangeFrom 1.4% to 2.8% in 5 years
Office of Social and Economic Data AnalysisOffice of Social and Economic Data Analysis
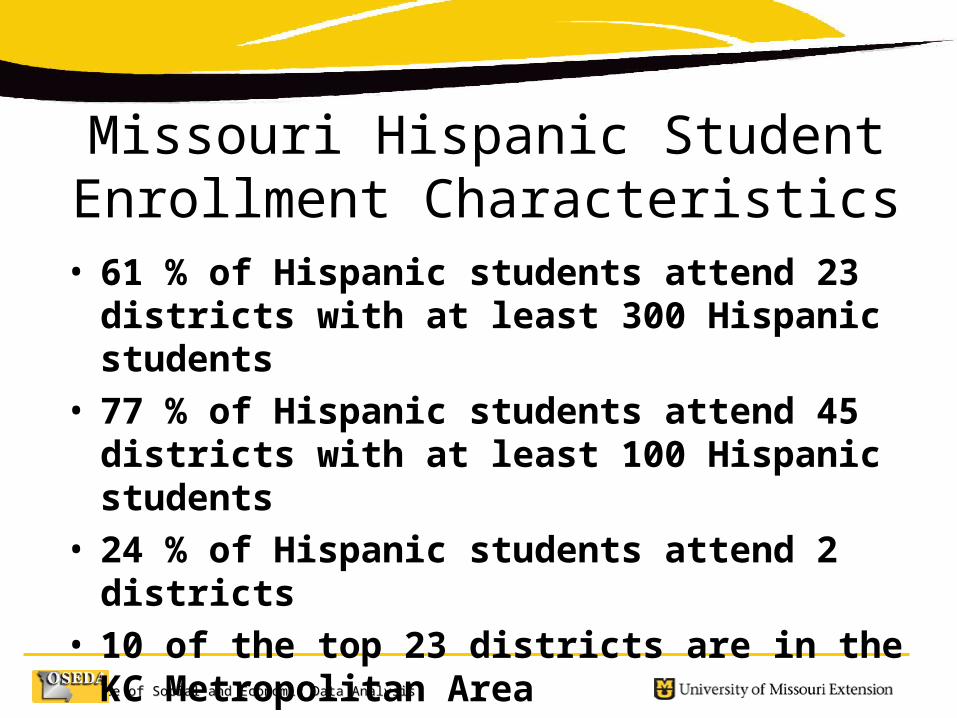
Missouri Hispanic Student Enrollment Characteristics
• 61 % of Hispanic students attend 23 districts with at least 300 Hispanic students
• 77 % of Hispanic students attend 45 districts with at least 100 Hispanic students
• 24 % of Hispanic students attend 2 districts• 10 of the top 23 districts are in the KC
Metropolitan Area
Office of Social and Economic Data AnalysisOffice of Social and Economic Data Analysis
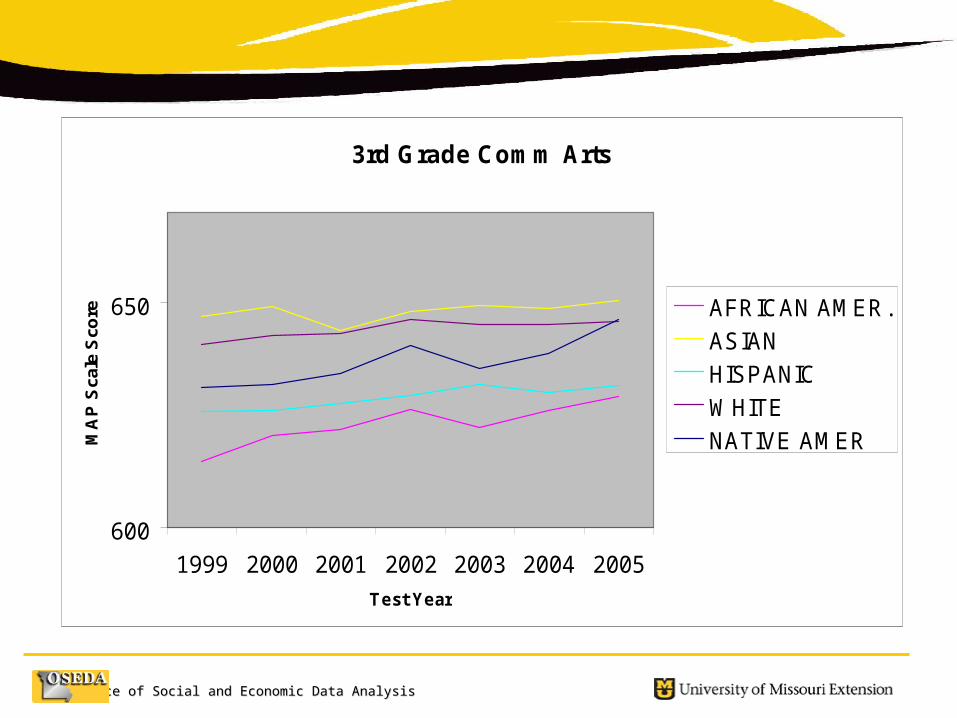
3rd Grade Comm Arts
600
650
1999 2000 2001 2002 2003 2004 2005
Test Year
MA
P S
cale
Sco
re AFRICAN AMER.
ASIAN
HISPANIC
WHITE
NATIVE AMER
Office of Social and Economic Data AnalysisOffice of Social and Economic Data Analysis
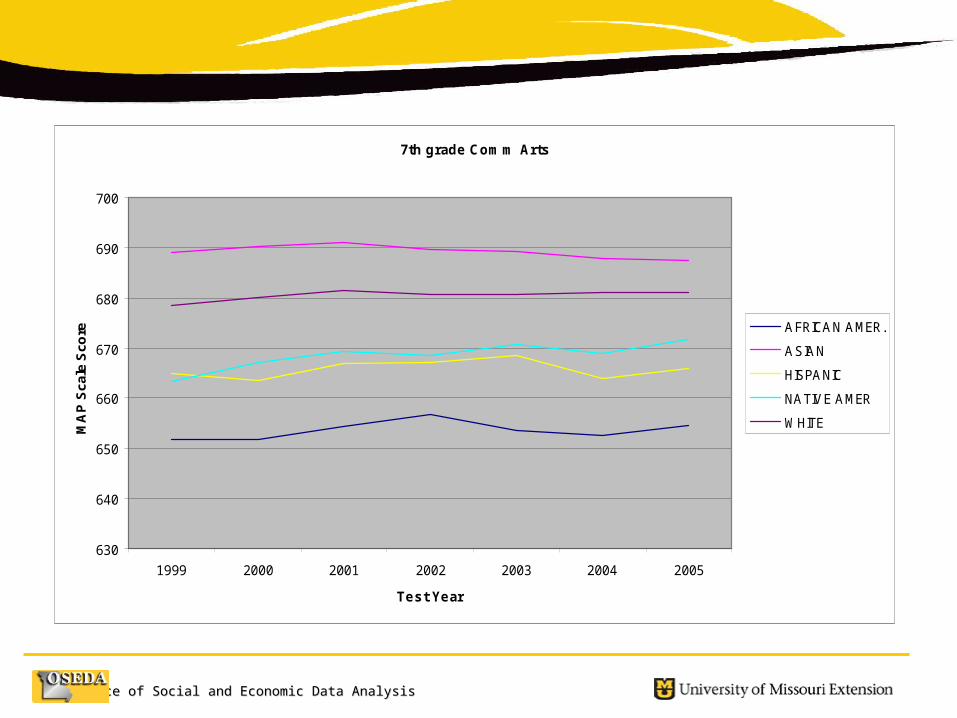
7th grade Com m Arts
630
640
650
660
670
680
690
700
1999 2000 2001 2002 2003 2004 2005
Test Year
MA
P S
cale
Sco
re AFRICAN AMER.
ASIAN
HISPANIC
NATIVE AMER
WHITE
Office of Social and Economic Data AnalysisOffice of Social and Economic Data Analysis
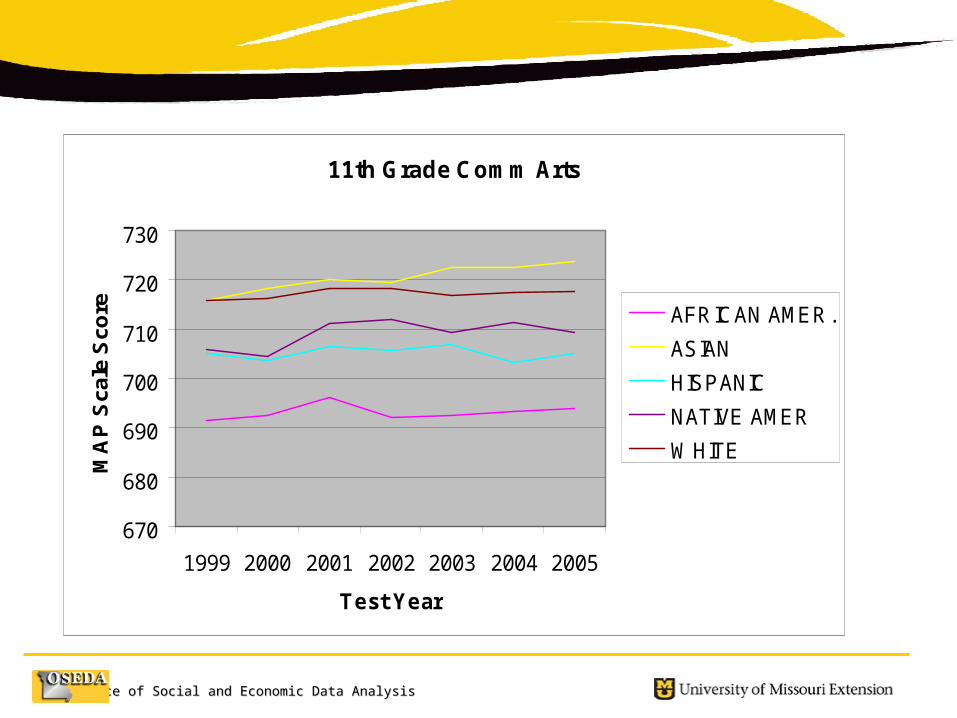
11th Grade Comm Arts
670
680
690
700
710
720
730
1999 2000 2001 2002 2003 2004 2005
Test Year
MA
P S
cale
Sco
re AFRICAN AMER.
ASIAN
HISPANIC
NATIVE AMER
WHITE
Office of Social and Economic Data AnalysisOffice of Social and Economic Data Analysis
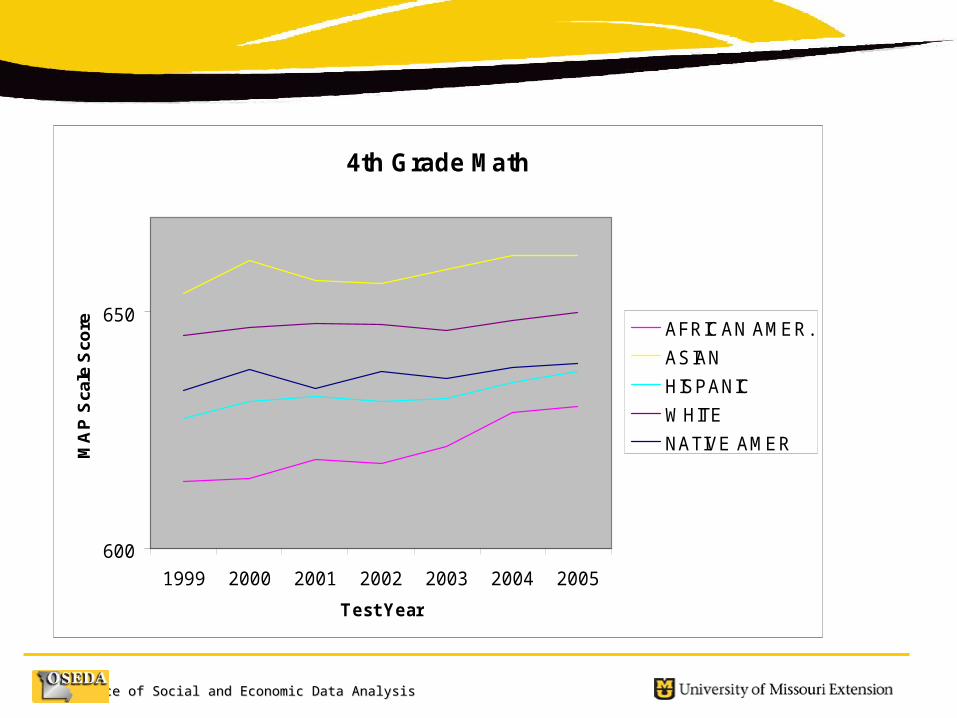
4th Grade Math
600
650
1999 2000 2001 2002 2003 2004 2005
Test Year
MA
P S
cale
Sco
re AFRICAN AMER.
ASIAN
HISPANIC
WHITE
NATIVE AMER
Office of Social and Economic Data AnalysisOffice of Social and Economic Data Analysis
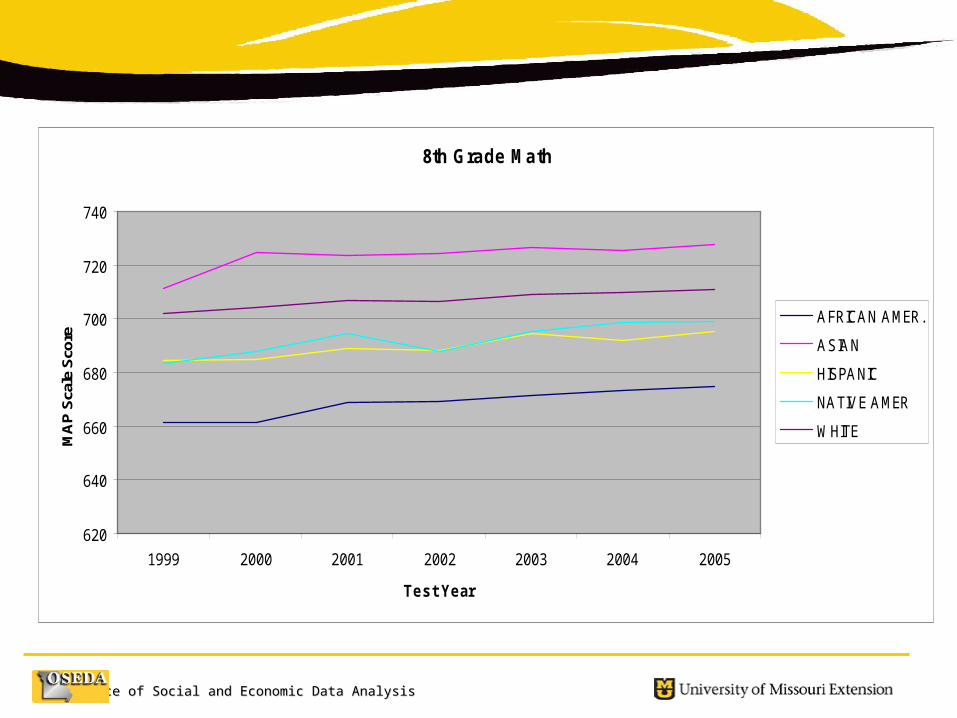
8th Grade Math
620
640
660
680
700
720
740
1999 2000 2001 2002 2003 2004 2005
Test Year
MA
P S
cale
Sco
re
AFRICAN AMER.
ASIAN
HISPANIC
NATIVE AMER
WHITE
Office of Social and Economic Data AnalysisOffice of Social and Economic Data Analysis
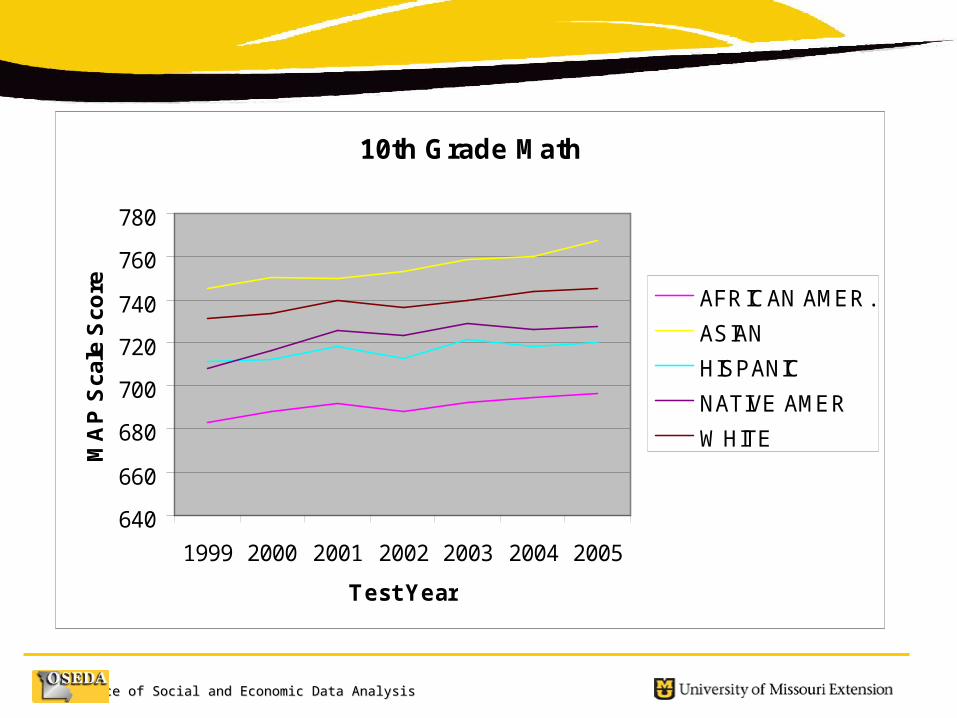
10th Grade Math
640
660
680
700
720
740
760
780
1999 2000 2001 2002 2003 2004 2005
Test Year
MA
P S
cale
Sco
re AFRICAN AMER.
ASIAN
HISPANIC
NATIVE AMER
WHITE
Office of Social and Economic Data AnalysisOffice of Social and Economic Data Analysis
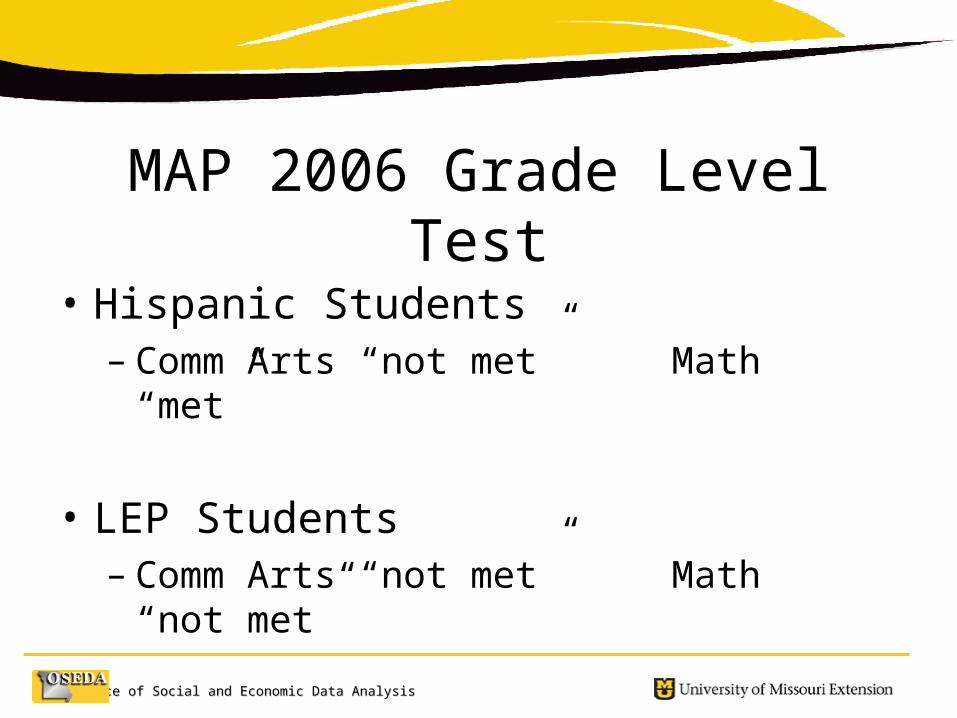
MAP 2006 Grade Level Test
• Hispanic Students– Comm Arts “not met” Math “met”
• LEP Students– Comm Arts “not met” Math “not met”
Office of Social and Economic Data AnalysisOffice of Social and Economic Data Analysis
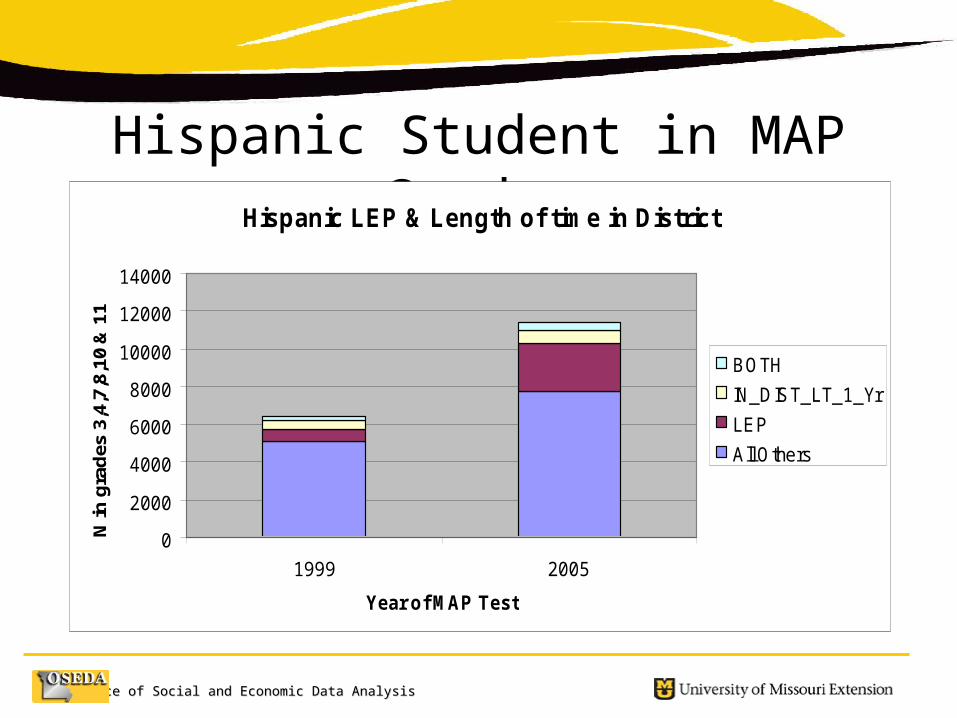
Hispanic Student in MAP GradesHispanic LEP & Length of time in District
0
2000
4000
6000
8000
10000
12000
14000
1999 2005
Year of MAP Test
N in
gra
des
3,4
,7,8
,10
& 1
1
BOTH
IN_DIST_LT_1_Yr
LEP
All Others
Office of Social and Economic Data AnalysisOffice of Social and Economic Data Analysis
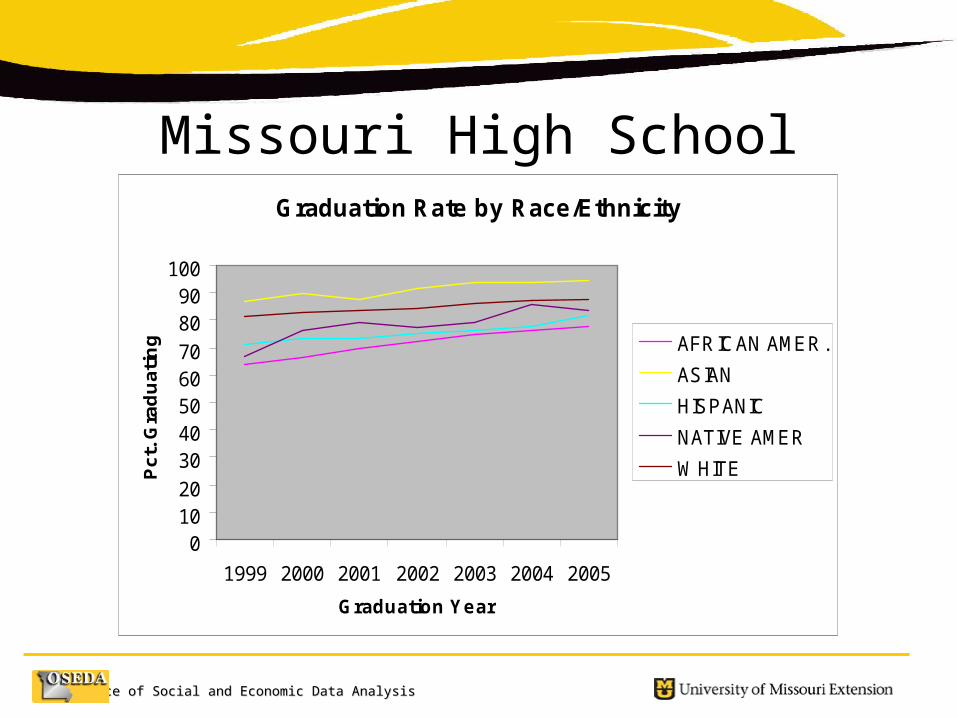
Missouri High School GraduationGraduation Rate by Race/Ethnicity
0102030405060708090
100
1999 2000 2001 2002 2003 2004 2005
Graduation Year
Pc
t. G
rad
ua
tin
g AFRICAN AMER.
ASIAN
HISPANIC
NATIVE AMER
WHITE
Office of Social and Economic Data AnalysisOffice of Social and Economic Data Analysis
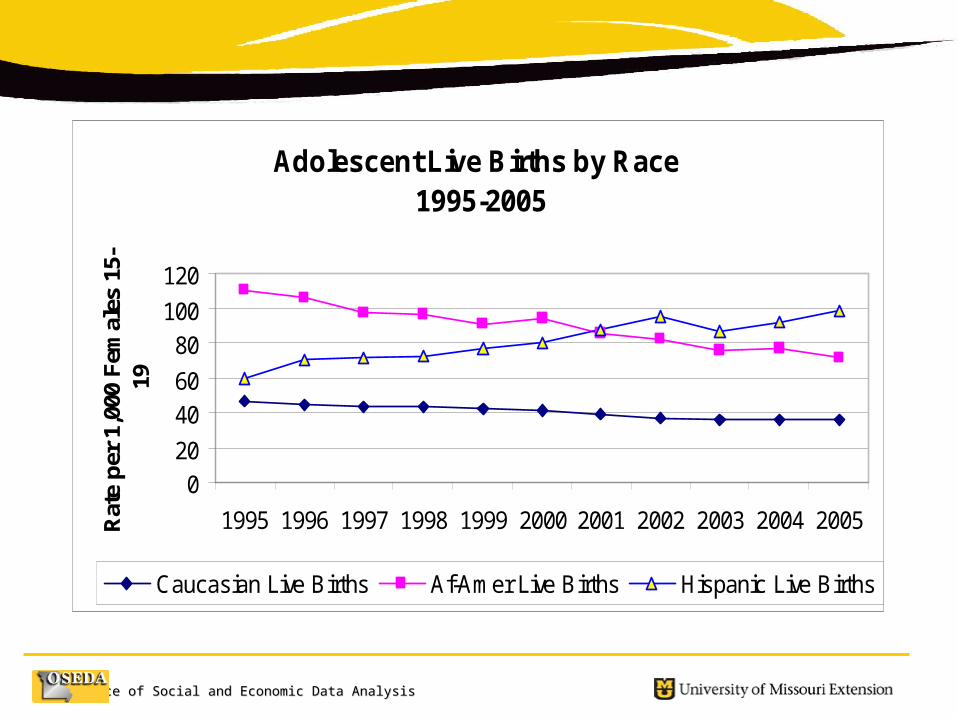
Adolescent Live Births by Race 1995-2005
020
4060
80100
120
1995 1996 1997 1998 1999 2000 2001 2002 2003 2004 2005Rat
e pe
r 1,
000
Fem
ales
15-
19
Caucasian Live Births Af-Amer Live Births Hispanic Live Births
Office of Social and Economic Data AnalysisOffice of Social and Economic Data Analysis
Closing the Education Achievement Gap
• Increasing well being
• Adolescent births
• High School Drop Rate 6% in 2005
• Child poverty rate in Missouri 2005– 17.8 % all children – 26.3 % Hispanic children

Office of Social and Economic Data AnalysisOffice of Social and Economic Data Analysis
Closing the Education Achievement Gap
• Educational Strategies– Parent Engagement– After School Programs– Background Knowledge (vocabulary)
• Discussion

Office of Social and Economic Data AnalysisOffice of Social and Economic Data Analysis
Hispanic Student Performance on Missouri Hispanic Student Performance on Missouri Standardized Achievement TestsStandardized Achievement Tests
Cambio De ColoresCambio De Colores
April 2, 2007April 2, 2007Kansas City, MissouriKansas City, Missouri
Bill Elder and Keith JamtgaardBill Elder and Keith Jamtgaard
University of Missouri--ColumbiaUniversity of Missouri--ColumbiaOffice of Social and Economic Data AnalysisOffice of Social and Economic Data Analysis