Embed Size (px)
Citation preview

HISPANIC OBESITY: AN AMERICAN
CRISIS
2010 POLICY BRIEF
HispanicObesity:an american
crisis
2
HispanicObesity:an american
crisis
3
nHcsL eXecUtiVe cOmmittee Leadership
President
Senator Iris Y. Martinez
iLLinOis
President Elect
Representative Minnie Gonzalez
cOnnecticUt
Vice President for Public Policy
Representative Mario Goico
Kansas
Vice President for Membership
Representative Pedro Marin
GeOrGia
Treasurer
Representative Mara Candelaria Reardon
indiana
Secretary
Senator Juan M. Pichardo
rHOde isLand
Immediate Past President
Representative Joseph E. Miro
deLaware
Members
Representative Geraldo Alicea
massacHUsetts
Assemblyman Adam Clayton Powell IV
new yOrK
Representative Michel Consejo
VermOnt
Representative Angel Cruz
pennsyLVania
Members (continued)
Representative Nora Espinoza
new meXicO
Senator Floyd Esquibel
wyOminG
Speaker of the House Jenniffer Gonzalez Colon
pUertO ricO
Speaker of the House Ben Lujan
new meXicO
Senator Richard Miranda
arizOna
Senator Antonio Muñoz
iLLinOis
Representative Dora Olivo
teXas
Assemblyman Felix Ortiz
new yOrK
Senate President Thomas Rivera Schatz
pUertO ricO
Senator Ross Romero
UtaH
Representative Louis Ruiz
Kansas
Senator Leticia Van de Putte
teXas
Representative Mark Archuleta Wheatley
UtaH
Representative Juan Zapata
FLOrida
nHcsL eXecUtiVe directOr
Elizabeth Burgos
FrOm senatOr iris y. martinez (iL)NHCSL President
Dear Colleagues:
Since its founding, NHCSL has been a leader in addressing Latino health disparities.
Hispanic state legislators, working on the ground in states across the country, have
worked in concert to identify policy solutions to our most challenging concerns – es-
pecially those leading to reduced quality of life for Latino families and children. The
Latino obesity crisis must engender a national call to action to reclaim the health and
well-being of our communities.
Latino obesity is not just about esthetic concerns. With raising obesity comes an increase in morbid diseases
including heart disease, diabetes and cancer – all of which are already overrepresented among Latino com-
munities and cause early death.
Obesity is also connected to our ongoing state and federal fiscal concerns. Each of us who work to balance
a budget each year know first-hand the concerns over ballooning health care costs, and the concerns that
these costs will contribute to unmanageable debt and deficits well into the future. And so, our investments
of resources today can have dramatic impact on the future of our governments and our communities.
It is my hope that this paper and its accompanying documents open, or reopen conversations about the
urgency in tackling Hispanic obesity to make America stronger. If we all commit to raising awareness of this
issue, and including this concern in our policy making, we will undoubtedly be successful in making our
communities healthier and more productive for the future.
Special thanks to Elizabeth Burgos, NHCSL’s Executive Director and Jason Llorenz, Esq. for your
leadership in developing this policy brief.
In partnership,
Senator Iris Y. Martinez

HispanicObesity:an american
crisis
4
HispanicObesity:an american
crisis
5
FrOm senatOr LUz arce Ferrer (pr)Chair, NHCSL Health Taskforce
Dear Colleagues:
As Chair of NHCSL’s health taskforce, I call upon my colleagues in state legislatures
and others who will read this brief, to take up action, and reignite our commitment
to address the Latino obesity crisis. Among all the challenges our communities face,
obesity is both personally devastating, and an indicator of reduced quality of life.
For Latinos, who suffer morbid obesity at alarming rates, along with so many of the
related diseases – quality of life has been lessened along with productivity. This crisis
must be addressed for the sake of our continued progress.
This policy brief presents the beginnings of a roadmap of recommendations from NHCSL’s legislators,
who, working together at our obesity summit in April of 2010, identified opportunities for policies and
programs that can help to engage our communities in this issue, provide resources when lacking, and raise
awareness of the crisis in order to take action.
Our paper is not intended to be treated as a static research dissertation. It is a call to action. This may
include working with families in your district to use local resources, or passing laws that mirror the recom-
mendations contained here.
May we all have success in battling this crisis, so that our communities may continue to grow in social, eco-
nomic and civic influence.
With regards,
Senator Luz Arce Ferrer (PR)
NATIONAL HISPANIC CAUCUS OF STATE LEGISLATORS
(NHCSL)
Senator Iris Y. Martinez, President, NHCSL
Elizabeth Burgos, Executive Director, NHCSL
Jason Llorenz, Sr. Policy Advisor, NHCSL
Prepared by
Ms. Carissa Faña, MPA

HispanicObesity:an american
crisis
6
HispanicObesity:an american
crisis
7
tabLe of cOntents
NHCSL Executive Committee 2Letter from Senator Iris. Y. Martinez 3Letter from Senator Luz Arce Ferrer 4Introduction 8bacKGrOUnd 8
The Latino Obesity Crisis 10Obesity-Related Health Disparities in the Latino Population 12diabetes 13HypertensiOn 14OtHer HeaLtH risKs 14
Obesity’s Cost 15ecOnOmic impact OF Obesity in tHe LatinOcOmmUnity 15FinanciaL bUrden 17bUrden tO states 20
Barriers and Challenges for Latinos 22scHOOL nUtritiOn and edUcatiOn 23access tO parKs and Green space 23access tO HeaLtH care 25
Intervention Strategies 27teXas 27mississippi 28LeGisLatOrs recOmmendatiOns 30
Conclusion 31Appendix 32References 40
The National Hispanic Caucus of State Legislators (NHCSL) is the preeminent organization representing the interests of 300 Hispanic state legislators from all states, commonwealths, and territories of the United States. Founded in 1989 as a nonpartisan, nonprofit 501(c)3, NHCSL is a catalyst and advocate for joint action on issues of common concern, such as health, education, immigration, homeownership and economic development to all segments of the Hispanic community. NHCSL also works to design and implement policies and procedures that will impact the quality of life for Hispanic communities; serves as a forum for information exchange and member networking; an institute for leadership training; a liaison with sister U.S. Hispanic organizations; a promoter of public/private partnerships with business and labor; and a partner with Hispanic state and provincial legislators and their associations representing Central and South America.
444 North Capitol Street, NW
Suite 404
Washington, DC 20001
Tel: 202-434-8070
Fax: 202-434-8072
www.nhcsl.org
Copyright: © 2010 The National Hispanic Caucus of State Legislators

intrOdUctiOn
Obesity1 is a national epidemic with wide consequences and cost to America’s health and productivity. In
2003, Surgeon General Richard Carmona described the nation’s obesity epidemic as a national crisis.2
More recently, the Center for Disease Control and Prevention (CDC) found that in 2009, two-thirds of
adults and nearly one in three children were overweight or obese.3 For Latino communities, the obesity
epidemic has reached crisis, with many states and communities reporting Latino obesity at staggering
proportions, with Latino children becoming obese earlier in their lives.
In this policy brief, we focus on the obesity crisis afflicting the U.S. Latino population. The first section
compares trends of obesity rates in the U.S. for Latino adults and children. The second section delves into
the health consequences of obesity and health-related disparities within the Latino community. The third
section identifies health care costs attributed to obesity and their impact on Latinos and states. The fourth
section outlines the barriers and challenges for Latinos struggling with obesity. Finally, the fifth section
presents two states (Texas and Mississippi) as state models that have proposed legislation (1) mandating the
coverage of obesity treatments for state employees, and (2) promoting educational nutrition programs for
their respective Latino populations.
Much of the available federal government data focuses on the Mexican-American population as a subgroup
within the Latino community. Unless otherwise noted, obesity rates observed in Hispanics of Mexican
origin are assumed to be comparable to rates observed in the general Latino population. While the data can
be used to interpret and denote trends in the Latino community, it may not always reflect the entire U.S.
Latino population or specific regional or geographic sub-populations.
BackgroundLatinos are projected to represent 24.4% of the total U.S. population by 2050, representing nearly half
the size of the projected non-Hispanic white population.4 Some states traditionally have higher Latino
populations (e.g., California, Texas, New York, Florida, and Illinois); however, states with fewer Latino
residents, such as North Carolina, Arkansas, and Georgia, have experienced substantial increases in the
Hispanic population percentage within the last decade.5
Over a 30-year period, the percentage of the population who are overweight or obese has grown
substantially (see Tables 1 and 2).6 The obesity epidemic is affecting millions of Americans (including
Latinos) and contributing to increasing health care costs.
1 U.S. Department of Health and Human Services defines obesity as an excess body fat for an individual having a body mass index (BMI) of 30 kg or greater. Overweight is defined as a BMI of greater than or equal to 25 kilograms/m2.
2 U.S. Department of Health and Human Services. The Obesity Crisis in America. Prepared testimony before the Subcommittee on Education Reform Committee on Education and the Workforce United States House of Representatives: U.S. Department of Health and Human Services, Office of the Surgeon General, July 2003. Retrieved March 15, 2010, from http://www.surgeongeneral.gov/news/testimony/obesity07162003.htm
3 U.S. Department of Health and Human Services. The Surgeon General’s Vision for a Healthy and Fit Nation. Rockville, MD: U.S. Department of Health and Hu-man Services, Office of the Surgeon General, January 2010. Retrieved March 15, 2010, from http://www.surgeongeneral.gov.
4 U.S. Census Bureau. U.S. Projections by Age, Sex, Race, and Hispanic Origin. Washington, DC: U.S. Census; 2004.
5 U.S. Census Bureau. The Hispanic Population: Census 2000 Brief. Washington, DC: U.S. Census; 2001.
6 U.S. Centers for Disease Control and Prevention, National Center for Health Statistics. Health, United States, 2003. Atlanta, GA: U.S. Department of Health and Human Services, 2003. 4 Center on Budget and Policy Priorities. “The Long-Term Fiscal Outlook is Bleak: Restoring Fiscal Sustainability Will Require Major
After African-Americans, Latinos have the second highest obesity prevalence among adults (HHS, 2009).
States need to proactively reduce obesity rates for the nation’s largest and fastest growing ethnic minority.
Only one-sixth of the Latino population is 55 and above.7 Half of the population is between the ages of 18
and 54 years of age,8 and one-third is under the age of 18.9 Increasing rates of obesity in Latino children
suggest that, unless policy-makers take action, the subsequent generation will be less healthy as it ages,
affecting, among other things, health care costs.
Changes to Programs, Revenues, and the Nation’s Health Care System.” http://www.cbpp.org/cms/index.cfm (accessed March 16, 2010).
7 U.S. Census Bureau. 2006-2008 American Community Survey 3-year Estimate, Selected Population Profiles.
8 U.S. Census Bureau. 2006-2008 American Community Survey 3-year Estimate, Selected Population Profiles.
9 U.S. Census Bureau. 2006-2008 American Community Survey 3-year Estimate, Selected Population Profiles.
HispanicObesity:an american
crisis
98

tHe LatinO Obesity crisis
According to the U.S. Census, as of July 1, 2008, an estimated 47 million Hispanics represent 15% of the
U.S. population, including Puerto Rico.10 In stark contrast to the non-Hispanic white population, Latinos
are experiencing an increase in obesity prevalence. As reported by the Department of Health and Human
Service’s Office of Minority Health, in 2007, Latinos were 1.1 times more likely to be obese than non-
Hispanic whites. In 2003-2006, Mexican-American women were 30% more likely to be overweight than
non-Hispanic white women (USHHS). According to the U.S. Census 67% of Hispanics have a high school
degree or less schooling and earn an annual per capita income of $15,916.
In comparing overweight rates, which include obesity rates, Latinos surpassed the general population by ten
percentage points (see Tables 1 and 2). In comparison to the general female population (61.2%), Mexican-
American women (73%) have a greater overweight or obese percentage (see Table 1). The National Center
for Health Statistic’s National Health and Nutrition Examination Survey (NHANES) found that grouped
datasets of 20- to 74-year-olds in 1976-1980 and 2003-2006 increased from 47% to 67% for the general
population and from 61% to 75% for Latinos (see Table 1). During this thirty-year trend period, obesity and
10 U.S. Census Bureau, Facts for Feature: Hispanic Heritage Month Sept 15-Oct 15 http://www.census.gov/PressRelease/www/releases/archives/facts_for_features_special_editions/013984.html
overweight rates for Latino males and females increased equally, compared to the general population (males
and females of all races).
The CDC reported Latinos as the minority group with the second-highest obesity prevalence in adults.
Additionally, the Office of Minority Health in 2007, reported adult Latinos 18 years of age and over
to be 1.2 times more likely to be overweight than non-Hispanic whites. (A person is considered to be
overweight if he or she has a body mass index (BMI) of 30% or greater.) This demonstrates Latino adults
to be disproportionately obese and overweight compared to the general population (mainly non-Hispanic
whites).
Childhood and adolescent overweight and obesity rates show sharply increasing trends that surpass rates for
adults (see Table 2). In 2001-2004, the office of Minority Health reported Latino children 6-11 years of
age to be 1.3 times more likely to be overweight than non-Hispanic white children in the same age group.
The NHANES survey also found that the percentage of obese or overweight 6- to 11-year-olds increased
from about 7% to 17% in the general population and from 12% to 24% on average for Latinos.
A more staggering pattern emerges for 12- to 19-year-olds. Over the same time period, the percentage
of overweight adolescents increased from 5% to about 18% in the general population and 8% to 21% on
average for Latinos (see Table 2). Unfortunately, these trends do not appear to be diminishing. This
should be a prioritized concern for legislators, given that obese children and children of obese parents tend
to become obese adults.11,12,13
Preventative measures and nutritional care should start at an early stage to mitigate overweight problems
and other obesity-related health conditions. Studies have shown that babies born to obese mothers, babies
who are not breastfed, and babies who consume excessive calories during their first year are more likely
to become obese and develop chronic diseases later on in life (Dr. Perez-Escamilla). Latinos, more than
other demographics, tend to develop problems with weight early in life.
11 Serdula MK, Ivery D, Coates RJ et al. Do obese children become obese adults? A review of the literature. Prev Med 2003; 22:167-177.
12 Strauss RS, Pollack HA. Epidemic increase in childhood overweight, 1986-1998. JAMA, 2001; 286:2845-2848
13 Ogden CL, Flegal KM et al. Prevalence and trends in overweight among U.S. children and adolescents, 1999-2000. JAMA, 2002; 288:1728-1732.
HispanicObesity:an american
crisis
1110

isolation, sedentary life styles and physical inactivity. In addition, they have a shorter life expectancy, living
only until 53 years of age on average.20
Studies have shown that Latinos often have conflicting attitudes toward seeking mental health services, and
many feel stigmatized for doing so (APA). According to the American Psychiatric Association, Latinos use
mental-health services far less than other ethnic and racial groups.
Hispanic youth are at a higher risk for poor mental health than white youth. They have higher rates of
depressive, anxiety, suicidal ideation and suicide attempts (USHHS-SAMHSA). This could correlate
with high levels of depression, feelings of shame and low self-esteem, symptoms that often afflict obese
individuals.
DiabetesMore than 200,000 people each year die from diabetes-related complications.21 Over 17 million
Americans have diabetes; 90% of these have type 2 diabetes, which is associated with obesity and physical
inactivity.22
Approximately 8% of U.S. adults have type 2 diabetes, a disease that increases the risk for cardiovascular
disease, stroke, kidney disease, blindness, and lower limb amputation, among other problems.23 As
of 2006 CDC data, Latinos were 1.5% more likely to die from diabetes than the general population.
NHANES data shows that from 1988-1994 to 2003-2006 the general diabetic population 20 years of age
and older went from 8% to 10.2%, while it increased from 14.2% to 15.7% for Latinos (see Table 4). The
disparity suggests that diabetes is a highly pressing medical issue for the Latino community; it is the fifth
leading cause of death for Latinos.
According to the Obesity Society, type 2 diabetes is usually diagnosed after age 40; however, it is now being
found in all age groups, including children and adolescents.
According to the Surgeon General’s report, Vision for a Healthy and Fit Nation, released in January 2010,
type 2 diabetes in children has increased, particularly for Latino children. More than 75% of children and
adolescents with type 2 diabetes are obese. This is of particular concern given that childhood obesity has
increased for Latino children.
20 National Association of State Mental Health Program Directors. Obesity and Prevention Strategies for Individuals with Serious Mental Illness, Technical Report 2008.
21 The Obesity Society: The Practical Guide: Identification, Evaluation, and Treatment of Overweight and Obesity in Adult: Retrieved from http://www.obesity.org/information/practicalguide.asp.
22 The Obesity Society: The Practical Guide: Identification, Evaluation, and Treatment of Overweight and Obesity in Adult: Retrieved from http://www.obesity.org/information/practicalguide.asp.
23 U.S. Department of Health and Human Services. The Surgeon General’s Vision for a Healthy and Fit Nation. Rockville, MD: U.S. Department of Health and Hu-man Services, Office of the Surgeon General, January 2010.
Obesity-reLated HeaLtH disparities in tHe LatinO pOpULatiOn
The Office of Minority Health reported that overweight people are more
likely to suffer from high blood pressure and have high levels of blood
fats or bad cholesterol — all risk factors for heart disease and stroke. In
fact, Heart disease is the leading cause of death for Latinos; however,
many Latinos are unaware they are at risk. In 2003, only 27% of Hispanic
females said they knew that heart disease was a major health problem for
women. In comparison, 55% of non-Hispanic white females said they were
aware of the risk.
The CDC reported the top ten causes of death in the Latino community,
many of which are obesity-related diseases.14 Overall life expectancy for
Latinos is declining as a result of obesity and obesity-related health risks
(see Table 3).15,16 Table 3 shows the top ten causes of death in the general
population compared to Latinos; at least half of the contributing factors
of death, both in the general population and for Latinos, can be linked to
obesity.
Common morbidities associated with obesity include coronary heart
disease, hypertension, stroke, diabetes, certain types of cancer (e.g.,
endometrial, breast, and colon)17, as well as other secondary medical effects
(e.g., gallbladder diseases, sleep apnea and respiratory problems).18
In addition to chronic diseases associated with being overweight, mood
instability, depression (or shame), and low self-esteem affect obese
individuals; those factors put additional strain on individuals who are
already suffering from mental illnesses.19 According to the Surgeon
General’s Vision for a Healthy and Fit Nation report, people with mental
health disorders are susceptible to obesity risk factors given their social
14 The Center for Disease Control and Prevention (CDC): Office of Minority Health and Health Disparities (OMHD) accessed from statistics, http://www.cdc.gov/omhd/populations/hl/hl.htm#ten
15 National Heart, Lung, and Blood Institute. Clinical guideline on the identification, evaluation, and treatment of overweight and obesity in adults: the evidence report. Bethesda, MD: U.S. Department of Health and Human Services, National Institutes of Health, National Heart, Lung, and Blood Institute; 1998. Available at http://www.nhlbi.nih.gov/guidelines/obesity/ob_gdlns.htm.
16 U.S. Department of Health and Human Services. The Surgeon General’s call to action to prevent and decrease obesity. Rockville, MD: U.S. Department of Health and Human Services, U.S. Public Health Service, Office of the Surgeon General; 2001. Available at http://www.surgeongeneral.gov/topics/obesity/calltoaction/Callto-Action.pdf
17 The Center for Disease Control and Prevention (CDC): Overweight and Obesity Health Consequences, retrieved from http://www.cdc.gov/obesity/causes/health.html
18 The Center for Disease Control and Prevention (CDC): Overweight and Obesity Health Consequences, retrieved from http://www.cdc.gov/obesity/causes/health.html
19 U.S. Department of Health and Human Services. The Surgeon General’s Vision for a Healthy and Fit Nation. Rockville, MD: U.S. Department of Health and Hu-man Services, Office of the Surgeon General, January 2010.
HispanicObesity:an american
crisis
1312

HypertensionOne of the most critical contributing factors to heart disease is hypertension (or high blood pressure),
which can be related to obesity. Hypertension, a health risk factor for heart disease and stroke, can lead to
premature death and disability from cardiovascular complications.24
According to the CDC, hypertension awareness among Latinos is critically low. As a result, Latinos are
less likely than non-Hispanic whites to effectively manage their hypertension and pursue preventive
care. Latino females, particularly, have high levels of hypertension and are more likely to have heart
complications as a result.
Other Health Factors According to the Surgeon General’s Vision for a Healthy and Fit Nation report, stress also contributes
to excessive weight and obesity. Stress adversely affects blood pressure and cholesterol levels and may lead
people to increase their caloric intake, while limiting physical activity.
Obesity is a known risk factor for the development and progression of osteoarthritis of the knee and other
joints. Obese adults are up to four times more likely to develop osteoarthritis of the knee than adults
with normal BMIs.25 According to a Trust for America’s Health report, an estimated 24.2% of kidney
disease cases among men and 33.9% among women are related to obesity or being overweight.26 In the
same report, approximately 20% of cancer cases in women and 15% of cancer cases in men were linked to
obesity.
Latinos have increased rates of obesity-related conditions, especially diabetes, hypertension and heart
diseases. These obesity-related health complications are also leading causes of death for Latinos. Also, the
lack of access to health care, preventative care, and treatment could be detrimental to addressing obesity-
related health disparities in the Latino community.
24 The Center for Disease and Prevention Control (CDC). Hypertension –Related Mortality Among Hispanic Subpopulations U.S. 1995-2002. MMWR 2006 55/177-180.
25 Felson, D.T., and Y. Zhang. “An Update on the Epidemiology of Knee and Hip Osteoarthritis with a View to Prevention.” Arthritis and Rheumatism 41, no. 8 (1998):1343–1355.
26 F as in Fat 2009 report, issued by the non-profit Trust for America’s Health in partnership with the Robert Wood Johnson Foundation.
Obesity’s cOst
Economic Impact of Obesity in the Latino CommunityObesity and its health-related conditions pose a disproportionate economic burden in health care costs
for many states throughout the country. Additionally, many Latino and American families struggle to
cover their individual and family health care costs. Many of these families can not afford health insurance,
making treatment and access to care unavailable for some of the most pressing obesity-related chronic
diseases impacting Latinos. Many Latino families may lack access to care and treatment, while many states
may be falling behind on methods to provide medical treatments for obesity and educational initiatives to
help reduce obesity rates in this country.
Obesity can negatively affect productivity in the workplace. Obese individuals in poor health can be less
productive at work than other, healthier workers.27 For example, many have argued that high rates of
absenteeism, and other indirect costs for employers, can be attributed to obesity. For example, obese
employees may work in spite of illness. This can increase worker compensation claims, making it more
costly for employers to retain obese workers.28
Some have argued that obesity could limit employment opportunities and may lead to discrimination.29
Reported discrimination based on weight has increased 66% in the past decade, up from about 7% to 12%
of U.S. adults, according to the International Journal of Obesity. Another study reported discrimination
against obese persons to be commonplace in institutional and interpersonal settings — in some cases, it was
more prevalent than rates of discrimination based on gender and race.
27 Pronk, N. P., B. Martinson, R. C. Kessler, A. L. Beck, G. E. Simon, and P. Wang. “The Association between Work Performance, and Physical Activity, Cardio-respiratory Fitness, and Obesity. “Journal of Occupational and Environmental Medicine” 46, no. 1 (2004): 19-25.
28 Trogdon, J.G., E.A. Finkelstein, T. Hylands, P.S. Dellea, and S.J. Kamal-Bahl. “Indirect Costs of Obesity: A Review of the Current Literature.” Obesity Reviews 9, no. 5(2008):489-500.
29 Puhl R, Brownell KD. (2001). Bias, discrimination, and obesity.Obesity Research, 9:788-805.
HispanicObesity:an american
crisis
1514

While studies have shown that obesity is costly for states (e.g., health care costs), it could also be costing
already-struggling American families. Individuals without health insurance, for example, must pay out of
pocket for health care. Employers in the private and government sectors are incurring increased expenses
from increasing obesity-related care.
New research suggests that obesity care is twice as costly as previously estimated.30 In 2009, federal health
officials estimated that obesity-related health care costs reached 9% of total medical costs. However, in
October 2010, the National Bureau of Economic Research estimated that 17% of national medical costs can
be attributed to obesity.
Many industries are improving their human resources policies to assist overweight individuals. This
includes developing workplace programs that help to promote behavior change and increase employee
morale and safety, while assisting with the interaction of co-workers
in the workplace. The CDC and the National Institutes of Health
(NIH) released several guidelines and proposed strategies to control
and prevent weight gain in the workplace in order to motivate and
sustain efforts of workers to prevent weight gain and promote weight
control.
Obesity has also affected our nation’s military forces, limiting the
pool of qualified military recruits. About 75% of the country’s 17-
to 24-year-olds are ineligible for military service; nearly half of that
number is ineligible because of medical or physical conditions, such
as obesity, asthma, or diabetes (Department of Defense). Obesity
alone seems to be a major and more frequent reason for enlistment
ineligibility. One study estimates that between 25% and 35% of
young males would not meet the weight requirements for at least one
of the services (Asch et al., 2009), a percentage that is likely to grow
given rising obesity rates among American adolescents (CDC).
Latinos are underrepresented in our nation’s military services. As of
2001, 9.5% of enlisted service members were Latinos compared to
62% who were non-Hispanic whites. According to a study supported
by the U.S. Army Research Institute for the Behavioral and Social Sciences, Latino enlistments are highest
in the Marine Corps at 15%, while only 6% of Latinos were enlisted in the Air Force, with rising trends in
the Navy (Wechler Segal & R. Segal).
30 John Cawley and Chad Meyerhoefer, The Medical Care Costs of Obesity: An Instrumental Variables Approach, National Bureau of Economic Research, Working Paper No. 16467, October 2010.
Obesity could also be costly for the military (e.g., fitness trainings and promoting educational initiatives
for recruitment practices). Some active members in the military are obese, as reported by the Defense
Department. The Navy estimates that 62% of its members are overweight and 17% are obese, while the U.S.
Air Force reports 55% of airmen are overweight and nearly 12% are obese. Service members who exceed
height-weight guidelines for their branch of the military are often discharged.
As of 1995, the Defense Department reported an estimated average cost of recruiting and training a
replacement enlisted member to be $40,283, or $56,782 in 2008 inflation-adjusted dollars. This costs
the Department of Defense between $170 million and $284 million a year and does not include additional
obesity-related medical expenses.31
The rise in obesity rates also raises health care costs, a burden bore by employers, individuals, and the
military service. The obesity crisis in America must be addressed from a national perspective in order to
influence health care coverage statewide. Moving forward, preventative policies will require increases in
state budgets and legislative mandates to promote initiatives to cover health care costs for obesity and its
health-related conditions.
Financial Burden Obesity and its complications burden health care at the state and federal levels. According to a 2002 study,
obesity is more costly to America’s health care than smoking and drinking. Overweight people spend
36% more on health care services and on medication 77% in comparison to a 21% and 28% increase in
health care spending relating medication costs for current smokers and smaller health effects for problem
drinkers.32 Overweight and obesity national expenditures accounted for 9.1% (or $78.5 billion) of the
total annual U.S. medical expenditures in 1998. Estimates projected 92.6% billion dollars for 2002.33
Approximately half of these costs were paid by Medicaid and Medicare on health-related obese and
overweight conditions.
According to Finkelstein, Fiebelkorn and Wang, in the study measuring obesity expenditures across states,
roughly one-half of these costs are financed by Medicare and Medicaid. In comparison, the study found
that obesity prevalence among Medicare recipients and the percentage in Medicare costs related to obesity
are similar to the expenditures of the private insured population versus Medicaid recipients who reported
a 50% higher than that for the general population in treatment care obesity related among adults. This
demonstrates that Medicaid enrolls a greater percentage of overweight people and incurs higher costs when
compared to Medicare recipients.
Medicare and Medicaid are administered by the Centers for Medicare and Medicaid Services (CMS),
a component of the Department of Health and Human Services (HHS). Medicaid provides health care
insurance to qualified individuals who are low income families and children. Medicare provides health
31 U.S. Department of Defense PharmacoEconomic Center. “Pharmacoeconomic Analysis of Obesity Treatment.” PEC Update 97, no. 5 (1997): 1-17. Accessed from http://www.pec.ha.osd.mil/Updates/97%20PDFs/97-
32 Journal Study on Health affairs: Health Affairs, published by Project HOPE, is a bimonthly journal devoted to publishing the leading edge in health policy thought and research
33 Finkelstein, Erica, Fiebelkorn Ian C, & Wang Guijing. National Medical Spending Attributable to Overweight and Obesity: How Much and Who’s Paying?
HispanicObesity:an american
crisis
1716

insurance coverage to elderly citizens sixty five of age and disabled Americans who qualify by a meeting
criteria set by the social security administration.34 The percentage of people with Medicaid coverage (13.2
percent) and the percentage of people covered by Medicare (13.8 percent) were higher in 2007 than in
2006—12.9% and 13.6%, respectively. The number of people insured by Medicaid and Medicare also
increased—to 39.6 million by Medicaid and 41.4 million by Medicare.35
According to CMS roadmap overview on health insurance, nearly 90 million Americans rely on health care
benefits through Medicare, Medicaid, and the State Children’s Health Insurance Program (SCHIP). CMS
reported that health care today represents one-seventh of the economy with spending totaling more than $2
trillion annually. By 2017, the nation is expected to spend roughly $4 trillion on health care: 21% of gross
domestic product while Medicare and Medicaid costs continue to skyrocket including covering for obesity
health-related conditions.
The estimated projections for health care costs attributable to obesity and overweight adults are predicted
to more than double every decade. By 2030 health care costs attributable to obesity and overweight could
range from $860 billion to $956 billion, which would account for 15.8% to 17.6% of total health care
costs or one in every six dollars.36 Additionally, a 2008 study reported that obese employees cost private
employers approximately $45 billion a year as a result of medical expenses and excessive absenteeism.37
Although these projections measure health care
expenditures nationally, the data do not take into
account the uninsured population who lack adequate
access to health care. This highly impacts the Latino
population. According to CDC data people of
Mexican origin are more likely than those in other
racial or ethnic groups to be uninsured for more
than 12 months. As of 2005, the CDC reported
data on health care expenditures where it found that
Latinos spend an average of $2,200 per person in
health care costs and prescription medicines. In
comparison, the general population spends $4,082
double that amount close to (84.7%) in health care
costs. This demonstrates the lack of health care
coverage and medical treatment among Latinos,
therefore, prolonging un-treated obesity health risk
conditions.
34 U.S. Census. Income, Poverty, and Health Insurance Coverage in the United States 2007. Accessed from http://www.census.gov/prod/2008pubs/p60-235.pdf
35 U.S. Census. Income, Poverty, and Health Insurance Coverage in the United States 2007. Accessed from http://www.census.gov/prod/2008pubs/p60-235.pdf
36 Wang, Y., M.A. Beydoun, L. Liang, B. Caballero, and S.K. Kumanyika. “Will All Americans Become Overweight or Obese? Estimating the Progression and Cost of the U.S. Obesity Epidemic.” Obesity 16, no. 10 (2008): 2323-2330.
37 Rosen, B. and L. Barrington. Weights & Measures: What Employers Should Know about Obesity. New York, NY: The Conference Board, April 2008.
Additionally, there is a strong correlation with the uninsured population and the undocumented
immigrant population in this country. Latinos comprised a large segment of the undocumented immigrant
population. According to the U.S. Census data as of 2007, the number of uninsured Hispanics was close
to 14.8 million a (32%) in comparison to the uninsured non-Hispanic whites of 10.4% close to 20.5
million. Additionally, poverty levels below the federal income of 100% among Latinos also increased
from 20.6% in 2006 to 21.5% in 2007 in comparison to the non-Hispanic whites of 8.2%. As more data
and information become available regarding Latino subgroups there could be differences in the lack of
insurance coverage and the type of coverage among Latino subgroups. For example, Mexican Americans
had by far the highest percentage (37.6%) of individuals without health insurance which may contrast to
Puerto Ricans (20.4%) and Cuban Americans (23%) in the U.S. (Office of Minority Health, HHS 2004).
Given the correlation among Latinos and the undocumented immigrant population residing in the U.S.
one could presumed that Latinos do not have health insurance or lack treatment care because they often
work in agricultural labor, construction, domestic service, and other industries, that generally do not
provide health insurance coverage. Others may work for small firms without unions or consider to be
employed on a part-time basis without health care coverage benefits. The lack of access and affordable
medical treatment may also correlates with the high levels of obesity health-related risks among Latinos
such as diabetes, hypertension, and heart diseases.
HispanicObesity:an american
crisis
1918

The Burden To StatesStates bear a great deal of the financial burden of care for overweight and obese people. A study conducted
in 2004 by Finkelstein, Fiebelkorn, and Wang estimated states-level expenditures attributable to obesity
based on the Behavioral Risk Factor Surveillance System (BRFSS). The BRFSS, a state representative
telephone survey of the adult population, tracked health risks in the U.S. from 1998 to 2000. The
dramatic increase in obesity prevalence over the past three decades has been evidenced throughout the data
presented the high rates of obesity, its health-related risks and the greater predisposition among Latinos
when comparing to the general population. High levels of obesity prevalence lead to increases in the cost
of treating obesity-related diseases. The Centers for Disease Control (CDC) found obesity-related costs
ranging from about $87 million (Wyoming) to $7.7 billion (California). Obesity-attributable Medicare
costs ranged from $15 million (Wyoming)
to $1.7 billion (California), and obesity-
attributable Medicaid expenditures ranged
from $23 million (Wyoming) to $3.5 billion
(New York). The differences in obesity-
attributable expenditures among states are
partly driven by the differences in the size of
each state’s population.38
However, the CDC’s 2006-2008 (BRFSS)
survey found regional variances in the obesity
rates of Latino adults across the country.
Among Hispanic adults in 50 states and DC,
the prevalence of obesity ranged from 21.0%
to 36.7%, and was greater or equal to 30% in
11 states.39 With the exception of Texas (32%)
and Illinois (31%), the states with the highest
adult Latino obesity rates do not necessarily
correlate with states having the highest Latino
population.
According to the CDC, in 2008, five states with large concentration of Latinos had obesity rates of 27% or
higher, including Texas, Nevada, Illinois, Arizona, and Pennsylvania.40 Five Midwestern states (Oklahoma,
North Dakota, Kansas, Michigan, and Illinois), two Southern states (Texas, Tennessee), two Northeastern
states (Pennsylvania, New Hampshire), and Alaska have lagged behind in meeting the needs of their
respective Latino populations when it comes to reducing adult obesity. In light of these statistics, Texas has
38 U.S. Department of Health and Human Services. The Surgeon General’s call to action to prevent and decrease overweight and obesity. [Rockville, MD]: U.S. Depart-ment of Health and Human Services, Public Health Service, Office of the Surgeon General; [2001]. Available from: U.S. GPO, Washington.
39 The Center for Disease Control and Prevention (CDC): Differences in Prevalence of Obesity among Black, White, and Hispanic Adults — U.S. 2006-2008. Re-trieved from http://www.cdc.gov/feature/dsobesityadults.
40 The Center for Disease Control and Prevention (CDC): U.S. Obesity Trends by State 1985-2008. Retrieved from http://www/cdc/gov/obesity/data/trends.html
taken a pro-active approach in reducing the obesity rates among the adult Latino population (see section
on Texas’s Case study).
According to the U.S. Census, as of 2000, the states with the largest Latino populations were California,
Texas, New York, Florida, Illinois, Arizona, New Jersey, New Mexico, Colorado, and Washington. Latinos
in California accounted for 11.0 million persons (31%) of the U.S. Hispanic population, while Texas had
6.7 million (19%). Half of the Latino population lived in California and Texas (U.S. Census 2000). The
top 5 states with the highest Latino population — California, Texas, New York, Florida and Illinois —
accounted for 70% of the Latino population living in the United States. Latinos in New Mexico were 42%
of the total state population, the highest proportion for any state.
states spendinG On Obesity-reLated care
(in tHOUsands), FOr tHe tOp ten Hispanic states
california $7,675
texas $5,340
new york $6,080
Florida $3,987
illinois $3,439
arizona $752
new Jersey $2,342
new mexico $324
colorado $874
washington $1330
The 2010 census will capture a more diverse, more widespread Latino population across the states. The
estimates of adult obesity among Latinos in the top five states with dense Latino populations ranged. from
26.0% in Florida to 32% in Texas, the other states include California with a 29%, New York with a 27%, and
Illinois with a 30% obesity prevalence among Latino adults (See Table 7). States spending on obesity-related
care (in thousands), for the top ten Hispanic states were CA ($7,675), TX ($5,340), NY ($6,080), FL
($3,987), IL ($3,439), AZ ($752), NJ ($2,342), NM ($324), CO ($874), and WA ($1330) (See Table 7).
The financial burdens of obesity and its health-related conditions throughout the states should be of
great concern given the fact that local governments and ultimately tax payers continue to be responsible
for financing obesity and overweight-related medical costs. This analysis underlines the need for local
government intervention policies to reduce and control obesity increasing rates.
HispanicObesity:an american
crisis
2120

barriers and cHaLLenGes FOr LatinOs
Latinos and their children have been particularly impacted by the growing prevalence of obesity and
overweight problems. According to the Surgeon General’s Vision for a Healthy and Fit Nation report, the
growth in obesity is the result of many environmental factors and lifestyles. A poor diet, the lack of physical
activity and eating habits can also play a role in causing people to be overweight. According to the American
Obesity Association, cultural factors related to dietary choices, physical activity, and acceptance of excess
weight in racial-ethnic groups interfere with weight loss efforts. Latinos could have a different approach to
a variety of foods and perceived weight levels differently. Like all ethnic groups, Latinos are influenced by
environmental and cultural factors that drive eating habits and physical activity.
Several studies have demonstrated that due to economic constrains, Latinos, tend to settle in low income
areas, which are often saturated with fast food restaurants, mini-markets, or small grocery stores known as
“bodegas.” According to the U.S. Census, 11 million Latinos live below the poverty level41 — nearly 23.2%
as compared to 8.2% of non-Hispanic whites.42 Based on these statistics, there is a strong correlation with
obesity rates and socioeconomic status — being poor also correlates to greater rates of obesity (CDC).
According to the CDC, obesity rates tend to follow a socioeconomic slope and have a greater effect on
racial-ethnic minorities and the poor. Food “deserts” or environments where access to healthy food is
more limited contribute to poor diets and an elevated prevalence of obesity and other health-related
conditions among Latinos. This is why it is much more difficult for many families, especially Latinos who
live in many low income neighborhoods who have limited access to supermarkets, safe parks, and affordable
fresh foods, to be physically fit and healthy.
According to a report issued by the non-profit Trust for America’s Health in partnership with the Robert
Wood Johnson foundation the economic downturn, will have a greater impact on the health of Americans
41 U.S. Census. Income, Poverty, and Health Insurance Coverage in the U.S. 2008. Accessed from http://www.census.gov/prod/2009pubs/p60-236.pdf. Office of Management Budget (OMB) determined the official definition of poverty in Statistical Policy Directive 14. U.S. Census 2008.
42 U.S. Census. Income, Poverty, and Health Insurance Coverage in the U.S. 2008. Accessed from http://www.census.gov/prod/2009pubs/p60-236.pdf.
as it relates to obesity rates. The same report stated that as food prices rises many Latino and working
families “may be hard pressed to buy fresh fruits and vegetables. Instead, they will look to the cheapest
foods, which aren’t necessarily the healthiest”.43 Meanwhile the U.S. Department of Agriculture reported
that prices for what it calls “food at home,” a category that includes purchases at grocery stores, convenience
stores and farmers’ markets, will rise 2% to 3% this year. Last year, prices for food at home rose 6.4%, the
highest jump in nearly two decades.44 Food prices and access to affordable produces becomes a problem
for Latinos who are low income and who are struggling to make ends meet with their families when putting
food on the table.
Access to Parks and Green SpaceIn addition, many Latinos living in low-income neighborhoods have less safe parks and recreational
areas where their children can play and exercise. Studies have shown that sprawling communities were
likely to walk less, weigh more, and have higher rates of hypertension than residents of more compact
communities.45 Improving access to playgrounds, parks, and green spaces, especially in low-income
neighborhoods, could help reduce obesity rates among children. In addition to limiting time to children’s
indoor activities such as watching television and playing video games.
School Nutrition and Physical EducationIn order to reduce obesity rates among children, state legislators can identify school nutritional programs
and physical education activities. Schools can play a critical role in reducing childhood obesity by
promoting better nutrition, access to physical activity, and educational health programs.
For example, the National School Lunch program is a federally assisted meal program providing low-cost
or free meals to schools across the country. Approximately 31.2 million children (101,000 schools and
residential child care institutions) participated in the program in 2008-2009. The data from two national
surveys, the Survey of Income and Program Participation (SIPP) and the National Health and Nutrition
Examination Survey (NHANES), reported that 21% of participants were Latino; 55.2% of participants
included white, African-American, and Asian students. Latino children had the highest percentage of
participation in school lunch programs.46 The same report found that whites and Asians were less likely to
participate in the school lunch program.
The School Breakfast program is offered in 78% of the schools that offer the lunch program (USDA,
2006). Both programs must meet federal nutrition standards and are federally subsidized.
Many advocates have argued that some schools are not meeting federal nutrition guidelines. According
to a study published by the Future of Children, in collaboration with Princeton University and the
43 Foreman, C.T. Remarks made as moderator of the panel “Changing the Food Environment,” part of the Transatlantic Public Policy Approaches to Tackling Obesity and Diet-Related Disease conference held in Washington, D.C. on April 8, 2008. C.T. Foreman, is the Director of Consumer Federation of America.
44 U.S. Department of Agriculture, Economic Research Service: Food CPI and Expenditures, accessed from http://www.ers.usda.gov/Briefing/CPIFoodAndExpendi-tures/
45 Trust for America’s Health and the Robert Wood Johnson Foundation, “F as in Fat 2009: How Obesity Policies Are Failing America” available at (www.healthyameri-cans.org) March 17,2010.
46 U.S. Department of Agriculture (USDA). “Profiles of Participants in the National School Lunch Program” Data from two National Surveys. (August 2006, USDA Economic Research Service Report).
HispanicObesity:an american
crisis
2322

Brookings Institute, highlighted the role of schools in
obesity prevalence. The study found that school lunches
and breakfasts have had to meet the requirements set in the
dietary guidelines for Americans which include limits on
total and saturated fat. As of late 1990s 75% of schools did
not meet the USDA’s nutrition guidelines.
The report also stated that over the past 15 years,
nutritional standards have improved in some schools;
however, there are still gaps in making school meals healthy
to reduce childhood obesity. Additionally, unhealthy food
choices or competitive foods high in fats and sugars offered
to students are also a deterrent for their proper nutrition
in schools. These foods do no meet federal regulated meals
mandates. As a result, many states like Arizona, California,
New Mexico, and Texas mandated nutritional standards for
competitive foods.
Some school districts have taken action by restricting
competitive foods beyond federal and state regulations. For
example, as of 2003, New York City schools have removed
soda vending machines from school grounds, opting to sell
only water, low-fat snacks, and 100% fruit juices.47 In Los
Angeles, a soda vending ban was passed; in Chicago, public
schools announced a plan in 2004 to ban soft drinks, candy
and high fat snacks (Story et al., 2006).
In order to make schools more proactive in reducing childhood obesity, states could encourage their local
school districts to reform nutrition standards for competitive foods and provide healthier food choices
for students. Other approaches could be to improve and broaden school meal menus to make them more
appealing to children. Additionally, schools could lower costs schools while promoting nutritious foods
for students by limiting access to competitive foods and creating partnerships with fresh produce vendors
that distribute healthy foods and beverages. Other alternatives could be reducing the fat content in school
lunches and breakfasts, while making fruits and vegetables more affordable in the school vending machines
and cafeterias.
In recent years, studies have shown that physical education (PE) requirements diminish with student grade
levels. According to one report The Role of Schools in Obesity Prevention, schools requiring PE activity
also dropped 50% for first grade through fifth grade to 25% in grade 8th, to only 5% in grade 12th.
Although high school students enrolled in PE classes and there was an increase from 49% to 56% the share
47 U.S. General Accounting Office, School Meal Programs: Competitive Foods Are Available in Many Schools; Actions Taken to Restrict Them Differ by State and Locality, Report no. GAO-04-673 (2004).
of students attending class daily fell from 42% to 28%
(Story et al., 2006). In 2007, CDC reported that Latino
adults were 50% less likely to engage in active physical
activity as non-Hispanic whites. These findings contribute
to the obesity prevalence among Latinos and overweight
issues facing children in schools.
State PE requirements are often not enforced. A study
released by the Trust for America’s Health examined state
PE activity policies. According to the study, only 27 states
require PE in elementary, middle, and high school (usually
only one half credit or one credit of PE is required for
graduation.)
The lack of PE activity enforcement in some states may be
the result of school budget constraints. Others have argued
that as states develop or select standardized tests, content
that is not subject to testing, such as physical education, are
given lower priority.48
As obesity rates increase, more states are paying close
attention to the importance of PE activity and nutrition
education. Although some states are encouraging rather
than mandating physical activity in schools, states like Texas
are requiring elementary, middle, and junior high school
students to engage in 30 minutes a day or 135 minutes a
week of physical education. Texas has an obesity rate of 32%
among Latino adult, the highest from the top ten states with Latino population. In to alleviate high obesity
prevalence among Latinos, legislators could focus on mandating physical education for all students and
establishing health education within school curriculums.
Access to Health Care Based on our analysis, Latinos continue to have high levels of obesity-related health conditions due to
the lack of preventative care and treatment. Lowering obesity rates for uninsured Latinos is even more
challenging when they lack health care access. The lack of access to physicians, community health clinics,
and specialized hospitals directly contributes to poor health for many Latinos. Because they lack access
to health care, many Latinos suffer from disproportionate rates of preventable diseases and death, as
presented in our analysis. In addition, the lack of health care, access to language interpreters and bilingual
professionals pose barriers for Latinos when seeking appropriate evaluation, and treatment regarding
obesity and its health-related conditions.
48 National Association for Sport and Physical Education, Shape of the Nation: Executive Summary (Reston, Va.: 2001).
HispanicObesity:an american
crisis
2524

interVentiOn strateGies
In response to the high levels of obesity and overweight rates within the U.S. population, a series of
alternatives have emerged to intervene in cases of severe, life-threatening (and costly) obesity. These
alternatives include a combination of sometimes state-supported supported dieting, exercising, physical
fitness, and weight loss programs, as well as surgical procedures.
There are several types of bariatric surgery such as gastric bypass, sleeve gastrectomy and lap-band system
or laparoscopic adjustable gastric banding (LAGB). These surgical procedures are known to achieve weight
loss and lower co-morbidities associated with obesity.
According to the American Society of Metabolic and Bariatric Surgery, gastric bypass surgery reduces
the size of the stomach — the smaller stomach is then attached to the middle of the small intestine, by-
passing the small intestine, which absorbs the most calories. Hence, patients absorb fewer calories and eat
less. The vertical sleeve gastrectomy is a procedure where close to 85% of the stomach is reduced, leaving
a “sleeve-shaped” stomach. Lastly, the lap-band or LAGB uses a silicone band filled with saline that is
wrapped around the upper part of the stomach to create a small pouch and restrict stomach capacity. This
causes patients to eat less and feel full faster.49
These surgical alternatives enable obese individuals to reduce body mass faster, which reduces risk for other
obesity health-related conditions. Although not all overweight people are suitable for weight loss surgery, it
is an alternative that has considerable results.
According to many physicians, surgical procedures that reduce obesity or overweight problems also reduce
obesity-related health conditions. These procedures can lead to long-term cost savings to individuals and
states by reducing the need for preventative care and medicine, among other things. Forty five states cover
49 Fact sheet: Metabolic & bariatric surgery. (n.d.). American Society for Metabolic & Bariatric Surgery. Available from http://www.asmbs.org/Newsite07/media/factsheet1_ bariatric-surgery.pdf
bariatric surgery through Medicaid plans for individuals.50 In particular, two states (Texas and Mississippi)
with high obesity rates have implemented programs to address the obesity epidemic.
According to the American Society for Metabolic and Bariatric Surgery (ASMBS), surgery patients
generally experience their maximum weight loss one to two years after surgery losing 30% to 50% of their
excess weight. Many of the cost savings of the surgery can be seen within the first two years after completing
the procedure. In addition, life expectancy is prolonged to many patients while being in constant
monitoring by their surgeons through after care weight loss treatments.
Models from Texas and MississippiteXas
Obesity prevalence in Texas has been increasing at alarming rates. It is the leading state in obesity rates
among Latinos from the top ten states with the largest Latino population. Texas had an estimated 32% of
obesity prevalence among adult Latinos (CDC). Obesity is also high among Texas children. As recently as
2008, there was an overweight prevalence of 16.2% among low-income pre-school children 2-4 years of
age.51
Texas ranks 14th among states with the highest adult obesity rates at 27.9%.52 In 2007, 66% of adults in
Texas were overweight or obese, and 48% of Texas high school students did not attend physical education
classes.53 Additionally, the costs of obesity and obesity health-related conditions are highly impacting the
state. According to the Texas Comptroller’s Report on obesity from 2007, annual direct costs to the state’s
employers averages over $3.3 billion per year and is projected to be $15.8 billion annually by 2025.
In efforts to prevent this crisis Texas has approved legislation that will give state employees access to
bariatric surgery, a benefit that will be subsidized by the state’s Employee Retirement plan at a cost-neutral
or cost-positive fiscal approach. The Texas state legislature has established an interagency council on
obesity to coordinate, improve, and oversee the state employee pilot program and to implement other
obesity prevention measures.
The council is comprised of several commissioners from state agencies of health, education, and
agriculture. It must provide recommendations on reaching population to increase health awareness and
encourage employees to participate in wellness programs from employers.
The prevalence of obesity in Texas is estimated to increase from the current level of 34.0% obese to 42.4%
obese in 2018 (America’s Health Rankings, 2009). In light of this, Texas Senator Leticia Van De Putte,
has been at the forefront of this issue by moving forward proposals and initiatives to prevent adult and
childhood obesity. She has been a strong advocate and believes that “Obesity management starts with the
50 Trust for America’s Health and the Robert Wood Johnson Foundation, “F as in Fat 2009: How Obesity Policies Are Failing America” available at (www.healthy-americans.org) March 17, 2010.
51 CDC’s Pediatric Nutrition Surveillance System (PedNSS) Data reported from 1998-2008: Obesity Prevalence Among Low-Income, Preschool-Aged Children by states.
52 Trust for America’s Health (TFAH) and the Robert Wood Johnson Foundation (RWJF).
53 CDC States Profiles, data accessed from http://www.cdc.gov/chronicdisease/states/texas.htm#npaao
HispanicObesity:an american
crisis
2726

state legislature and state employees’ wellness. Coverage for bariatric surgery is not the only answer to the
obesity epidemic, however, it is a valuable tool that can be utilized to assist those who are morbidly obese
and have exhausted other methods of controlling their weight such as diet and exercise”.
Texas expanded on Mississippi’s pilot program, which also grants state employees access to bariatric surgery
procedures. Additionally, Texas has authorized legislation to promote educational nutrition and increase
physical education activities in schools.
mississippi
According to the TFAH and the RWJF report, Mississippi has the highest rate of adult obesity in the
nation, at 32.5%. It also has the highest percentage of overweight youths (ages 10-17) at 44.4%, topping
the list for five consecutive years.
Mississippi is also known to be one of the nation’s poorest states. According to the CDC, annual health
care costs attributed to adult obesity in Mississippi are estimated at $757 million, of which $223 million are
Medicare expenditures and $221 million are Medicaid expenditures. A report called Preventing Obesity
with Every Resource (POWER) found that national childhood obesity alone costs Medicaid more than $3
billion annually. According to the report, approximately 8% of private employer medical claims can be
attributed to employees being overweight or obese.
In addition to having the highest obesity rate in the nation, Mississippi also has the highest rate of
premature death. According to the POWER report, the state is at the top of the list for most chronic disease
rankings, including heart disease, hypertension, diabetes, and stroke. It also has high disability rates. As a
result, these striking health effects have a significant impact on the state’s economy.
Mississippi state legislators have been implementing plans and initiatives to address the obesity crisis. In
fall 2009, the CDC released a report recognizing Mississippi as one of the top states regarding school
health policy implementation. Some of Mississippi’s school health policies include minimum requirements
for health and physical education, and removing fryers from school kitchens and replacing them with
combination oven steamers. The state gave local school boards the authority to develop wellness policies
and regulations that address healthy food and beverage choices in schools. These efforts help address
childhood obesity and the role schools play in assisting the state to carry out these initiatives.
Recently, the state legislature passed a law that will give state employees access bariatric surgery through the
State and School Employees Health Insurance Plan. This model was initially designed to address the state’s
alarming rates of obesity and has been a model program for other states.
According to the Mississippi law, in order to be eligible for the program, employees must have a body
mass index (BMI) greater than 35, with two co-morbidities such as diabetes, hypertension, sleep apnea or
asthma. Additionally, employees must be enrolled in the State and School Employees’ Health Insurance
plan for at least one year. Program participants must provide proof of two documented weight loss attempts
(using programs such as Weight Watchers, the Atkins diet, the South Beach diet or Sugar Busters),
confirmed by the patient’s primary practitioner.
Mississippi state representative and chairman of the Public Health Committee, Steve Holland, is setting
an example given that he underwent the bariatric surgery and is currently enrolled in a weight loss training
program. Mississippi is actively seeking preventive measures to address the obesity crisis, and the concept
of providing access to medical procedures (e.g., bariatric surgery) to state employees is one of many viable
options to help reduce weight and increase people’s life expectancy.
HispanicObesity:an american
crisis
28 29

NHCSL LEGISLATOR RECOMMENDATIONSOn April 10, 2010, the National Hispanic Caucus of State Legislators (NHCSL) convened 75 legislators to
address the Latino obesity crisis at its national summit on Hispanic obesity. The summit participants were
organized into a set of working groups to identify recommendations on the following topics:
• Nutrition and Families
• Intervention Strategies, and
• Supporting Active Living
The legislators’ recommendations provide a framework for implementing initiatives to reduce obesity rates.
Key recommendations from the “Nutrition and Families” working group include the following:
• Improve mothers’ access to prenatal care and promote breast feeding to enhance children’s health
• Increase the inclusion of fruits, grains and vegetables to develop a nutritious diet at home
• Address food desserts by making fresh foods, via local farmer markets available through creative tax
credits and other support for local businesses
• Emphasize school roles in addressing obesity prevention: Highlight the importance of exercise
(physical education) and good nutrition in schools
• Encourage parent engagement in educational programs at schools to help obesity prevention
• Encourage recreational activities and exercise in collaboration with community members from the
non-profit sector, corporate and faith-based organizations.
• Promote neighborhood wellness competition among families
• Government agencies could seek mechanisms through human resources policies to promote healthy
environments and foster worker wellness
Key recommendations from the “Intervention Strategies” working group include the following:
• Make medical interventions available for morbidly obese state employees through state insurance programs
• Communicate statistics and data regarding community outreach in our own communities
• Encourage support groups and teams
• Incorporate support for weight loss and health promotion through programs like welfare (TANF) for
weight compliance parameters
• Implement physical education and exercise mandates in schools
• Offer nutrition and wellness clinics for government employees
• Design local public education campaigns to promote nutrition, healthy products, and to foster public awareness
• Create incentives for local schools, towns and private entities to achieve wellness and promote healthy living
Key recommendations from the “Supporting Active Living” working group include the following:
• Encourage active lifestyles in the workplace (e.g., onsite fitness centers and flex-time options for employees)
• Include healthier snacks in vending machines and in business meetings
• Promote green space and parks development in public planning
• Set workplace fitness goals for employees and reward them with compensation time or other incentives
• Promote educational wellness for employees
• Foster recreational and physical activities such as dancing, walking and sports clubs
• Establish family time for fitness activities, and encourage leadership to champion fitness in
communities and the workplace
cOncLUsiOn
The Latino obesity crisis requires immediate attention from all stakeholders: government at the state
and federal level, business leaders, and private and non-profit sectors. Effective solutions will require
collaboration across political parties. At stake are the lives of millions of constituents and the financial
solvency of our state and federal governments. Reducing obesity, particularly for Latinos, will significantly
lower rates of chronic disease and health care costs at the state and federal level. We hope this work provides
a roadmap to the development of initiatives and opportunities that will address the obesity crisis in
communities across the country.
HispanicObesity:an american
crisis
3130

HispanicObesity:an american
crisis
32
HispanicObesity:an american
crisis
33
appendiX:Table 1. Overweight, obesity, and healthy weight among persons 20 years of age and over, by selected characteristics: United States, 1976-1980 and 2003-2006(Data are based on measured height and weight of a sample of the civilian non-institutionalized population)
aGe, seX, and Hispanic OriGin1
OVerweiGHt (incLUdes Obesity)2 Obesity6
20-74 years, age-adjusted4
1976-19803 2003-2006 1976-19803 2003-2006Percent of population
General population (both sexes)5 47.4 66.9 15.1 34.1
male 52.9 72.6 12.8 33.1
Female 42.0 61.2 17.1 35.2
mexican male 61.6 77.3 15.7 30.4
mexican female 61.7 74.4 26.6 42.6
1Persons of Mexican origin may be of any race. Starting with 1999 data, race-specific estimates are
tabulated according to the 1997 Revisions to the Standards for the Classification of
See Appendix II, Hispanic origin; Race.
greater than or equal to 25 kilograms/meter2. See Appendix II, Body mass index.
3Data for Mexicans are for 1982-1984. See Appendix I, National Health and Nutrition Examination
Survey (NHANES).
4Age-adjusted to the 2000 standard population using five age groups: 20-34 years, 35-44 years, 45-54
years, 55-64 years, and 65 years and over (65-74 years for estimates for 20-74 years).
Age-adjusted estimates in this table may differ from other age-adjusted estimates based on the same data
and presented elsewhere if different age groups are used in the adjustment procedure. See Appendix II,
Age adjustment.
5Includes persons of all races and Hispanic origins.
greater than or equal to 30 kilograms/meter2.
nOtes:
Percents do not sum to 100 because the percentage of persons with BMI less than 18.5 kilograms/meter2
is not shown and the percentage of persons with obesity is a subset of the percent with overweight.
sOUrces:
CDC/NCHS, National Health and Nutrition Examination Survey, Hispanic Health and Nutrition
Examination Survey (1982-1984), and National Health Examination Survey (1960-1962).Health,
United States, 2009
Table 2. Overweight among children and adolescents 6-19 years of age, by selected characteristics: United States, 1976-1980 and 2003-2006(Data are based on physical examinations of a sample of the civilian non-institutionalized population)
aGe, seX, Hispanic OriGin1 1976-19802 2003-2006
6-11 years of age Percent of population
both sexes3 6.5 17.0
boys 6.6 18.0
mexican-american 13.3 27.5
Girls 6.4 15.8
mexican-american 9.8 19.7
12-19 years of age
both sexes3 5.0 17.6
boys 4.8 18.2
mexican-american 7.7 22.1
Girls 5.3 16.8
mexican-american 8.8 19.9
1Persons of Mexican origin. Starting with 1999 data, race-specific data are tabulated according to 1997
Standards for Classification of Federal data on Race and Ethnicity and are not strictly comparable with
estimates for earlier years. may be of any race
2Data for Mexicans are for 1982-1984. See Appendix I, National Health and Nutrition Examination
Survey (NHANES).
3Includes persons of all races and Hispanic origins.
nOtes: Overweight is defined as body mass index (BMI) at or above the sex- and age-specific 95th
percentile BMI cutoff. Age is at time of examination at the mobile examination center.
sOUrces: CDC/NCHS, National Health and Nutrition Examination Survey, Hispanic Health and
Nutrition Examination Survey. Health, United States, 2009.

HispanicObesity:an american
crisis
34
HispanicObesity:an american
crisis
35
Table 3. Leading causes of death and numbers of deaths, in population and Hispanic origin: United States, 2006(Data are based on death certificates)
ranK Order aLL persOns Hispanic Or LatinO
Cause of death Deaths Cause of death Deaths
all causes 2,426,264 all causes 133,004
1 diseases of heart 631,636 diseases of heart 28,921
2 malignant neoplasms 559,888 malignant neoplasms 26,633
3 cerebrovascular diseases 137,119 Unintentional injuries 12,052
4chronic lower respiratory
diseases124,583 cerebrovascular diseases 7,005
5 Unintentional injuries 121,599 diabetes mellitus 6,287
6 diabetes mellitus 72,449chronic liver disease and
cirrhosis3,592
7 alzheimer's disease 72,432 Homicide 3,524
8 influenza and pneumonia 56,326chronic lower respiratory
diseases3,310
9nephritis, nephritic syndrome
and nephrosis45,344 influenza and pneumonia 2,966
10 septicemia 34,234certain conditions originating
in the perinatal period2,804
nOtes: For cause of death codes based on the International Classification of Diseases, 9th Revision (ICD-
9) in 1980 and ICD-10 in 2006.
Starting in 2006, the category essential (primary) hypertension and hypertensive renal disease was
changed to essential hypertension and hypertensive renal disease to reflect the addition of secondary
hypertension.
sOUrces: CDC/NCHS, National Vital Statistics System; Vital Statistics National Vital Statistics Reports.
Vol. 57 no. 14. Hyattsville, MD: NCHS. 2009. Health, United States, 2009
Table 4. Diabetes among adults 20 years of age and over, in population and Hispanic origin: United States, 1988-1994 and 2003-2006(Data are based on interviews and physical examinations of a sample of the civilian noninstitutionalized
population)
pOpULatiOn and Hispanic OriGin3
pHysician-diaGnOsed
and UndiaGnOsed
diabetes1,2
pHysician-diaGnOsed
diabetes1
UndiaGnOsed
diabetes2
1988-
1994
2003-
2006
1988-
1994
2003-
2006
1988-
1994
2003-
2006
20 years and over, age-
adjusted4 Percent of population
all persons5 8.3 10.2 5.4 7.7 2.9 2.5
mexican 14.2 15.7 9.7 12.4 4.5 *3.3
*Estimates are considered unreliable. Data preceded by an asterisk have a relative standard error (RSE)
of 20%-30%. Data not shown have an RSE of greater than 30%.
1Physician-diagnosed diabetes was obtained by self-report and excludes women who reported having
diabetes only during pregnancy.
of at least 126 mg/dL and no reported physician diagnosis.
NHANES adjusted the 2005-2006 FBG measurement data to be compatible with earlier data. For more
information, see http://www.cdc.gov/nchs/data/nhanes/nhanes_05_06glu_d.pdf.
3Persons of Mexican origin may be of any race, per Federal classification guidelines.
4Estimates are age-adjusted to the year 2000 standard population using three age groups: 20-39 years,
40-59 years, and 60 years and over. Age-adjusted estimates in this table may differ from other age-
adjusted estimates based on the same data and presented elsewhere if different age groups are used in
the adjustment procedure. '5Includes all other races and Hispanic origins not shown separately. See
Appendix II, Age adjustment.
sOUrces: CDC/NCHS, National Health and Nutrition Examination Survey. Health, United States, 2009
HispanicObesity:an american
crisis
36
HispanicObesity:an american
crisis
37
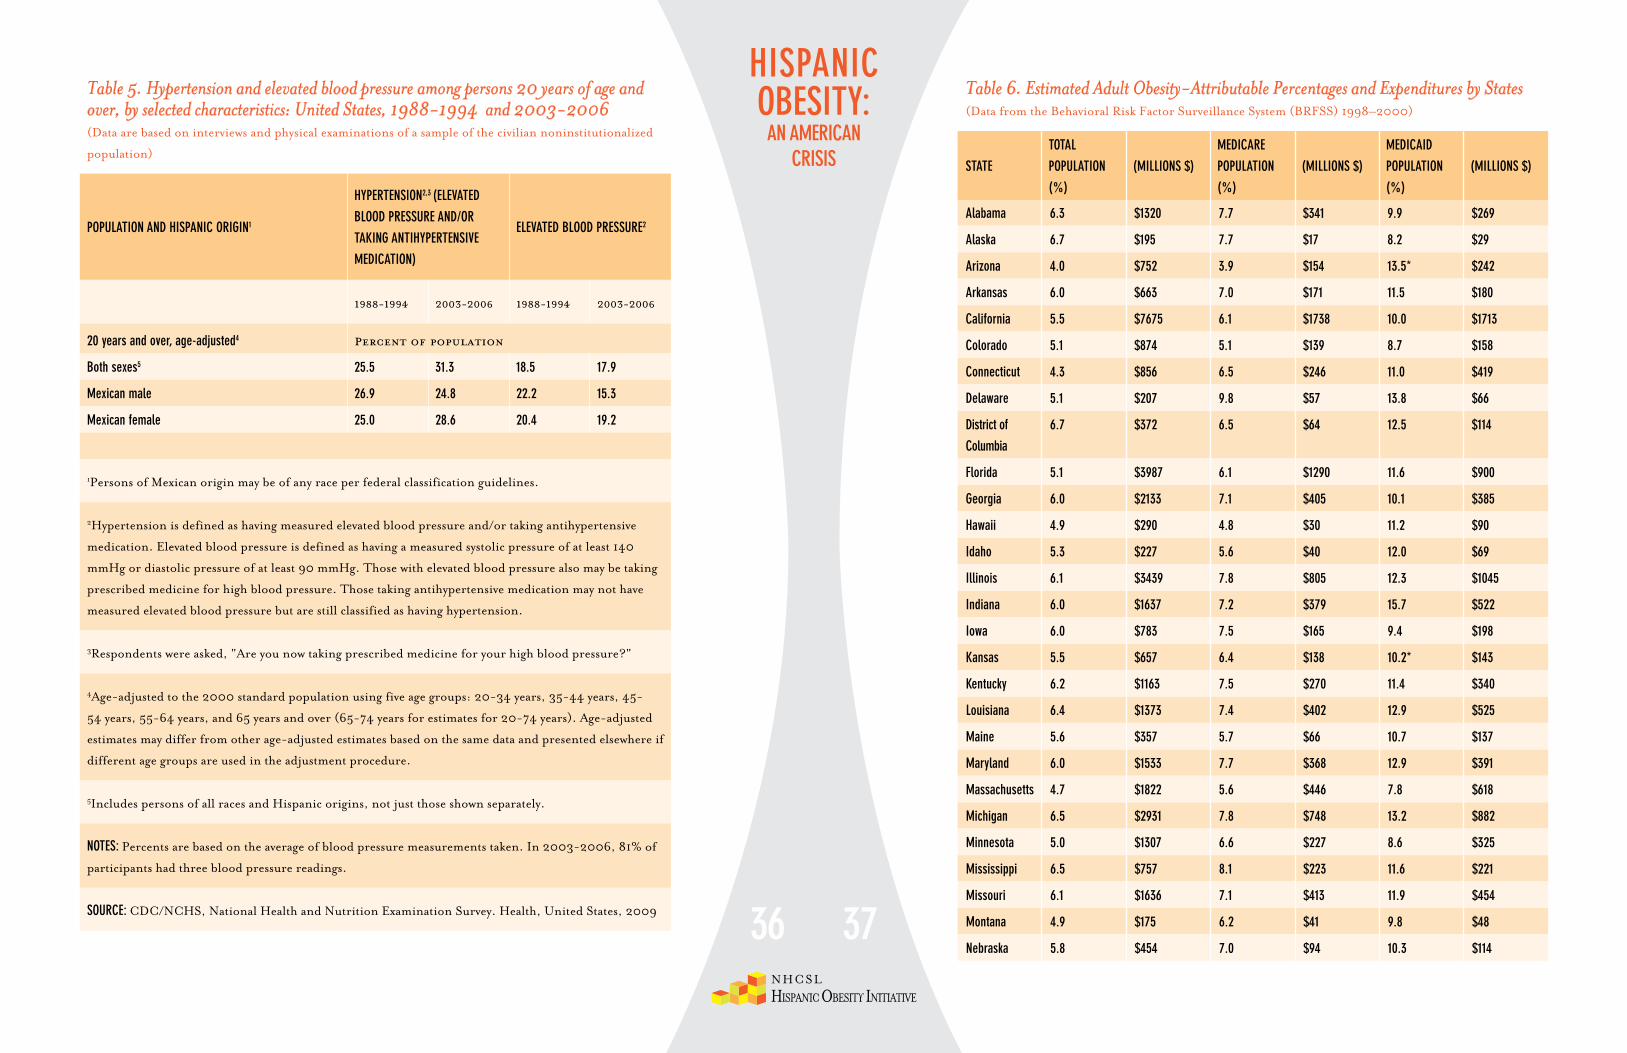
Table 5. Hypertension and elevated blood pressure among persons 20 years of age and over, by selected characteristics: United States, 1988-1994 and 2003-2006(Data are based on interviews and physical examinations of a sample of the civilian noninstitutionalized
population)
pOpULatiOn and Hispanic OriGin1
HypertensiOn2,3 (eLeVated
bLOOd pressUre and/Or
taKinG antiHypertensiVe
medicatiOn)
eLeVated bLOOd pressUre2
1988-1994 2003-2006 1988-1994 2003-2006
20 years and over, age-adjusted4 Percent of population
both sexes5 25.5 31.3 18.5 17.9
mexican male 26.9 24.8 22.2 15.3
mexican female 25.0 28.6 20.4 19.2
1Persons of Mexican origin may be of any race per federal classification guidelines.
2Hypertension is defined as having measured elevated blood pressure and/or taking antihypertensive
medication. Elevated blood pressure is defined as having a measured systolic pressure of at least 140
mmHg or diastolic pressure of at least 90 mmHg. Those with elevated blood pressure also may be taking
prescribed medicine for high blood pressure. Those taking antihypertensive medication may not have
measured elevated blood pressure but are still classified as having hypertension.
3Respondents were asked, "Are you now taking prescribed medicine for your high blood pressure?"
4Age-adjusted to the 2000 standard population using five age groups: 20-34 years, 35-44 years, 45-
54 years, 55-64 years, and 65 years and over (65-74 years for estimates for 20-74 years). Age-adjusted
estimates may differ from other age-adjusted estimates based on the same data and presented elsewhere if
different age groups are used in the adjustment procedure.
5Includes persons of all races and Hispanic origins, not just those shown separately.
nOtes: Percents are based on the average of blood pressure measurements taken. In 2003-2006, 81% of
participants had three blood pressure readings.
sOUrce: CDC/NCHS, National Health and Nutrition Examination Survey. Health, United States, 2009
Table 6. Estimated Adult Obesity-Attributable Percentages and Expenditures by States(Data from the Behavioral Risk Factor Surveillance System (BRFSS) 1998–2000)
state
tOtaL
pOpULatiOn
(%)
(miLLiOns $)
medicare
pOpULatiOn
(%)
(miLLiOns $)
medicaid
pOpULatiOn
(%)
(miLLiOns $)
alabama 6.3 $1320 7.7 $341 9.9 $269
alaska 6.7 $195 7.7 $17 8.2 $29
arizona 4.0 $752 3.9 $154 13.5* $242
arkansas 6.0 $663 7.0 $171 11.5 $180
california 5.5 $7675 6.1 $1738 10.0 $1713
colorado 5.1 $874 5.1 $139 8.7 $158
connecticut 4.3 $856 6.5 $246 11.0 $419
delaware 5.1 $207 9.8 $57 13.8 $66
district of
columbia
6.7 $372 6.5 $64 12.5 $114
Florida 5.1 $3987 6.1 $1290 11.6 $900
Georgia 6.0 $2133 7.1 $405 10.1 $385
Hawaii 4.9 $290 4.8 $30 11.2 $90
idaho 5.3 $227 5.6 $40 12.0 $69
illinois 6.1 $3439 7.8 $805 12.3 $1045
indiana 6.0 $1637 7.2 $379 15.7 $522
iowa 6.0 $783 7.5 $165 9.4 $198
Kansas 5.5 $657 6.4 $138 10.2* $143
Kentucky 6.2 $1163 7.5 $270 11.4 $340
Louisiana 6.4 $1373 7.4 $402 12.9 $525
maine 5.6 $357 5.7 $66 10.7 $137
maryland 6.0 $1533 7.7 $368 12.9 $391
massachusetts 4.7 $1822 5.6 $446 7.8 $618
michigan 6.5 $2931 7.8 $748 13.2 $882
minnesota 5.0 $1307 6.6 $227 8.6 $325
mississippi 6.5 $757 8.1 $223 11.6 $221
missouri 6.1 $1636 7.1 $413 11.9 $454
montana 4.9 $175 6.2 $41 9.8 $48
nebraska 5.8 $454 7.0 $94 10.3 $114

HispanicObesity:an american
crisis
38
HispanicObesity:an american
crisis
39
Table 6. Estimated Adult Obesity-Attributable Percentages and Expenditures by States(Data from the Behavioral Risk Factor Surveillance System (BRFSS) 1998–2000)
state
tOtaL
pOpULatiOn
(%)
(miLLiOns $)
medicare
pOpULatiOn
(%)
(miLLiOns $)
medicaid
pOpULatiOn
(%)
(miLLiOns $)
nevada 4.8 $337 5.0 $74 10.1* $56
new
Hampshire
5.0 $302 5.4 $46 8.6* $79
new Jersey 5.5 $2342 7.1 $591 9.8 $630
new mexico 4.8 $324 4.6 $51 8.5 $84
new york 5.5 $6080 6.7 $1391 9.5 $3539
north carolina 6.0 $2138 7.0 $448 11.5 $662
north dakota 6.1 $209 7.7 $45 11.7 $55
Oklahoma 6.0 $854 7.0 $227 9.9 $163
Ohio 6.1 $3304 7.7 $839 10.3 $914
Oregon 5.7 $781 6.0 $145 8.8 $180
pennsylvania 6.2 $4138 7.4 $1187 11.6 $1219
puerto rico 7.4 8.1 10.1
rhode island 5.2 $305 6.5 $83 7.7 $89
south carolina 6.2 $1060 7.7 $242 10.6 $285
south dakota 5.3 $195 5.9 $36 9.9 $45
tennessee 6.4 $1840 7.6 $433 10.5 $488
texas 6.1 $5340 6.8 $1209 11.8 $1177
Utah 5.2 $393 5.8 $62 9.0 $71
Vermont 5.3 $141 6.9 $29 8.6 $40
Virginia 5.7 $1641 6.7 $320 13.1 $374
washington 5.4 $1330 6.0 $236 9.9 $365
west Virginia 6.4 $588 7.3 $140 11.4 $187
wisconsin 5.8 $1486 7.7 $306 9.1 $320
wyoming 4.9 $87 5.9 $15 8.5 $23
total 5.7 $75,051 6.8 $17,701 10.6 $21,329
sOUrces: Finkelstein, Fiebelkorn, and Wang, 2004. Notes: In addition, these state-estimated data are
limited to direct medical costs, and not indirect costs (example: absenteeism and decreased productivity)
attributed to obesity). The medical expenditures for Medicaid and Medicare were not reported for the
Commonwealth of Puerto Rico on this table.
Table 7. Top Ten States With the Highest Number of Latinos
state/areaLatinO pOpULatiOn
in tHOUsands
eXpenditUre by
states-adULt Obesity
reLated (miLLiOns)
percentaGe OF Obese LatinO
adULts
caLiFOrnia 11,0 $7,675 29.2%
teXas 6,670 $5,340 32.1%
new yOrK 2,868 $6,080 27.1%
FLOrida 2,683 $2,342 26.0%
iLLinOis 1,530 $3,439 30.7%
arizOna 1,296 $752 31.4%
new Jersey 1,117 $2,342 24.1%
new meXicO 765 $324 27.6%
cOLOradO 736 $874 25.1%
wasHinGtOn 442 $1,330 29.9%
sOUrces: U.S. Census 2000, Population Demographics — States with largest Latino population
CDC: Finkelstein, EA, Fiebelkorn, IC, Wang, G. State-level estimates of medical expenditures
attributable to obesity.2004
*Estimates based on Behavioral Risk Factor Surveillance System (BRFSS) data from 1998-2000
CDC: Fiekelstein et al, 2004. State-Specific percentage of adults categorized as obese by Hispanic
ethnicity
*Estimates based on BRFSS data from 2006-2008.

HispanicObesity:an american
crisis
40
HispanicObesity:an american
crisis
41
reFerences
1. U.S. Department of Health and Human Services defines obesity as an excess body fat for an
individual having a body mass index (BMI) of 30 kg or greater. Overweight is defined as a BMI of
greater than or equal to 25 kilograms/m2.
2. U.S. Department of Health and Human Services. The Surgeon General’s Vision for a Healthy and Fit Nation.
Rockville, MD: U.S. Department of Health and Human Services, Office of the Surgeon General,
January 2010. Retrieved March 15, 2010 from http://www.surgeongeneral.gov
3. U.S. Centers for Disease Control and Prevention, National Center for Health Statistics. Health, United
States, 2003. Atlanta, GA: U.S. Department of Health and Human Services, 2003.
4. Center on Budget and Policy Priorities. “The Long-Term Fiscal Outlook is Bleak: Restoring Fiscal
Sustainability Will Require Major Changes to Programs, Revenues, and the Nation’s Health Care
System.” http://www.cbpp.org/cms/index.cfm (accessed March 16, 2010).
5. Kaiser Family Foundation. “Health Care Spending in the United States and OECD Countries.”
http://www.kff.org/insurance/snapshot/chcm01030 7oth.cfm (accessed April 15, 2009).
6. Sisko, A., C. Truffer, S. Smith, et al. “Health Spending Projections Through 2018: Recession
Effects Add Uncertainty To The Outlook.” Health Affairs (Web Exclusive), February 24, 2009.
7. U.S. Census Bureau. American Community Survey, 2006-2008, 3-year Estimate.
8. U.S. Census Bureau. U.S. Projections by Age, Sex, Race, and Hispanic Origin. Washington, DC:
U.S. Census; 2004.
9. U.S. Census Bureau. The Hispanic Population: Census 2000 Brief. Washington, DC: U.S. Census;
2001
10. U.S. Census Bureau, Facts for Feature: Hispanic Heritage Month Sept 15-Oct 15 http://www.
census.gov/PressRelease/www/releases/archives/facts_for_features_special_editions/013984.html
11. U.S. Census Bureau. 2006-2008 American Community Survey 3-year Estimate, Selected
Population Profiles.
12. Serdula MK, Ivery D, Coates RJ et al. Do obese children become obese adults? A review of the
literature. Prev Med 2003; 22:167-177.
13. Strauss RS, Pollack HA. Epidemic increase in childhood overweight, 1986-1998. JAMA, 2001;
286:2845-2848
14. Ogden CL, Flegal KM et al. Prevalence and trends in overweight among U.S. children and
adolescents, 1999-2000. JAMA, 2002; 288:1728-1732.
15. The Center for Disease Control and Prevention (CDC): Overweight and Obesity Health
Consequences: Retrieved from http://www.cdc.gov/obesity/causes/health.html
16. National Heart, Lung, and Blood Institute. Clinical guideline on the identification, evaluation, and
treatment of overweight and obesity in adults: the evidence report. Bethesda, MD: U.S. Department
of Health and Human Services, National Institutes of Health, National Heart, Lung, and Blood
Institute; 1998. Available at http://www.nhlbi.nih.gov/guidelines/obesity/ob_gdlns.htm.
17. Flegal KM, Graubard BI, Williamson DF, Gail MH. Excess deaths associated with underweight,
overweight, and obesity. JAMA 2005;293 (15):1861–7. accessed from statistics,
http://www.cdc.gov/omhd/populations/hl/hl.htm#ten
18. The Center for Disease Control and Prevention (CDC): Office of Minority Health and Health
Disparities (OMHD) accessed from statistics, http://www.cdc.gov/omhd/populations/hl/hl.htm#ten
19. National Association of State Mental Health Program Directors. Obesity and Prevention Strategies
for Individuals with Serious Mental Illness, Technical Report 2008.
20. The Obesity Society: The Practical Guide: Identification, Evaluation, and Treatment of Overweight
and Obesity in Adult: Retrieved from http://www.obesity.org/information/practicalguide.asp.
21. The Center for Disease and Prevention Control (CDC). Hypertension –Related Mortality Among
Hispanic Subpopulations U.S. 1995-2002. MMWR 2006 55/177-180.
22. Felson, D.T., and Y. Zhang. “An Update on the Epidemiology of Knee and Hip Osteoarthritis with
a View to Prevention.” Arthritis and Rheumatism 41, no. 8 (1998):1343–1355.
23. Pronk, N. P., B. Martinson, R. C. Kessler, A. L. Beck, G. E. Simon, and P. Wang. “The
Association between Work Performance, and Physical Activity, Cardio-respiratory Fitness, and
Obesity. “Journal of Occupational and Environmental Medicine” 46, no. 1 (2004): 19-25.
24. Trogdon, J.G., E.A. Finkelstein, T. Hylands, P.S. Dellea, and S.J. Kamal-Bahl. “Indirect Costs of
Obesity: A Review of the Current Literature.” Obesity Reviews 9, no. 5(2008):489-500.
25. Puhl R, Brownell KD. (2001). Bias, discrimination, and obesity.Obesity Research, 9:788-805.
U.S. Department of Defense PharmacoEconomic Center. “Pharmacoeconomic Analysis of Obesity
Treatment.” PEC Update 97, no. 5 (1997): 1-17. Accessed from http://www.pec.ha.osd.mil/
Updates/97%20PDFs/97-
26. Journal Study on Health affairs: Health Affairs, published by Project HOPE, is a bimonthly
journal devoted to publishing the leading edge in health policy thought and research
27. Finkelstein, Erica, Fiebelkorn Ian C, & Wang Guijing. National Medical Spending Attributable to
Overweight and Obesity: How Much and Who’s Paying?

HispanicObesity:an american
crisis
42
HispanicObesity:an american
crisis
43
28. The Centers for Medicare and Medicaid Services (CMS). General Information Program on
Medicare and Medicaid. Accessed from http://www2.cms.gov/home/medicare.asp/medicaid.asp
29. U.S. Census. Income, Poverty, and Health Insurance Coverage in the United States 2007. Accessed
from http://www.census.gov/prod/2008pubs/p60-235.pdf
30. Wang, Y., M.A. Beydoun, L. Liang, B. Caballero, and S.K. Kumanyika. “Will All Americans
Become Overweight or Obese? Estimating the Progression and Cost of the U.S. Obesity Epidemic.”
Obesity 16, no. 10 (2008): 2323-2330.
31. Rosen, B. and L. Barrington. Weights & Measures: What Employers Should Know about Obesity.
New York, NY: The Conference Board, April 2008.
32. U.S. Department of Health and Human Services. The Surgeon General’s call to action to prevent
and decrease overweight and obesity. [Rockville, MD]: U.S. Department of Health and Human
Services, Public Health Service, Office of the Surgeon General; 2001.
33. The Center for Disease Control and Prevention (CDC): Differences in Prevalence of Obesity
Among Black, White, and Hispanic Adults — U.S. 2006-2008. Retrieved from http://www.cdc.gov/
feature/dsobesityadults.
34. The Center for Disease Control and Prevention (CDC): U.S. Obesity Trends by State 1985-2008.
Retrieved from http://www/cdc/gov/obesity/data/trends.html
35. U.S. Census. Income, Poverty, and Health Insurance Coverage in the U.S. 2008. Accessed from
http://www.census.gov/prod/2009pubs/p60-236.pdf. Office of Management Budget (OMB)
determined the official definition of poverty in Statistical Policy Directive 14. U.S. Census 2008.
36. C.T. Remarks made as moderator of the panel “Changing the Food Environment,” part of the
Transatlantic Public Policy Approaches to Tackling Obesity and Diet-Related Disease conference
held in Washington, D.C. on April 8, 2008. C.T. Foreman, is the Director of Consumer
Federation of America.
37. U.S. Department of Agriculture, Economic Research Service: Food CPI and Expenditures, accessed
from http://www.ers.usda.gov/Briefing/CPIFoodAndExpenditures/
38. Trust for America’s Health and the Robert Wood Johnson Foundation, “F as in Fat 2009: How
Obesity Policies Are Failing America” available at (www.healthyamericans.org) March 17,2010.
39. U.S. Department of Agriculture (USDA). “Profiles of Participants in the National School Lunch
Program” Data from two National Surveys. (August 2006, USDA Economic Research Service
Report).
40. U.S. General Accounting Office, School Meal Programs: Competitive Foods Are Available in Many
Schools; Actions Taken to Restrict Them Differ by State and Locality, Report no. GAO-04-673
(2004).
41. National Association for Sport and Physical Education, Shape of the Nation: Executive Summary
(Reston, Va.: 2001).
42. Fact sheet: Metabolic & bariatric surgery. (n.d.). American Society for Metabolic & Bariatric
Surgery. Available from http://www.asmbs.org/Newsite07/media/factsheet1_ bariatric-surgery.pdf
43. Trust for America’s Health and the Robert Wood Johnson Foundation, “F as in Fat 2009: How
Obesity Policies Are Failing America” available at (www.healthyamericans.org) March 17,2010
44. CDC’s Pediatric Nutrition Surveillance System (PedNSS) Data reported from 1998-2008: Obesity
Prevalence Among Low-Income, Preschool-Aged Children by states.
45. CDC States Profiles, data accessed from http://www.cdc.gov/chronicdisease/states/texas.htm#npaao
46. Center for Mississippi Health Policy, “Obesity in Mississippi” Report Compiled by the POWER
Initiative & the Department of Education’s office of Health Schools. 2009

444 nOrtH capitOL street, nw / sUite 404wasHinGtOn, dc 20001
teL: 202-434-8070FaX: 202-434-8072www.nHcsL.OrG
cOpyriGHt: © 2010 tHe natiOnaL Hispanic caUcUs OF state LeGisLatOrs


![Welcome! [asphn.org] · –Hispanics and non-Hispanic blacks have a higher prevalence of obesity (47%) than non-Hispanic whites (38%) and non-Hispanic Asians (13%) –Women have a](https://img.pdfslide.us/doc/110x75/5f05313b7e708231d411bc46/welcome-asphnorg-ahispanics-and-non-hispanic-blacks-have-a-higher-prevalence.jpg)