Embed Size (px)
Citation preview
Economic impacts of 2nd generation biofuel development in Indonesia
– A Case study of bioethanol production from rice straw in the Citarm river basin –
Hiroaki SHIRAKAWA
Patricia San Miguel
Nagoya University
Introduction
• In order to reduce imported fuel, poverty ratio and GHG emission, the Government of Indonesia is attempting to find alternative renewable energy, particularly in the form of biofuel.

Introduction
• However, it is afraid that promotion of 1st generation biofuel produced primarily from food crops may cause deforestation or compete with food.
• It is increasingly understood that 1st-generation biofuels are limited in their ability to achieve targets for oil-product substitution.
Introduction
• The cumulative impacts of these concerns have increased the interest in developing biofuels produced from non-food biomass, such as agricultural residues. These "2nd-generation biofuels" could avoid many of the concerns facing 1st-generation biofuels.
• However little is known about economic impacts of 2nd generation biofuel

Road map of biofuel development in Indonesia
category 2005-2010 2011-2015 2016-2025 major materials
biodiesel
plan
10% for total diesel
consumption
15% for total diesel
consumption
20% for total diesel
consumption perm
jatropha
demand 2.41 million KL 4.52 million KL 10.22 million KL
bioethanol
plan
5% for total gasoline
consumption
10% for total gasoline
consumption
15% for total gasoline
consumption casaba
sugar cane
demand 1.48 million KL 2.78 million KL 6.28 million KL
biofuel
plan
2% for total energy
consumption
3% for total energy
consumption
5% for total energy
consumption
demand 5.29 million KL 9. 84million KL 22.26 million KL

Major energy crops
Casaba Perm
jatropha
biodiesel bioethanol
Sugarcane
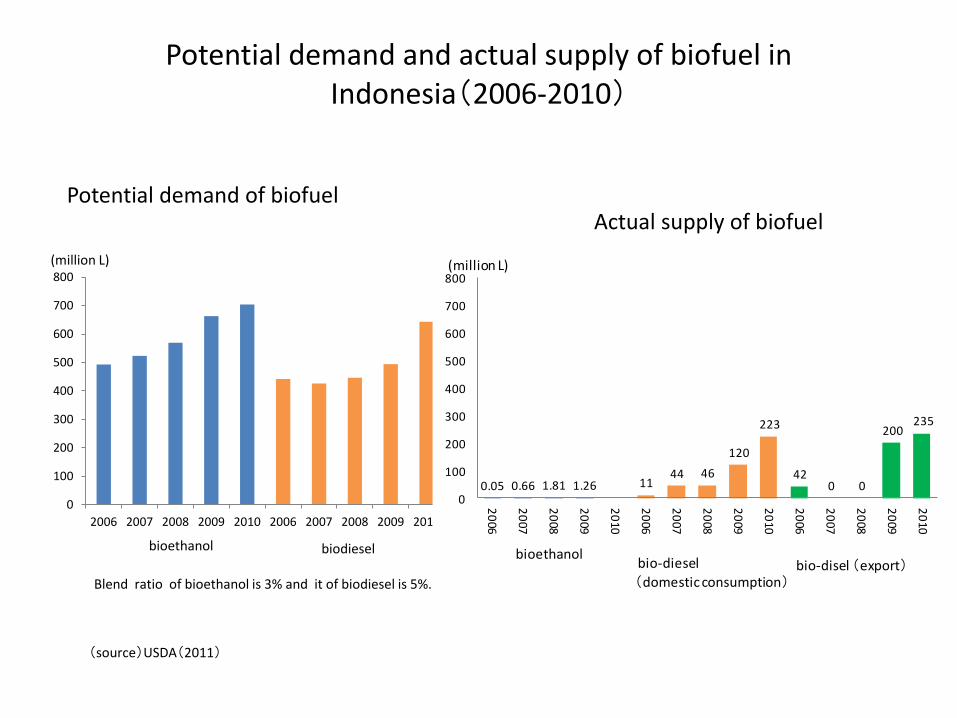
Potential demand and actual supply of biofuel in Indonesia(2006-2010)
0
100
200
300
400
500
600
700
800
2006 2007 2008 2009 2010 2006 2007 2008 2009 2010
(million L)
bioethanol biodiesel
Potential demand of biofuel Actual supply of biofuel
Blend ratio of bioethanol is 3% and it of biodiesel is 5%.
0.05 0.66 1.81 1.26 1144 46
120
223
420 0
200235
0
100
200
300
400
500
600
700
800
20
06
20
07
20
08
20
09
20
10
20
06
20
07
20
08
20
09
20
10
20
06
20
07
20
08
20
09
20
10
(million L)
bioethanolbio-diesel
(domestic consumption)bio-disel (export)
(source)USDA(2011)
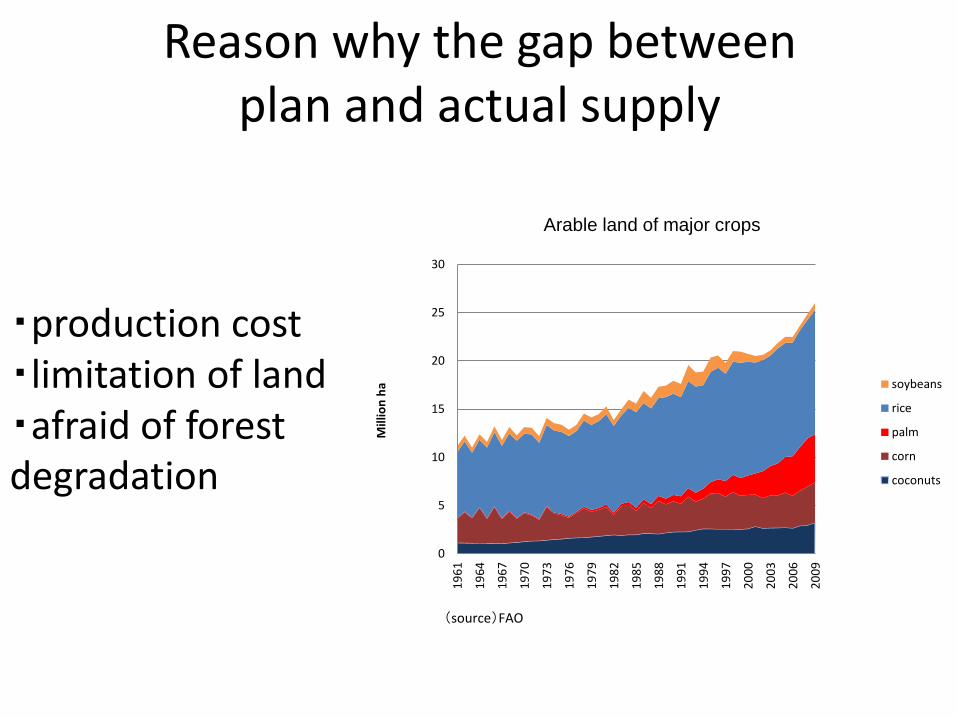
Reason why the gap between plan and actual supply
0
5
10
15
20
25
30
19
61
19
64
19
67
19
70
19
73
19
76
19
79
19
82
19
85
19
88
19
91
19
94
19
97
20
00
20
03
20
06
20
09
Mill
ion
ha
soybeans
rice
palm
corn
coconuts
Arable land of major crops
(source)FAO
・production cost ・limitation of land ・afraid of forest degradation
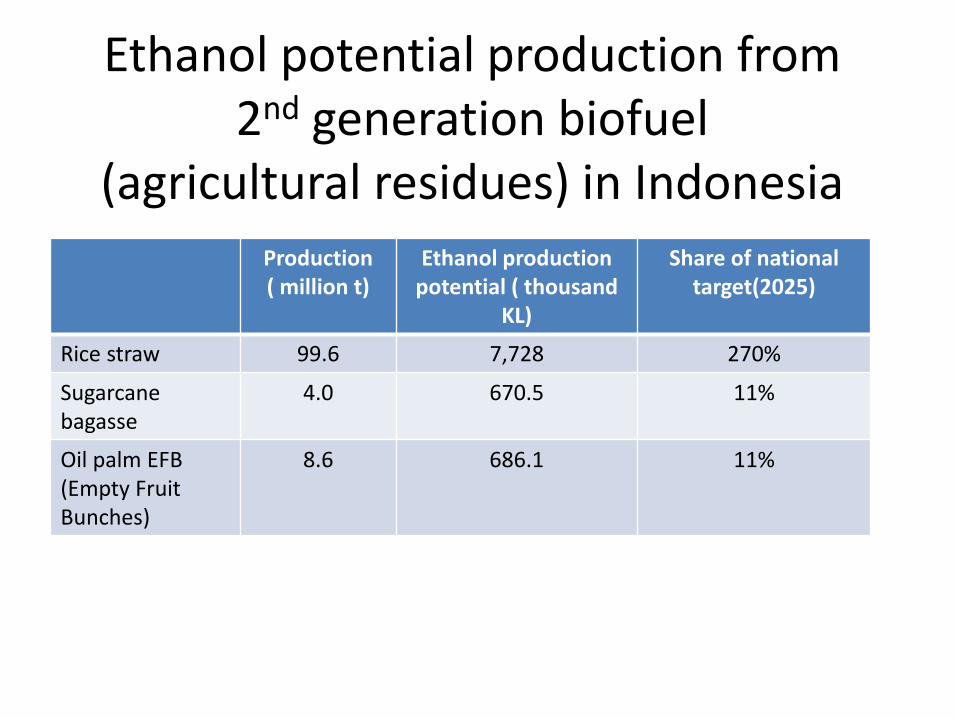
Ethanol potential production from 2nd generation biofuel
(agricultural residues) in Indonesia
Production ( million t)
Ethanol production potential ( thousand
KL)
Share of national target(2025)
Rice straw 99.6 7,728 270%
Sugarcane bagasse
4.0 670.5 11%
Oil palm EFB (Empty Fruit Bunches)
8.6 686.1 11%
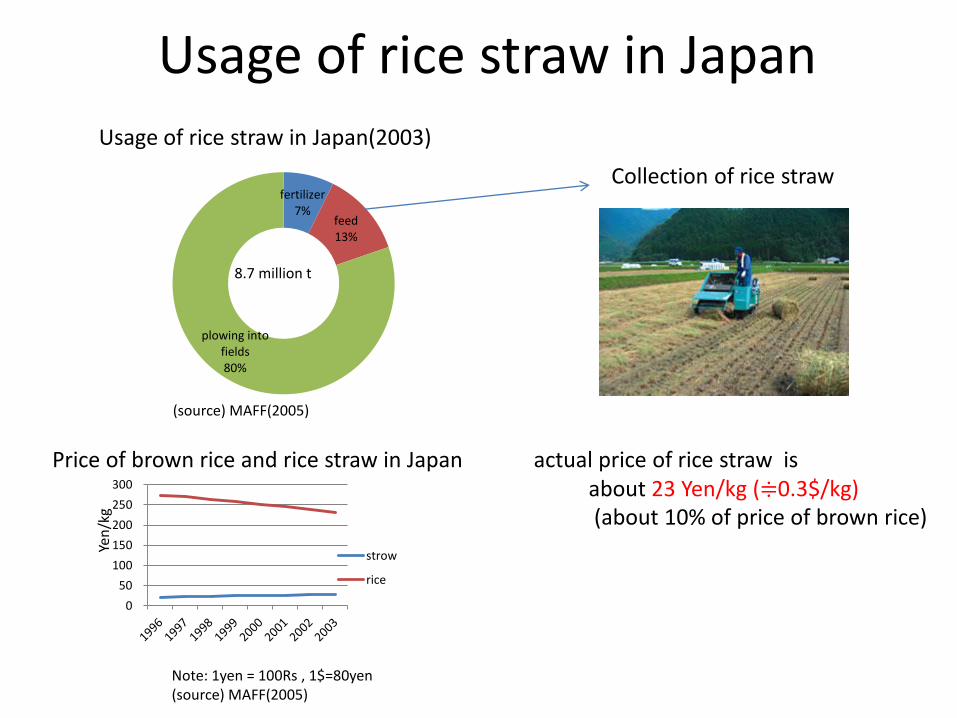
fertilizer 7%
feed 13%
plowing into fields 80%
Usage of rice straw in Japan Usage of rice straw in Japan(2003)
8.7 million t
(source) MAFF(2005)
Collection of rice straw
Price of brown rice and rice straw in Japan
Yen
/kg
Note: 1yen = 100Rs , 1$=80yen (source) MAFF(2005)
actual price of rice straw is about 23 Yen/kg (≑0.3$/kg) (about 10% of price of brown rice)
0
50
100
150
200
250
300
strow
rice
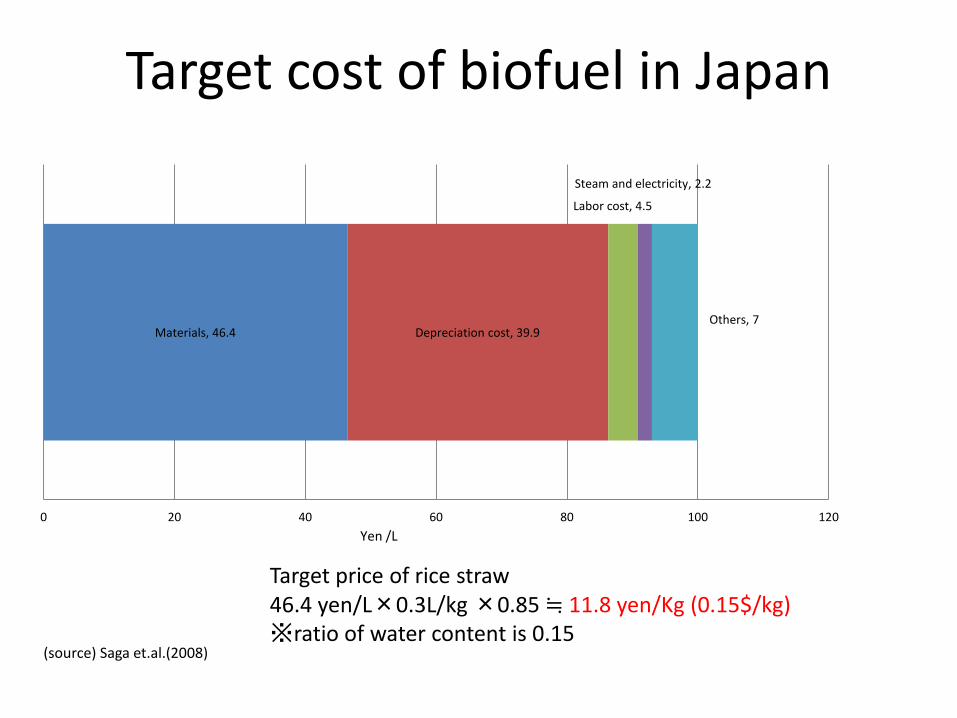
Target cost of biofuel in Japan
Materials, 46.4 Depreciation cost, 39.9
Labor cost, 4.5
Steam and electricity, 2.2
Others, 7
0 20 40 60 80 100 120
Yen /L
(source) Saga et.al.(2008)
Target price of rice straw 46.4 yen/L×0.3L/kg ×0.85 ≒ 11.8 yen/Kg (0.15$/kg) ※ratio of water content is 0.15

Case study in Citarm river basin settlements Industrial establishments
Rice producing area Primary and secondary forest area
■population (2003) 17.8 million (4.1 million house holds) 30% delivered from agriculture 9.7% is in poverty. ■Area of irrigated paddy field 390,000 ha(47.5% of the river basin) ■forest degradation 35,000 ha (from 1992 to 2001)
(source)Integrated Citarum Water Resources Management Investment Program (ICWRMIP)

Ethanol production potential from rice straw in Citarm river basin
• Yearly Rice straw production potential 390,000ha×4t/ha×2times×1.5 = 4,680,000t ※rice production assume 4t/ha(dry weight) rice straw / paddy rice = 1.5 • Maximum ethanol production potential 4,680,000t ×0.85×(0.2kg/t~0.3kg/t) = 795,600kL ~ 1,193,400 kL ※ 29% ~ 43% of national target in 2015 13% ~ 19% of national target in 2025

Preliminary result: Estimation of collection & transportation cost
for rice straw in Citarm River Basin
※Target price of rice straw is 1,180 Rp/kg.(0.15$/kg)
CASE A: packing rice straw CASE B: non packing rice straw
CASE A CASE B
Note (Rp/kg) (Rp/kg)
Costs rice straw(A) 1,106
collection(B) 1,209
labor 30 4% of cost in Japan
fuel cost 33 1/3 of cost in Japan depreciation cost 792 same cost in Japan
maintenance cost 208 same cost in Japan net 146 same cost in Japan
transportation(C) 74 74 1/3 of cost in Japan Total (A)+(B)+(C) 1,283 1,180
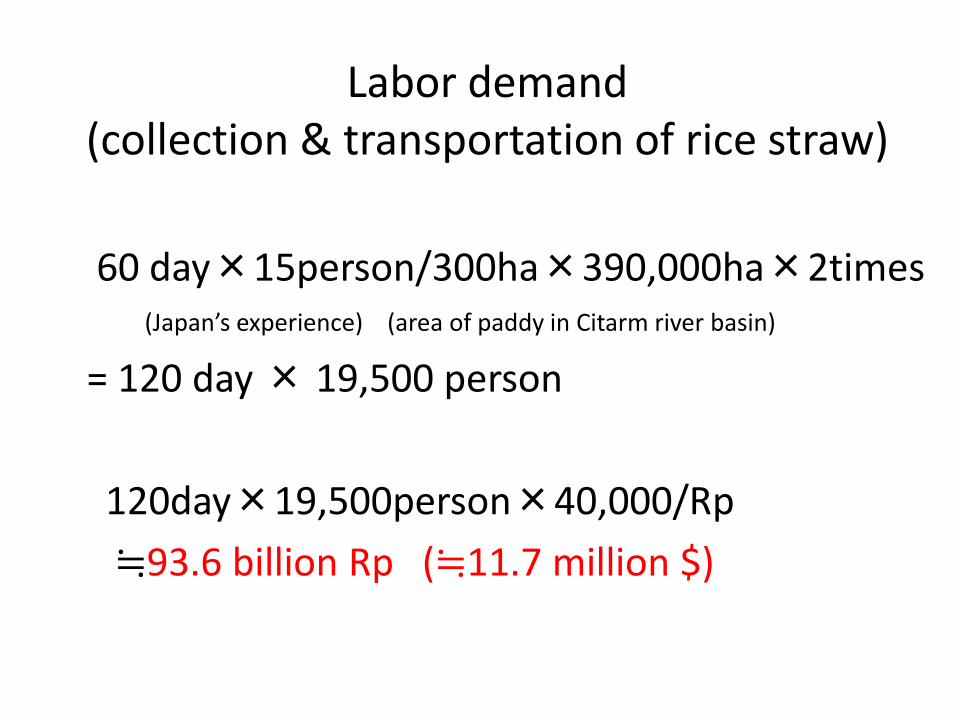
60 day×15person/300ha×390,000ha×2times (Japan’s experience) (area of paddy in Citarm river basin)
= 120 day × 19,500 person
120day×19,500person×40,000/Rp
≒93.6 billion Rp (≒11.7 million $)
Labor demand (collection & transportation of rice straw)
Thank you for your attention!