Embed Size (px)
Citation preview
1
1 of 17
HIPPS Design Methodology
• Kevin Mullen
• INTECSEA
HIPPS – High Integrity Pressure Protection Systems – or High Integrity
Pipeline Protection Systems
I hope to explain to you in this talk how to design HIPPS systems, to protect
subsea pipelines against over-pressure.
I’ll show you a formal design process which is actually in accordance with the
leading design code for pipelines, DNV-OS-F101.
And I will explain to you why designing HIPPS systems became 100 times
harder in October 2007.
But first, I need to set the scene, and explain what a conventional HIPPS
system is.
2
2 of 17
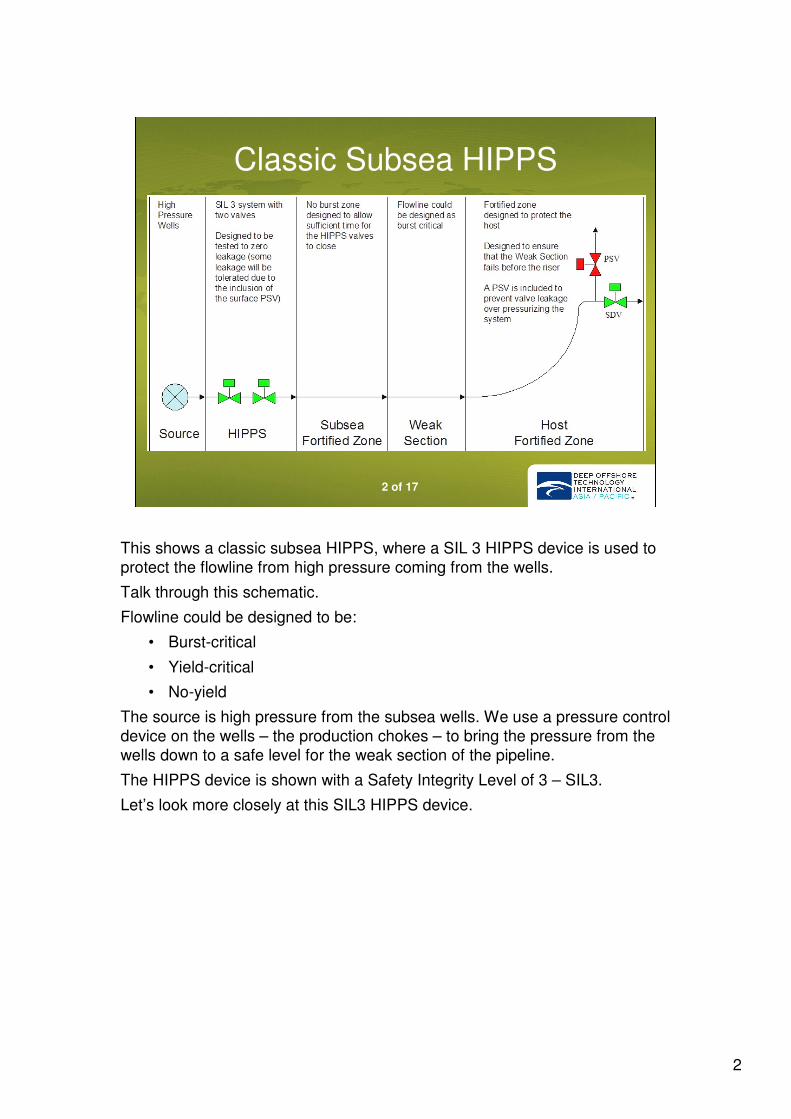
Classic Subsea HIPPS
This shows a classic subsea HIPPS, where a SIL 3 HIPPS device is used to
protect the flowline from high pressure coming from the wells.
Talk through this schematic.
Flowline could be designed to be:
• Burst-critical
• Yield-critical
• No-yield
The source is high pressure from the subsea wells. We use a pressure control
device on the wells – the production chokes – to bring the pressure from the
wells down to a safe level for the weak section of the pipeline.
The HIPPS device is shown with a Safety Integrity Level of 3 – SIL3.
Let’s look more closely at this SIL3 HIPPS device.
3
3 of 17
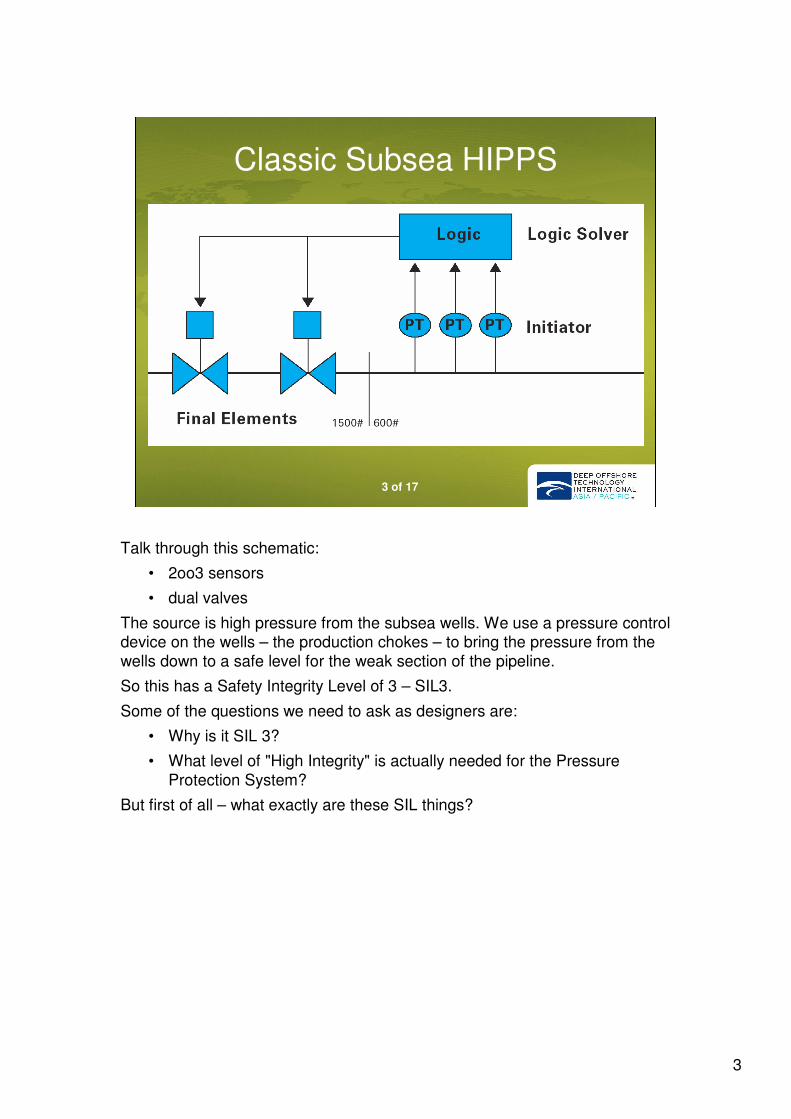
Classic Subsea HIPPS
Talk through this schematic:
• 2oo3 sensors
• dual valves
The source is high pressure from the subsea wells. We use a pressure control device on the wells – the production chokes – to bring the pressure from the
wells down to a safe level for the weak section of the pipeline.
So this has a Safety Integrity Level of 3 – SIL3.
Some of the questions we need to ask as designers are:
• Why is it SIL 3?
• What level of "High Integrity" is actually needed for the Pressure
Protection System?
But first of all – what exactly are these SIL things?
4
4 of 17
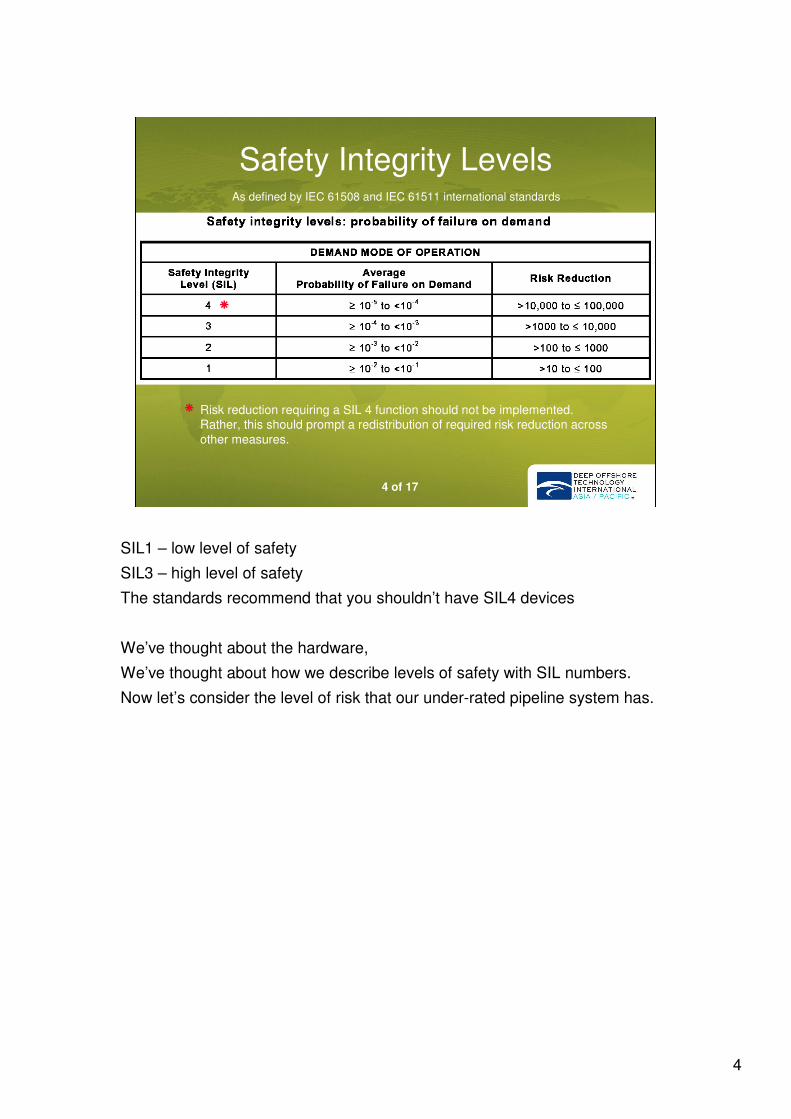
Safety Integrity Levels
Risk reduction requiring a SIL 4 function should not be implemented. Rather, this should prompt a redistribution of required risk reduction across
other measures.
�
�
As defined by IEC 61508 and IEC 61511 international standards
SIL1 – low level of safety
SIL3 – high level of safety
The standards recommend that you shouldn’t have SIL4 devices
We’ve thought about the hardware,
We’ve thought about how we describe levels of safety with SIL numbers.
Now let’s consider the level of risk that our under-rated pipeline system has.
5
5 of 17
The Risk Reduction Process
Tolerable
risk
Initial
risk
Necessary risk reduction
Actual risk reduction
Increasing
risk
Residual
risk
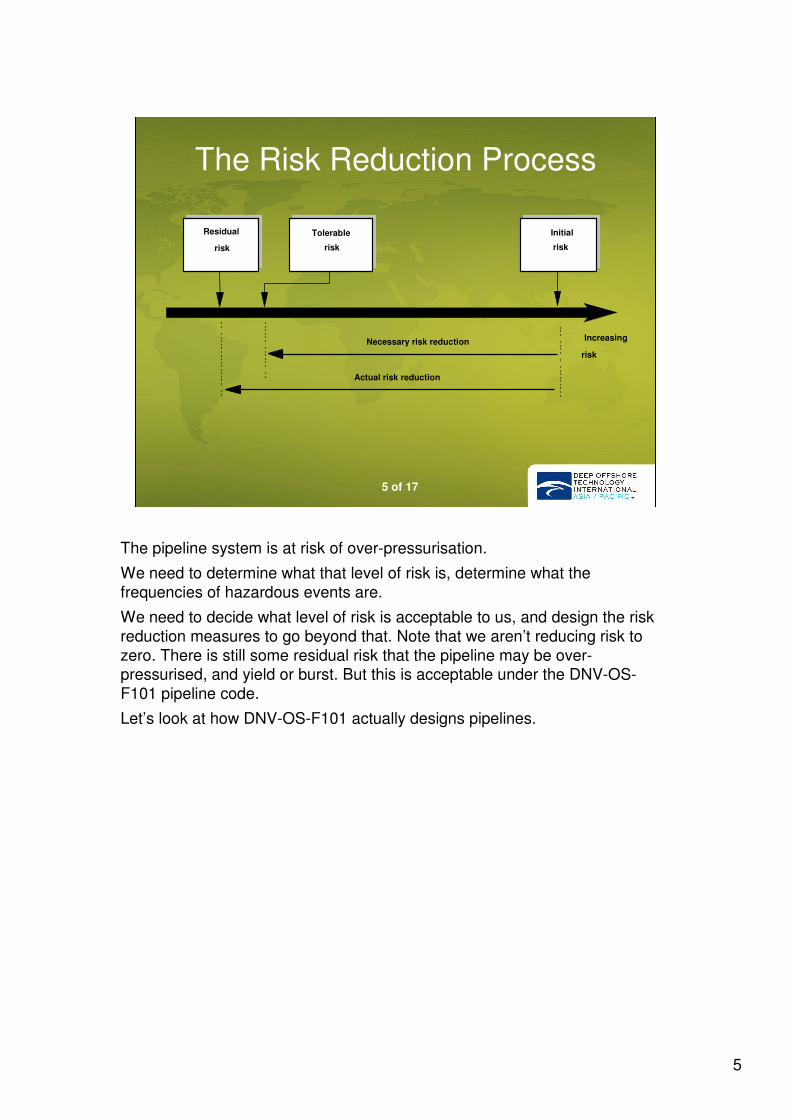
The pipeline system is at risk of over-pressurisation.
We need to determine what that level of risk is, determine what the
frequencies of hazardous events are.
We need to decide what level of risk is acceptable to us, and design the risk
reduction measures to go beyond that. Note that we aren’t reducing risk to
zero. There is still some residual risk that the pipeline may be over-pressurised, and yield or burst. But this is acceptable under the DNV-OS-
F101 pipeline code.
Let’s look at how DNV-OS-F101 actually designs pipelines.
6
6 of 17
Stress and Strength
Overlapping of stress and strength
distributions
LRFD
Load and Resistance Factor Design
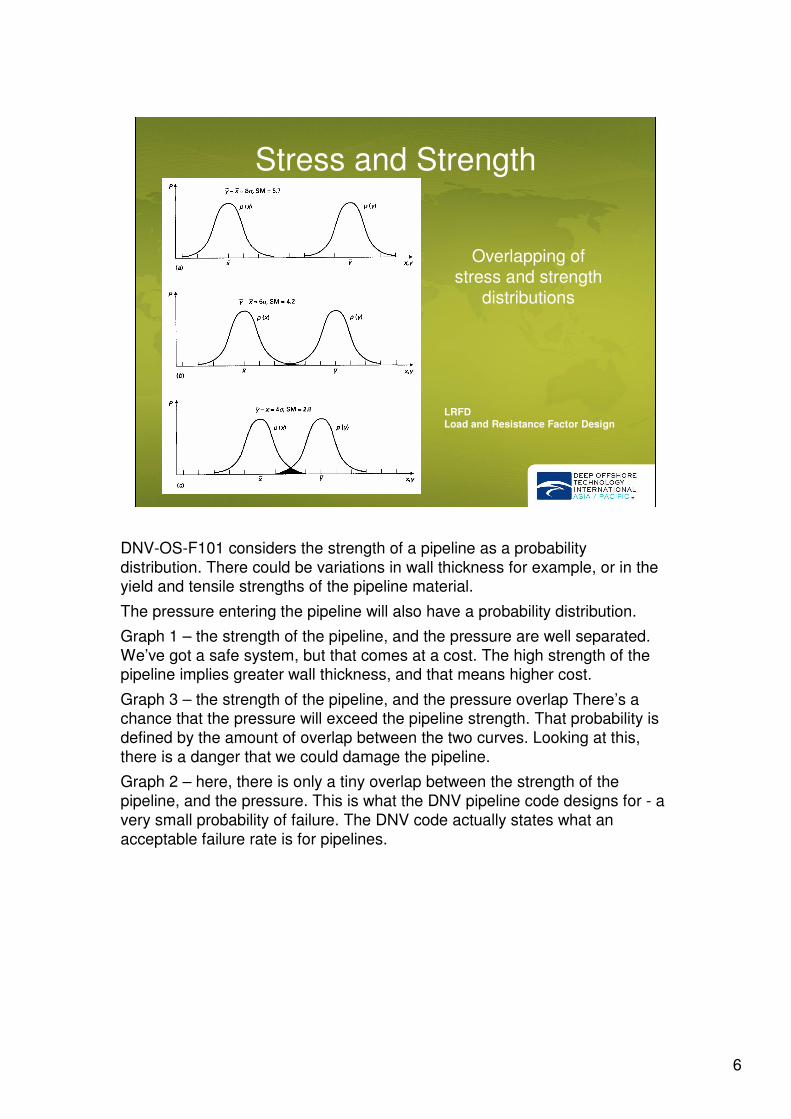
DNV-OS-F101 considers the strength of a pipeline as a probability
distribution. There could be variations in wall thickness for example, or in the yield and tensile strengths of the pipeline material.
The pressure entering the pipeline will also have a probability distribution.
Graph 1 – the strength of the pipeline, and the pressure are well separated.
We’ve got a safe system, but that comes at a cost. The high strength of the pipeline implies greater wall thickness, and that means higher cost.
Graph 3 – the strength of the pipeline, and the pressure overlap There’s a chance that the pressure will exceed the pipeline strength. That probability is
defined by the amount of overlap between the two curves. Looking at this,
there is a danger that we could damage the pipeline.
Graph 2 – here, there is only a tiny overlap between the strength of the
pipeline, and the pressure. This is what the DNV pipeline code designs for - a
very small probability of failure. The DNV code actually states what an
acceptable failure rate is for pipelines.
7
7 of 17
Stress and Strength
Typical pressure distribution for
HIPPS
Pipeline
Strength
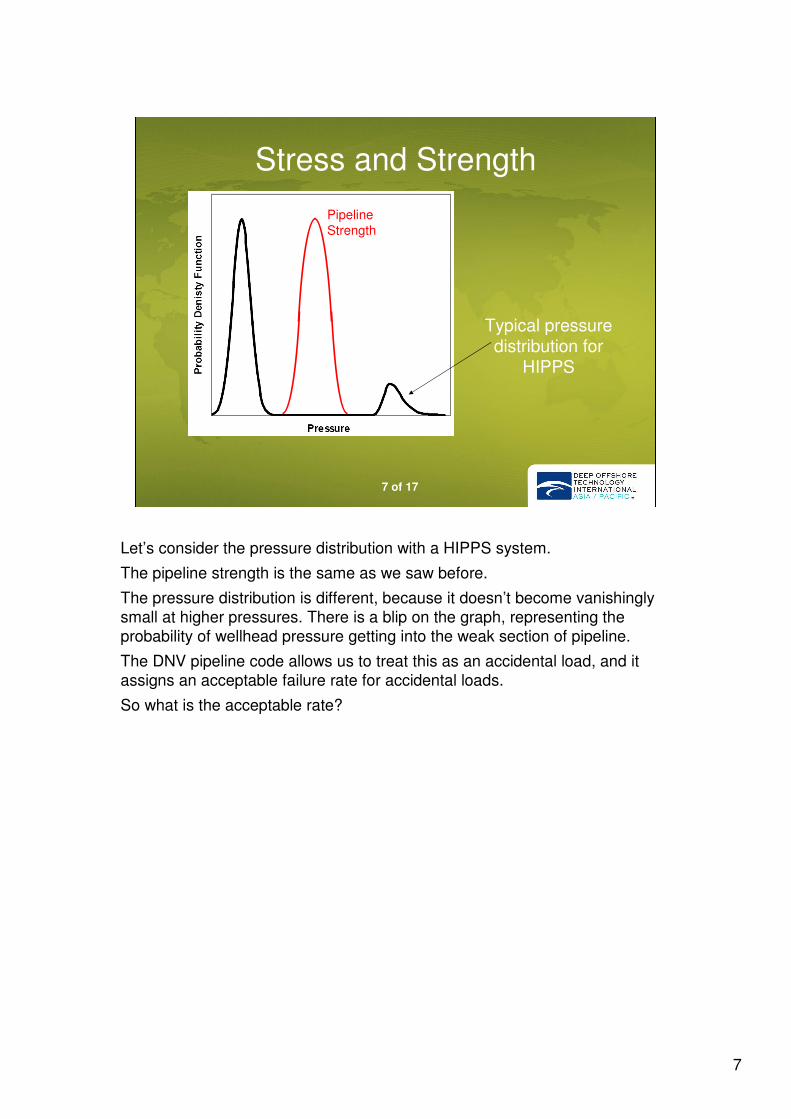
Let’s consider the pressure distribution with a HIPPS system.
The pipeline strength is the same as we saw before.
The pressure distribution is different, because it doesn’t become vanishingly
small at higher pressures. There is a blip on the graph, representing the
probability of wellhead pressure getting into the weak section of pipeline.
The DNV pipeline code allows us to treat this as an accidental load, and it
assigns an acceptable failure rate for accidental loads.
So what is the acceptable rate?
8
8 of 17
DNV-OS-F101 - Safety Class
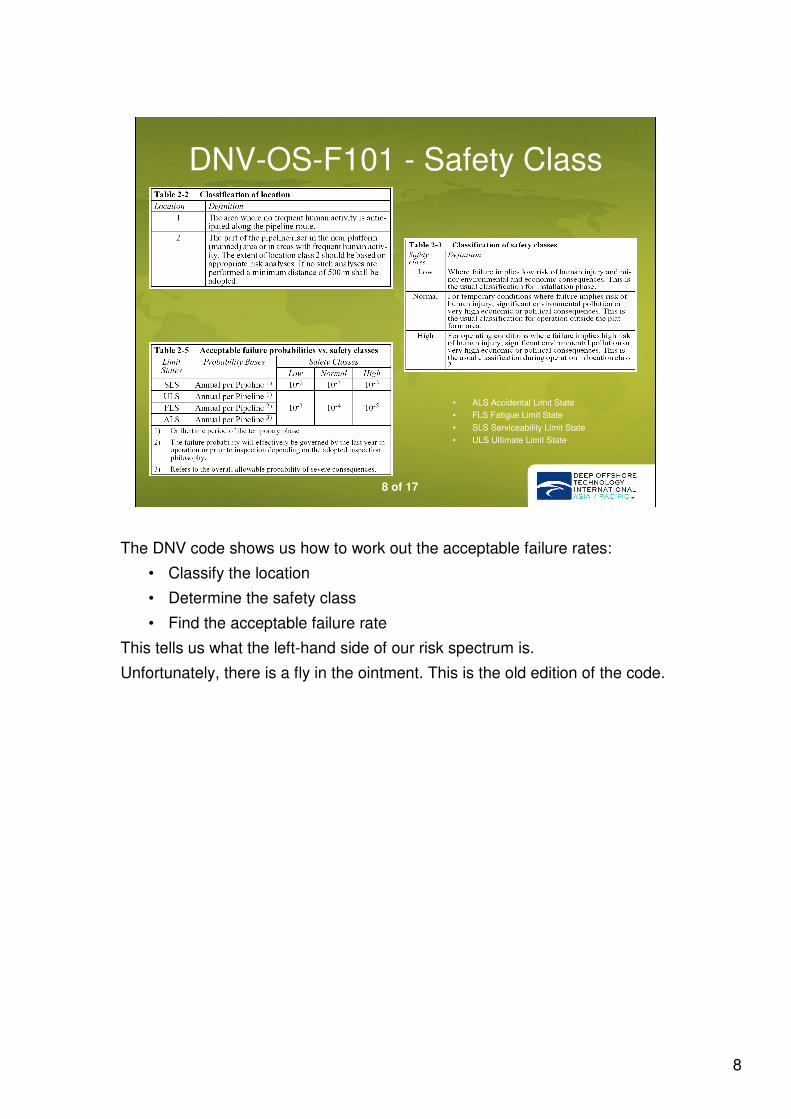
• ALS Accidental Limit State
• FLS Fatigue Limit State
• SLS Serviceability Limit State
• ULS Ultimate Limit State
The DNV code shows us how to work out the acceptable failure rates:
• Classify the location
• Determine the safety class
• Find the acceptable failure rate
This tells us what the left-hand side of our risk spectrum is.
Unfortunately, there is a fly in the ointment. This is the old edition of the code.
9
9 of 17
DNV-OS-F101 – 2007 changes
• ALS Accidental Limit State
• FLS Fatigue Limit State
• SLS Serviceability Limit State
• ULS Ultimate Limit State
DNV 2007
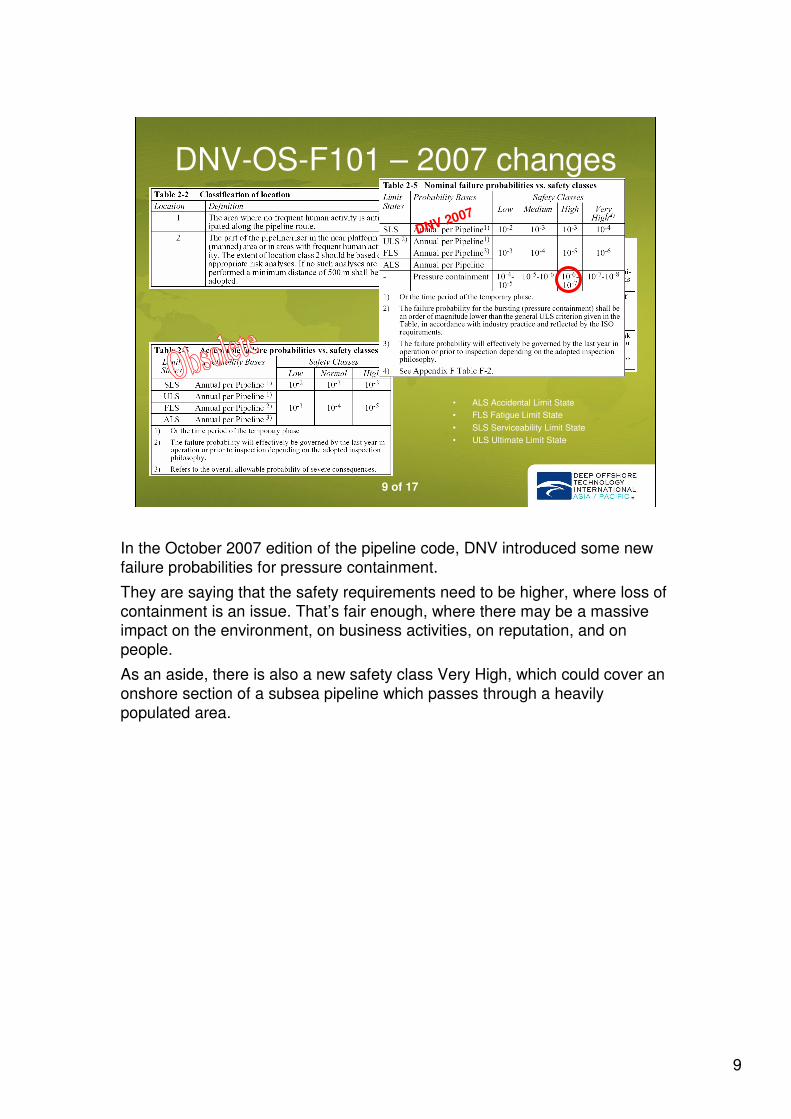
In the October 2007 edition of the pipeline code, DNV introduced some new
failure probabilities for pressure containment.
They are saying that the safety requirements need to be higher, where loss of
containment is an issue. That’s fair enough, where there may be a massive impact on the environment, on business activities, on reputation, and on
people.
As an aside, there is also a new safety class Very High, which could cover an
onshore section of a subsea pipeline which passes through a heavily
populated area.
10
10 of 17
Risk Spectrum
Tolerable
risk
Initial Risk of high pressure
getting past the tree
production choke (Pressure
Regulating System)
Necessary risk reduction
Actual risk reduction
Increasing
risk
Residual
risk
10-6 pa (Acceptable failure rate per DNV)100 (once per annum)
10-7 pa
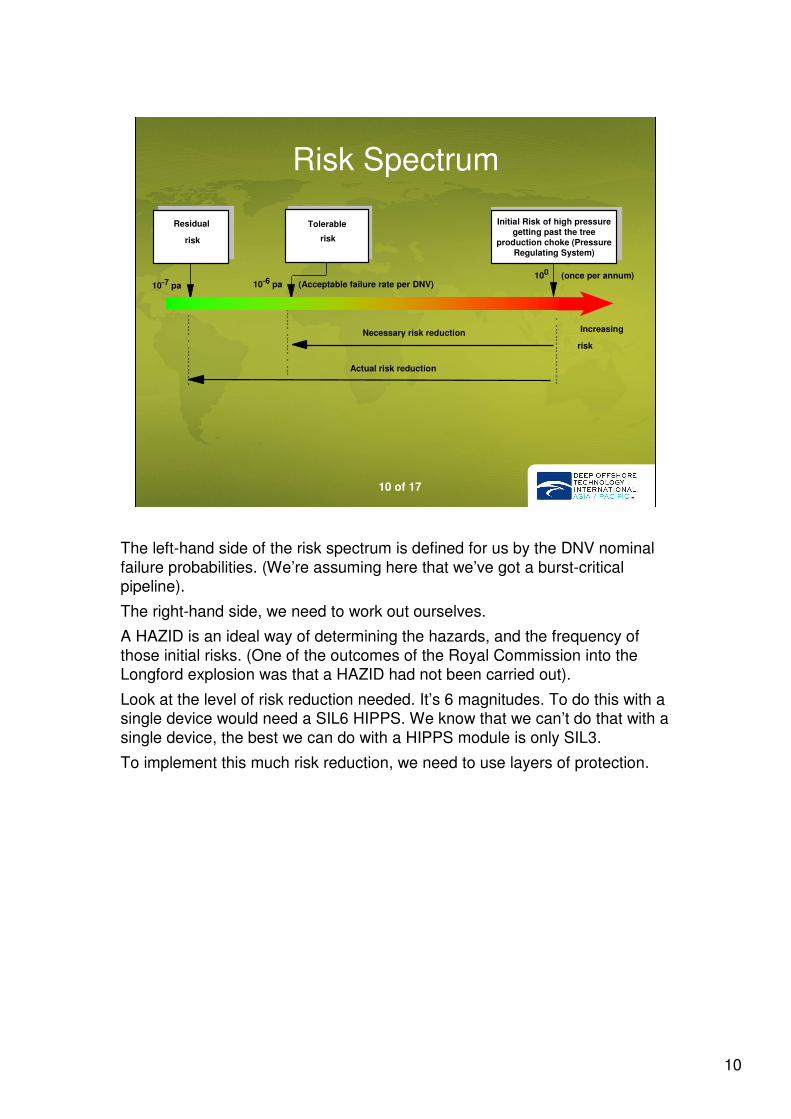
The left-hand side of the risk spectrum is defined for us by the DNV nominal
failure probabilities. (We’re assuming here that we’ve got a burst-critical pipeline).
The right-hand side, we need to work out ourselves.
A HAZID is an ideal way of determining the hazards, and the frequency of
those initial risks. (One of the outcomes of the Royal Commission into the Longford explosion was that a HAZID had not been carried out).
Look at the level of risk reduction needed. It’s 6 magnitudes. To do this with a single device would need a SIL6 HIPPS. We know that we can’t do that with a
single device, the best we can do with a HIPPS module is only SIL3.
To implement this much risk reduction, we need to use layers of protection.
11
11 of 17
Risk Reduction - Layers of Protection
Pipeline
Control System
Alarms
Instrumented Shutdowns
Procedures
HIPPS
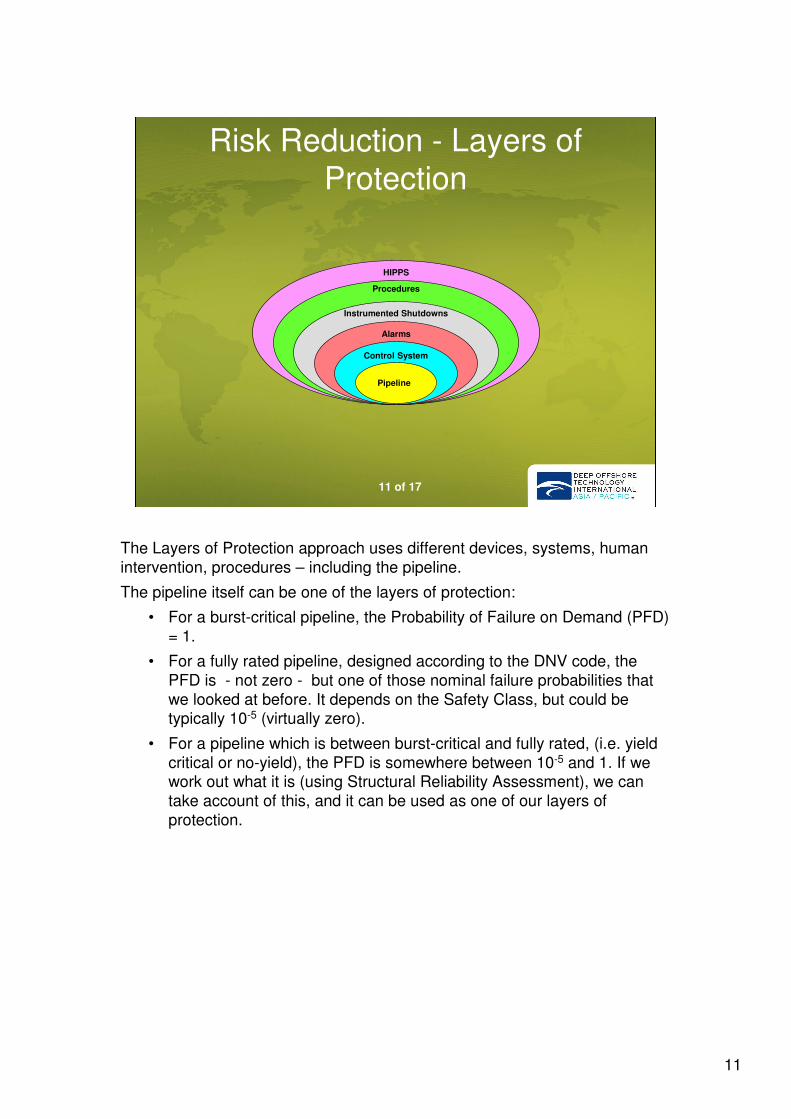
The Layers of Protection approach uses different devices, systems, human
intervention, procedures – including the pipeline.
The pipeline itself can be one of the layers of protection:
• For a burst-critical pipeline, the Probability of Failure on Demand (PFD)
= 1.
• For a fully rated pipeline, designed according to the DNV code, the
PFD is - not zero - but one of those nominal failure probabilities that
we looked at before. It depends on the Safety Class, but could be typically 10-5 (virtually zero).
• For a pipeline which is between burst-critical and fully rated, (i.e. yield
critical or no-yield), the PFD is somewhere between 10-5 and 1. If we work out what it is (using Structural Reliability Assessment), we can
take account of this, and it can be used as one of our layers of
protection.
12
12 of 17
Independent Safety LayersTolerable
risk
Initial Risk of high pressure
getting past the tree
production choke (Pressure
Regulating System)
Necessary risk reduction
Actual risk reduction
Increasing
risk
Residual
risk
Risk Reduction by
manual shutdown
procedure
1.0 x 10⁻¹
Risk reduction achieved by all safety-related systems
10-6 pa (Acceptable failure rate per DNV)100 (once per annum)
Risk Reduction by
PWV shutdown
on Tree
3.2 x 10⁻²
Risk Reduction by
HIPPS module
next to Tree
1.0 x 10⁻³
10-7 pa
Risk Reduction by
PMV shutdown
on Tree
3.2 x 10⁻²
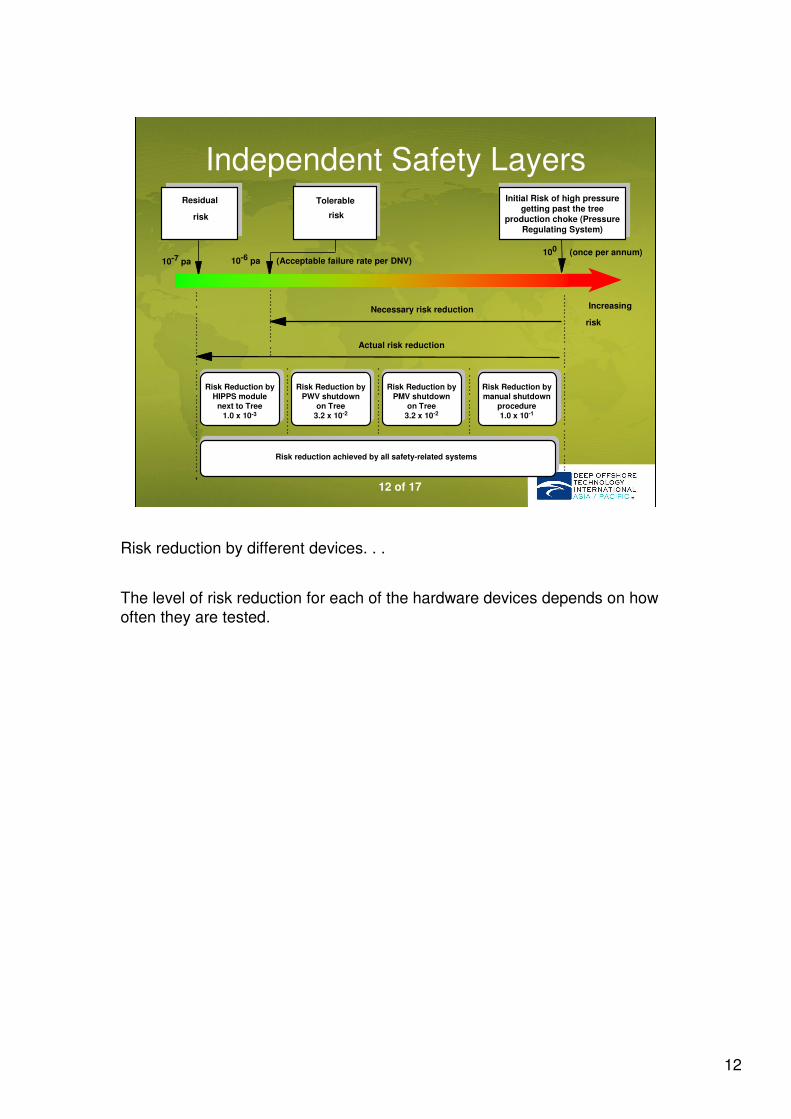
Risk reduction by different devices. . .
The level of risk reduction for each of the hardware devices depends on how
often they are tested.
13
13 of 17
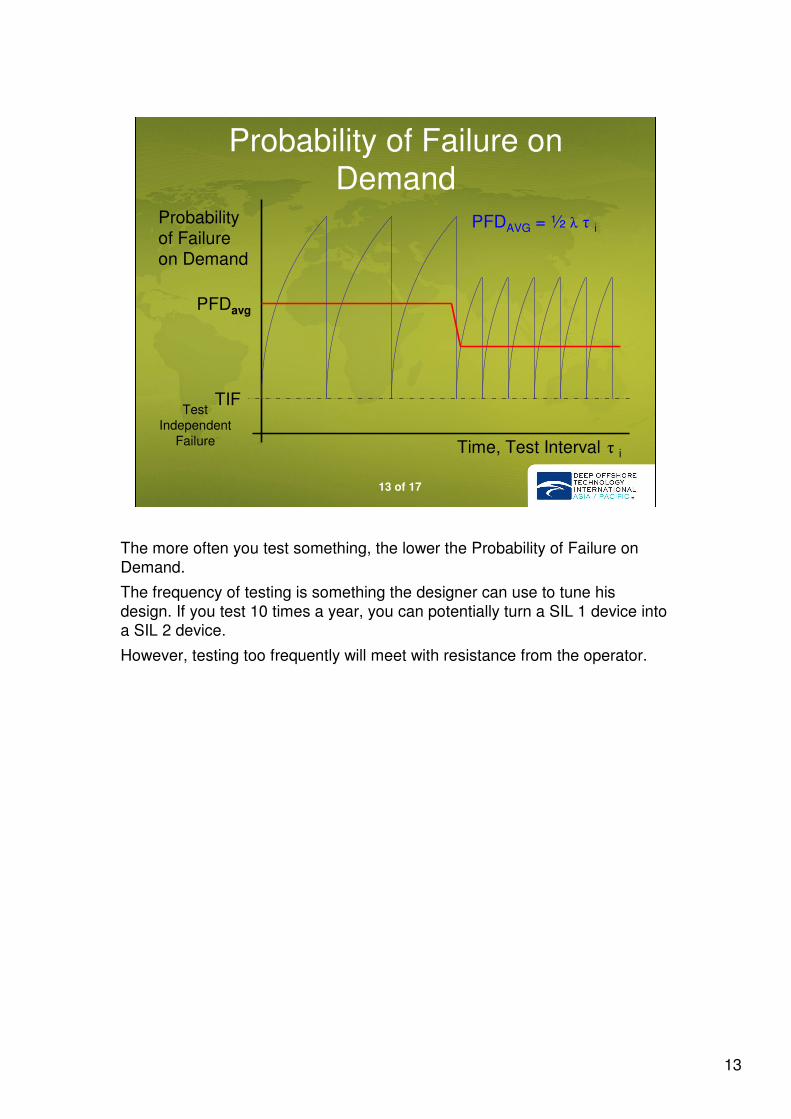
Probability of Failure on Demand
Probability of Failure on Demand
Time, Test Interval
PFDavg
PFDAVG = ½ λ τ i
τ i
TIFTest
Independent
Failure
The more often you test something, the lower the Probability of Failure on
Demand.
The frequency of testing is something the designer can use to tune his
design. If you test 10 times a year, you can potentially turn a SIL 1 device into a SIL 2 device.
However, testing too frequently will meet with resistance from the operator.
14
14 of 17
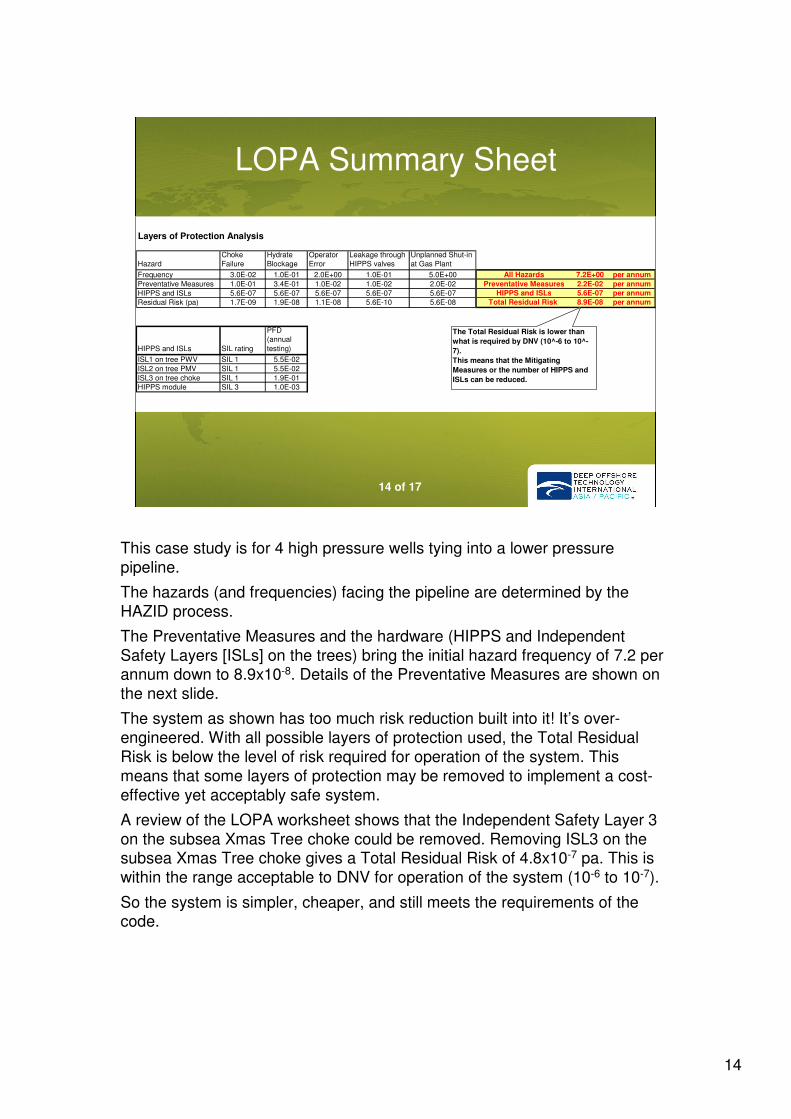
LOPA Summary Sheet
Layers of Protection Analysis
Hazard
Choke
Failure
Hydrate
Blockage
Operator
Error
Leakage through
HIPPS valves
Unplanned Shut-in
at Gas Plant
Frequency 3.0E-02 1.0E-01 2.0E+00 1.0E-01 5.0E+00 All Hazards 7.2E+00 per annum
Preventative Measures 1.0E-01 3.4E-01 1.0E-02 1.0E-02 2.0E-02 Preventative Measures 2.2E-02 per annum
HIPPS and ISLs 5.6E-07 5.6E-07 5.6E-07 5.6E-07 5.6E-07 HIPPS and ISLs 5.6E-07 per annum
Residual Risk (pa) 1.7E-09 1.9E-08 1.1E-08 5.6E-10 5.6E-08 Total Residual Risk 8.9E-08 per annum
HIPPS and ISLs SIL rating
PFD
(annual
testing)
ISL1 on tree PWV SIL 1 5.5E-02
ISL2 on tree PMV SIL 1 5.5E-02
ISL3 on tree choke SIL 1 1.9E-01
HIPPS module SIL 3 1.0E-03
The Total Residual Risk is lower than
what is required by DNV (10^-6 to 10^-
7).
This means that the Mitigating
Measures or the number of HIPPS and
ISLs can be reduced.
This case study is for 4 high pressure wells tying into a lower pressure
pipeline.
The hazards (and frequencies) facing the pipeline are determined by the
HAZID process.
The Preventative Measures and the hardware (HIPPS and Independent
Safety Layers [ISLs] on the trees) bring the initial hazard frequency of 7.2 per annum down to 8.9x10⁻⁸. Details of the Preventative Measures are shown on
the next slide.
The system as shown has too much risk reduction built into it! It’s over-
engineered. With all possible layers of protection used, the Total Residual
Risk is below the level of risk required for operation of the system. This
means that some layers of protection may be removed to implement a cost-
effective yet acceptably safe system.
A review of the LOPA worksheet shows that the Independent Safety Layer 3
on the subsea Xmas Tree choke could be removed. Removing ISL3 on the subsea Xmas Tree choke gives a Total Residual Risk of 4.8x10⁻⁷ pa. This is
within the range acceptable to DNV for operation of the system (10-6 to 10-7).
So the system is simpler, cheaper, and still meets the requirements of the code.
15
15 of 17
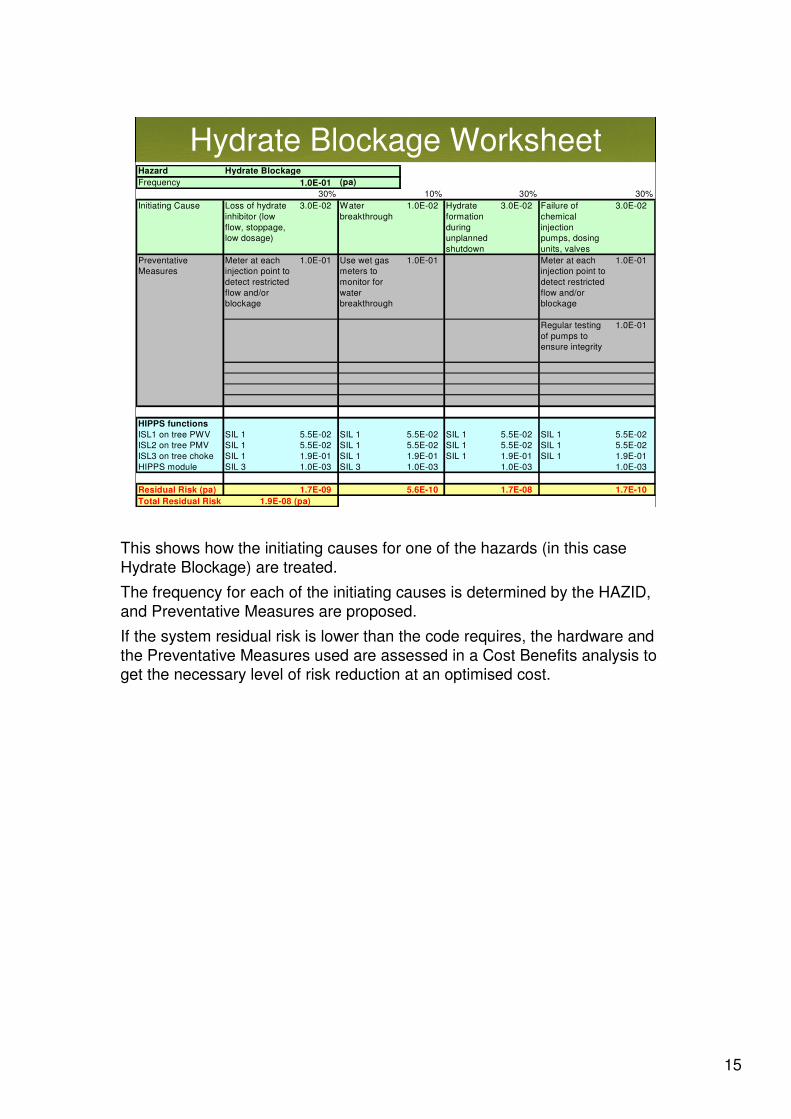
Hydrate Blockage WorksheetHazard Hydrate Blockage
Frequency 1.0E-01 (pa)
30% 10% 30% 30%
Initiating Cause Loss of hydrate
inhibitor (low
flow, stoppage,
low dosage)
3.0E-02 Water
breakthrough
1.0E-02 Hydrate
formation
during
unplanned
shutdown
3.0E-02 Failure of
chemical
injection
pumps, dosing
units, valves
3.0E-02
Preventative
Measures
Meter at each
injection point to
detect restricted
flow and/or
blockage
1.0E-01 Use wet gas
meters to
monitor for
water
breakthrough
1.0E-01 Meter at each
injection point to
detect restricted
flow and/or
blockage
1.0E-01
Regular testing
of pumps to
ensure integrity
1.0E-01
HIPPS functions
ISL1 on tree PWV SIL 1 5.5E-02 SIL 1 5.5E-02 SIL 1 5.5E-02 SIL 1 5.5E-02
ISL2 on tree PMV SIL 1 5.5E-02 SIL 1 5.5E-02 SIL 1 5.5E-02 SIL 1 5.5E-02
ISL3 on tree choke SIL 1 1.9E-01 SIL 1 1.9E-01 SIL 1 1.9E-01 SIL 1 1.9E-01
HIPPS module SIL 3 1.0E-03 SIL 3 1.0E-03 1.0E-03 1.0E-03
Residual Risk (pa) 1.7E-09 5.6E-10 1.7E-08 1.7E-10
Total Residual Risk 1.9E-08 (pa)
This shows how the initiating causes for one of the hazards (in this case
Hydrate Blockage) are treated.
The frequency for each of the initiating causes is determined by the HAZID,
and Preventative Measures are proposed.
If the system residual risk is lower than the code requires, the hardware and
the Preventative Measures used are assessed in a Cost Benefits analysis to get the necessary level of risk reduction at an optimised cost.
16
16 of 17
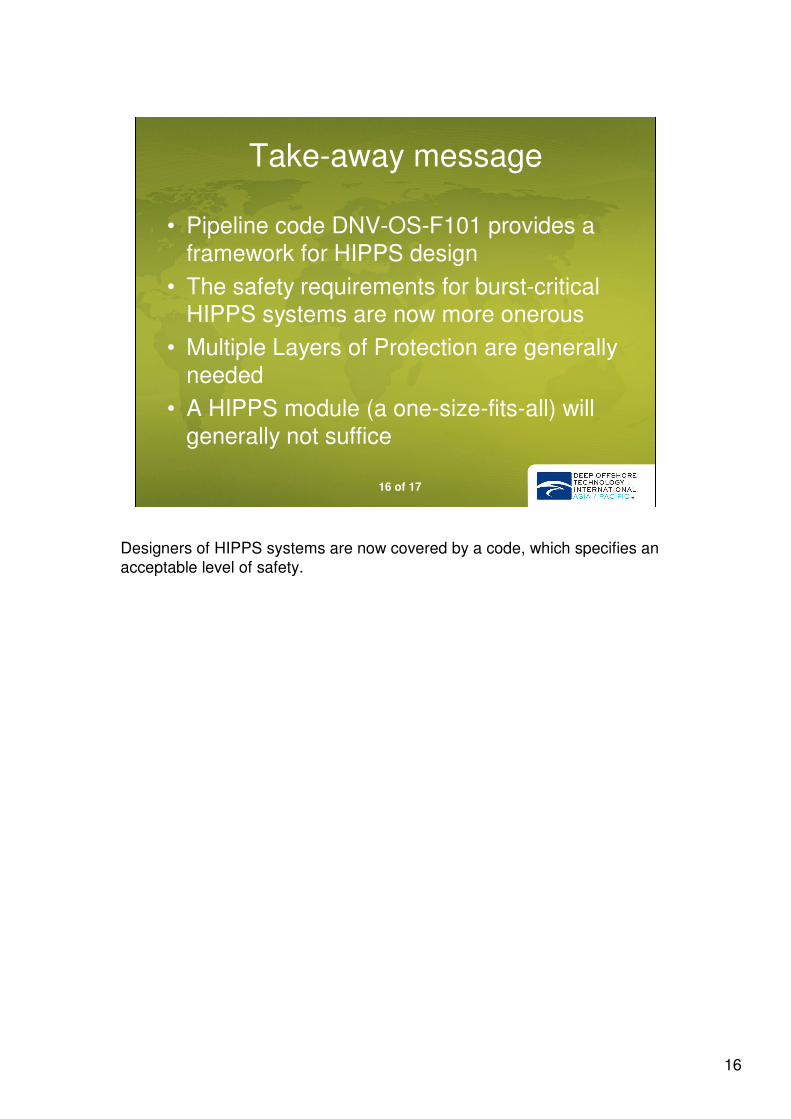
Take-away message
• Pipeline code DNV-OS-F101 provides a
framework for HIPPS design
• The safety requirements for burst-critical HIPPS systems are now more onerous
• Multiple Layers of Protection are generally
needed
• A HIPPS module (a one-size-fits-all) will
generally not suffice
Designers of HIPPS systems are now covered by a code, which specifies an
acceptable level of safety.

17
17 of 17
Contact information
• Kevin Mullen
• INTECSEA
• http://www.intecsea.com