Embed Size (px)
Citation preview

sRNA-seq Analysis of Human Embryonic Stem Cellsand Definitive Endoderm Reveals DifferentiallyExpressed MicroRNAs and Novel IsomiRs withDistinct Targets
ANDREW HINTON,a SHAUN E. HUNTER,a IVKA AFRIKANOVA,a G. ADAM JONES,a ANA D. LOPEZ,a
GARY B. FOGEL,b ALBERTO HAYEK,a CHARLES C. KINGa
Key Words. Embryonic stem cells • miRNA • Differentiation • Pluripotency
ABSTRACT
MicroRNAs (miRNAs) are noncoding, regulatory RNAs expressed dynamically during differentia-tion of human embryonic stem cells (hESCs) into defined lineages. Mapping developmentalexpression of miRNAs during transition from pluripotency to definitive endoderm (DE) shouldhelp to elucidate the mechanisms underlying lineage specification and ultimately enhance dif-ferentiation protocols. In this report, next generation sequencing was used to build upon ourprevious analysis of miRNA expression in human hESCs and DE. From millions of sequencingreads, 747 and 734 annotated miRNAs were identified in pluripotent and DE cells, respectively,including 77 differentially expressed miRNAs. Among these, four of the top five upregulatedmiRNAs were previously undetected in DE. Furthermore, the stem-loop for miR-302a, an impor-tant miRNA for both hESCs self-renewal and endoderm specification, produced several highlyexpressed miRNA species (isomiRs). Overall, isomiRs represented >10% of sequencing reads in>40% of all detected stem-loop arms, suggesting that the impact of these abundant miRNA spe-cies may have been overlooked in previous studies. Because of their relative abundance, therole of differential isomiR targeting was studied using the miR-302 cluster as a model system. AmiRNA mimetic for miR-302a-5p, but not miR-302a-5p(13), decreased expression of orthoden-ticle homeobox 2 (OTX2). Conversely, isomiR 302a-5p(13) selectively decreased expression oftuberous sclerosis protein 1, but not OTX2, indicating nonoverlapping specificity of miRNA proc-essing variants. Taken together, our characterization of miRNA expression, which includes novelmiRNAs and isomiRs, helps establish a foundation for understanding the role of miRNAs in DEformation and selective targeting by isomiRs. STEM CELLS 2014;32:2360–2372
INTRODUCTION
MicroRNAs (miRNAs) are small noncodingRNAs that regulate expression of protein cod-ing genes [1]. miRNA biogenesis begins withtranscription of a primary transcript containinga stem-loop that is subsequently released byDrosha cleavage [2]. The resulting hairpin RNAis transported to the cytoplasm by Exportin-5and processed into a miRNA-5p:miRNA-3pduplex by Dicer. The mature �22 nucleotide(nt) miRNA strand of the duplex is then prefer-entially incorporated into the RNA-inducedsilencing complex, and serves as a sequence-specific guide for the negative regulation oftarget mRNAs. There are currently several hun-dred experimentally validated miRNA genes inthe human genome, predicted to target manythousands of mRNAs. Investigation of miRNAfunction has primarily focused on annotatedmiRNAs. However, there remains an active
search for new miRNAs and increasing evi-dence suggests a biological role for isomiRs,which result from alternative Drosha and Dicerprocessing [3].
Human embryonic stem cells (hESCs) aredefined by their self-renewal and potential todifferentiate into any cell type, and are there-fore a potential source for therapeutically use-ful cells, such as b cells for the treatment fortype 1 diabetes. However, a clearer understand-ing of the molecular mechanisms and signalingpathways which regulate cell differentiationand lineage specification is desirable to developmore efficient protocols for directed differentia-tion. Temporal expression of various miRNAsduring hESCs differentiation is likely to play acritical role in cell fate decisions. In fact, miR-NAs play a role in the maintenance of hESCspluripotency and proliferation [4–6], and spe-cific miRNAs have also been shown to influencelineage specification, including endocrine
aPediatric Diabetes ResearchCenter, University ofCalifornia, San Diego, LaJolla, California, USA;bNatural Selection, Inc., SanDiego, California, USA
Correspondence: Charles C.King, Ph.D., Pediatric DiabetesResearch Center, University ofCalifornia, San Diego, La Jolla,California 92121, USA.Telephone: 858-822-4720; Fax:858-822-1966; e-mail:[email protected]
Received June 13, 2012;accepted for publication April 9,2014; first published online inSTEM CELLS EXPRESS May 8,2014.
VC AlphaMed Press1066-5099/2014/$30.00/0
http://dx.doi.org/10.1002/stem.1739
STEM CELLS 2014;32:2360–2372 www.StemCells.com VC AlphaMed Press 2014
EMBRYONIC STEM CELLS/INDUCED
PLURIPOTENT STEM CELLS
pancreas [7–11]. To date, the function of the vast majority ofmiRNAs detected in stem cells remains poorly characterized.An important step in elucidating their function is to establishdifferences in expression patterns as new cell types are createdthroughout differentiation.
In this study, we used a cell culture model-system of invitro development for stage-to-stage differentiation of pluripo-tent hESCs to pure populations of definitive endoderm (DE),the first stage in pancreatic genesis. Previously, we used micro-arrays to identify distinctive miRNA expression signatures inthese two cell populations [7]. A limitation of this approachwas the inability to detect novel miRNAs and a large numberof known miRNAs that were not yet available for chip-basedanalysis. Here, we extend our findings using next generationsequencing for both cell populations as the best currentapproach to distinguish closely related miRNAs and discovernovel isoforms. We analyzed millions of sequencing reads frompluripotent and DE cells and identified the differential expres-sion of �77 significantly expressed miRNAs. Four of the fivemost highly upregulated miRNAs (hsa-miR-1263, hsa-miR-1247-3p, hsa-miR-212-5p, and hsa-miR-132-3p) were previouslyundetected in DE. Interestingly, several miRNAs that have beenpreviously described as hESCs specific were maintained at highlevels specifically in DE following differentiation. We alsoobserved expression of novel miRNAs and isomiRs. Moreover,the stem loop for miR-302a, an important miRNA for bothhESCs self-renewal and endoderm specification [10, 12], pro-duced several highly expressed miRNA species. Specifically,miR-302a-5p (13) was expressed at much higher levels thanother isomiRs of the miR-302a locus. Tuberous sclerosis 1(TSC1) and orthodenticle homeobox 2 (OTX2) were identifiedas a specific target of miR-302a-5p (13) and 302a-5p, respec-tively, thus indicating distinct biological roles of these isomiRs.Taken together, deep sequencing analysis has significantlyexpanded the number of annotated miRNAs included in themolecular profile of hESCs and DE. Given the current lack offunctional characterization of most miRNAs, the abundance anddynamic expression of unannotated isomiR species suggests animportant biological role also for these novel miRNAs.
MATERIALS AND METHODS
Cell Culture
CyT49 (provided by ViaCyte, San Diego, CA), H1, and H9 cellswere maintained on a sparse layer of mitomycin-C-treatedmouse feeder layers at 37�C, 5% CO2 in Dulbecco’s modifiedEagle’s medium (DMEM)/F-12 supplemented with 20% knock-out serum replacement, glutamax, nonessential amino acids,b-mercaptoethanol, and penicillin/streptomycin (Life Technolo-gies, Carlsbad, CA, http://www.lifetechnologies.com/us/en/home.html). Medium was replaced daily with 4 ng/ml basicfibroblast growth factor (Peprotech, Rocky Hill, NJ, http://www.peprotech.com/en-US) and 10 ng/ml activin A (R&D Sys-tems, Minneapolis, MN, http://www.rndsystems.com/). Forfeeder-free cultures, hESCs were plated on BD matrigel andmaintained in medium conditioned by mouse embryonicfibroblasts as described [13]. Differentiation to DE was carriedout in RPMI (Roswell Park Memorial Institute; Mediatech,Inc., Manassas, VA, http://www.cellgro.com/) with varyingconcentrations of defined FBS (HyClone, Logan, UT, http://
www.thermoscientific.com/content/tfs/en/about-us/general-landing-page/thermo-scientific-hyclone.html?ca=hyclone): 0%at days 0–1, 0.2% at days 1–3, and 2% at days 3–4. Addition-ally, cells were treated with 100 ng/ml Activin A for 4 days,and 25 ng/ml Wnt3a (R&D Systems) from days 0 to 1 only.Differentiation to ectoderm lineage was done with the sameprotocol as DE differentiation, except that Wnt3a and ActivinA were replaced with 100 ng/ml Noggin and 5 mM Activininhibitor (SB431542; Sigma Aldrich, St. Louis, MO, http://www.sigmaaldrich.com/united-states.html) for 4 days.
HeLa cells were maintained in DMEM (BioWhittaker; Rad-nor, PA, https://us.vwr.com/store/catalog/product.jsp?produc-t_id=4679035) containing 10% heat-inactivated fetal bovineserum (FBS; Omega Scientific, Inc., Tarzana, CA, http://www.omegascientific.com/). Cells were grown to 60%–70% conflu-ence and transfected with HiPerFect transfection reagentaccording to the manufacturer’s protocol (Qiagen, Valencia,CA, http://www.qiagen.com/). MiScript miRNA mimics formiR-302a-5p (ACUUAAACGUGGAUGUACUUGCU), miR-302a-5p(13) (UAAACGUGGAUGUACUUGCUUU), and miR-302a-3p(UAAGUGCUUCCAUGUUUUGGUGA) were purchased from Qia-gen. Mimics were transfected at 10 nM, and cells were lysed24 hours post-transfection in buffer containing 150 mM NaCl,25 mM Tris-HCl, pH 7.5, 1 mM EDTA, 0.1 mM EGTA, 5 mMMgCl2, 1 mM dithiothreitol, 10% glycerol, 150 IU/ml aprotinin,2 mg/ml leupeptin, and 1 mM PMSF (phenylmethylsulfonylfluoride) with 1% Triton X-100. Cell lysates were centrifugedat 14,000 rpm for 10 minutes, and the detergent-solublesupernatants were collected. Proteins were separated by SDS-polyacrylamide gel electrophoresis (PAGE) and transferred toPVDF (polyvinylidene difluoride) and Western blotted andquantified using an AlphaInnotech FlourChemQ. The OTX2antibody was from Santa Cruz Biotech (Santa Cruz, CA, http://www.scbt.com/) and the TSC1 antibody was from Cell Signal-ing (Danvers, MA, http://www.cellsignal.com/).
RNA Preparation
Cells were lysed in Trizol and RNA was extracted by the manu-facturer’s recommended protocol (Life Technologies). ResultantRNA was treated with Turbo DNase (Life Technologies) for 30minutes. DNase-treated RNA was purified by sequential extrac-tion in acid phenol/chloroform (5:1), followed by chloroformalone, then precipitated in 4 volumes ethanol. Small RNA libra-ries were prepared using the Small RNA 1.0 Sample Prepara-tion Kit (Illumina, Inc., San Diego, CA, http://www.illumina.com/). A band of RNA ranging from 18 to 30 nt was cut froma 15% TBE-urea gel and RNA was extracted according to themanufacturer’s recommended protocol. After ligation of 50 and30 adaptors, bands of 40–60 and 70–90 nt, respectively, werecut from the gel and RNA was again extracted as describedabove, followed by RT-PCR amplification. Finally, a �92 bpband of small RNA library was purified from the gel. The librarywas validated on an Agilent 2100 Bioanalyzer using theDNA100 chip and quantified using a Roche LightCycler 480. Tenpicomoles were run per flow cell in an Illumina GAII sequencerusing a v4 Cluster generation kit and a v5 sequencing kit for 36cycles with Illumina Sequencing Primer Read 1 Mix.
Sequence Data Analysis
Preprocessing of Reads. The microarray data are MIAME com-pliant and has been deposited at gene expression omnibus
Hinton, Hunter, Afrikanova et al. 2361
www.StemCells.com VC AlphaMed Press 2014

(accession# GSE16681). The Illumina output was converted toFASTA format for analysis. Reads were collapsed into uniquesequences and reads with four or more contiguous As or Ns or sixor more continuous As and Ns in any combination in any locationwere discarded. Adapter sequences (P-UCGUAUGCCGUCUUCUG-CUUGUidT) were then trimmed and resulting reads �17 nucleo-tides long were grouped by seed region into clusters, and withineach cluster exact duplicates were merged.
Assignment of Reads to miRNA Genes
Nonduplicate reads from each cluster were then assigned tohuman miRNA stem-loops (miRBase build 18) through pair-wise alignment using the following criteria: (a) exact identityof the seed regions between the two sequences (nucleotides2–8), (b) >80% sequence identity within nucleotides 9–18(inclusive), (c) >65% identity for any remaining nucleotidesoutside of these regions, (d) when a read aligned to two ormore known stem-loop sequences, the read was assigned tothe stem-loop(s) with the highest sequence similarity, (e) thefollowing parameters were used for the alignments: match fornon-N nucleotides5 15, mismatch for non-N nucle-otides5 24, match for any nucleotide with N5 21, gapopen penalty5 216, gap extension5 24.
Quantification of miRNA Species
Reads were grouped by the 50 starting position withineach miRNA stem-loop. For each stage, the counts ofuniquely aligned reads were summed for each startingposition. The counts of reads aligning to multiple stem-loops were partitioned among the matches by the propor-tion of counts of the unique matches to a given stem-loopdivided by the total number of unique reads to allmatches. The samples were normalized by dividing by thetotal number of reads from each stage and expressed asreads per million (RPM).
Analysis of Annotated Mature miRNAs and isomiRs
The offset of each isomiR was calculated as the difference ofthe starting position of the isomiR and the start of the nearestannotated mature miRNA in the stem-loop. IsomiR sequenceswere determined as a fragment of the matching stem-loopfrom the isomiR starting position through the average lengthof reads with the same starting position weighted by the RPMof each read. Read clusters beginning with the same 50 startingposition within the stem-loop (offset of 0) as the nearest anno-tated miRNA were assigned to that miRNA. Alternate startingpositions were considered isomiRs. Expression levels of isomiRsand annotated miRNAs were determined by summing the RPMof the isomiRs from all the stem-loops with the samesequence. For analysis by hairpin arm, human miRNA stem-loops (miRBase build 18) were folded using the default settingsfor RNAfold [14–16] or RNAshapes [17, 18]. Then each struc-ture was partitioned into 50 arms, 30 arms, and loops. IsomiRsequences with �75% overlap with the 50 or 30 arms wereassigned to the respective arm.
Identification of Novel miRNAs on Opposite Arms ofAnnotated miRNAs
Novel miRNAs were identified from isomiRs on the oppositearm of stem-loops from the nearest annotated miRNAs by thefollowing criteria: (a) Expression >1RPM in either time point.
(b) Presence of 0–3nt 30 overhangs with the annotated miRNAwithin the stem-loop structure, highest consideration given to2nt overhangs. (c) Abundance among isomiRs on the samearm.
Quantitative PCR Analysis
cDNA for mRNA analysis was created using Superscript III reversetranscriptase (Life Technologies). For analysis of the miR-302astem-loop, cDNA was made with the TaqMan MicroRNA Assay kitfrom Life Technologies. For analysis of other miRNAs, cDNA wasmade with the NCode kit from Life Technologies. Quantitative PCRwas performed on a StepOne Plus thermocycler (Life Technolo-gies) with SYBR green mastermix or Taqman mastermix (Life Tech-nologies). mRNA Ct values were normalized to housekeepinggenes Cyclophilin G and TATA-binding protein. miRNA Ct valueswere normalized to RNU48 RNA, U6 RNA, or 5S RNA. Oligonucleo-tide sequences for SYBR green PCR are provided in SupportingInformation Table S1.
Northern Blot Analysis of miRNAs
PAGE northern methods were performed as previouslydescribed [19]. Starfire-labeled DNA oligos from IDT (Coral-ville, IA, http://www.idtdna.com/site) were used as probes formiR-302a-5p (AAGTACATCCACGTTTAAGT-Starfire), and miR-302a-5p (13) (AAAGCAAGTACATCCACGT-Starfire). Ethidiumbromide staining of the gel prior to transfer was used todetect small rRNAs to assess quality of the total RNA samples.
Luciferase Assays
The putative target site from the human OTX2 30 UTR wasPCR amplified using the following primers: 50-CTAGTAAGGAGTCAATATGTAGTTTAAGAGAA-30 and 50-AGCTTTCTCTTAAACTACATATTGACTCCTTA-30 (synthesized by Valuegene, San Diego, CA,http://www.valuegene.com/) and cloned downstream of thestop codon in pMIRR-Luc (Ambion, Austin, TX) to generateEFLuc-OTX. This LucOTX construct was used to generate themutant LucOTX plasmid (EFLuc-OTXmut) through site-directedmutagenesis of three nucleotides in the miRNA seedsequence. The putative target site from the human TSC1 30
UTR was PCR amplified using the following primers: 50-CTAGTACAGGAGGTGTGAATGCACGTTTCAAA-30 and 50-AGCTTTTGAAACGTGCATTCACACCTCCTGTA-30 and cloned downstreamof the stop codon in pMIRR-Luc (Ambion, http://www.lifetech-nologies.com/us/en/home/brands/ambion.html) to generateEFLuc-TSC. This LucTSC construct was used to generate themutant LucTSC plasmid (EFLuc-TSCmut) through site-directedmutagenesis of three nucleotides in the miRNA seed sequence.Cyt49 cells were cultured in 12-well plates and each well trans-fected using the Neon electroporator (Life Technologies, Inc.)with 450 ng of luciferase plasmid and 25 ng of CMV-b-galactosidase vector for normalization. Cells were harvested andassayed 45–48 hours after transfection. Results represent threeindependent experiments over all time points. Luciferase assayswere performed as previously described [20].
RESULTS
Differentiation of Pluripotent hESCs into DE
The CyT49 hESCs line has been differentiated previously onmouse embryonic feeders with high efficiency to DE and
2362 sRNA-seq Analysis of Human Embryonic Stem Cells
VC AlphaMed Press 2014 STEM CELLS
subsequent pancreatic stages [7, 21]. To analyze miRNA expres-sion during DE differentiation, CyT49 cells were treated withActivin A in low serum for 4 days while samples were collectedon day 0 (hESCs) and day 4 (DE) for RNA analysis. Differentia-tion was monitored by qRT-PCR for linage-specific markers.Pluripotency markers decreased while DE markers increased(Fig. 1A). Size-selected fractions of the RNA were then usedfor analysis of small RNAs. Analysis of small RNA librariesyielded 3,183,398 small RNA reads from hESCs and 4,111,732small RNA reads from DE, representing 812 annotated miRNAs.Six hundred and sixty-nine miRNAs were detected in bothhESCs and DE, while 78 miRNA were detected only in hESCsand 65 miRNAs were detected only in DE (Supporting Informa-tion Table S2). Approximately 20% of annotated miRNAs (miR-Base release 18) were highly expressed at >100 RPM, �50%were abundantly expressed at >10 RPM, and �75% wereexpressed at >1 RPM.
Differential miRNA Expression Occurs During DEFormation
Similar expression levels in both hESCs and DE for most anno-tated miRNAs are indicated by proximity to the line of corre-lation in Figure 1B. Outliers significantly above or below theline of correlation represent differentially regulated miRNAs.We chose to focus on highly expressed miRNAs (>100 RPM)for further differential expression analysis. Thirty-seven miR-NAs were upregulated in DE more than twofold relative tohESCs (Table 1), 40 were downregulated more than twofold(Table 2), and 74 changed by less than twofold (SupportingInformation Table S3). Putative targets of the 37 upregulatedand 40 downregulated were analyzed and compiled usingmiRWalk (http://www.umm.uni-heidelberg.de/apps/zmf/mir-walk/index.html) (Supporting Information Files S1 and S2)[22]. Figure 1C shows qRT-PCR validation in two separatehESCs lines (Cyt49 and H1) of the top four upregulated andtop four downregulated miRNAs detected by deep sequenc-ing at greater than 150 RPM. Several miRNAs were highlyexpressed in both pluripotent hESCs and in DE. Furthermore,analysis of the representation of seed sequences, whichinclude nucleotides two to eight of the mature miRNAs andmediate most target recognition [1], revealed that the twostages shared 6 of the 10 most abundant seed sequences(Supporting Information Tables S4, S5), including AAGUGC,previously described as a common hESCs seed sequence[23].
Comparison of Annotated miRNAs from Microarrayand Deep Sequencing
We previously profiled miRNA expression in hESCs and DEusing a microarray platform [7]. While the previous analysisdetected only 229 annotated miRNAs in hESCs and 200 miR-NAs in DE, the current analysis identified 747 miRNAs inhESCs and 744 miRNAs in DE (Figure 1D). Of the 602 miRNAsdetected by sequencing but not by microarray, 550 wereannotated recently in miRBase and therefore were not origi-nally present on the microarray platform. Furthermore,approximately 20% of the microarray queried miRNAs thatwere detected by sequencing alone were present at �50RPM. Thus, the discovery of novel miRNAs and limited sensi-tivity account for the majority of discrepancies between thesetwo methods for miRNA analysis.
Characterization of isomiRs
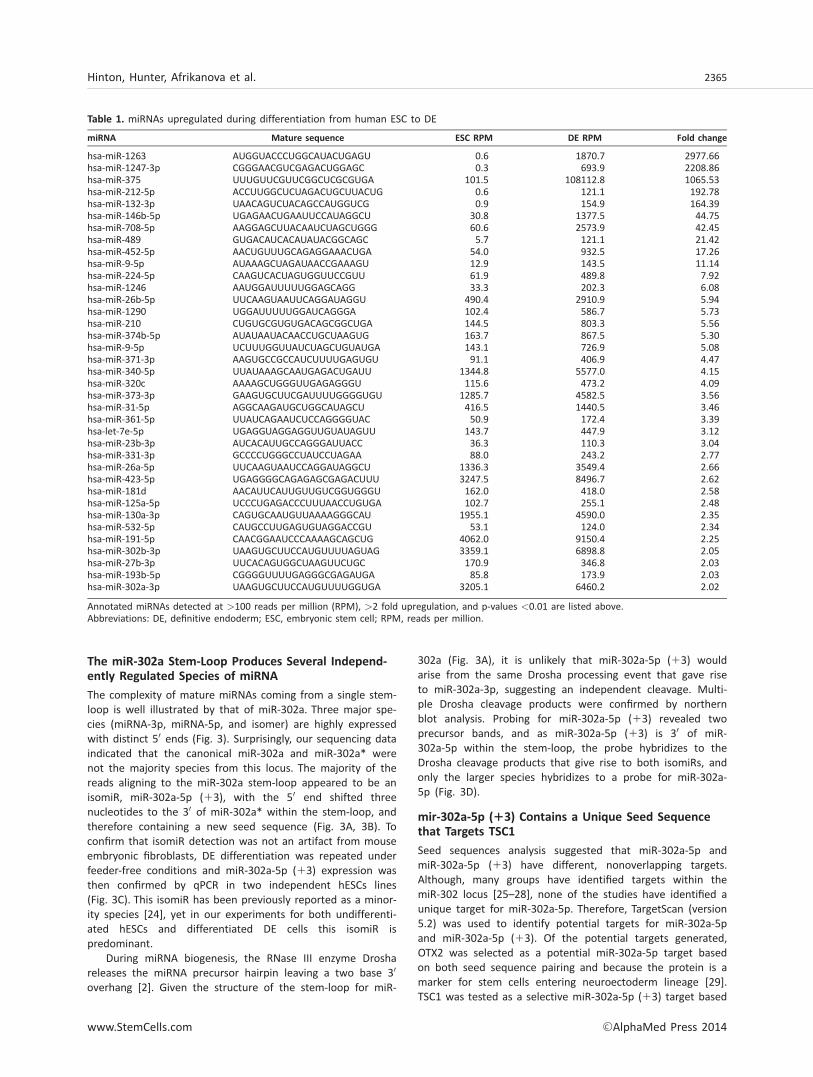
We noted that approximately 68,000 reads did not share thesame starting position as the nearest annotated miRNA, yetaccounted for �14% of all reads aligning to annotated miRNAstem-loops (Supporting Information Table S6). We chose tofocus on the 50 end heterogeneity because the 50 end deter-mines the seed sequence and as such isomiRs with different50 ends are likely to bind a distinct range of mRNA targets.For simplicity, we refer to isomiRs as sequences with a 50 endoffset from a reference miRNA. While the majority of thereads from a stem-loop began at the annotated miRNA, a sig-nificant fraction of reads began at alternate positions on boththe 50 and 30 arms (Fig. 2A, 2B). Because the annotatedmiRNA was not always the most abundant sequence in eacharm, we then compared the starting position of reads relativeto the most abundant starting position. Analysis of the 30 armrevealed strong consistency between the annotated start siteand the most abundant start site (Fig. 2A). The accuracy ofannotation of the most abundant species for this arm sug-gests that the other isomiRs are minor processing products;however, they constitute more than 10% of the reads aligningto the 30 arm. The reads from the 50 arm of the miRNA stem-loop began from the most abundant starting position �92%of the time, compared to �83% for the annotated start site(Fig. 2B). This shift suggests mis-annotation of the startingpositions of the most abundant isomiR for the differentialmiRNAs.
However, miRNAs with lower expression levels are betterrepresented by analyzing isomiR abundance within each stem-loop arm. IsomiRs constituted >10% of the reads in >40% ofall detected miRNA stem-loop arms (Fig. 2C). IsomiR abun-dance was lower within stem-loop arms of highly expressedmiRNAs (>100 RPM) yet isomiRs constituted >10% of thereads in >20% of stem-loop arms (Fig. 2C). In total, 3,333 dis-tinct isomiRs were detected (Supporting Information TableS6). Among these, 52 isomiRs were detected at >100 RPM(Supporting Information Table S7), and 66 isomiRs expressed>10 RPM were also expressed at higher levels than the near-est annotated miRNA on the same stem-loop arm (SupportingInformation Table S6). While a few of the highly expressedisomiRs were unannotated star forms for annotated miRNAs(Supporting Information Table S8), the majority of isomiRslikely arose from alternative Drosha/Dicer processing.
Noting that several potential isomiRs were located withina stem-loop with only one annotated arm, we surmised thatthese were likely miRNAs that would previously have beenannotated as miRNA*s. Upon further examination of thesespecies, we were able to identify 41 novel miRNAs withinunannotated stem-loop arms expressed over 1 RPM (Support-ing Information Table S8). Interestingly, several of these miR-NAs were expressed higher than the canonical miRNA,highlighting the importance of miRNAs from both strands.Furthermore, miRNA-5p and miRNA-3p (formerly miRNA andmiRNA*) expression profiles are poorly correlated duringdifferentiation, suggesting frequent, independent post-transcriptional regulation (Fig. 2D). The miR-302–367 clusterstands out, as four of five members with detectable expres-sion from both strands showed more than twofold differencein fold change (DE/hESCs) between the 5p and 3p strand ofthe stem-loop.
Hinton, Hunter, Afrikanova et al. 2363
www.StemCells.com VC AlphaMed Press 2014
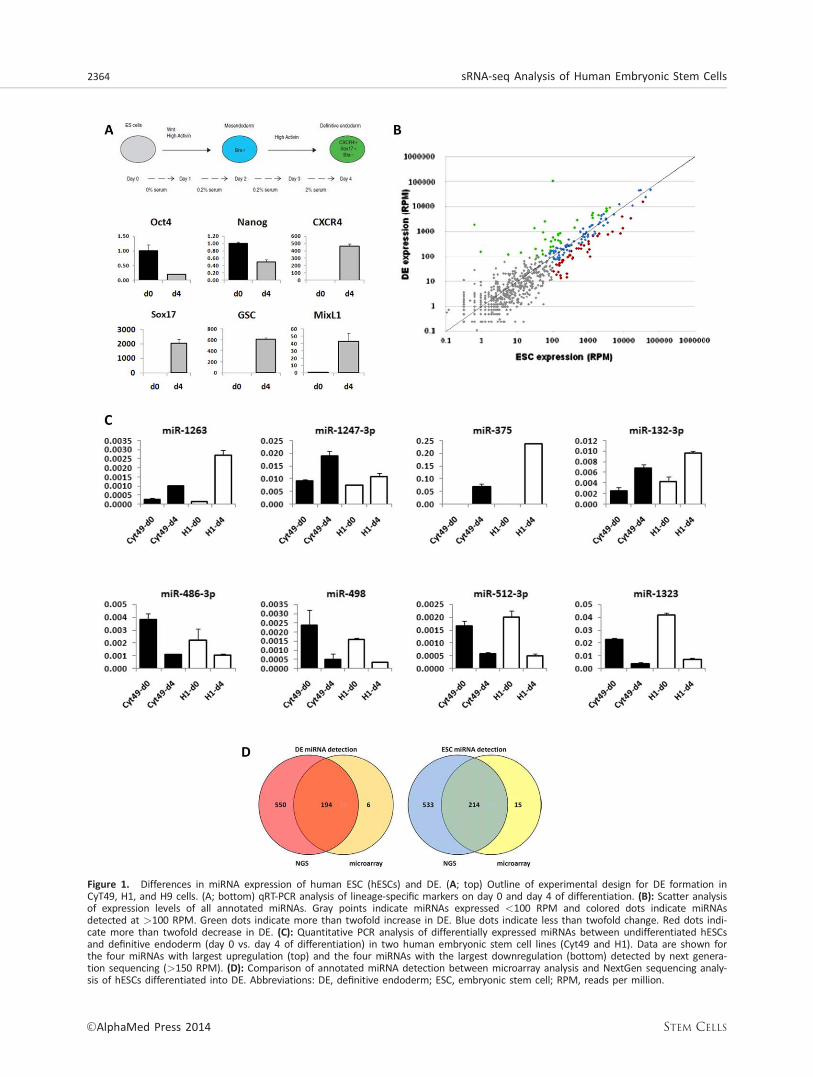
Figure 1. Differences in miRNA expression of human ESC (hESCs) and DE. (A; top) Outline of experimental design for DE formation inCyT49, H1, and H9 cells. (A; bottom) qRT-PCR analysis of lineage-specific markers on day 0 and day 4 of differentiation. (B): Scatter analysisof expression levels of all annotated miRNAs. Gray points indicate miRNAs expressed <100 RPM and colored dots indicate miRNAsdetected at >100 RPM. Green dots indicate more than twofold increase in DE. Blue dots indicate less than twofold change. Red dots indi-cate more than twofold decrease in DE. (C): Quantitative PCR analysis of differentially expressed miRNAs between undifferentiated hESCsand definitive endoderm (day 0 vs. day 4 of differentiation) in two human embryonic stem cell lines (Cyt49 and H1). Data are shown forthe four miRNAs with largest upregulation (top) and the four miRNAs with the largest downregulation (bottom) detected by next genera-tion sequencing (>150 RPM). (D): Comparison of annotated miRNA detection between microarray analysis and NextGen sequencing analy-sis of hESCs differentiated into DE. Abbreviations: DE, definitive endoderm; ESC, embryonic stem cell; RPM, reads per million.
2364 sRNA-seq Analysis of Human Embryonic Stem Cells
VC AlphaMed Press 2014 STEM CELLS
The miR-302a Stem-Loop Produces Several Independ-ently Regulated Species of miRNA
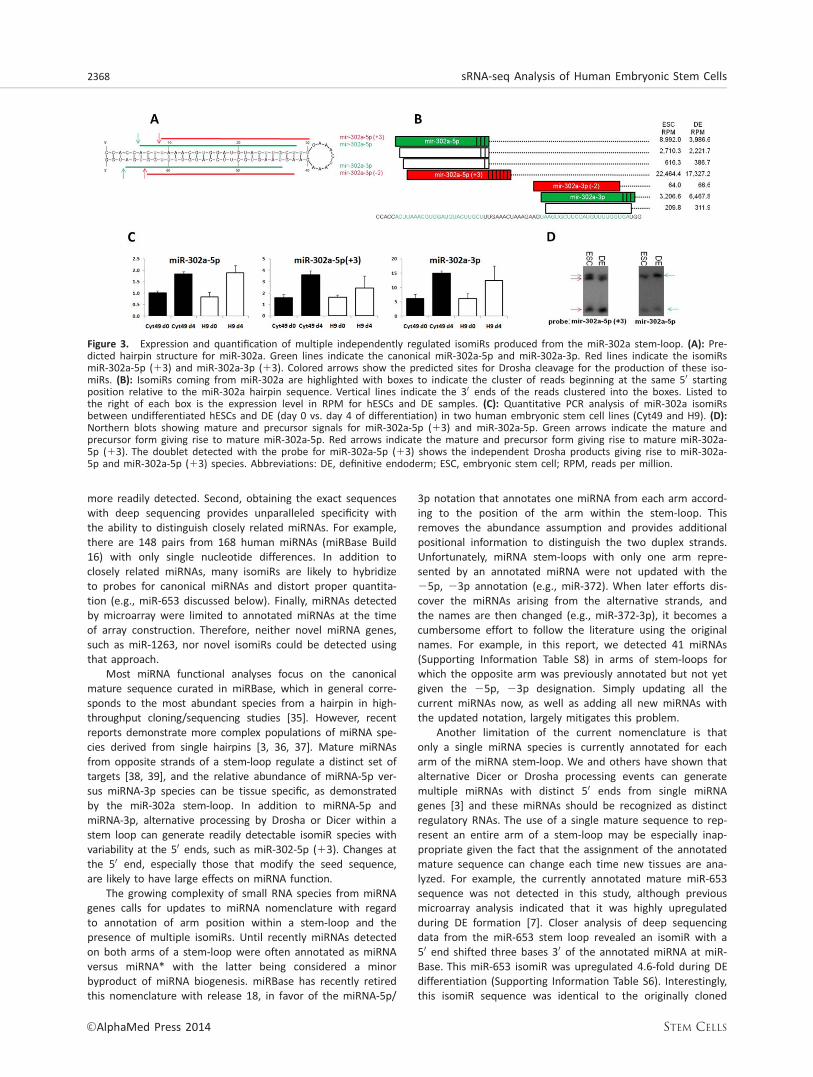
The complexity of mature miRNAs coming from a single stem-loop is well illustrated by that of miR-302a. Three major spe-cies (miRNA-3p, miRNA-5p, and isomer) are highly expressedwith distinct 50 ends (Fig. 3). Surprisingly, our sequencing dataindicated that the canonical miR-302a and miR-302a* werenot the majority species from this locus. The majority of thereads aligning to the miR-302a stem-loop appeared to be anisomiR, miR-302a-5p (13), with the 50 end shifted threenucleotides to the 30 of miR-302a* within the stem-loop, andtherefore containing a new seed sequence (Fig. 3A, 3B). Toconfirm that isomiR detection was not an artifact from mouseembryonic fibroblasts, DE differentiation was repeated underfeeder-free conditions and miR-302a-5p (13) expression wasthen confirmed by qPCR in two independent hESCs lines(Fig. 3C). This isomiR has been previously reported as a minor-ity species [24], yet in our experiments for both undifferenti-ated hESCs and differentiated DE cells this isomiR ispredominant.
During miRNA biogenesis, the RNase III enzyme Droshareleases the miRNA precursor hairpin leaving a two base 30
overhang [2]. Given the structure of the stem-loop for miR-
302a (Fig. 3A), it is unlikely that miR-302a-5p (13) wouldarise from the same Drosha processing event that gave riseto miR-302a-3p, suggesting an independent cleavage. Multi-ple Drosha cleavage products were confirmed by northernblot analysis. Probing for miR-302a-5p (13) revealed twoprecursor bands, and as miR-302a-5p (13) is 30 of miR-302a-5p within the stem-loop, the probe hybridizes to theDrosha cleavage products that give rise to both isomiRs, andonly the larger species hybridizes to a probe for miR-302a-5p (Fig. 3D).
mir-302a-5p (13) Contains a Unique Seed Sequencethat Targets TSC1
Seed sequences analysis suggested that miR-302a-5p andmiR-302a-5p (13) have different, nonoverlapping targets.Although, many groups have identified targets within themiR-302 locus [25–28], none of the studies have identified aunique target for miR-302a-5p. Therefore, TargetScan (version5.2) was used to identify potential targets for miR-302a-5pand miR-302a-5p (13). Of the potential targets generated,OTX2 was selected as a potential miR-302a-5p target basedon both seed sequence pairing and because the protein is amarker for stem cells entering neuroectoderm lineage [29].TSC1 was tested as a selective miR-302a-5p (13) target based
Table 1. miRNAs upregulated during differentiation from human ESC to DE
miRNA Mature sequence ESC RPM DE RPM Fold change
hsa-miR-1263 AUGGUACCCUGGCAUACUGAGU 0.6 1870.7 2977.66hsa-miR-1247-3p CGGGAACGUCGAGACUGGAGC 0.3 693.9 2208.86hsa-miR-375 UUUGUUCGUUCGGCUCGCGUGA 101.5 108112.8 1065.53hsa-miR-212-5p ACCUUGGCUCUAGACUGCUUACUG 0.6 121.1 192.78hsa-miR-132-3p UAACAGUCUACAGCCAUGGUCG 0.9 154.9 164.39hsa-miR-146b-5p UGAGAACUGAAUUCCAUAGGCU 30.8 1377.5 44.75hsa-miR-708-5p AAGGAGCUUACAAUCUAGCUGGG 60.6 2573.9 42.45hsa-miR-489 GUGACAUCACAUAUACGGCAGC 5.7 121.1 21.42hsa-miR-452-5p AACUGUUUGCAGAGGAAACUGA 54.0 932.5 17.26hsa-miR-9-5p AUAAAGCUAGAUAACCGAAAGU 12.9 143.5 11.14hsa-miR-224-5p CAAGUCACUAGUGGUUCCGUU 61.9 489.8 7.92hsa-miR-1246 AAUGGAUUUUUGGAGCAGG 33.3 202.3 6.08hsa-miR-26b-5p UUCAAGUAAUUCAGGAUAGGU 490.4 2910.9 5.94hsa-miR-1290 UGGAUUUUUGGAUCAGGGA 102.4 586.7 5.73hsa-miR-210 CUGUGCGUGUGACAGCGGCUGA 144.5 803.3 5.56hsa-miR-374b-5p AUAUAAUACAACCUGCUAAGUG 163.7 867.5 5.30hsa-miR-9-5p UCUUUGGUUAUCUAGCUGUAUGA 143.1 726.9 5.08hsa-miR-371-3p AAGUGCCGCCAUCUUUUGAGUGU 91.1 406.9 4.47hsa-miR-340-5p UUAUAAAGCAAUGAGACUGAUU 1344.8 5577.0 4.15hsa-miR-320c AAAAGCUGGGUUGAGAGGGU 115.6 473.2 4.09hsa-miR-373-3p GAAGUGCUUCGAUUUUGGGGUGU 1285.7 4582.5 3.56hsa-miR-31-5p AGGCAAGAUGCUGGCAUAGCU 416.5 1440.5 3.46hsa-miR-361-5p UUAUCAGAAUCUCCAGGGGUAC 50.9 172.4 3.39hsa-let-7e-5p UGAGGUAGGAGGUUGUAUAGUU 143.7 447.9 3.12hsa-miR-23b-3p AUCACAUUGCCAGGGAUUACC 36.3 110.3 3.04hsa-miR-331-3p GCCCCUGGGCCUAUCCUAGAA 88.0 243.2 2.77hsa-miR-26a-5p UUCAAGUAAUCCAGGAUAGGCU 1336.3 3549.4 2.66hsa-miR-423-5p UGAGGGGCAGAGAGCGAGACUUU 3247.5 8496.7 2.62hsa-miR-181d AACAUUCAUUGUUGUCGGUGGGU 162.0 418.0 2.58hsa-miR-125a-5p UCCCUGAGACCCUUUAACCUGUGA 102.7 255.1 2.48hsa-miR-130a-3p CAGUGCAAUGUUAAAAGGGCAU 1955.1 4590.0 2.35hsa-miR-532-5p CAUGCCUUGAGUGUAGGACCGU 53.1 124.0 2.34hsa-miR-191-5p CAACGGAAUCCCAAAAGCAGCUG 4062.0 9150.4 2.25hsa-miR-302b-3p UAAGUGCUUCCAUGUUUUAGUAG 3359.1 6898.8 2.05hsa-miR-27b-3p UUCACAGUGGCUAAGUUCUGC 170.9 346.8 2.03hsa-miR-193b-5p CGGGGUUUUGAGGGCGAGAUGA 85.8 173.9 2.03hsa-miR-302a-3p UAAGUGCUUCCAUGUUUUGGUGA 3205.1 6460.2 2.02
Annotated miRNAs detected at >100 reads per million (RPM), >2 fold upregulation, and p-values <0.01 are listed above.Abbreviations: DE, definitive endoderm; ESC, embryonic stem cell; RPM, reads per million.
Hinton, Hunter, Afrikanova et al. 2365
www.StemCells.com VC AlphaMed Press 2014
on a strong seed pairing sequence (Fig. 4A, 4B). To explorewhether the isomiRs generated at the miR-302a stem loop tar-geted these different mRNAs, specific miRNA mimetics weretransfected into HeLa cells and protein expression of OTX2 andTSC1 was measured (Fig. 4C, 4D). OTX2 protein levels droppedby 40% in HeLa cells transfected with the miR-302a-5p mimetic(lane 2), but were unchanged in cells transfected with miR-302a-5p (13) (lane 3). The miR-302a-5p (13) mimeticdecreased expression of TSC1 by 25% (lane 3), but had noeffect on OTX2 levels (lane 2). Transfection with a controlmimetic did not alter expression of either protein (lane 1).
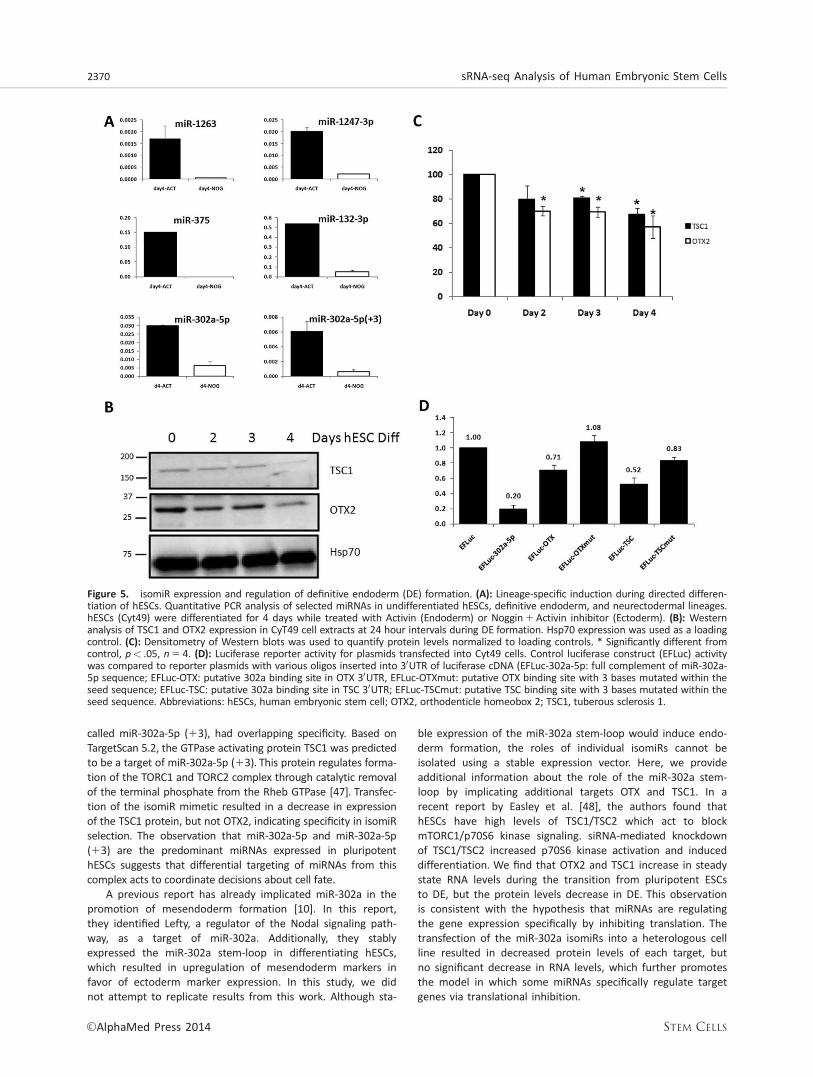
Expression of selected miRNAs was examined in hESCsundergoing differentiation into DE and ectoderm was exam-ined to explore the role of selected miRNAs in hESCs cell fatedecisions (Fig. 5A). Expression of highly expressed miRNAs,miR-1263, miR-1247, miR-375, miR-132-3p, and miR-302a wasfound to be selectively enriched in DE compared with ecto-derm, suggesting a possible role in targeting mRNAs thatmust be downregulated during DE specification. Targeting ofOTX2 and TSC1 by miR-302a-5p and miR-302a-5p (13) duringdifferentiation was further explored during DE formation. Con-
sistent with a role for miRNAs in inhibition of protein transla-tion, mRNA levels of TSC1 and OTX2 increased during DEformation (data not shown); however, protein levels of TSC1dropped by 30% and OTX2 levels decreased by more than40% during the 4-day differentiation protocol (Fig. 5B, 5C).Incubation of CyT49 cells with MG-132, an inhibitor of theproteasome, had no effect on the decrease in TSC1 or OTX2degradation, suggesting that increased protein degradationwas not responsible for the observed decrease in protein(data not shown). To further support the direct targeting ofOTX2 and TSC1 in hESCs, the putative binding sites for miR-302a isomiRs from each gene was inserted into the 30UTR ofa luciferase reporter plasmid vector. When compared withcontrol luciferase activity, inclusion of the putative miR-302abinding site from the 30UTR of OTX and TSC both resulted indecreased reporter activity in transfected CyT49 cells.Mutation of three nucleotides in the seed sequence of eachputative binding site resulted in derepression of reporteractivity (Fig. 5D). Taken together, these results suggest thatisomiRs with unique seed sequences differentially targetmRNAs to help regulate differentiation to DE.
Table 2. miRNAs downregulated during differentiation from human ESC (hESCs) to DE
miRNA Mature sequence RPM ESC DE RPM Fold change
hsa-miR-486-3p CGGGGCAGCUCAGUACAGGAU 251.3 14.6 17.22hsa-miR-520a-3p AAAGUGCUUCCCUUUGGACUGU 169.9 13.6 12.47hsa-miR-498 UUUCAAGCCAGGGGGCGUUUUUC 251.3 20.2 12.45hsa-miR-512-3p AAGUGCUGUCAUAGCUGAGGUC 1130.9 98.5 11.48hsa-miR-1323 UCAAAACUGAGGGGCAUUUUCU 8095.8 830.3 9.75hsa-miR-518b CAAAGCGCUCCCCUUUAGAGGU 165.2 17.0 9.71hsa-miR-517a-3p AUCGUGCAUCCCUUUAGAGUGU 127.7 18.4 6.95hsa-miR-92b-3b UAUUGCACUCGUCCCGGCCUCC 9425.8 1356.4 6.95hsa-miR-124-3p UAAGGCACGCGGUGAAUGCC 952.6 149.2 6.38hsa-miR-486-5p UCCUGUACUGAGCUGCCCCGAG 143.9 23.8 6.04hsa-miR-1 UGGAAUGUAAAGAAGUAUGUAU 1074.3 190.2 5.65hsa-let-7a-5pa UGAGGUAGUAGGUUGUAUAGUU 4838.8 985.0 4.91hsa-miR-222-3p AGCUACAUCUGGCUACUGGGU 3581.1 757.8 4.73hsa-miR-221-3p AGCUACAUUGUCUGCUGGGUUUC 15764.0 3370.6 4.68hsa-miR-199a-3p ACAGUAGUCUGCACAUUGGUUA 357.6 81.1 4.41hsa-miR-589-5p UGAGAACCACGUCUGCUCUGAG 105.5 25.3 4.17hsa-miR-516b-5p AUCUGGAGGUAAGAAGCACUUU 370.0 89.8 4.12hsa-miR-363-3p CGGGUGGAUCACGAUGCAAUUU 154.6 43.3 3.57hsa-miR-92a-l-5p AGGUUGGGAUCGGUUGCAAUGCU 1033.5 320.5 3.22hsa-miR-1257 AGUGAAUGAUGGGUUCUGACC 144.5 45.0 3.21hsa-miR-3168 GAGUUCUACAGUCAGAC 182.5 58.9 3.10hsa-miR-15 l-5p UCGAGGAGCUCACAGUCUAGU 628.9 203.3 3.09hsa-miR-28-5p AAGGAGCUCACAGUCUAUUGAG 156.1 54.0 2.89hsa-miR-30c-5p UGUAAACAUCCUACACUCUCAGC 267.0 93.6 2.85hsa-miR-21-5p CAACACCAGUCGAUGGGCUGU 197.6 70.5 2.80hsa-miR-148a-3p UCAGUGCACUACAGAACUUUGU 1836.4 664.7 2.76hsa-miR-335-5p UCAAGAGCAAUAACGAAAAAUGU 307.8 112.1 2.75hsa-miR-129-5p CUUUUUGCGGUCUGGGCUUGC 125.0 47.2 2.65hsa-miR-432-5p UCUUGGAGUAGGUCAUUGGGUGG 185.0 70.3 2.63hsa-miR-1298 UUCAUUCGGCUGUCCAGAUGUA 295.3 112.8 2.62hsa-miR-92b-3b AGGGACGGGACGCGGUGCAGUG 534.0 208.2 2.57hsa-miR-7-5p UGGAAGACUAGUGAUUUUGUUGU 1023.7 401.5 2.55hsa-miR-128 UCACAGUGAACCGGUCUCUUU 2033.0 812.8 2.50hsa-miR-302a-5p ACUUAAACGUGGAUGUACUUGCU 8992.0 3986.6 2.26hsa-miR-21-5p UAGCUUAUCAGACUGAUGUUGA 34900.4 15510.5 2.25hsa-miR-18lb-5p AACAUUCAUUGCUGUCGGUGGGU 467.4 209.1 2.23hsa-miR-19b-3p UGUGCAAAUCCAUGCAAAACUGA 625.9 297.2 2.11hsa-miR-148b-3p UCAGUGCAUCACAGAACUUUGU 333.1 163.4 2.04hsa-miR-30a-5p UGUAAACAUCCUCGACUGGAAG 1359.3 669.9 2.03hsa-miR-941 CACCCGGCUGUGUGCACAUGUGC 151.1 75.0 2.01
Annotated miRNAs detected at >100 RPM, more than or equal to twofold upregulation, and p-values< .01 are listed above.ahsa-let-7a detection in hESCs is likely due to contamination from mouse feeder layers, as described in Hinton et al. [7].Abbreviations: DE, definitive endoderm; ESC, embryonic stem cell; RPM, reads per million.
2366 sRNA-seq Analysis of Human Embryonic Stem Cells
VC AlphaMed Press 2014 STEM CELLS
DISCUSSION
Through self-renewal and broad differentiation capacity, hESCsprovide the potential for an unlimited supply of cells for cell-based therapies for many diseases, including type I diabetes.For the generation of pure hESCs-derived, functional b cellsthe major challenges of low yield of glucose-responsive insu-lin-positive cells and high risk of tumor formation remain [30].As key regulators of cell-fate and function, characterization ofmiRNA expression profiles at all stages of hESCs differentia-tion is important for improvements in the production of fullydifferentiated and functional therapeutic cells.
This study focuses on the formation of DE, the first stepin b-cell differentiation. Consistent with our previously iden-tified DE miRNA signature [7], miR-375, miR-708-5p, miR-371-3p, and miR-373-3p were found to be upregulated morethan twofold in this study. miR-375, described previously asa regulator of endocrine pancreas differentiation [9], wasthe second most differentially expressed miRNA and themost highly expressed miRNA in DE. Several additional miR-NAs were also highly upregulated during hESCs differentia-tion to DE (Table 1). Among them, miR-1263 exhibited the
highest fold change, but was not assayed in the previousstudy.
Several miRNAs (miR-200c-3p, miR-302a-3p, miR-371-5p,miR-372, and miR-373-3p) have been shown previously to bedownregulated during undirected hESCs differentiation andthus described as being “ESC-specific” (ESCC) [4, 24]. How-ever, comparing our dataset (hESCs vs. DE) to other cellstypes resulting from nondirected differentiation of hESCs [31],it is clear that several ESC-specific miRNAs persist or areupregulated specifically in DE, suggesting an important role inendoderm formation. Furthermore, Laurent et al. [23]described a common seed sequence for hESCs that is also apredominant seed in DE (Supporting Information Table S5). Itis possible that the significant overlap of miRNA and seed sig-natures in pluripotency and DE is a result of activin A signal-ing, a known regulatory factor required for maintenance ofpluripotency, DE formation, and miRNA regulation [32–34].
While miRNA expression had been previously profiled inhESCs and DE using a microarray platform [7], next generationsequencing has several advantages compared to probe-basedexpression analysis platforms. First, sRNA-seq offers increasedsensitivity. Thus miRNAs expressed at very low levels can be
Figure 2. Analysis of 50 end variability. Frequency of reads in the (A) 30 arms or (B) 50 arms of annotated stem-loops with 50 end rela-tive to that of the annotated miRNA (red) or the most abundant isomiR (green). (C): miRNAs were ranked in decreasing order by theabundance (%) of isomiR reads from the same stem-loop arm. The cumulative frequency of all miRNAs (purple) or highly expressed miR-NAs (green) was then plotted against the isomiR abundance. (D): Correlation of expression changes from miRNAs and cognate forms onopposite arms. The fold change of miRNA-5p versus miRNA-3p was plotted above. miRNA-5p:miRNA-3p pairs were excluded if notexpressed in both time points and expressed >10 RPM at any time point. The line of correlation is shown with the solid line. Thedashed and dashed-dot lines indicate a 2-fold and 10-fold difference in fold change, respectively. Members of the miR-302/367 clusterare highlighted in red. Abbreviation: RPM, reads per million.
Hinton, Hunter, Afrikanova et al. 2367
www.StemCells.com VC AlphaMed Press 2014
more readily detected. Second, obtaining the exact sequenceswith deep sequencing provides unparalleled specificity withthe ability to distinguish closely related miRNAs. For example,there are 148 pairs from 168 human miRNAs (miRBase Build16) with only single nucleotide differences. In addition toclosely related miRNAs, many isomiRs are likely to hybridizeto probes for canonical miRNAs and distort proper quantita-tion (e.g., miR-653 discussed below). Finally, miRNAs detectedby microarray were limited to annotated miRNAs at the timeof array construction. Therefore, neither novel miRNA genes,such as miR-1263, nor novel isomiRs could be detected usingthat approach.
Most miRNA functional analyses focus on the canonicalmature sequence curated in miRBase, which in general corre-sponds to the most abundant species from a hairpin in high-throughput cloning/sequencing studies [35]. However, recentreports demonstrate more complex populations of miRNA spe-cies derived from single hairpins [3, 36, 37]. Mature miRNAsfrom opposite strands of a stem-loop regulate a distinct set oftargets [38, 39], and the relative abundance of miRNA-5p ver-sus miRNA-3p species can be tissue specific, as demonstratedby the miR-302a stem-loop. In addition to miRNA-5p andmiRNA-3p, alternative processing by Drosha or Dicer within astem loop can generate readily detectable isomiR species withvariability at the 50 ends, such as miR-302-5p (13). Changes atthe 50 end, especially those that modify the seed sequence,are likely to have large effects on miRNA function.
The growing complexity of small RNA species from miRNAgenes calls for updates to miRNA nomenclature with regardto annotation of arm position within a stem-loop and thepresence of multiple isomiRs. Until recently miRNAs detectedon both arms of a stem-loop were often annotated as miRNAversus miRNA* with the latter being considered a minorbyproduct of miRNA biogenesis. miRBase has recently retiredthis nomenclature with release 18, in favor of the miRNA-5p/
3p notation that annotates one miRNA from each arm accord-ing to the position of the arm within the stem-loop. Thisremoves the abundance assumption and provides additionalpositional information to distinguish the two duplex strands.Unfortunately, miRNA stem-loops with only one arm repre-sented by an annotated miRNA were not updated with the25p, 23p annotation (e.g., miR-372). When later efforts dis-cover the miRNAs arising from the alternative strands, andthe names are then changed (e.g., miR-372-3p), it becomes acumbersome effort to follow the literature using the originalnames. For example, in this report, we detected 41 miRNAs(Supporting Information Table S8) in arms of stem-loops forwhich the opposite arm was previously annotated but not yetgiven the 25p, 23p designation. Simply updating all thecurrent miRNAs now, as well as adding all new miRNAs withthe updated notation, largely mitigates this problem.
Another limitation of the current nomenclature is thatonly a single miRNA species is currently annotated for eacharm of the miRNA stem-loop. We and others have shown thatalternative Dicer or Drosha processing events can generatemultiple miRNAs with distinct 50 ends from single miRNAgenes [3] and these miRNAs should be recognized as distinctregulatory RNAs. The use of a single mature sequence to rep-resent an entire arm of a stem-loop may be especially inap-propriate given the fact that the assignment of the annotatedmature sequence can change each time new tissues are ana-lyzed. For example, the currently annotated mature miR-653sequence was not detected in this study, although previousmicroarray analysis indicated that it was highly upregulatedduring DE formation [7]. Closer analysis of deep sequencingdata from the miR-653 stem loop revealed an isomiR with a50 end shifted three bases 30 of the annotated miRNA at miR-Base. This miR-653 isomiR was upregulated 4.6-fold during DEdifferentiation (Supporting Information Table S6). Interestingly,this isomiR sequence was identical to the originally cloned
Figure 3. Expression and quantification of multiple independently regulated isomiRs produced from the miR-302a stem-loop. (A): Pre-dicted hairpin structure for miR-302a. Green lines indicate the canonical miR-302a-5p and miR-302a-3p. Red lines indicate the isomiRsmiR-302a-5p (13) and miR-302a-3p (13). Colored arrows show the predicted sites for Drosha cleavage for the production of these iso-miRs. (B): IsomiRs coming from miR-302a are highlighted with boxes to indicate the cluster of reads beginning at the same 50 startingposition relative to the miR-302a hairpin sequence. Vertical lines indicate the 30 ends of the reads clustered into the boxes. Listed tothe right of each box is the expression level in RPM for hESCs and DE samples. (C): Quantitative PCR analysis of miR-302a isomiRsbetween undifferentiated hESCs and DE (day 0 vs. day 4 of differentiation) in two human embryonic stem cell lines (Cyt49 and H9). (D):Northern blots showing mature and precursor signals for miR-302a-5p (13) and miR-302a-5p. Green arrows indicate the mature andprecursor form giving rise to mature miR-302a-5p. Red arrows indicate the mature and precursor form giving rise to mature miR-302a-5p (13). The doublet detected with the probe for miR-302a-5p (13) shows the independent Drosha products giving rise to miR-302a-5p and miR-302a-5p (13) species. Abbreviations: DE, definitive endoderm; ESC, embryonic stem cell; RPM, reads per million.
2368 sRNA-seq Analysis of Human Embryonic Stem Cells
VC AlphaMed Press 2014 STEM CELLS

sequence [40]. The mature miR-653 sequence was later rean-notated due to a subsequent publication reporting the cur-rent isomiR as the mature form [41]. Although Landgraf et al.[41] only detected a single read for the modified miR-653, themethodology used gave this isomiR precedence over the origi-nal report. Thus, proper quantitation and differential expres-sion analysis are limited when dependent upon annotation ofonly a single isomiR per stem-loop arm, and comparison ofdata between studies is compromised when the annotation issubject to change.
One method for distinguishing isomiRs enumerates themby their 50 position (e.g., miR-210.1 for the 50 most start siteand miR-210.2 for the next most 50 start site, etc. [42]). Whilethis system encodes useful information in the name, the iso-miRs may need to be renumbered as new datasets becomeavailable. A more flexible system numbers isomiRs in theorder in which they were discovered, losing the positionalinformation yet retaining a consistent nomenclature. Thus, formiR-653 the originally cloned miRNA sequence would be miR-653-5p.1 and the more 50 isomiR currently annotated in miR-Base would be miR-653-5p.2.
Any system recognizing isomiRs needs to take care, how-ever, to minimize the incorporation of artifacts. Expression-based filters are one step. Expression can be filtered by ana-lyzing the absolute expression of a potential isomiR or thefraction of reads coming from the same arm of the stem-loopcorresponding to the potential isomiR. We chose to focus onabsolute expression because some isomiRs of highly expressedgenes were a small fraction of reads from the stem-loop arm,
yet were expressed higher than many annotated miRNAs.Annotation of isomiRs captures an important and currentlyunderappreciated aspect of miRNA biology, although it createsa higher quality control burden on submitters and curators.
miRNAs from the miR-302/367 cluster containing five stem-loops are highly expressed in hESCs, and are downregulated dur-ing nondirected differentiation [24, 31, 37, 43]. Expression of themiR-302/367 cluster depends on the activity of transcription fac-tors Oct4, Sox2, and nanog, all of which bind to the predictedpromoter region of the miR-302/367 cluster [27]. A subset of themature miRNAs from the miR-302/367 cluster are part of theESCC regulating miRNAs described by Wang et al. [6], and theabundance of miRNAs in this group with a common seedsequence suggests that they regulate similar targets that helpmaintain pluripotency. Differentiation into a neurectodermal lin-eage is considered by many to be the default differentiationpathway in the absence of cues that direct cell fate [44, 45].Here, we demonstrate that several of the highly upregulatedmiRNAs in DE formation are expressed at relatively low levels inectoderm formation, including the miR-302a stem-loop. The miR-302/367 cluster has previously been shown to negatively regu-late expression of genes involved in early ectoderm specification,including NR2F2 [28]. Here, we expand the known targets of themiR-302/367 cluster to include a novel target, OTX2, a geneexpressed early in hESCs differentiation [46]. Unlike other identi-fied targets of the miR-302/367 cluster, we used mimetics toselectively identify miR-302a-5p as the miRNA that targets thisgene. This approach was also used to determine whetheranother predicted target of the miR-302/367 cluster, an isomiR
Figure 4. IsomiRs of miR-302a have different, nonoverlapping seed sequences that differentially regulate expression of OTX2 and TSC1.(A): Seed pairing alignment of miR-302a-5p isomiRs to putative target site in 30 UTR of OTX2. (B): Seed pairing alignment of miR-302a-5p isomiRs to putative target site in 30 UTR of TSC1. (C): Western analysis of HeLa cell extracts 24 hours following transfection withmiRNA mimetic of miR-302a-5p, miR-302a-5p (13), or siRNA control. GSK3a/b and Hsp90 proteins were used as loading controls. (D):Densitometry of Western blots was used to quantify protein levels normalized to loading controls. Abbreviations: OTX2, orthodenticlehomeobox 2; TSC1, tuberous sclerosis 1.
Hinton, Hunter, Afrikanova et al. 2369
www.StemCells.com VC AlphaMed Press 2014
called miR-302a-5p (13), had overlapping specificity. Based onTargetScan 5.2, the GTPase activating protein TSC1 was predictedto be a target of miR-302a-5p (13). This protein regulates forma-tion of the TORC1 and TORC2 complex through catalytic removalof the terminal phosphate from the Rheb GTPase [47]. Transfec-tion of the isomiR mimetic resulted in a decrease in expressionof the TSC1 protein, but not OTX2, indicating specificity in isomiRselection. The observation that miR-302a-5p and miR-302a-5p(13) are the predominant miRNAs expressed in pluripotenthESCs suggests that differential targeting of miRNAs from thiscomplex acts to coordinate decisions about cell fate.
A previous report has already implicated miR-302a in thepromotion of mesendoderm formation [10]. In this report,they identified Lefty, a regulator of the Nodal signaling path-way, as a target of miR-302a. Additionally, they stablyexpressed the miR-302a stem-loop in differentiating hESCs,which resulted in upregulation of mesendoderm markers infavor of ectoderm marker expression. In this study, we didnot attempt to replicate results from this work. Although sta-
ble expression of the miR-302a stem-loop would induce endo-derm formation, the roles of individual isomiRs cannot beisolated using a stable expression vector. Here, we provideadditional information about the role of the miR-302a stem-loop by implicating additional targets OTX and TSC1. In arecent report by Easley et al. [48], the authors found thathESCs have high levels of TSC1/TSC2 which act to blockmTORC1/p70S6 kinase signaling. siRNA-mediated knockdownof TSC1/TSC2 increased p70S6 kinase activation and induceddifferentiation. We find that OTX2 and TSC1 increase in steadystate RNA levels during the transition from pluripotent ESCsto DE, but the protein levels decrease in DE. This observationis consistent with the hypothesis that miRNAs are regulatingthe gene expression specifically by inhibiting translation. Thetransfection of the miR-302a isomiRs into a heterologous cellline resulted in decreased protein levels of each target, butno significant decrease in RNA levels, which further promotesthe model in which some miRNAs specifically regulate targetgenes via translational inhibition.
Figure 5. isomiR expression and regulation of definitive endoderm (DE) formation. (A): Lineage-specific induction during directed differen-tiation of hESCs. Quantitative PCR analysis of selected miRNAs in undifferentiated hESCs, definitive endoderm, and neurectodermal lineages.hESCs (Cyt49) were differentiated for 4 days while treated with Activin (Endoderm) or Noggin1Activin inhibitor (Ectoderm). (B): Westernanalysis of TSC1 and OTX2 expression in CyT49 cell extracts at 24 hour intervals during DE formation. Hsp70 expression was used as a loadingcontrol. (C): Densitometry of Western blots was used to quantify protein levels normalized to loading controls. * Significantly different fromcontrol, p< .05, n 5 4. (D): Luciferase reporter activity for plasmids transfected into Cyt49 cells. Control luciferase construct (EFLuc) activitywas compared to reporter plasmids with various oligos inserted into 30UTR of luciferase cDNA (EFLuc-302a-5p: full complement of miR-302a-5p sequence; EFLuc-OTX: putative 302a binding site in OTX 30UTR, EFLuc-OTXmut: putative OTX binding site with 3 bases mutated within theseed sequence; EFLuc-TSC: putative 302a binding site in TSC 30UTR; EFLuc-TSCmut: putative TSC binding site with 3 bases mutated within theseed sequence. Abbreviations: hESCs, human embryonic stem cell; OTX2, orthodenticle homeobox 2; TSC1, tuberous sclerosis 1.
2370 sRNA-seq Analysis of Human Embryonic Stem Cells
VC AlphaMed Press 2014 STEM CELLS
CONCLUSION
In conclusion, we have refined the description of a molecu-lar signature associated with DE differentiation, a criticalstep in the pathway to b-cell development. A significant por-tion of this signature comes from novel miRNAs and alterna-tive isomiRs. Given that the seed sequence, and thus targetspecificity, is defined by the 50 end, these isomiRs would beexpected to have altered functions. Furthermore, severalisomiRs were expressed at higher levels than the nearestannotated miRNA and therefore likely to be significant regu-lators of cellular differentiation. In addition to the data pre-sented here, a previous report described functionalsignificance to isomiR expression in mouse [3]. Moreover, asmost miRNAs annotated at miRBase have not beendescribed functionally, we propose that abundant isomiRsdetected by biochemical means should be given the sameconsideration as annotated miRNAs with potential biologicalfunctions.
ACKNOWLEDGMENTS
This work was supported by a grant from the California Insti-tute for Regenerative Medicine (CIRM; www.cirm.ca.gov/) toC.K., the Larry L. Hillblom Foundation (http://www.llhf.org/) toC.K. and A. Hayek, and the Garb Foundation to A. Hayek. A.
Hinton is supported by a grant from the Larry L. HillblomFoundation. We are grateful to Dr. William Strauss for hisadvice on miRNA extraction and analysis, Dr. Amy Pasquinellifor her helpful comments and revision of the manuscript, Dr.Sevan Ficici for assistance with programming, and ChrisCowing-Zitron for advice and assistance with bioinformatictools. The funders had no role in study design, data collectionand analysis, decision to publish, or preparation of themanuscript.
AUTHOR CONTRIBUTIONS
A. Hinton and S.E.H.: conception and design, collection and/orassembly of data, data analysis and interpretation, andmanuscript writing; I.A. and G.A.J.: collection of data; G.B.F.:conception and design, data analysis and interpretation, andmanuscript writing; A. Hayek: conception and design, manu-script writing, and financial support; C.C.K.: conception anddesign, data analysis and interpretation, manuscript writing,and financial support. A. Hinton and S.E.H. contributedequally to this work.
DISCLOSURE OF POTENTIAL CONFLICTS OF INTEREST
The authors indicate no potential conflicts of interest.
REFERENCES
1 Bartel DP. MicroRNAs: Target recognitionand regulatory functions. Cell 2009;136:215–233.
2 Bartel DP. MicroRNAs: Genomics, bio-genesis, mechanism, and function. Cell 2004;116:281–297.
3 Chiang HR, Schoenfeld LW, Ruby JG,et al. Mammalian microRNAs: Experimentalevaluation of novel and previously annotatedgenes. Genes Dev 2010;24:992–1009.
4 Mallanna SK, Rizzino A. Emerging rolesof microRNAs in the control of embryonicstem cells and the generation of inducedpluripotent stem cells. Dev Biol 2010;344:16–25.
5 Melton C, Blelloch R. MicroRNA regula-tion of embryonic stem cell self-renewal anddifferentiation. Adv Exp Med Biol 2010;695:105–117.
6 Wang Y, Baskerville S, Shenoy A, et al.Embryonic stem cell-specific microRNAsregulate the G1-S transition and promoterapid proliferation. Nat Genet 2008;40:1478–1483.
7 Hinton A, Afrikanova I, Wilson M, et al.A distinct microRNA signature for definitiveendoderm derived from human embryonicstem cells. Stem Cells Dev 2010;19:797–807.
8 Ivey KN, Muth A, Arnold J, et al. Micro-RNA regulation of cell lineages in mouse andhuman embryonic stem cells. Cell Stem Cell2008;2:219–229.
9 Poy MN, Hausser J, Trajkovski M, et al.miR-375 maintains normal pancreatic alpha-and beta-cell mass. Proc Natl Acad Sci USA2009;106:5813–5818.10 Rosa A, Spagnoli FM, Brivanlou AH. ThemiR-430/427/302 family controls mesendo-
dermal fate specification via species-specifictarget selection. Dev Cell 2009;16:517–527.11 Hinton A, Hunter S, Reyes G, et al. Frompluripotency to islets: miRNAs as critical reg-ulators of human cellular differentiation. AdvGenet 2012;79:1–34.12 Melton C, Judson RL, Blelloch R. Oppos-ing microRNA families regulate self-renewalin mouse embryonic stem cells. Nature 2010;463:621–626.13 Xu C, Inokuma MS, Denham J, et al.Feeder-free growth of undifferentiatedhuman embryonic stem cells. Nat Biotechnol2001;19:971–974.14 Hofacker IL. Vienna RNA secondarystructure server. Nucleic Acids Res 2003;31:3429–3431.15 McCaskill JS. The equilibrium partitionfunction and base pair binding probabilitiesfor RNA secondary structure. Biopolymers1990;29:1105–1119.16 Zuker M, Stiegler P. Optimal computerfolding of large RNA sequences using ther-modynamics and auxiliary information.Nucleic Acids Res 1981;9:133–148.17 Janssen S, Giegerich R. Faster computa-tion of exact RNA shape probabilities. Bioin-formatics 2010;26:632–639.18 Steffen P, Voss B, Rehmsmeier M, et al.RNAshapes: An integrated RNA analysis pack-age based on abstract shapes. Bioinformatics2006;22:500–503.19 Reinhart BJ, Slack FJ, Basson M, et al.The 21-nucleotide let-7 RNA regulates devel-opmental timing in Caenorhabditis elegans.Nature 2000;403:901–906.20 Brasier AR, Tate JE, Habener JF. Opti-mized use of the firefly luciferase assay as areporter gene in mammalian cell lines. Bio-techniques 1989;7:1116–1122.
21 D’Amour KA, Agulnick AD, Eliazer S,et al. Efficient differentiation of humanembryonic stem cells to definitive endoderm.Nat Biotechnol 2005;23:1534–1541.22 Dweep H, Sticht C, Pandey P, et al. miR-Walk—Database: Prediction of possiblemiRNA binding sites by “walking” the genesof three genomes. J Biomed Inform 2011;44:839–847.23 Laurent LC, Chen J, Ulitsky I, et al. Com-prehensive microRNA profiling reveals aunique human embryonic stem cell signaturedominated by a single seed sequence. StemCells 2008;26:1506–1516.24 Suh MR, Lee Y, Kim JY, et al. Humanembryonic stem cells express a unique setof microRNAs. Dev Biol 2004;270:488–498.25 Barroso-del Jesus A, Lucena-Aguilar G,Menendez P. The miR-302–367 cluster as apotential stemness regulator in ESCs. CellCycle 2009;8:394–398.26 Barroso-delJesus A, Lucena-Aguilar G,Sanchez L, et al. The Nodal inhibitor Lefty isnegatively modulated by the microRNA miR-302 in human embryonic stem cells. FASEB J2011;25:1497–1508.27 Card DA, Hebbar PB, Li L, et al. Oct4/Sox2-regulated miR-302 targets cyclin D1 inhuman embryonic stem cells. Mol Cell Biol2008;28:6426–6438.28 Rosa A, Brivanlou AH. A regulatory cir-cuitry comprised of miR-302 and the tran-scription factors OCT4 and NR2F2 regulateshuman embryonic stem cell differentiation.EMBO J 2011;30:237–248.29 Acampora D, Mazan S, Lallemand Y,et al. Forebrain and midbrain regions aredeleted in Otx2-/- mutants due to a defec-tive anterior neuroectoderm specification
Hinton, Hunter, Afrikanova et al. 2371
www.StemCells.com VC AlphaMed Press 2014
during gastrulation. Development 1995;121:3279–3290.
30 Blum B, Benvenisty N. The tumorigenic-ity of diploid and aneuploid human pluripo-tent stem cells. Cell Cycle 2009;8:3822–3830.
31 Bar M, Wyman SK, Fritz BR, et al. Micro-RNA discovery and profiling in human embry-onic stem cells by deep sequencing of smallRNA libraries. Stem Cells 2008;26:2496–2505.
32 Beattie GM, Lopez AD, Bucay N, et al.Activin A maintains pluripotency of humanembryonic stem cells in the absence offeeder layers. Stem Cells 2005;23:489–495.
33 James D, Levine AJ, Besser D, et al.TGFbeta/activin/nodal signaling is necessaryfor the maintenance of pluripotency inhuman embryonic stem cells. Development2005;132:1273–1282.
34 Tsai ZY, Singh S, Yu SL, et al. Identifica-tion of microRNAs regulated by activin A inhuman embryonic stem cells. J Cell Biochem2010;109:93–102.
35 Kozomara A, Griffiths-Jones S. miRBase:Integrating microRNA annotation and deep-sequencing data. Nucleic Acids Res 2011;39(Database issue):D152–157.
36 Lee LW, Zhang S, Etheridge A, et al.Complexity of the microRNA repertoirerevealed by next-generation sequencing. RNA2010;16:2170–2180.37 Morin RD, O’Connor MD, Griffith M,et al. Application of massively parallelsequencing to microRNA profiling and discov-ery in human embryonic stem cells. GenomeRes 2008;18:610–621.38 Jeon HM, Sohn YW, Oh SY, et al. ID4imparts chemoresistance and cancer stem-ness to glioma cells by derepressing miR-9*-mediated suppression of SOX2. Cancer Res2011;71:3410–3421.39 Saunders LR, Sharma AD, Tawney J,et al. miRNAs regulate SIRT1 expression dur-ing mouse embryonic stem cell differentia-tion and in adult mouse tissues. Aging(Albany NY) 2010;2:415–431.40 Cummins JM, He Y, Leary RJ, et al. Thecolorectal microRNAome. Proc Natl Acad SciUSA 2006;103:3687–3692.41 Landgraf P, Rusu M, Sheridan R, et al. Amammalian microRNA expression atlas basedon small RNA library sequencing. Cell 2007;129:1401–1414.42 Ruby JG, Stark A, Johnston WK, et al.Evolution, biogenesis, expression, and target
predictions of a substantially expanded set ofDrosophila microRNAs. Genome Res 2007;17:1850–1864.
43 Houbaviy HB, Murray MF, Sharp PA.Embryonic stem cell-specific MicroRNAs. DevCell 2003;5:351–358.
44 Munoz-Sanjuan I, Brivanlou AH. Neuralinduction, the default model and embryonicstem cells. Nat Rev Neurosci 2002;3:271–280.
45 Vallier L, Reynolds D, Pedersen RA.Nodal inhibits differentiation of humanembryonic stem cells along the neuroecto-dermal default pathway. Dev Biol 2004;275:403–421.
46 Erceg S, Lukovic D, Moreno-Manzano V,et al. Derivation of cerebellar neurons fromhuman pluripotent stem cells. Curr ProtocStem Cell Biol 2012;Chapter 1:Unit 1H 5.
47 Laplante M, Sabatini DM. mTOR signal-ing in growth control and disease. Cell 2012;149:274–293.
48 Easley CAT, Ben-Yehudah A, Redinger CJ,et al. mTOR-mediated activation of p70 S6Kinduces differentiation of pluripotent humanembryonic stem cells. Cell Reprogram 2010;12:263–273.
See www.StemCells.com for supporting information available online.
2372 sRNA-seq Analysis of Human Embryonic Stem Cells
VC AlphaMed Press 2014 STEM CELLS


![STEM CELLS EMBRYONIC STEM CELLS/INDUCED PLURIPOTENT STEM CELLS Stem Cells.pdf · germ cell production [2]. Human embryonic stem cells (hESCs) offer the means to further understand](https://img.pdfslide.us/doc/110x75/6014b11f8ab8967916363675/stem-cells-embryonic-stem-cellsinduced-pluripotent-stem-cells-stem-cellspdf.jpg)