Embed Size (px)
Citation preview

British Energy Estuarine & Marine Studies
Technical Report Series 2011 no. 182
Hinkley Point; Thermal PlumeModelling: Delft 3D – Stage 3a Resultswith the Final CW Configuration
Production Date: June 2011Not Protectively Marked


The findings and conclusions of this report are those of the author, and do not necessarily represent the views or opinions of Cefas or EDF Energy.
Copyright © 2011 EDF Energy
The text of this document may be reproduced free of charge in any format or medium providing that it is reproduced accurately and not in a misleading context. The material must be acknowledged as EDF copyright and the document title specified. Where third party material has been identified, permission
from the respective copyright holder must be sought.

UK Protect; Commercial
This report contains the results of modelling,by ABPmer using Delft3D, of what are likelyto be final intake and outfall positions forHinkley C. It follows on from Stage 3 reports(BEEMS Technical Report 121), the Stage 2report (Technical Report No 085) and thecalibration and validation report (TechnicalReport No 084).
This report contains results from five sets ofruns labelled A – E. It is a brief report as itcontains just the standard Neap / Spring runsfor the final position, plus estimates ofrecirculation. It also includes an analysis ofcross sections.
Scenario Hinkley C Hinkley C Hinkley B
Discharge(m3/s)
Temp(°C)
Discharge(m3/s)
Temp(°C)
Discharge(m3/s)
Temp(°C)
A: Hinkley B at 70% – – – – 33.7 11
B: Hinkley B at 100% – – – – 33.7 15.8
C: Hinkley C 58-67 12.5-10.7 58-67 12.5-10.7 – –
D: Hinkley C plus Hinkley B at 70% 58-67 12.5-10.7 58-67 12.5-10.7 33.7 11
E: Hinkley C plus Hinkley B at 100% 58-67 12.5-10.7 58-67 12.5-10.7 33.7 15.8

UK Protect; Commercial
Recirculation to the Hinkley C intakes isgenerally low, but may reach 1.2°C (at thebed) on some stages of the Neap tide.
An analysis has been done to compare theseresults with the previous model runs.Differences between them are small exceptfor the area of immediate discharge. Thusinferences made from the meteorologicalscenarios or the geomorphological scenariosare valid to these final positions and wellwithin model uncertainty.
In relation to fish migration, four sectionswere considered. The cross sectional areacriteria of < 2 degree difference < 25% of thecross section are only exceeded for onesection (section 2) and only for the combinedHinkley B (100%) + Hinkley C scenario (RunE). It is exceeded for around 2 hours either
side of high water on the lowest Neap tides,which accounts for approximately 6% of thetotal time. However it should be noted thatthe Parrett consists of twin channels and thenorthern-most channel is unimpacted by theplume, so that a migratory channel existseven in the few cases when a failurecondition is identified. Scenarios whichincorporate wind forcing (BEEMS TechnicalReport 121) and include a slightly higher heatloss indicate that this breach only occursunder one particular wind condition.
Other modelling results using the GETMmodel from an annual analysis (BEEMSTechnical Report 177) do indicate that there isbreach of the 25% criteria for this section, butonly for limited periods of time and much lessthan the 5% criteria.
Signed: ............................................................
Position: ..........................................................
Date: ................................................................

Document: \\ABPR005\PROJECTS\3987_HINKLEY_STAGE4\_COMMUNICATION\REPORT\R1759_DRAFT_08FEB201
1.DOC File: R\3987 Client: Centre for Environment, Fisheries & Aquaculture Science (Cefas) Title: Thermal Plume Dispersion at Hinkley Point in the Severn Estuary:
Stage 4 - Additional Modelling Results Report No: R.1759 Date: February 2011 Author: RE White Remarks: (e.g. info on colour pages, double sided, specific instructions, etc)
Text from REW Col Figs Draft pdf created 08.02.2011 Final pdf created
Document Information Fields
(These are updated by using the toggle field option - do not type over information) No of Pages 45 Revision No 8 Date Created 04/02/2011 15:32:00 Date Last Saved 22/06/2011 11:57:00 Date Last Printed 22/06/2011 14:48:00 Last Saved By ABP Marine Environmental Research Ltd
DISTRIBUTION (Add further drafts if necessary)
Sent to Name/Client Date No of Copies
Draft for Comment Cefas 08.02.2011 1 Final
QA Procedure: A final report should include: A complete set of paper masters, with documentation sheet, stating: whether draft or final version; number of reports distributed as paper or pdf, for draft and final versions with client name and dates sent; copies of letters, memos or compliment slips; remarks stating whether CD’s, discs, videos, photos or charts, etc were included; Document Amendments Table signed; marked front covers with confidential or draft, if needed; any loose sheets, charts or non electronic data to be placed in a document wallet; and a complete pdf created. After the electronic copies (Word, PDF, etc) have been Checked by the Project Manager as Complete and Accessible, they should be placed into Y:\1111\Repts for Archive, this can be a zip file if figures or other data needs to be included, in order that information can be cut and pasted into the ABPmer Reference Manager Database. The paper masters (and any spare copies) are to be placed on GMA’s desk so they can be registered as final on the Reference Manager Database system. Once this document has been signed (table below) and registered into ABPmer Reference Manager Database the following pages will be filed for Archive: The Report Log Page; Copies of letters, memos or compliment slips; Front Cover; and Title - Signed Document Amendment Table. All other paper copies will be destroyed by Admin - if you wish to keep a paper copy these should be marked as Working Copy.
Please Tick to Indicate that All Documents are Complete and Final
Authorised Signature Date Master Copy
to be Destroyed or Kept Word Doc Pdf
Other Material
4 February 2011

Centre for Environment, Fisheries & Aquaculture Science (Cefas)
Thermal Plume Dispersion at Hinkley Point in the Severn Estuary: Stage 4 - Additional Modelling Results Report R.1759 February 2011

All images copyright ABPmer apart from front cover (wave, anemone, bird) and policy & management (rockpool) Andy Pearson www.oceansedgephotography.co.uk
Centre for Environment, Fisheries & Aquaculture Science (Cefas)
Thermal Plume Dispersion at Hinkley Point in the Severn Estuary: Stage 4 - Additional Modelling Results Date: February 2011 Project Ref: R\3987 Report No: R.1759 © ABP Marine Environmental Research Ltd
Version Details of Change Authorised By Date
1 Draft R E White 08.02.2011
Document Authorisation Signature Date
Project Manager: R E White
Quality Manager: A P Wright
Project Director: J J Williams
ABP Marine Environmental Research Ltd Suite B, Waterside House Town Quay Tel: +44(0)23 8071 1840 SOUTHAMPTON Fax: +44(0)23 8071 1841 Hampshire Web: www.abpmer.co.uk SO14 2AQ Email: [email protected]
ABPmer is certified by:

Thermal Plume Dispersion at Hinkley Point in the Severn Estuary: Stage 4 - Additional Modelling Results
R\3987 (i) R.1759
Summary This report provides a synthesis of results from hydrodynamic thermal plume modelling in the Severn Estuary, undertaken to gain further insight into the temperature rises associated with the operation of a proposed new power station at Hinkley Point. Details of the model configuration, calibration and validation, demonstrating that the model is suitable for the purposes of the study, were provided in an earlier report (BEEMS Technical Report TR084). Preliminary investigations of four different intake/outfall configurations were undertaken and the results from this were reported in BEEMS Technical Report TR085. An assessment of the thermal plume evolution for a preferred intake/outfall configuration under a range of operating conditions and future scenarios was then carried out and the results form this were reported in BEEMS Technical Report TR121. Following this, updated information was received on the likely design of the intake and outfall structures for their preferred configuration and also on the flow rates of Hinkley B. For completeness, five additional model scenarios were considered to investigate the evolution of the plume under the most accurate and up-to-date information available. The results from this additional study are provided in the present report. The thermal plume associated with the operation of both the Hinkley B and Hinkley C power stations is elongate in nature. Excess temperatures of more than 1ºC extend approximately 5km upstream and downstream of Hinkley Point when Hinkley B is operating. When Hinkley C is operating, the plume extends significantly further, with temperatures of more than 1ºC experienced between Minehead (20km west of the outfalls) and Gore Sand (10km east of the outfalls). If Hinkley B and Hinkley C operate at full capacity in-combination excess temperatures are more than 2°C across more than 25% of a section which extends offshore from HInkley across the entrance of the Parrett (Section 2), for more than 5% of a neap tide. While this exceeds the recommended guidance for thermal occlusion, excess temperatures across the north-easterly channel into the River Parrett remain low and as such, a clear channel into the River Parrett for migratory fish is maintained. The operation of Hinkley C is expected to increase the recirculation at Hinkley B, with average excess temperatures at the Hinkley B intake likely to be approximately doubled. The effect of the operation of Hinkley B on recirculation at Hinkley C is less significant, with increases above background temperature of less than 0.25ºC at the Hinkley C intakes when Hinkley B is operating at 100% load, compared to when it is not operating. The modifications applied to the modelled Hinkley B and Hinkley C discharges in this Stage of the study result in small differences in the plume characteristics, with changes above 0.1ºC restricted to within 12km of the discharge locations. The differences between the plume characteristics for Stage 3 and the present Stage 4 results are small compared to the differences arising from a range of meteorological and geomorphological conditions considered in previous stages of this study (see BEEMS Technical Report TR085 and BEEMS Technical Report TR121). Thus the inferences made from the previous modelling work (Stages 2 and 3) on geomorphology and meteorological scenarios are still valid.

Thermal Plume Dispersion at Hinkley Point in the Severn Estuary: Stage 4 - Additional Modelling Results
R\3987 (ii) R.1759
Thermal Plume Dispersion at Hinkley Point in the Severn Estuary: Stage 4 - Additional Modelling Results Contents
Page Summary .................................................................................................................................................. i
1. Introduction ................................................................................................................................. 1
2. Method ....................................................................................................................................... 2
3. Results ....................................................................................................................................... 3 3.1 Plume Extents ............................................................................................................................ 3 3.2 Maximum Bed Excess Temperatures ......................................................................................... 4 3.3 Cross Sections ........................................................................................................................... 5 3.4 Recirculation ............................................................................................................................... 6 3.5 Comparison with Stage 3 Model Results .................................................................................... 8
4. Conclusions ................................................................................................................................ 9
5. References ............................................................................................................................... 10 Tables 1. Intake and outfall locations ......................................................................................................... 2 2. Model scenarios ......................................................................................................................... 3 3. Percentage area of Section 1 exceeding 2C temperature rise .................................................. 6 4. Percentage area of Section 2 exceeding 2C temperature rise .................................................. 6 5. Maximum intake temperatures at Hinkley C ............................................................................... 7 6. Mean intake temperatures at Hinkley C ...................................................................................... 7 7. Maximum intake temperatures at Hinkley B ............................................................................... 7 8. Mean intake temperatures at Hinkley B ...................................................................................... 8 Figures 1. Position of intakes and outfalls 2. Location plot showing cross-sections 3. Maximum and mean surface excess temperature field for Scenario A: Hinkley B at 70%, spring
tide 4. Maximum and mean surface excess temperature field for Scenario A: Hinkley B at 70%, neap
tide

Thermal Plume Dispersion at Hinkley Point in the Severn Estuary: Stage 4 - Additional Modelling Results
R\3987 (iii) R.1759
5. Maximum and mean surface excess temperature field for Scenario B: Hinkley B at 100%, spring tide
6. Maximum and mean surface excess temperature field for Scenario B: Hinkley B at 100%, neap tide
7. Maximum and mean surface excess temperature field for Scenario C: Hinkley C, spring tide 8. Maximum and mean surface excess temperature field for Scenario C: Hinkley C, neap tide 9. Maximum and mean surface excess temperature field for Scenario D: Hinkley C plus Hinkley B
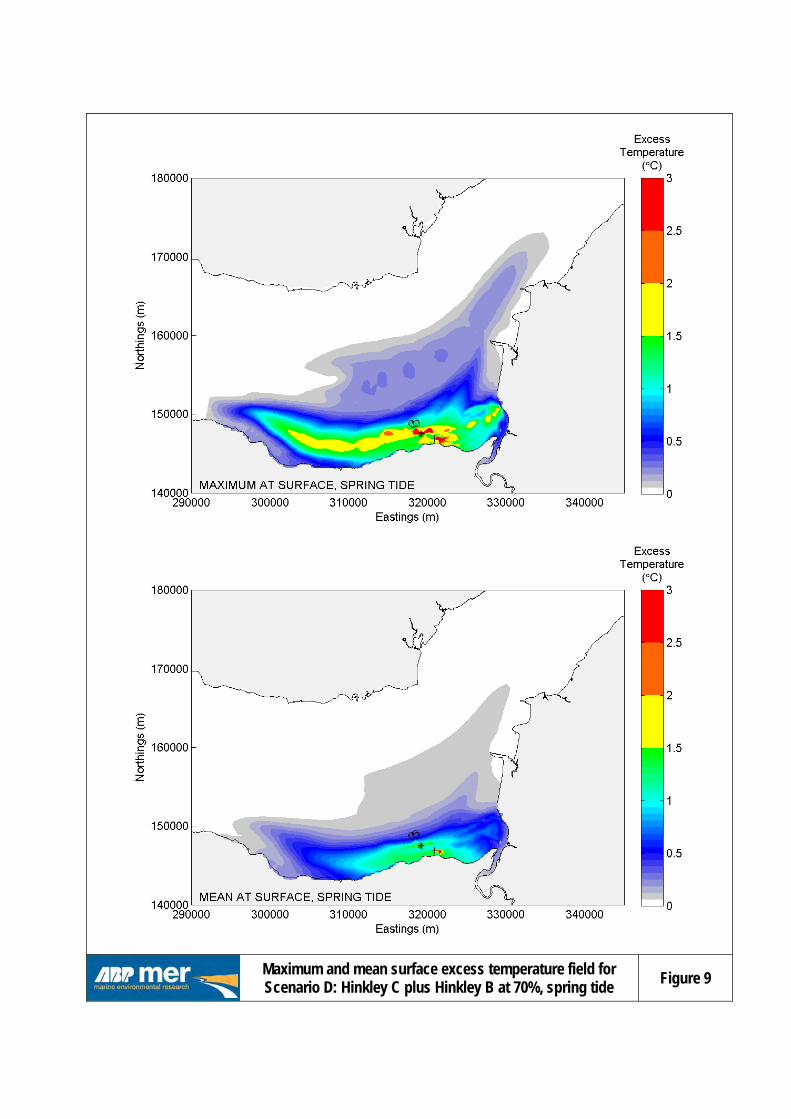
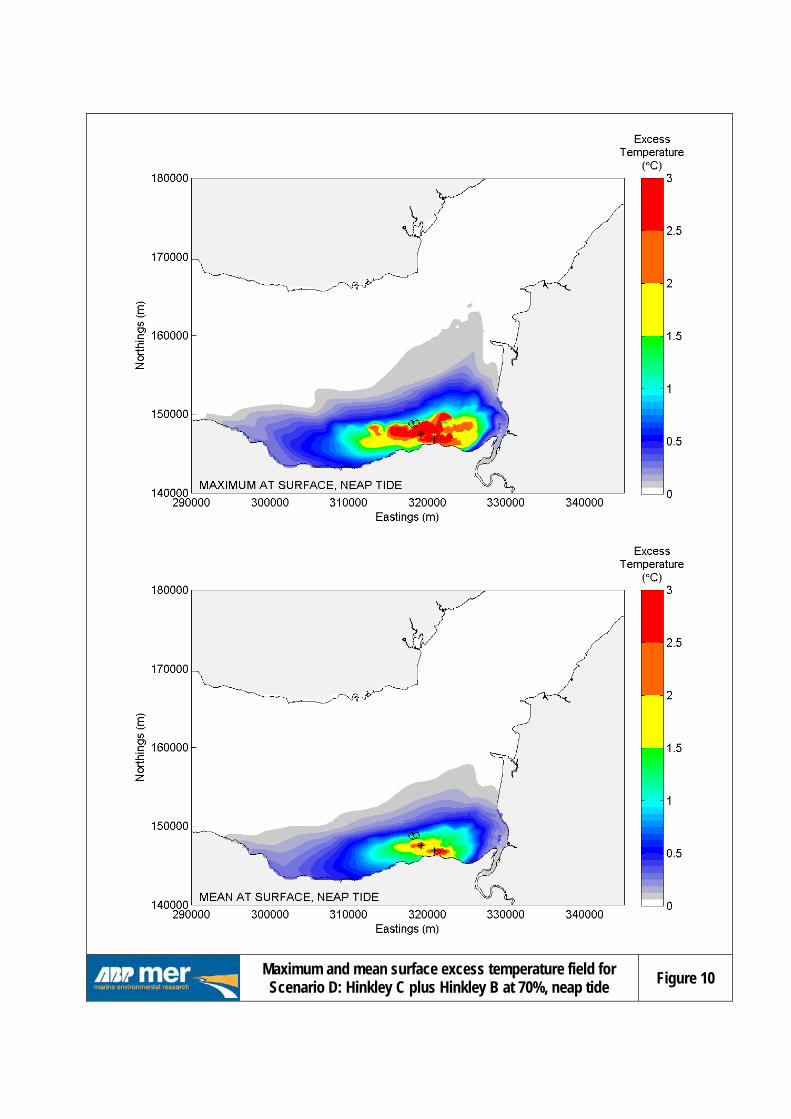
at 70%, spring tide 10. Maximum and mean surface excess temperature field for Scenario D: Hinkley C plus Hinkley B
at 70%, neap tide 11. Maximum and mean surface excess temperature field for Scenario E: Hinkley C plus Hinkley B
at 100%, spring tide 12. Maximum and mean surface excess temperature field for Scenario E: Hinkley C plus Hinkley B
at 100%, neap tide 13. Maximum near bed excess temperatures for all scenarios during a spring and neap tide 14. Excess temperature (C) across Section 2 (from South West to North East), neap tide, for
Scenario A: Hinkley B at 70% 15. Excess temperature (C) across Section 2 (from South West to North East), neap tide, for
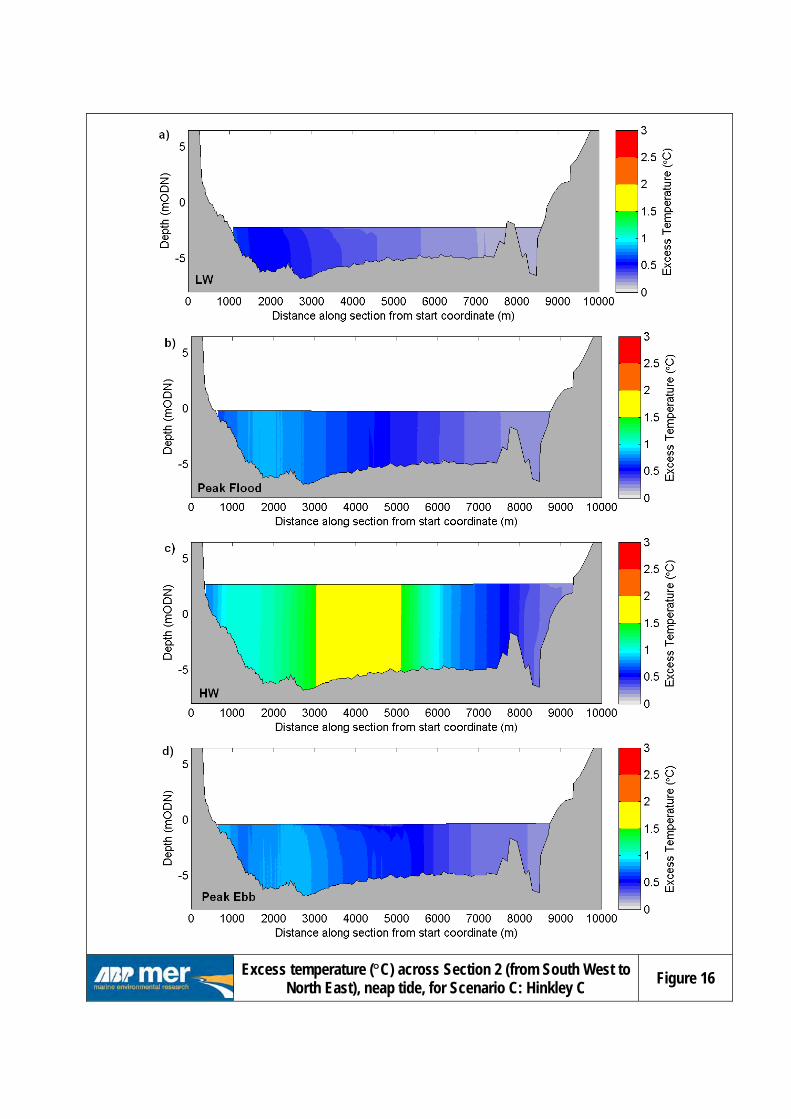
Scenario B: Hinkley B at 100% 16. Excess temperature (C) across Section 2 (from South West to North East), neap tide, for
Scenario C: Hinkley C 17. Excess temperature (C) across Section 2 (from South West to North East), neap tide, for
Scenario D: Hinkley C plus Hinkley B at 70% 18. Excess temperature (C) across Section 2 (from South West to North East), neap tide, for
Scenario E: Hinkley C plus Hinkley B at 100% 19. Area of Section 2 with >2ºC temperature rise for (a and b) Scenario D: Hinkley C plus Hinkley B
at 70% and (c and d) Scenario E: Hinkley C plus Hinkley B at 100% Hinkley B at 100% and Hinkley C
20. Excess temperatures for Scenario A: Hinkley B at 70% for (a and b) Hinkley C intakes and (c and d) Hinkley B intakes
21. Excess temperatures for Scenario B: Hinkley B at 100% for (a and b) Hinkley C intakes and (c and d) Hinkley B intakes
22. Excess temperatures for Scenario C: Hinkley C for (a and b) Hinkley C intakes and (c and d) Hinkley B intakes
23. Excess temperatures for Scenario D: Hinkley C plus Hinkley B at 70% for (a and b) Hinkley C intakes and (c and d) Hinkley B intakes
24. Excess temperatures for Scenario E: Hinkley C plus Hinkley B at 100% for (a and b) Hinkley C intakes and (c and d) Hinkley B intakes
25. Difference in maximum surface excess temperature field for Hinkley B at 100% (Stage 4 minus Stage 3)
26. Difference in maximum surface excess temperature field for Hinkley C (Stage 4 minus Stage 3)

Thermal Plume Dispersion at Hinkley Point in the Severn Estuary: Stage 4 - Additional Modelling Results
R\3987 1 R.1759
1. Introduction EDF proposes to install a twin-unit European Pressurised Reactor (EPR) at Hinkley Point in the Severn Estuary. ABP Marine Environmental Research Ltd (ABPmer) has been commissioned for BEEMS by the Centre for Environment, Fisheries and Aquaculture Science (Cefas) to undertake thermal plume dispersion modelling studies associated with the discharge of once through cooling water from the proposed new power station (Hinkley C). The modelling has been undertaken in four stages, with the first stage focussed on the model setup, calibration and validation. Extensive model calibration and validation exercises demonstrated that the model reproduces water levels and currents in the estuary to an acceptable degree of accuracy and that the thermal plume pattern from the existing power station at Hinkley Point is well represented. Thus the model is considered to be a suitable tool for the assessment of the dispersion of a cooling water discharge in the Severn Estuary. The full results from Stage 1 of the study are presented in a separate report (BEEMS Technical Report TR084.) The second stage of the study focussed on providing a detailed assessment of the thermal dispersion from the proposed new power station. During Stage 2 of the study, consideration was given to a number of different intake and outfall configurations and to the plume response to various meteorological conditions. At this stage the purpose was to identify the most beneficial configuration for Hinkley C alone, considering both thermal recirculation and environmental impacts. In addition, for a limited number of configurations preliminary investigations of the impact of proposed tidal power schemes on the thermal plume were undertaken. The results from this preliminary assessment were used by Cefas and EDF to identify a preferred intake/outfall configuration and the areas requiring further investigation. The full results from Stage 2 of the study are presented in BEEMS Technical Report TR085. Having selected a preferred intake/outfall configuration, the third stage of the study considered the evolution of the thermal plume under different operating conditions, including that with Hinkley B operating and for possible future geomorphological and meteorological scenarios. The results from this study are reported in BEEMS Technical Report TR121. Following on from the Stage 3, updated information was received on the likely design of the intake and outfall structures and also on the likely flow rates of Hinkley B. This latest stage of modelling now includes 4 intake ports on 2 tunnels and models two discharge ports on one outfall tunnel for Hinkley C. For completeness the model has been re-run with the updated flow rates and associated temperature for Hinkley B and with the new intake and outfall positions for Hinkley C. The results from these updated scenarios are presented in this report. In addition, a brief comparison is made with results presented in Stage 3 (BEEMS Technical Report TR121) to provide some understanding of how the applied revisions affect the characteristics of the modelled thermal plumes and their predicted impacts.
Thermal Plume Dispersion at Hinkley Point in the Severn Estuary: Stage 4 - Additional Modelling Results
R\3987 2 R.1759
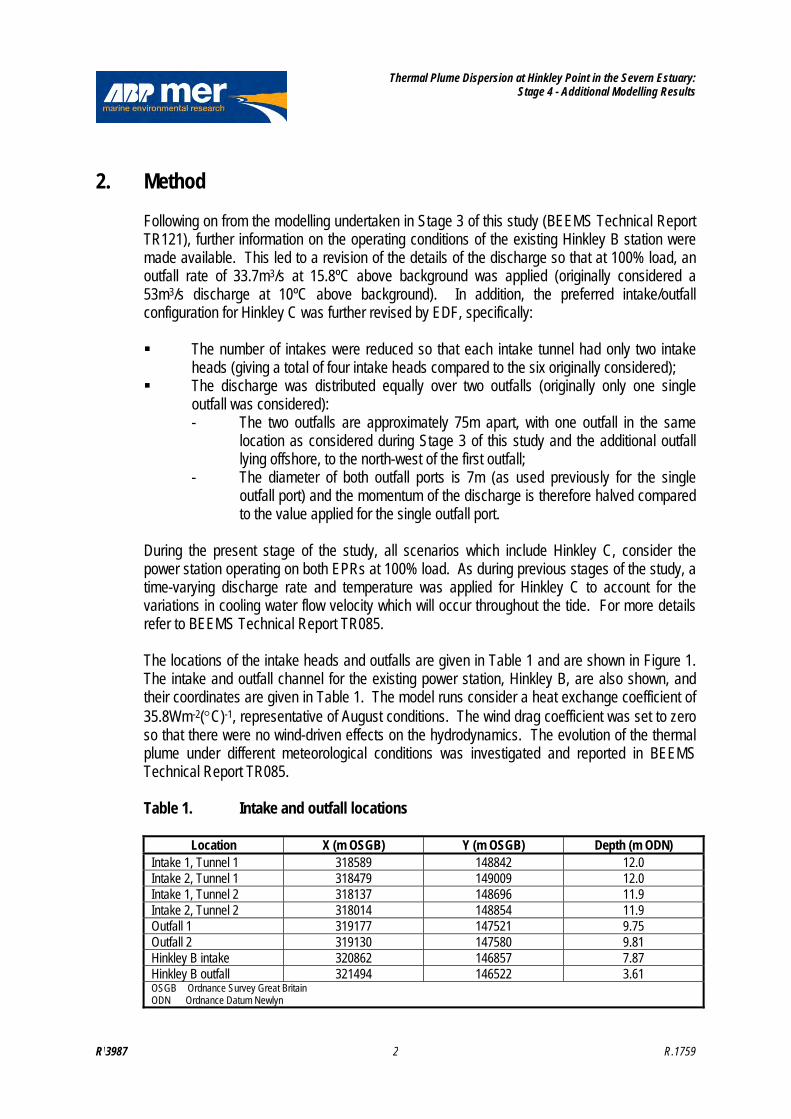
2. Method Following on from the modelling undertaken in Stage 3 of this study (BEEMS Technical Report TR121), further information on the operating conditions of the existing Hinkley B station were made available. This led to a revision of the details of the discharge so that at 100% load, an outfall rate of 33.7m3/s at 15.8ºC above background was applied (originally considered a 53m3/s discharge at 10ºC above background). In addition, the preferred intake/outfall configuration for Hinkley C was further revised by EDF, specifically: The number of intakes were reduced so that each intake tunnel had only two intake
heads (giving a total of four intake heads compared to the six originally considered); The discharge was distributed equally over two outfalls (originally only one single
outfall was considered): - The two outfalls are approximately 75m apart, with one outfall in the same
location as considered during Stage 3 of this study and the additional outfall lying offshore, to the north-west of the first outfall;
- The diameter of both outfall ports is 7m (as used previously for the single outfall port) and the momentum of the discharge is therefore halved compared to the value applied for the single outfall port.
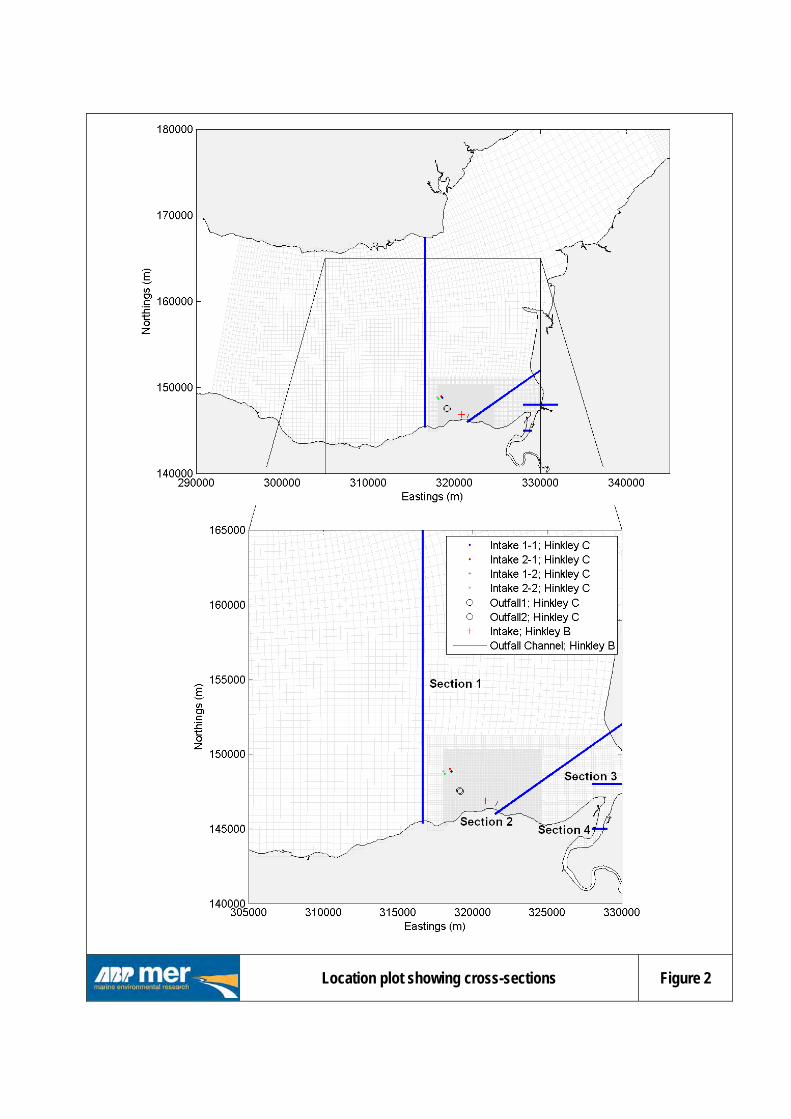
During the present stage of the study, all scenarios which include Hinkley C, consider the power station operating on both EPRs at 100% load. As during previous stages of the study, a time-varying discharge rate and temperature was applied for Hinkley C to account for the variations in cooling water flow velocity which will occur throughout the tide. For more details refer to BEEMS Technical Report TR085. The locations of the intake heads and outfalls are given in Table 1 and are shown in Figure 1. The intake and outfall channel for the existing power station, Hinkley B, are also shown, and their coordinates are given in Table 1. The model runs consider a heat exchange coefficient of 35.8Wm-2(C)-1, representative of August conditions. The wind drag coefficient was set to zero so that there were no wind-driven effects on the hydrodynamics. The evolution of the thermal plume under different meteorological conditions was investigated and reported in BEEMS Technical Report TR085. Table 1. Intake and outfall locations
Location X (m OSGB) Y (m OSGB) Depth (m ODN) Intake 1, Tunnel 1 318589 148842 12.0 Intake 2, Tunnel 1 318479 149009 12.0 Intake 1, Tunnel 2 318137 148696 11.9 Intake 2, Tunnel 2 318014 148854 11.9 Outfall 1 319177 147521 9.75 Outfall 2 319130 147580 9.81 Hinkley B intake 320862 146857 7.87 Hinkley B outfall 321494 146522 3.61 OSGB Ordnance Survey Great Britain ODN Ordnance Datum Newlyn

Thermal Plume Dispersion at Hinkley Point in the Severn Estuary: Stage 4 - Additional Modelling Results
R\3987 3 R.1759
Table 2. Model scenarios
Scenario Hinkley C EPR 1 Hinkley C EPR 2 Hinkley B
Discharge (m3/s)
Temp (C)
Discharge (m3/s)
Temp (C)
Discharge (m3/s)
Temp (C)
A: Hinkley B at 70% - - - - 33.7 11 B: Hinkley B at 100% - - - - 33.7 15.8 C: Hinkley C 58-67 12.5-10.7 58-67 12.5-10.7 - - D: Hinkley C plus Hinkley B at 70% 58-67 12.5-10.7 58-67 12.5-10.7 33.7 11 E: Hinkley C plus Hinkley B at 100% 58-67 12.5-10.7 58-67 12.5-10.7 33.7 15.8
3. Results The maximum and mean surface thermal plume extents over one semi-diurnal tidal cycle (12.5 hours) are identified for each of the five scenarios (A to E) using map plots. These plots provide an overview of the areas likely to be impacted by the thermal plume. Both spring and neap tidal conditions are considered to provide an indication of how the plume temperatures vary throughout the spring-neap tidal cycle. The range of the neap tide considered is 6.0m (which is the mean neap tidal range at Hinkley) and the range of the spring tide is 11.4m. While this is slightly smaller than the mean spring tidal range at Hinkley (which is 12.2m), the plume evolution under higher range tides was investigated and reported in BEEMS Technical Report TR085. To assist with the assessment of the environmental impact of the plume in more detail, consideration has also been given to: The maximum excess temperature at the seabed; and The percentage of the cross-section of the Bristol Channel and the River Parrett
exceeding a defined temperature rise (2°C). The location of cross-sections is shown in Figure 2.
In addition, the level of recirculation is considered by presenting time-series of excess temperature at the intakes. Some comparisons with results presented in the Stage 3 Hinkley study (BEEMS Technical Report TR121) have then been made to provide an understanding of how the revisions applied in this Stage of the study affect the model results.
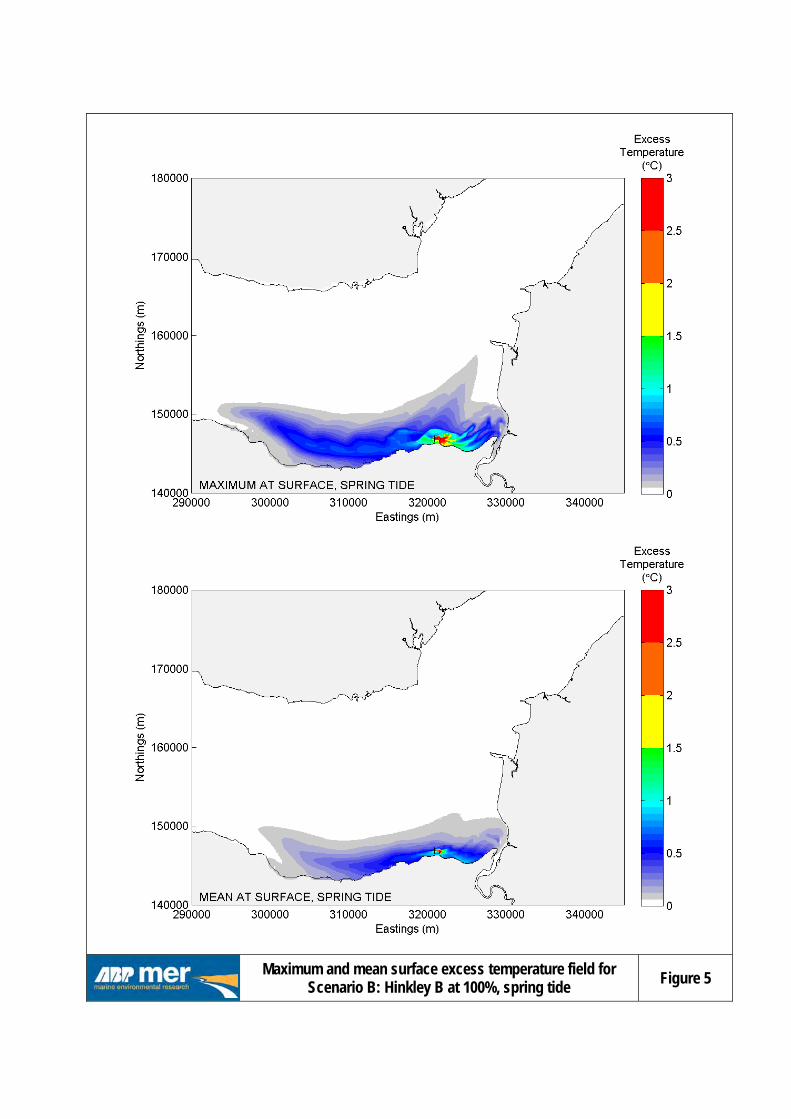
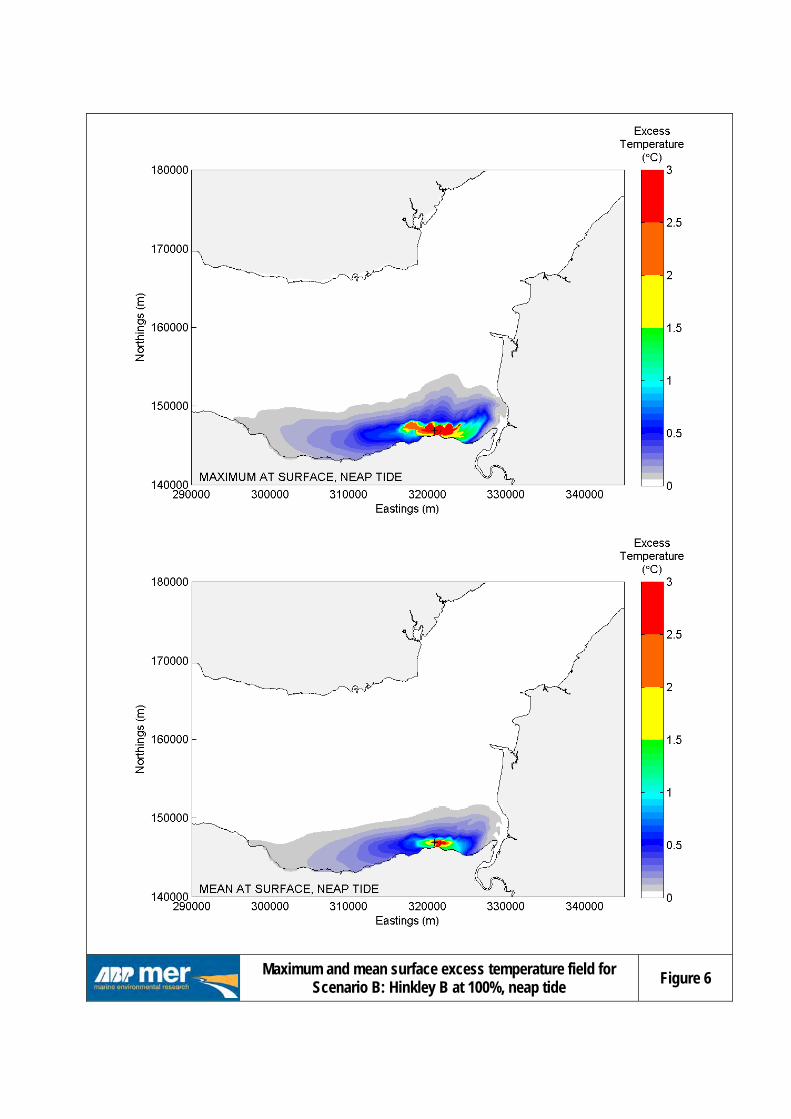
3.1 Plume Extents In this section, map plots of the maximum and mean plume extents are presented for each model run for both spring and neap tides. Map plots of the maximum and mean plume extent associated with the operation of Hinkley B at 70% load are shown for spring and neap tides in Figures 3 and 4, respectively. Figures 5 and 6 show the same results but with Hinkley B operating at 100% load. The plume is

Thermal Plume Dispersion at Hinkley Point in the Severn Estuary: Stage 4 - Additional Modelling Results
R\3987 4 R.1759
elongated in nature, extending further east and west than offshore. Excess temperatures of more than 1°C are constrained to within 1.7km of the coast and within 3.7km upstream and 4.8km downstream of the outfall when Hinkley B is operating at 70% load. The plume extents are slightly larger when the power station is operating at 100% load, with changes above 1°C extending 2km offshore, 4.8km upstream and 5.1km downstream. Map plots of the maximum and mean plume extent associated with the operation of Hinkley C are shown for spring and neap tides in Figures 7 and 8, respectively. In comparison to the thermal plume associated with the operation of Hinkley B, the thermal plume associated with the operation of Hinkley C continues further to the east and west with excess temperatures of more than 1°C extending approximately 19km to the west and to the coastline at Gore Sand (10km) to the east of the outfalls. Despite this, excess temperatures along the Hinkley foreshore are lower when only Hinkley C is operational, in comparison to when only Hinkley B is operational (for example compare Figures 5 and 7). Map plots of the maximum and mean excess temperatures are shown on spring and neap tides for the Hinkley B power station, in-combination with the Hinkley C power station in Figures 9 to 12. Results are shown for Hinkley B operating at 70% load (Figures 9 and 10) and for Hinkley B operating at 100% load (Figures 11 and 12). Comparison of these plots with Figures 3 to 6 (Hinkley B only) provides an insight into the expected influence of the operations of the Hinkley C station on Hinkley B. The operation of Hinkley B and Hinkley C in-combination, results in higher plume temperatures extending both offshore and west of Hinkley Point, with excess temperatures above 1°C extending approximately 1km further offshore and 18km further downstream, compared to when Hinkley B is operating on its own. From the map plots it appears that the operation of Hinkley C is likely to increase temperatures at the Hinkley B intake (compare excess temperatures at the intake locations in Figures 5 and 6 with Figures 11 and 12), while the impact of Hinkley B temperatures at the Hinkley C intakes is expected to be more limited (compare excess temperatures at the intake locations in Figures 7 and 8 with Figures 11 and 12). These increases in intake temperatures (recirculation) are discussed and quantified in more detail in Section 3.4.
3.2 Maximum Bed Excess Temperatures Time-series of the maximum excess temperatures at the bed are given in Figure 13. The values plotted are the maximum excess temperatures occurring throughout the model domain, most likely occurring within the outfall model grid cell. Highest excess temperatures occur around low water on spring tides, when the flows are slack and the water depth at the outfalls is shallowest, resulting in the discharge in the model to be closest to the bed. The following observations can be made: Higher bed temperatures occur for Hinkley B than for Hinkley C. This is due to the
shallower depth of the Hinkley B outfall, relative to the Hinkley C outfalls (highest bed temperatures occur at the discharge location);

Thermal Plume Dispersion at Hinkley Point in the Severn Estuary: Stage 4 - Additional Modelling Results
R\3987 5 R.1759
Maximum bed temperatures for Hinkley B operating at 70% load and at 100% load are
12.3°C and 17.5ºC, respectively. By comparison, maximum bed temperatures for Hinkley C are 5.6°C; and
There is likely to be some recirculation of the Hinkley C plume into the Hinkley B intake, with maximum bed temperatures increasing by 0.5°C when Hinkley C and Hinkley B are considered in-combination. Recirculation is discussed in more detail in Section 3.4.
3.3 Cross Sections
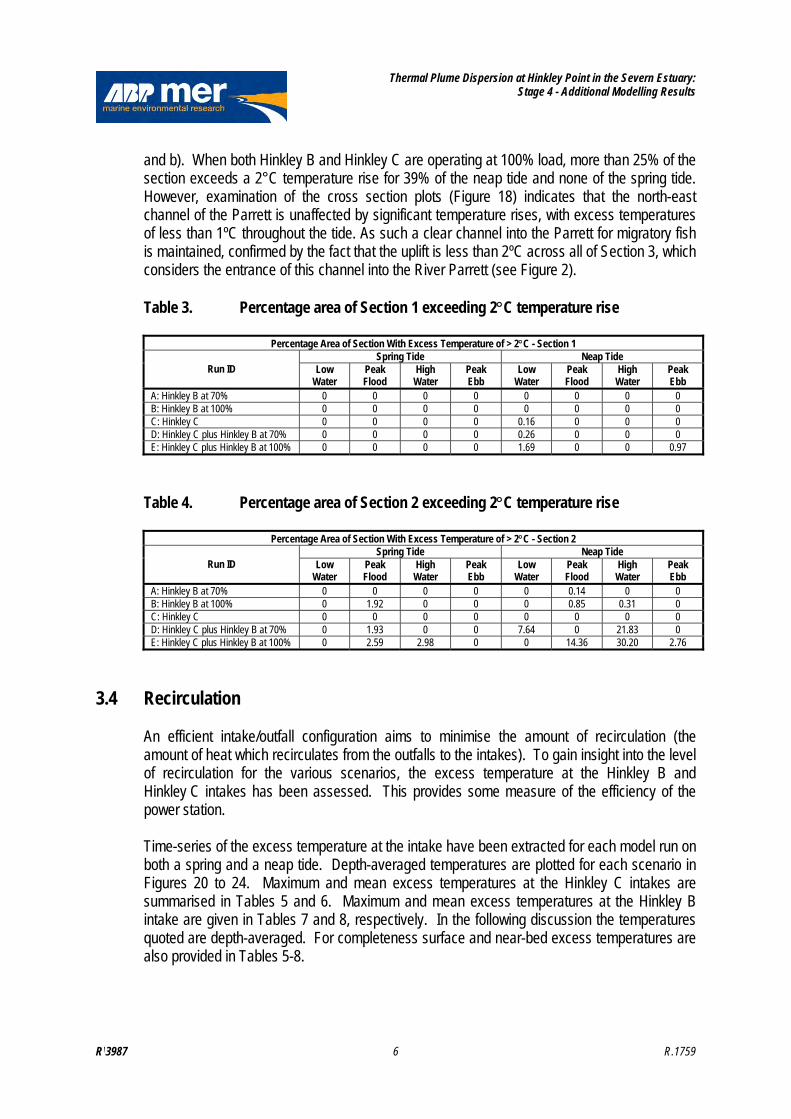
An assessment of the temperature rise across estuarine cross-sections has been undertaken to provide insight into the potential for thermal occlusion. The guidance with regards to thermal occlusion for migratory fish is for less than a 2ºC temperature rise across less than 25% of a cross-section for more than 95% of the time (Turnpenny & Liney, 2007). Four sections were identified for analysis; these are shown in Figure 2. The percentage area of each section exceeding an excess temperature rise of 2C was quantified at low water, peak flood, high water and peak ebb on spring and neap tides. For Sections 3 and 4, the percentage area exceeding a 2C excess temperature was zero for all scenarios and all tidal states and therefore no further discussion of these results is provided. The percentage areas of Sections 1 and 2 exceeding a 2C temperature rise is recorded for each model run in Table 3 and 4, respectively. The percentage area exceeding a 2C temperature rise was less than 2% across Section 1, for all five scenarios. Higher percentages occur across Section 2, with the highest values occurring when Hinkley B and Hinkley C are operating in-combination at 100% load. When Hinkley B and Hinkley C are operating in-combination, highest percentage areas of exceedance occur on neap tides, while for Hinkley B operating without Hinkley C operational, the highest percentage area of exceedance occurs on spring tides at peak flood. Excess temperatures are shown across Section 2 at different stages of the neap tide for each of the five scenarios in Figures 14 to 18. Comparison of these plots indicates the in-combination effects relative to the effects of Hinkley B and Hinkley C operating on their own. Less than 2% of the section exceeds a 2°C rise in temperature when only Hinkley B or Hinkley C is operational. The in-combination scenarios result in excess temperatures of more than 2°C at the south-western limit of the section mainly due to the operation of Hinkley B and at approximately 4km from the start of the section mainly due to the operation of Hinkley C (Figures 17 and 18). At high water on neap tides, 30% of Section 2 exceeds a temperature rise of 2°C when Hinkley B is operating at 100% load in-combination with Hinkley C. This is reduced to 22% when Hinkley B is operating at only 70% load (Table 4). The percentage time when there is more than a 2ºC rise across more than 25% of Section 2 was calculated for a spring and neap tide for the in-combination scenarios. When Hinkley B is operating at 70% load in-combination with Hinkley C the percentage of Section 2 exceeding a 2°C rise in temperature is less than 25% throughout both the spring and neap tide (Figure 19a
Thermal Plume Dispersion at Hinkley Point in the Severn Estuary: Stage 4 - Additional Modelling Results
R\3987 6 R.1759
and b). When both Hinkley B and Hinkley C are operating at 100% load, more than 25% of the section exceeds a 2°C temperature rise for 39% of the neap tide and none of the spring tide. However, examination of the cross section plots (Figure 18) indicates that the north-east channel of the Parrett is unaffected by significant temperature rises, with excess temperatures of less than 1ºC throughout the tide. As such a clear channel into the Parrett for migratory fish is maintained, confirmed by the fact that the uplift is less than 2ºC across all of Section 3, which considers the entrance of this channel into the River Parrett (see Figure 2). Table 3. Percentage area of Section 1 exceeding 2C temperature rise
Percentage Area of Section With Excess Temperature of > 2C - Section 1
Run ID Spring Tide Neap Tide
Low Water
Peak Flood
High Water
Peak Ebb
Low Water
Peak Flood
High Water
Peak Ebb
A: Hinkley B at 70% 0 0 0 0 0 0 0 0 B: Hinkley B at 100% 0 0 0 0 0 0 0 0 C: Hinkley C 0 0 0 0 0.16 0 0 0 D: Hinkley C plus Hinkley B at 70% 0 0 0 0 0.26 0 0 0 E: Hinkley C plus Hinkley B at 100% 0 0 0 0 1.69 0 0 0.97
Table 4. Percentage area of Section 2 exceeding 2C temperature rise
Percentage Area of Section With Excess Temperature of > 2C - Section 2
Run ID Spring Tide Neap Tide
Low Water
Peak Flood
High Water
Peak Ebb
Low Water
Peak Flood
High Water
Peak Ebb
A: Hinkley B at 70% 0 0 0 0 0 0.14 0 0 B: Hinkley B at 100% 0 1.92 0 0 0 0.85 0.31 0 C: Hinkley C 0 0 0 0 0 0 0 0 D: Hinkley C plus Hinkley B at 70% 0 1.93 0 0 7.64 0 21.83 0 E: Hinkley C plus Hinkley B at 100% 0 2.59 2.98 0 0 14.36 30.20 2.76
3.4 Recirculation An efficient intake/outfall configuration aims to minimise the amount of recirculation (the amount of heat which recirculates from the outfalls to the intakes). To gain insight into the level of recirculation for the various scenarios, the excess temperature at the Hinkley B and Hinkley C intakes has been assessed. This provides some measure of the efficiency of the power station. Time-series of the excess temperature at the intake have been extracted for each model run on both a spring and a neap tide. Depth-averaged temperatures are plotted for each scenario in Figures 20 to 24. Maximum and mean excess temperatures at the Hinkley C intakes are summarised in Tables 5 and 6. Maximum and mean excess temperatures at the Hinkley B intake are given in Tables 7 and 8, respectively. In the following discussion the temperatures quoted are depth-averaged. For completeness surface and near-bed excess temperatures are also provided in Tables 5-8.

Thermal Plume Dispersion at Hinkley Point in the Severn Estuary: Stage 4 - Additional Modelling Results
R\3987 7 R.1759
Figures 20 (a and b) and 21 (a and b) indicate how much recirculation is expected from the operation of Hinkley B at 70% load and at 100% load, at the proposed Hinkley C intakes. This is less than 0.35ºC throughout the tide. Excess temperatures at the Hinkley B intake are significantly higher than those at the Hinkley C intakes, with highest values of 1.85ºC occurring at low water on spring tides when Hinkley B is operating at 100% load (Figures 20 and 21 c and d). Figure 22 shows the excess temperatures at the Hinkley C and Hinkley B intakes when only Hinkley C is operating. Highest excess temperatures at the Hinkley C intakes occur during the ebb tide, being 0.94°C and 1.02°C on spring and neap tides respectively. Highest excess temperatures at the Hinkley B intake are similar to those at the Hinkley C intakes. Figures 23 and 24 show the excess temperatures at the intakes when Hinkley B and Hinkley C are operating in-combination. The excess temperatures at the Hinkley C intakes are only slightly elevated when Hinkley B is operational, compared to when it is not operational (by less than 0.25°C). However, the effect of Hinkley C results in a larger increase in mean and maximum excess temperatures at the Hinkley B intakes with mean values increasing from 0.93°C to 1.69°C on a spring tide and from 1.02ºC to 2.04ºC on a neap tide. Table 5. Maximum intake temperatures at Hinkley C
Maximum Excess Temperature at Intake (C)
Run ID Spring Tide Neap Tide
Surface Bed Depth Ave. Surface Bed Depth Ave. A: Hinkley B at 70% 0.26 0.22 0.24 0.26 0.22 0.24 B: Hinkley B at 100% 0.37 0.31 0.34 0.36 0.30 0.33 C: Hinkley C 1.01 0.82 0.94 1.70 0.97 1.02 D Hinkley C plus Hinkley B at 70% 1.22 0.97 1.11 1.77 1.09 1.15 E: Hinkley C plus Hinkley B at 100% 1.31 1.03 1.19 1.84 1.15 1.22
Table 6. Mean intake temperatures at Hinkley C
Mean Excess Temperature at Intake (C)
Run ID Spring Tide Neap Tide
Surface Bed Depth Ave. Surface Bed Depth Ave. A: Hinkley B at 70% 0.07 0.07 0.07 0.14 0.12 0.13 B: Hinkley B at 100% 0.10 0.10 0.10 0.20 0.17 0.18 C: Hinkley C 0.38 0.36 0.37 0.92 0.72 0.78 D Hinkley C plus Hinkley B at 70% 0.44 0.42 0.43 1.03 0.82 0.88 E: Hinkley C plus Hinkley B at 100% 0.47 0.44 0.46 1.08 0.86 0.93
Table 7. Maximum intake temperatures at Hinkley B
Maximum Excess Temperature at Intake (C)
Run ID Spring Tide Neap Tide
Surface Bed Depth Ave. Surface Bed Depth Ave. A: Hinkley B at 70% 1.39 1.38 1.38 2.81 0.86 1.07 B: Hinkley B at 100% 2.64 1.72 1.85 3.80 1.08 1.35 C: Hinkley C 0.92 0.95 0.94 1.06 1.07 1.07 E: Hinkley C plus Hinkley B at 70% 1.96 1.95 1.96 3.69 1.97 2.16 E: Hinkley C plus Hinkley B at 100% 3.19 2.28 2.41 4.67 2.21 2.46

Thermal Plume Dispersion at Hinkley Point in the Severn Estuary: Stage 4 - Additional Modelling Results
R\3987 8 R.1759
Table 8. Mean intake temperatures at Hinkley B
Mean Excess Temperature at Intake (C)
Run ID Spring Tide Neap Tide
Surface Bed Depth Ave. Surface Bed Depth Ave. A: Hinkley B at 70% 0.70 0.65 0.67 1.76 0.65 0.80 B: Hinkley B at 100% 1.20 0.87 0.93 2.39 0.83 1.02 C: Hinkley C 0.74 0.75 0.75 0.92 0.97 0.97 E: Hinkley C plus Hinkley B at 70% 1.45 1.41 1.42 2.66 1.69 1.82 E: Hinkley C plus Hinkley B at 100% 1.95 1.63 1.69 3.28 1.87 2.04
3.5 Comparison with Stage 3 Model Results Map plots showing the difference between the maximum excess temperature for the revised operational characteristics and configuration considered in this study are shown in Figure 25 (for Hinkley B operating at 100% load) and Figure 26 (for Hinkley C operating at 100% load). The modelling results indicate that the revised operational characteristics applied for the Hinkley B power station (see Section 2) only result in changes of more than 0.1°C within 5km of the outfall. Close to the outfall (within 2.5km) there is an increase in the maximum surface excess temperature of more than 0.5°C on neap tides, due to the higher excess temperature and enhanced stratification. Despite this, the level of recirculation is slightly reduced, with average excess temperatures at the Hinkley B intake around 0.05ºC cooler (but up to 0.2°C at certain times of the tide) than for the Hinkley B scenario modelled in Stage 3. This is because the enhanced stratification resulting from the higher excess temperatures of the discharge water facilitates a higher heat loss to the atmosphere and restricts the amount of heat being mixed down through the water column. The change to the outfall rates applied does not affect the predicted impact of Hinkley B operations on recirculation at Hinkley C. The applied revisions to the Hinkley C configuration result in small increases in maximum excess temperature on neap tides when tidal mixing is lower and the plume is more sensitive to the details of the configuration. The increase in excess temperatures can be attributed to the reduction in outfall speed applied (from a mean of 3.25m/s to 1.6m/s), which constrains the plume to lie closer inshore where advective mixing is lower. No changes above 0.1°C are evident beyond 12km of the outfall. Although there is generally an increase in excess temperatures, the excess temperature at the intakes is actually slightly reduced (by 0.02°C to 0.04°C). The in-combination scenario considered in this stage of the study resulted in slightly higher percentages of Section 2 exceeding a 2°C rise on neap tides. For example, the percentage increased from 18% to 22% at high water between the two stages of the study when Hinkley B was operating at 70% load in-combination with Hinkley C. This increase is thought to be due to the reduction in momentum applied at the Hinkley C outfalls, which leads to a small increase in excess temperatures at the near-shore part of the section.
Thermal Plume Dispersion at Hinkley Point in the Severn Estuary: Stage 4 - Additional Modelling Results
R\3987 9 R.1759
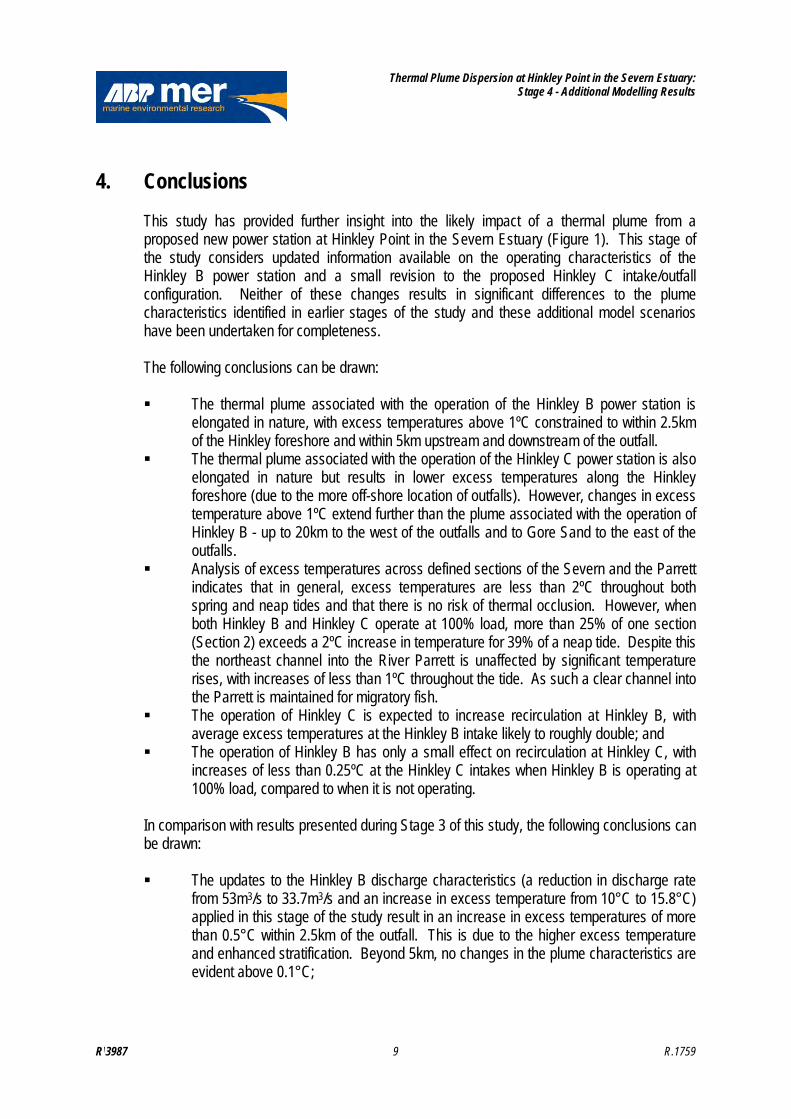
4. Conclusions This study has provided further insight into the likely impact of a thermal plume from a proposed new power station at Hinkley Point in the Severn Estuary (Figure 1). This stage of the study considers updated information available on the operating characteristics of the Hinkley B power station and a small revision to the proposed Hinkley C intake/outfall configuration. Neither of these changes results in significant differences to the plume characteristics identified in earlier stages of the study and these additional model scenarios have been undertaken for completeness. The following conclusions can be drawn: The thermal plume associated with the operation of the Hinkley B power station is
elongated in nature, with excess temperatures above 1ºC constrained to within 2.5km of the Hinkley foreshore and within 5km upstream and downstream of the outfall.
The thermal plume associated with the operation of the Hinkley C power station is also elongated in nature but results in lower excess temperatures along the Hinkley foreshore (due to the more off-shore location of outfalls). However, changes in excess temperature above 1ºC extend further than the plume associated with the operation of Hinkley B - up to 20km to the west of the outfalls and to Gore Sand to the east of the outfalls.
Analysis of excess temperatures across defined sections of the Severn and the Parrett indicates that in general, excess temperatures are less than 2ºC throughout both spring and neap tides and that there is no risk of thermal occlusion. However, when both Hinkley B and Hinkley C operate at 100% load, more than 25% of one section (Section 2) exceeds a 2ºC increase in temperature for 39% of a neap tide. Despite this the northeast channel into the River Parrett is unaffected by significant temperature rises, with increases of less than 1ºC throughout the tide. As such a clear channel into the Parrett is maintained for migratory fish.
The operation of Hinkley C is expected to increase recirculation at Hinkley B, with average excess temperatures at the Hinkley B intake likely to roughly double; and
The operation of Hinkley B has only a small effect on recirculation at Hinkley C, with increases of less than 0.25ºC at the Hinkley C intakes when Hinkley B is operating at 100% load, compared to when it is not operating.
In comparison with results presented during Stage 3 of this study, the following conclusions can be drawn: The updates to the Hinkley B discharge characteristics (a reduction in discharge rate
from 53m3/s to 33.7m3/s and an increase in excess temperature from 10°C to 15.8°C) applied in this stage of the study result in an increase in excess temperatures of more than 0.5°C within 2.5km of the outfall. This is due to the higher excess temperature and enhanced stratification. Beyond 5km, no changes in the plume characteristics are evident above 0.1°C;
Thermal Plume Dispersion at Hinkley Point in the Severn Estuary: Stage 4 - Additional Modelling Results
R\3987 10 R.1759
The change to the Hinkley C intake/outfall configuration slightly increases excess
temperatures along the foreshore around Hinkley Point, and reduces temperatures further offshore in comparison to the Hinkley C configuration considered in Stage 3. Beyond 12km, no changes in the plume characteristics are evident above 0.1°C;
The updates applied to the Hinkley B outfall rates in this study reduce Hinkley B average intake temperatures by around 0.05ºC due to an increase in stratification and a reduction in the mixing of heat down through the water column;
The change to the Hinkley B outfall rates applied does not affect the predicted impact of Hinkley B operations on recirculation at Hinkley C;
The modifications made to the Hinkley C outfall slightly reduce the recirculation at Hinkley C, by 0.02ºC-0.04ºC.
The differences between the plume characteristics from Stage 3 and Stage 4 are small compared to the differences arising from a range of meteorological and geomorphological conditions (see BEEMS Technical Report TR085 and BEEMS Technical Report TR121). The inferences made from the previous modelling work on geomorphology and meteorological scenarios therefore remain valid.
5. References BEEMS Technical Report TR084: HP Thermal Plume Modelling: Delft3D - Stage 1 Model Calibration and Validation. ABP Marine Environmental Research Ltd (R.1535, 2009). BEEMS Technical Report TR085: HP Thermal Plume Modelling: Delft3D - Stage 2 Model Results. ABP Marine Environmental Research Ltd (R.1549, 2009). BEEMS Technical Reports TR121: HP Thermal Plume Modelling. Delf3D Stage3 Results. ABP Marine Environmental Research Ltd (R.1758, 2011). Turnpenny, A.W.H & Liney, K.E. (2007) Review and development of temperature standards for marine and freshwater environments. Jacobs.

Figures

Position of intakes and outfalls Figure 1
Location plot showing cross-sections Figure 2

Maximum and mean surface excess temperature field for Scenario A: Hinkley B at 70%, spring tide
Figure 3

Maximum and mean surface excess temperature field for Scenario A: Hinkley B at 70%, neap tide
Figure 4
Maximum and mean surface excess temperature field for Scenario B: Hinkley B at 100%, spring tide
Figure 5
Maximum and mean surface excess temperature field for Scenario B: Hinkley B at 100%, neap tide
Figure 6

Maximum and mean surface excess temperature field for Scenario C: Hinkley C, spring tide
Figure 7

Maximum and mean surface excess temperature field for Scenario C: Hinkley C, neap tide
Figure 8
Maximum and mean surface excess temperature field for Scenario D: Hinkley C plus Hinkley B at 70%, spring tide
Figure 9
Maximum and mean surface excess temperature field for Scenario D: Hinkley C plus Hinkley B at 70%, neap tide
Figure 10

Maximum and mean surface excess temperature field for Scenario E: Hinkley C plus Hinkley B at 100%, spring tide
Figure 11

Maximum and mean surface excess temperature field for Scenario E: Hinkley C plus Hinkley B at 100%, neap tide
Figure 12

Maximum near bed excess temperatures for all scenarios during a spring and neap tide
Figure 13

Excess temperature (C) across Section 2 (from South West to
North East), neap tide, for Scenario A: Hinkley B at 70% Figure 14

Excess temperature (C) across Section 2 (from South West to North East), neap tide, for Scenario B: Hinkley B at 100%
Figure 15
Excess temperature (C) across Section 2 (from South West to North East), neap tide, for Scenario C: Hinkley C
Figure 16

Excess temperature (C) across Section 2
(from South West to North East), neap tide, for Scenario D: Hinkley C plus Hinkley B at 70%
Figure 17

Excess temperature (C) across Section 2
(from South West to North East), neap tide, for Scenario E: Hinkley C plus Hinkley B at 100%
Figure 18

Area of Section 2 with >2ºC temperature rise for (a and b) Scenario D: Hinkley C plus Hinkley B at 70% and (c and d)
Scenario E: Hinkley C plus Hinkley B at 100% Figure 19

Excess temperatures for Scenario A: Hinkley B at 70% for (a and b) Hinkley C intakes
and (c and d) Hinkley B intakes Figure 20

Excess temperatures for Scenario B: Hinkley B at 100% for (a and b) Hinkley C intakes
and (c and d) Hinkley B intakes Figure 21

Excess temperatures for Scenario C: Hinkley C for (a and b) Hinkley C intakes and
(c and d) Hinkley B intakes Figure 22

Excess temperatures for Scenario D: Hinkley C plus Hinkley B at 70% for (a and b)
Hinkley C intakes and (c and d) Hinkley B intakes Figure 23
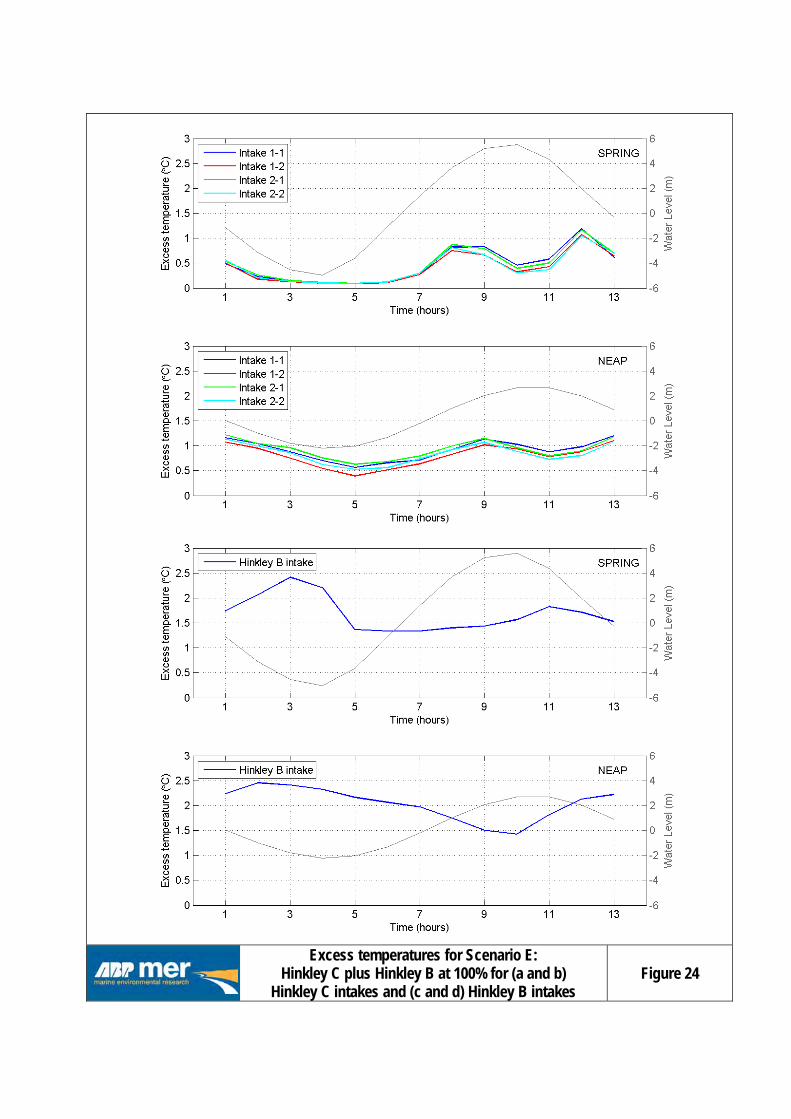
Excess temperatures for Scenario E: Hinkley C plus Hinkley B at 100% for (a and b)
Hinkley C intakes and (c and d) Hinkley B intakes Figure 24

Difference in maximum surface excess temperature field for Hinkley B at 100% (Stage 4 minus Stage 3)
Figure 25

Difference in maximum surface excess temperature field for Hinkley C (Stage 4 minus Stage 3)
Figure 26


British Energy Estuarine and Marine Studies(BEEMS) is a research programme funded byEDF Energy to provide scientific backgroundfor the marine issues surrounding newnuclear build.