Embed Size (px)
Citation preview

1
Hindusthan National Glass & Industries Ltd.

2
Disclaimer
Certain statements in this communication may be ‘forward looking statements’ within the meaning of applicable laws and regulations. These forward-looking statements involve a number of risks, uncertainties and other factors that could cause actual results to differ materially from those suggested by the forward-looking statements. Important developments that could affect the Company’s operations include changes in the industry structure, significant changes in political and economic environment in India and overseas, tax laws, import duties, litigation and labour relations.
Hindusthan National Glass & Industries Limited will not be in any way responsible for any action taken based on such statements and undertakes no obligation to publicly update these forward-looking statements to reflect subsequent events or circumstances.

Industry Snapshot Company Overview Business Overview Operating and Financial Performance Annexures
3
Table of Contents

4
4

5
Global Packaging Industry
• As per World Packaging Organization, the global packaging industry is expected to be USD 597 billion
by 2014 with ten year historical growth at ~ 3.1% CAGR
• Projected to grow at ~ 3.5% CAGR in the medium term mainly driven by growth in emerging markets
(Asia Pacific region)
Source: Owens-Illinois, Inc. - Investor presentation, March 2010
34%
34%
27%
5%
Geography
Europe
Asia, Oceana, Africa & ME
North America
South & Central America
52%
15%
11%
9%
13%
End-User
Liquor
Beer
Food
Pharma
Others
Packaging Industry in India
World glass container per capita consumption
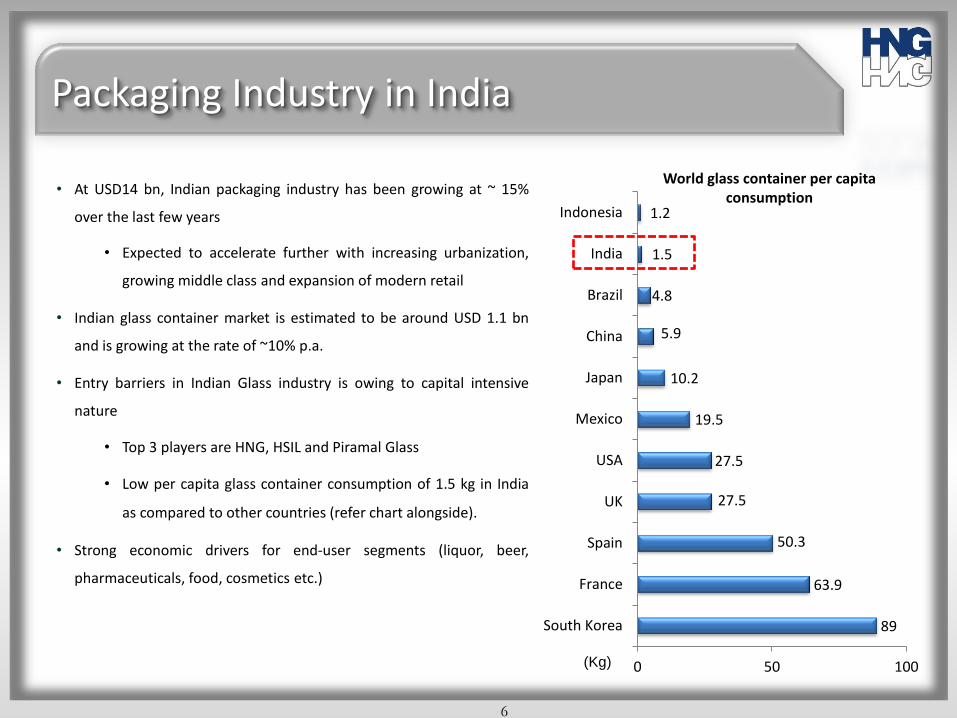
• At USD14 bn, Indian packaging industry has been growing at ~ 15%
over the last few years
• Expected to accelerate further with increasing urbanization,
growing middle class and expansion of modern retail
• Indian glass container market is estimated to be around USD 1.1 bn
and is growing at the rate of ~10% p.a.
• Entry barriers in Indian Glass industry is owing to capital intensive
nature
• Top 3 players are HNG, HSIL and Piramal Glass
• Low per capita glass container consumption of 1.5 kg in India
as compared to other countries (refer chart alongside).
• Strong economic drivers for end-user segments (liquor, beer,
pharmaceuticals, food, cosmetics etc.)
89
63.9
50.3
27.5
27.5
19.5
10.2
5.9
4.8
1.5
1.2
0 50 100
South Korea
France
Spain
UK
USA
Mexico
Japan
China
Brazil
India
Indonesia
(Kg)
6
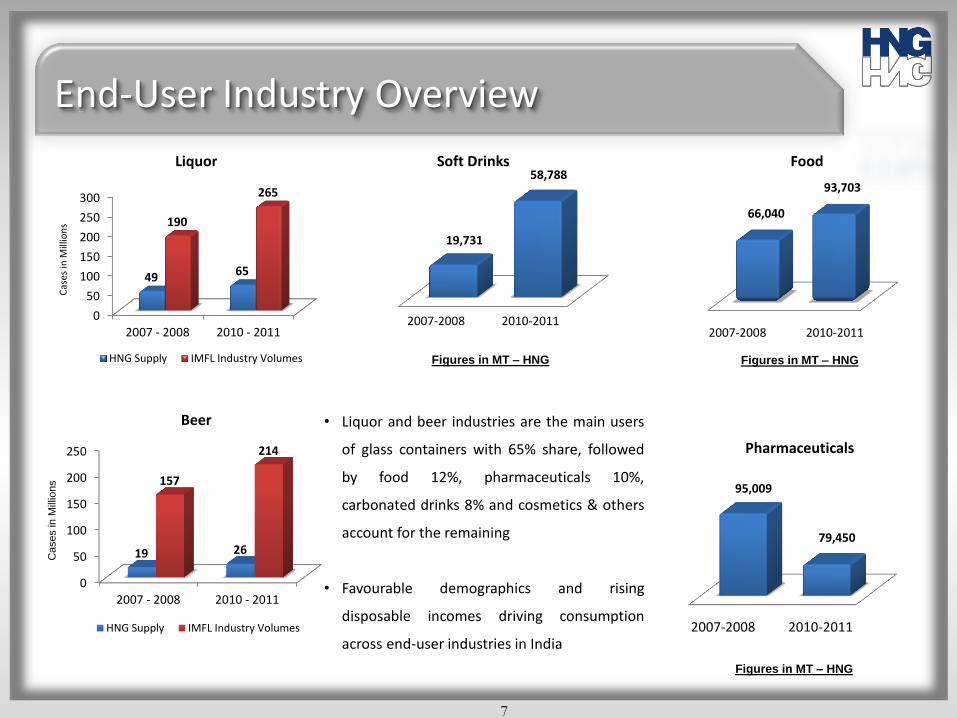
End-User Industry Overview
66,040
93,703
2007-2008 2010-2011
Figures in MT – HNG
19,731
58,788
2007-2008 2010-2011
Figures in MT – HNG
95,009
79,450
* 2007-2008 2010-2011
Figures in MT – HNG
Pharmaceuticals
Soft Drinks Food
Beer
Liquor
0
50
100
150
200
250
300
2007 - 2008 2010 - 2011
49 65
190
265
HNG Supply IMFL Industry Volumes
Cas
es in
Mill
ion
s
0
50
100
150
200
250
2007 - 2008 2010 - 2011
19 26
157
214
HNG Supply IMFL Industry Volumes
Cases in
Mill
ions
• Liquor and beer industries are the main users
of glass containers with 65% share, followed
by food 12%, pharmaceuticals 10%,
carbonated drinks 8% and cosmetics & others
account for the remaining
• Favourable demographics and rising
disposable incomes driving consumption
across end-user industries in India
7
8
8
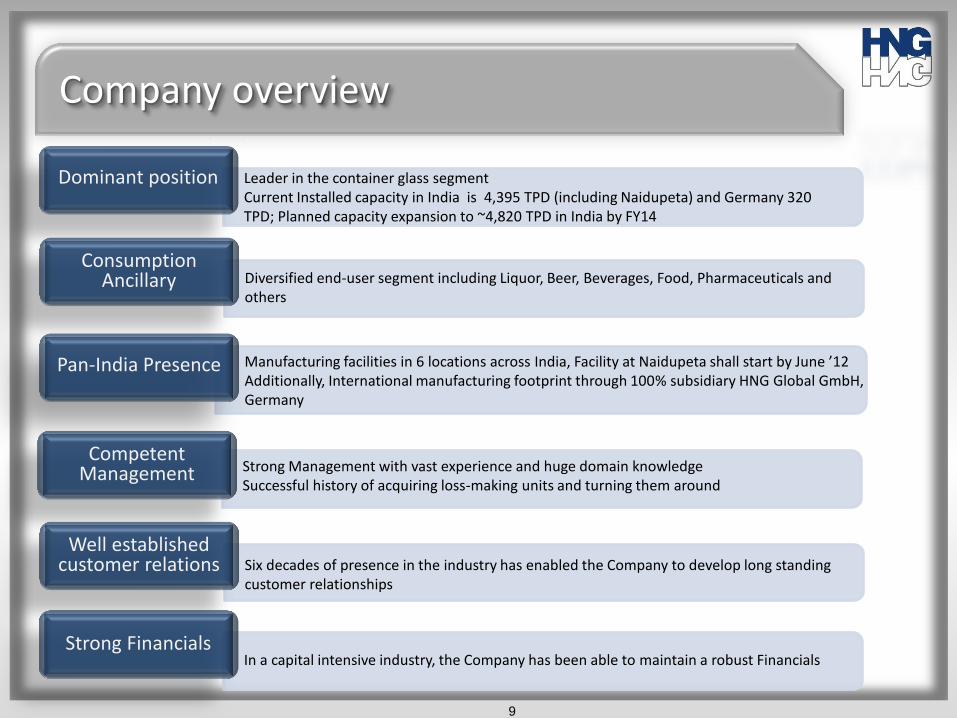
Company overview
Leader in the container glass segment Current Installed capacity in India is 4,395 TPD (including Naidupeta) and Germany 320 TPD; Planned capacity expansion to ~4,820 TPD in India by FY14
Manufacturing facilities in 6 locations across India, Facility at Naidupeta shall start by June ’12 Additionally, International manufacturing footprint through 100% subsidiary HNG Global GmbH, Germany
Diversified end-user segment including Liquor, Beer, Beverages, Food, Pharmaceuticals and others
Strong Management with vast experience and huge domain knowledge Successful history of acquiring loss-making units and turning them around
Six decades of presence in the industry has enabled the Company to develop long standing customer relationships
In a capital intensive industry, the Company has been able to maintain a robust Financials
Dominant position
Pan-India Presence
Consumption Ancillary
Competent Management
Well established customer relations
Strong Financials
9

Corporate Milestones
10
1952 2001 2002 2005 2006 2007 2011 2012
First 30 TPD plant
commissioned in 1952
Second 90 TPD plant
commissioned in 1964
Capacities expanded to
1,100 TPD
Acquired 2 plants (Rishikesh &
Pondicherry with total capacity 700 TPD) from Owens
Brockway India Ltd, a subsidiary of Owens
Illinois, USA. Renamed the
company as Ace Glass Containers Ltd.
Acquired 320 TPD
loss making glass
division from Larsen & Toubro at
Nashik
Ace Glass Containers
Ltd. merged
with HNG
Established float glass plant in Halol under
HNG Float Glass Ltd.
Acquired 180 TPD Neemrana unit of Haryana
Sheet Glass
Acquired assets of
Agenda Glas AG in May
2011; 320 TPD facility at
Gardelegen, Germany
Commissioned 650 TPD
furnace at Nashik on 28th February 2012.
Our 7th plant at Naidupeta (650 TPD) shall begin
commercial production from
June 2012
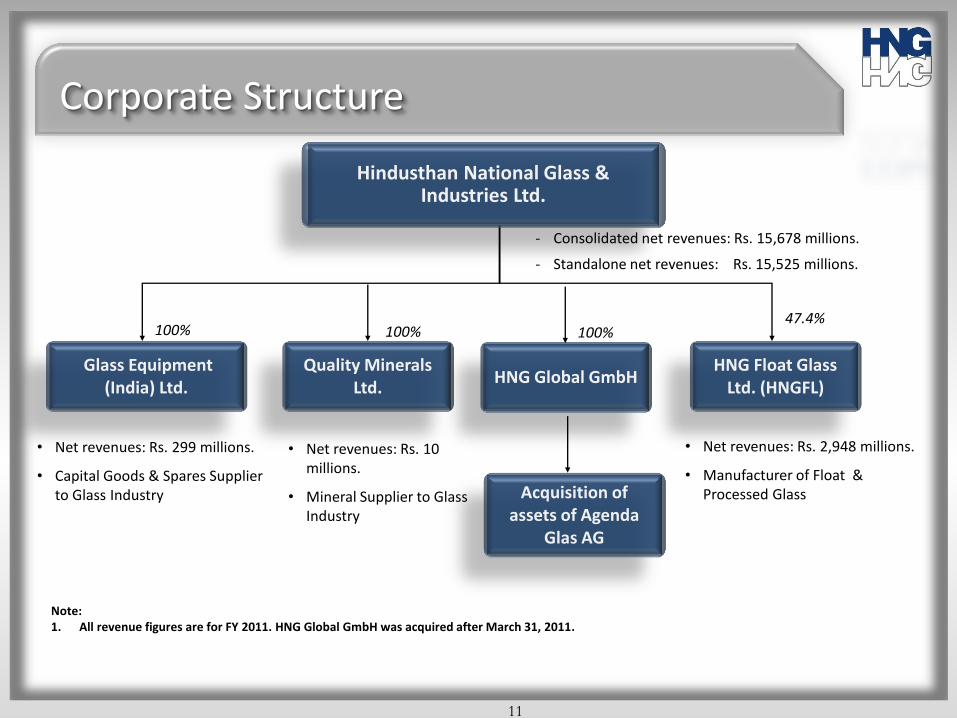
Corporate Structure
100% 100%
• Net revenues: Rs. 299 millions.
• Capital Goods & Spares Supplier to Glass Industry
• Net revenues: Rs. 10 millions.
• Mineral Supplier to Glass Industry
• Net revenues: Rs. 2,948 millions.
• Manufacturer of Float & Processed Glass
47.4%
- Consolidated net revenues: Rs. 15,678 millions.
- Standalone net revenues: Rs. 15,525 millions.
11
Note: 1. All revenue figures are for FY 2011. HNG Global GmbH was acquired after March 31, 2011.
100%
Glass Equipment (India) Ltd.
Quality Minerals Ltd.
HNG Global GmbH HNG Float Glass
Ltd. (HNGFL)
Acquisition of assets of Agenda
Glas AG
Hindusthan National Glass & Industries Ltd.

Pan – India Presence
12
• HNG, the largest container glass
manufacturer in India has a manufacturing
capacity of 4,395 TPD (including 650 TPD
of Naidupeta)
• Multi-locational production facilities
enable the Company to:
Lower landed cost to customers
Provide JIT supplies
Cater to key customers across
India
Note: The total capacity is expected to grow to ~4,820 TPD by FY14 in India.
Rishikesh Bahadurgarh
Chennai
Delhi
Neemrana
Vadodara Kolkata
Puducherry
Rishra
Nashik
Mumbai
Hyderabad
Naidupeta
Bengaluru
Marketing Offices
Container Glass Plant Locations
Upcoming Greenfield Mega Project
Commenced Brownfield Mega Project (Nashik)
Float Glass Unit
GEIL
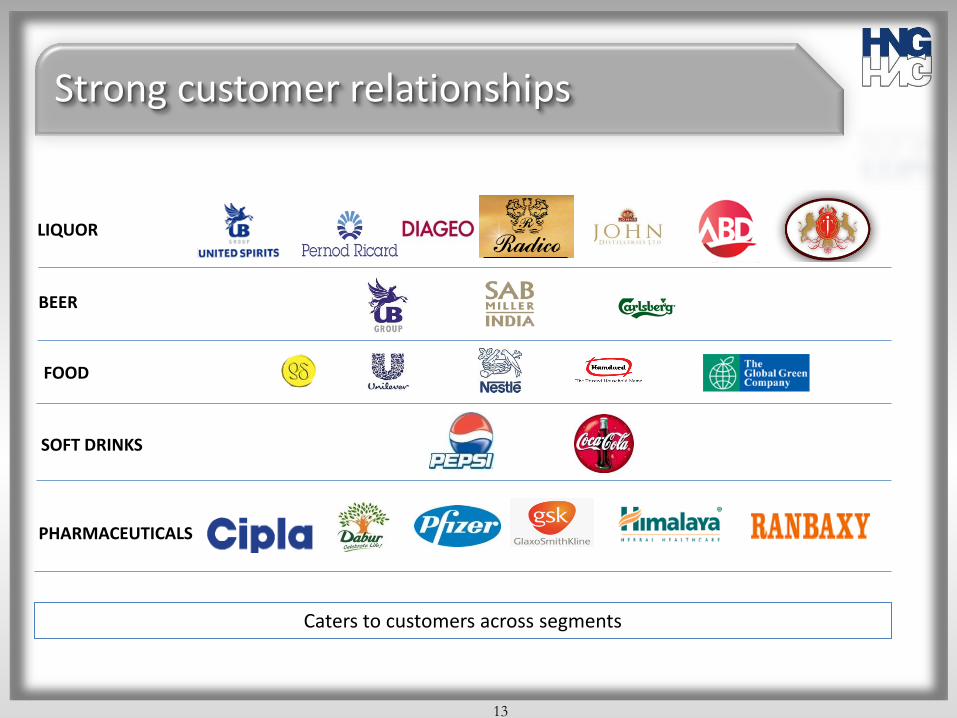
Strong customer relationships
Caters to customers across segments
PHARMACEUTICALS
BEER
LIQUOR
FOOD
SOFT DRINKS
13

HNG’s Share of Top 10 Customers
0
10
20
30
40
50
60
70
80
90
100
UnitedSpirits
Limited
UnitedBreweries
Limited
PernodRicardIndia
SAB MillerIndia
AlliedBlenders &
Distillers
Coca ColaIndia
PepsicoIndia
Bajaj CorpLimited
ShivaDistilleries
JohnDistilleries
Limited
60 65
55 60
80
40
70
95
80
50
HNG's Share in the Total Requirement of Top 10 Customers in 2010-11 (%)
14

15
15

Expanding Scale
Present capacity of c. 4,000 TPD with proposed expansion to c. 5,100 TPD by FY14
16
Location Capacity
as at March 2012 Expected Capacity as at March 2014
To be Commissioned in New Furnace(N) /
Rebuild (R)
RSR Furnace 1 280 280 - -
RSR Furnace 2 250 250 - -
RSR Furnace 6 360 475 2012-13 R
BGR Furnace 3 330 330 - -
BGR Furnace 4 320 320 - -
BGR Furnace 5 195 195 - -
NMR Furnace 180 300 2012-13 R
RSK Furnace 1 310 310 - -
RSK Furnace 2 150 150 - -
PDY Furnace 1 360 360 - -
NSK Furnace 1 360 550 2013-14 R
NSK Furnace 2 650 650 Started on 28th February, 12 N
Naidupeta - 650 2012-13 N
Gardelegen 320 320 Acquired in May 2011 -
TOTAL 4,065 5,140

HNG Global GmbH, Gardelegen, Germany
17
• One of the most modern production facilities in Europe, with 320 tpd capacity.
• HNG Global GmbH, is located closed to the regional raw material suppliers with easy and economic
access to all key raw materials.
• The Plant is ideally located for deliveries throughout Germany and to adjacent European Countries.
• Germany is the largest market for Container Glass in Europe, with a share of ~ 20%.
• Company’s technological edge is planned to be back pedaled in HNG’s Indian operations, as Germany is
always considered ahead in terms of technology.
• The Finished-ware quality in Germany is of superior standards than in India and it will help us embark
the upward quality journey in India.

Business Strategy
• Acquired and turned around four loss making units over the last nine years • Planned expansions to take total capacity to ~ 4,820 TPD at Indian level by FY14
• Introduced Narrow Neck Press and Blow (NNPB) technology, first in India • Sustained competitive advantage through product optimization and continuous innovation • Increasing production of light weighted bottles to enhance margins
• Presence across key user industries – liquor, beer, pharmaceuticals and food • Capitalizing on opportunities in the high growth float glass industry
• Captive power plant to improve cost efficiencies (at Bahadurgarh plant) • Silica mining to support raw material supply chain (Proposed) • Manufacturing of glass machines & spares in 100% subsidiary GEIL
• Gained European presence, one of the largest markets for food and alco-bev industries • Access to technological strength and production processes
Capacity Expansion
Adapting new technology
Expanding product portfolio
Backward integration
International Footprint
18

19

Operational Overview
Key Highlights
• Firm domestic demand driven by growth in end-user
industries - liquor, beer, pharmaceuticals, foods and
carbonated drinks
• Manufacturing facilities located across India provide an
edge over peers who have only regional presence
• Pan-India distribution network
• Implementation of advanced technology enables improved
cost efficiencies
7,67,258 7,85,300
8,29,374
6,92,161
400000
500000
600000
700000
800000
FY 2009 FY 2010 FY 2011 9-M FY 2012
Production volume (MT)
7,65,459 7,82,584
8,42,246
6,64,794
400000
500000
600000
700000
800000
FY 2009 FY 2010 FY 2011 9-M FY 2012
Sales Volume (MT)
20
17,151 17,344
18,332
20,482
15000
16000
17000
18000
19000
20000
21000
FY 2009 FY 2010 FY 2011 9-M FY 2012
Realization (Rs. / MT)
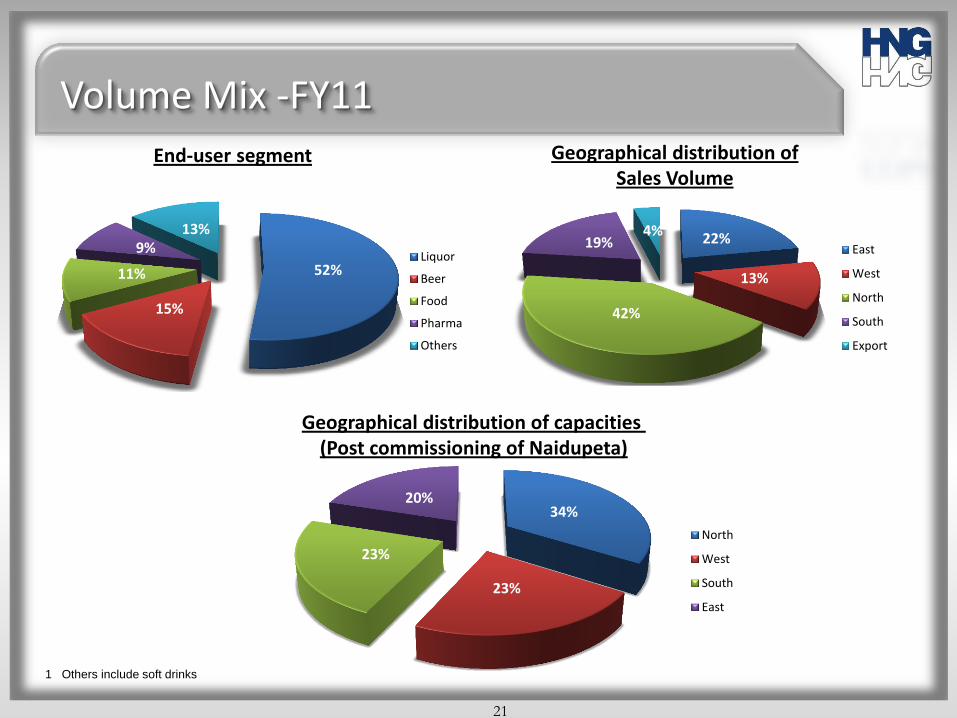
End-user segment
Volume Mix -FY11
1 Others include soft drinks
52%
15%
11%
9% 13%
Liquor
Beer
Food
Pharma
Others
Geographical distribution of Sales Volume
21
Geographical distribution of capacities (Post commissioning of Naidupeta)
22%
13%
42%
19% 4%
East
West
North
South
Export
34%
23%
23%
20%
North
West
South
East

Financial Performance (All figures stated in Rs. millions on a standalone basis)
22
12.34
17.77
9.9
6.9
0
5
10
15
20
FY2009 FY2010 FY2011 9-M FY 2012
EPS (Rs. / share)
13,110 13,599
15,434
13,616
8000
9000
10000
11000
12000
13000
14000
15000
16000
FY2009 FY2010 FY2011 9-M FY 2012
Net Turnover
2359
3163
2705
2275
18.0%
23.3%
17.5%
16.7%
10%
15%
20%
25%
0
1000
2000
3000
4000
FY2009 FY2010 FY2011 9-M FY 2012
EBIDTA
EBITDA Margins
1077
1552
864
603 8.2%
11.4%
5.6%
4.4%
2%
7%
12%
17%
0
500
1000
1500
2000
FY2009 FY2010 FY2011 9-M FY 2012
PAT
PAT Margins

Balance Sheet (All figures stated in Rs. millions on a standalone basis)
Particulars (Rs. million) Nine months ended
December, 2011 Year ended
March, 2011 Year ended
March, 2010
Share Holders Funds 12,275 11,661 10,428
Loan Funds 16,302 6,395 5,657
Deferred Tax Liabilities 712 712 697
TOTAL LIABILITIES 29,289 18,769 16,782
Net Block + Capital Work-in-progress
23,233 13,845 11,438
Investments 2,281 1,775 1,471
Net Current Assets 3,775 3,149 3,873
TOTAL ASSETS 29,289 18,769 16,782
23
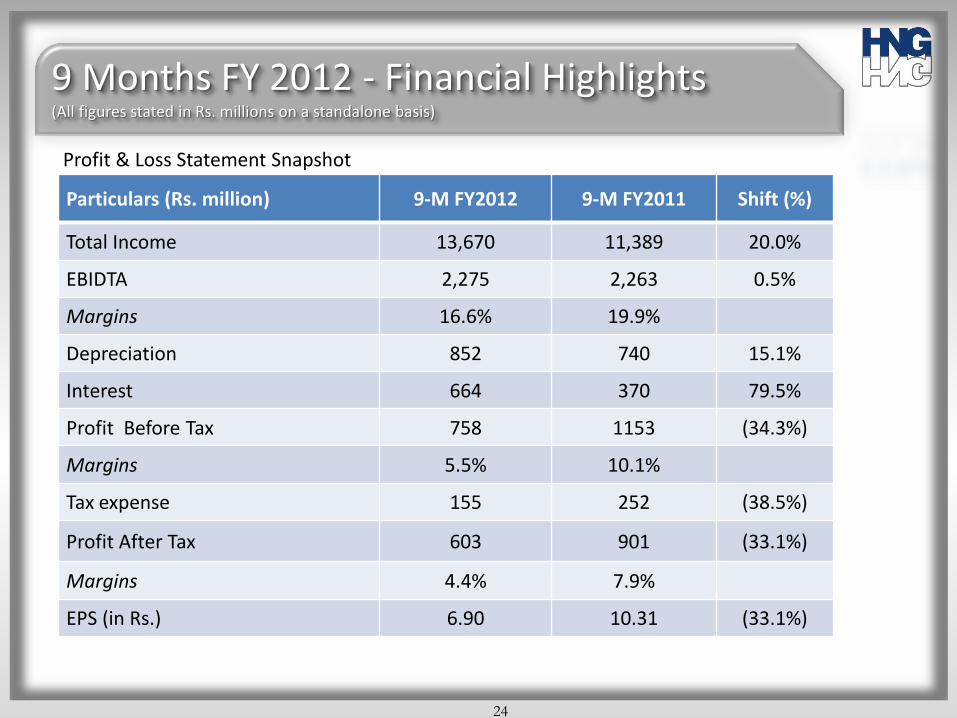
9 Months FY 2012 - Financial Highlights (All figures stated in Rs. millions on a standalone basis)
Profit & Loss Statement Snapshot
24
Particulars (Rs. million) 9-M FY2012 9-M FY2011 Shift (%)
Total Income 13,670 11,389 20.0%
EBIDTA 2,275 2,263 0.5%
Margins 16.6% 19.9%
Depreciation 852 740 15.1%
Interest 664 370 79.5%
Profit Before Tax 758 1153 (34.3%)
Margins 5.5% 10.1%
Tax expense 155 252 (38.5%)
Profit After Tax 603 901 (33.1%)
Margins 4.4% 7.9%
EPS (in Rs.) 6.90 10.31 (33.1%)

25

* Includes 16.76% held as Treasury Shares in the Company
Total 87.3 million shares
Listed at: National Stock Exchange (NSE) - HINDNATGLS
Bombay Stock Exchange (BSE) - 515145
Calcutta Stock Exchange (CSE)
Shareholding Pattern
Particulars % Shareholding
(as on December, 2011)
Promoters 69.98
Public Shareholding 30.02
Insurance Companies 0.31
Bodies Corporate 3.93
Financial Institutional Investors 7.28
Individuals & Others* 18.50
Total 100.00
26

Ratings, Rankings & Accreditations
• Business Today Ranking (Out of 500 top listed corporates, as of October, 2011)
• In terms of Average Market Capitalization – 368th
• Rating by CARE (Credit Analysis & Research Ltd.)
• Long Term credit rating of AA+(implying high safety for timely servicing of debt obligations and carrying
very low credit risk).
• Short Term credit rating of PR1(+), being the highest grade (implying the lowest credit risk).
• Rated as the best Indian Company in the Glass & Ceramics category by Dun & Bradstreet in
years 2009 and 2010
• Accredited with ISO 9001:2008 certification, ensuring stringent quality standards and ISO
22000 for food and safety
• Rated at No.35, out of the best 500 companies by Inc.India (Comprehensive ranking of India’s
best performing mid-sized companies) in their Sep-Oct, 2010 issue.
27
Hindusthan National Glass & Industries Ltd. (HNG)
For further information please log on to www.hngindia.com or contact:
Laxmi Narayan Mandhana (CFO)
HNG
Tel: 033-2254-3100
Email: [email protected]
Anoop Poojari / Dipti Yadava
Citigate Dewe Rogerson
Tel: +91 22 6645 1211 / 1218
Email: [email protected] /
28