Embed Size (px)
Citation preview

Hindustan Construction Co Ltd

By: Ajit. S. Shenoy
18th November 2016
Mumbai
NOV 2016-PLATT STEEL
ASIA CONF.
IMPACT OF STEEL ON CONSTRUCTION INDUSTRY-AN END USER’S PERSPECTIVE
2
IMPACT OF STEEL ON CONSTRUCTION INDUSTRY-
AN END USER’S PERSPECTIVE

Infrastructure Development in India –
Expressways & Highways
NOV 2016-PLATT STEEL
ASIA CONF.
IMPACT OF STEEL ON CONSTRUCTION INDUSTRY-AN END USER’S PERSPECTIVE
3

Sector Snapshot
Third-largest road network in the world, next in line only to the US and China
• Carries almost 65% of freight and 80% of passenger traffic.
• National Highways constitute for almost 2% of the network but carry about 40% of the total road traffic
Road program is the second largest infra program, next only to Power
• During the period FY 2013-17 total national highway networks in the country is expected to grow by a CAGR of ~3.7% to reach ~92,000 kms
March 2015 Infrastructure Development in India 4
National Highways / Expresswa
ys 2%
State Highways
3%
Major Roads 61%
Rural Roads 34%
Distribution of Road length in India – 4.69 Mn Km

Sector Opportunity
Proposed Investments in 12th 5 year plan – US$ 130 Billion – Build @ 20 km of roads per day
70% of the investment would be spent on National Highways and the balance on State Highways
50% of the investments are expected to come from private sector
March 2015 Infrastructure Development in India 5
72,000
74,000
76,000
78,000
80,000
82,000
84,000
86,000
88,000
90,000
92,000
94,000
2013 2014 2015 2016 2017
Projected Growth in National Highway
Network- Km

Sector Opportunity
National Highways – Targets :
• Developing 1000 km of expressways
• Developing 8,737 km of roads, including 3,846 km of national highways in the North Eastern Indian states
• Four-laning 20, 000 km of national highways
• Four-laning 6,736 km on North-South and East-West corridors
• Six-laning 6,500 km of the Golden Quadrilateral and selected national highways
• Widening 20,000 km of national highways to two lanes
State Highways - Targets :
• 2 laning of 30,000 Km
• 4 laning of 5,000 Km
• Strengthening of 41,500 Km
Policy
• 100% FDI under the automatic route is permitted for all road development projects
• 100% income tax exemption for a period of 10 years
• Grants / Viability gap Funding for marginal projects by NHAI.
MNOV 2016-PLATT
STEEL ASIA CONF.
IMPACT OF STEEL ON CONSTRUCTION INDUSTRY-AN END USER’S PERSPECTIVE
6
Infrastructure Development in India –
Railways
NOV 2016-PLATT STEEL
ASIA CONF.
IMPACT OF STEEL ON CONSTRUCTION INDUSTRY-AN END USER’S PERSPECTIVE
7
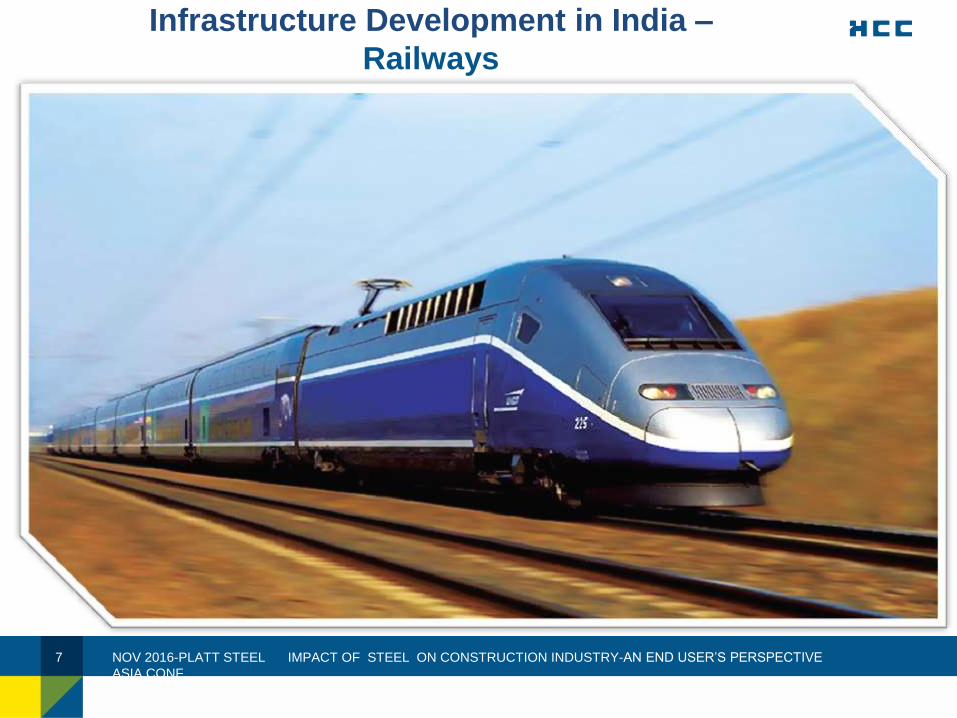
5 Year Roadmap : 2015 – 2019
Investment of Rs 8.56 lakh Crs / US$ 140 Billion
Item Expenditure
US$ Billion
% share of
total
expenditure
Network Decongestion 32 23%
Network Expansion 32 23%
National Projects 7 5%
Safety 20 14%
Rolling Stock 17 12%
High Speed Corridor 11 8%
Station Redevelopment 15 11%
Others 6 4%
Total 140
NOV 2016-PLATT STEEL
ASIA CONF.
8 IMPACT OF STEEL ON CONSTRUCTION INDUSTRY-AN END USER’S PERSPECTIVE
Increase the daily passenger capacity from 21 Mn to 30 Mn
• 2,000 kms of High speed rail corridors have been planned.
• Increase the track length by 20% from 1,14,000km to 1,38,000km
Raise freight carrying capacity from 1000 Mn T to 1500 Mn T
• Coastal Connectivity Program - Railways in partnership with ports will deliver rail connectivity to Nargol, Chharra, Dighi, Rewas and Tuna .
• 9538 KM of Dedicated freight Corridors at a total estimated cost US$ 35 Billion planned in next 10 Years
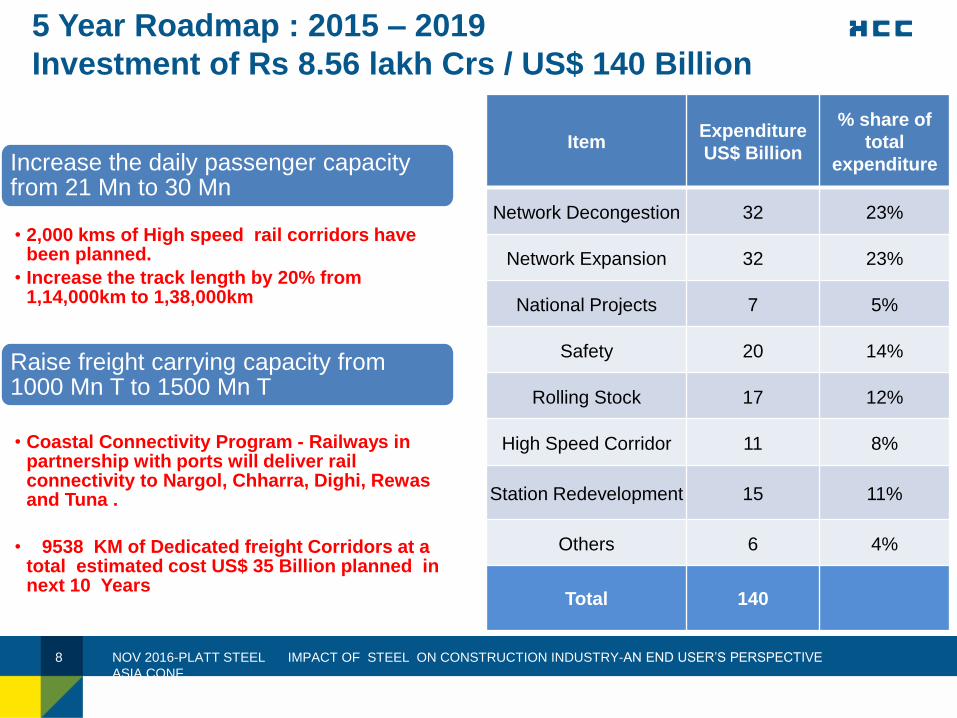
A no. of Mass Rapid Transit Systems are also being
planned across major Indian cities
Ludhiana
28.45 Km 1,600
Jaipur
28.5 Km 800
Ahmedabad
42 Km 1,600
Mumbai Metro Line 3
32.5 Km 3,800
Pune Metro
31.4 Km 3,200
Kolkata Metro
82 Km 1,800
Delhi Metro, Ph 4
109 Km 2,600
Name of Project
Length Km Value – US$ Mn
Over 500 Km of MRTS valued over US$ 20 Billion to be built across 8 cities
Guwahati Metro
44 Km 900
Patna Metro
60 Km 1,600
Cuttack &
Bhubaneshwar Metro
40 Km 2,200
Growth Drivers
Increasing Urbanization
Economic Growth & demands thereof
Increased congestion on Urban roads
Growth in passenger traffic and automobiles
NOV 2016-PLATT STEEL
ASIA CONF.
IMPACT OF STEEL ON CONSTRUCTION INDUSTRY-AN END USER’S PERSPECTIVE
9

Infrastructure Development in India –
Airports
NOV 2016-PLATT STEEL
ASIA CONF.
IMPACT OF STEEL ON CONSTRUCTION INDUSTRY-AN END USER’S PERSPECTIVE
10

Sector Snapshot
0
50
100
150
200
250
FY06
FY07
FY08
FY09
FY10
FY11
FY12
FY17[E]
Growth in Passenger Traffic - Millions
Domestic International
NOV 2016-PLATT STEEL
ASIA CONF.
IMPACT OF STEEL ON CONSTRUCTION INDUSTRY-AN END USER’S PERSPECTIVE
11
•There are 136 airports/ airstrips in the country,
of which AAI owns and manages 103 airports
and 25 civil enclaves at defence airfields
•Airports account for about 17% of the total
number and total value of projects planned in
the infrastructure space and 2% of the total
infrastructure budget allocations .
•Passenger traffic in India increased at a CAGR
of 13% (Domestic: 13%; International: 10%)
over the last 10 years

Sector Opportunity
All values in
US$ Million Private
AAI /
Central Govt State Govt
Metro Airports 3,000 250
Non Metro
Airports 1,000 250
Greenfield
Airports 3,583 200 333
Non operational
Airports 1,000
Other Airports 167 1,383
Cargo Logistics 667
Total 9,417 2,083 400
Grand Total 12,000
Greenfield
Airports
Non Metro
Airports
NOV 2016-PLATT STEEL
ASIA CONF.
IMPACT OF STEEL ON CONSTRUCTION INDUSTRY-AN END USER’S PERSPECTIVE
12
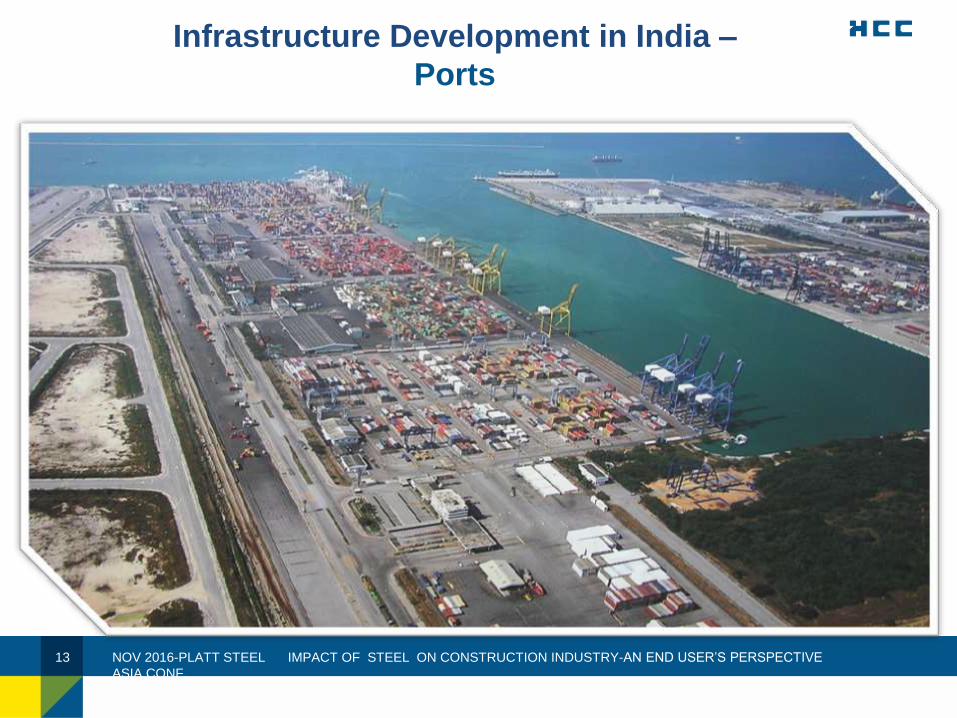
Infrastructure Development in India –
Ports
NOV 2016-PLATT STEEL
ASIA CONF.
IMPACT OF STEEL ON CONSTRUCTION INDUSTRY-AN END USER’S PERSPECTIVE
13

Sector Snapshot
NOV 2016-PLATT STEEL
ASIA CONF.
IMPACT OF STEEL ON CONSTRUCTION INDUSTRY-AN END USER’S PERSPECTIVE
14
•India a long coastline of over 7,500 Km, with 13 major and 187 non major
ports
•Witnessed a CAGR of 20.1% between FY 06 to FY 12. In the last 2 years
the through put has been lower owing to the economic conditions
•Non-major ports are set to benefit from strong growth in India’s external
trade
•The outlook for cargo growth remains favorable, considering the
consistent demand growth in key user industries (coal, crude oil and
containers)
•Increasing private participations and favorable policies will help the
industry achieve higher capacities

Sector Opportunity
5,101 5,523
10,624 9,638
15,998
25,637
3,336
12,162
15,498
Major Ports Minor Ports Total
Investments in Ports – US$ Million
Phase I [2012] Phase II [2016] Phase III [2020]
1 2
3.2
2010 2016 2020
Capacity Addition in Billion T
NOV 2016-PLATT STEEL
ASIA CONF.
IMPACT OF STEEL ON CONSTRUCTION INDUSTRY-AN END USER’S PERSPECTIVE
Construction of berth 65%
15
•New Maritime Agenda announced
for Port development up to 2020
•Capacity addition of 3.2 Billion T by
2020 in 3 phases
•Private sector to account for 70% of
total outlay
•Minor ports to account for 78% of
total investment

Source: Indian Ports association, Planning commission, Report of the working group on the XI Plan for the Port Sector, NMDP document
Total investment
requirement of ~
US$ 13 Billion by
2020
Planned capacity addition in MTPA
Planned investment in US$ Million
Mangalore
28 3,400
23 3,425
5 480
7 320
38 1,150
25 180
20 775
56 2,300
9 330
29 1,760
24 1,100
Kandla
JNPT
Mormugao
Cochin
Tuticorin
Chennai
Ennore
Vizag
Paradip
Kolkata
Ports : Capacity addition – Major Ports
NOV 2016-PLATT STEEL
ASIA CONF.
IMPACT OF STEEL ON CONSTRUCTION INDUSTRY-AN END USER’S PERSPECTIVE
16

Total investment
requirement of ~
US$ 27 Billion by
2020
Karnataka
629 12,000
155 3,400
1.5 30
51 1,200
20 300
199 4,000
195 5,600
51 1,200
Gujarat
Maharashtra
Goa
Kerela
Tamilnadu
Andhra Pradesh
Orissa
Planned capacity addition in MTPA
Planned investment in Rs US$ Million
Ports : Capacity addition – Minor Ports
NOV 2016-PLATT STEEL
ASIA CONF.
IMPACT OF STEEL ON CONSTRUCTION INDUSTRY-AN END USER’S PERSPECTIVE
17

Infrastructure Development in India –
Power
NOV 2016-PLATT STEEL
ASIA CONF. IMPACT OF STEEL ON CONSTRUCTION INDUSTRY-AN END USER’S PERSPECTIVE
18

Sector Snapshot
Thermal 70%
Hydro 16%
Nuclear 2% RES
12%
India’s Installed Power Capacity - 2,61,006 MW [Feb-2015]
135 218
323
437
123
2012 2017 2022 2027
Projected Peak Demand - GW
Peak Demand Actual Availability
NOV 2016-PLATT STEEL
ASIA CONF.
IMPACT OF STEEL ON CONSTRUCTION INDUSTRY-AN END USER’S PERSPECTIVE
19
•India has the fifth largest generation
capacity in the world with an installed
capacity of 261 GW
•India's demand supply deficit currently
stands at 2.5% as of February 2015
•Peak demand supply deficit stands at 2.8%
as of February 2015
•Thermal, mainly coal based power accounts
for 70% of total installed capacity
•India’s peak demand for Power is expected
to triple by 2027 to
437 GW

Growth Drivers
Increasing Population
Increasing power consumption by end users like Domestic, Industrial & Agricultural sectors
Manufacturing sector in India is expected to have high growth over next decade
Also India is set to witness a rapid & massive scale of urbanization
Industrial 42%
Agricultural 22%
Domestic 25%
Commercial 11%
Sector wise breakup of Electricity Consumption
88,000 93,400
59,000
45,000
12th FYP 13th FYP
Power Generation Targets
Capacity Addition Target MW Investments in US$ Mn
NOV 2016-PLATT STEEL
ASIA CONF.
IMPACT OF STEEL ON CONSTRUCTION INDUSTRY-AN END USER’S PERSPECTIVE
20

Sector Opportunities
Thermal Power
Capacity Addition Target 72,340 MW
Private Sector to account for over 70%
Hydro Power
Capacity Addition Target 10,897 MW
Private Sector to account for over 40%
Nuclear Power
Capacity Addition Target 5,300 MW
Total Planned Capacity Addition : 88,000 MW
Total Planned Investments : US$ 320 Billion
NOV 2016-PLATT STEEL
ASIA CONF.
IMPACT OF STEEL ON CONSTRUCTION INDUSTRY-AN END USER’S PERSPECTIVE
21

Infrastructure Development in India –
Urban Infrastructure
NOV 2016-PLATT STEEL
ASIA CONF.
IMPACT OF STEEL ON CONSTRUCTION INDUSTRY-AN END USER’S PERSPECTIVE
22

Sector Snapshot
India’s level of urbanization is much less than many other developing countries Only 30% of India’s population lives in urban areas
Three decades of rapid economic growth in India has not resulted in increased urbanization
• Industrialization has been capital intensive.
• Service Industry was skill intensive.
• Both these industries have not resulted in migration of rural population to urban areas.
• Though share of agriculture in total employment has declined as compared to 1970’s, it still accounts for almost 50%.
• Economic growth which happened during the period 1991 – 2005 was not broad based and labour intensive.
45 54
78 87
30
China Indonesia Mexico Brazil India
Level of Urbanization [%]
NOV 2016-PLATT STEEL
ASIA CONF.
IMPACT OF STEEL ON CONSTRUCTION INDUSTRY-AN END USER’S PERSPECTIVE
23

5 times increase in GDP
Urban population to increase to 600 million, 40% of India’s total population - twice the
population of USA today
Net working age population to increase by 270 million
70% of India’s GDP and net new employment to come from
urban India
4.5 times increase in no. of urban million households
68 cities will have population of 1 million +, up from 42 today.
Europe has 35 today.
700 – 900 million sqm of commercial / residential space
needs to be built
[a new chicago every year].
7,400 Km of Metros / Subways need to be built – 20 times the capacity added in last
decade
2.5 Billion Sqm of roads will have to be paved, 20 times
the capacity added in past decade.
Sector Opportunities
India is now set to urbanize at an unprecedented pace and scale which has not happened
anywhere in world except China ( Year 2007- 2030 )
NOV 2016-PLATT STEEL
ASIA CONF.
IMPACT OF STEEL ON CONSTRUCTION INDUSTRY-AN END USER’S PERSPECTIVE
24

Growth Drivers
56
95 83
189
2007 2030
Water Supply – BLD Demand expected to double
13
42
66
151
2007 2030
Sewerage - BLD Demand expected to increase
2.5 times
51
295
71
377
2007 2030
Solid Waste - MTPA Demand expected to increase
5 times
430 540
640
980
2007 2030
Private Transportation Thousand Lane Km
Demand expected to increase 1.5 times
990 1990
2984
8400
2007 2030
MRTS – Route Km Demand expected to triple
5 12
30
50
2007 2030
Affordable Housing Million Units
Demand expected to increase 1.7 times
NOV 2016-PLATT STEEL
ASIA CONF.
IMPACT OF STEEL ON CONSTRUCTION INDUSTRY-AN END USER’S PERSPECTIVE
25

Sector Opportunities
96 53
15 32
199
392 395
1040
Wate
r
Sew
era
ge
Solid
Waste
Sto
rm W
ate
r D
rain
s
Urb
an R
oads
Ma
ss T
ran
sit
Afford
able
Ho
usin
g
Ope
x
Funding Requirement in US$ Billion
India’s annual spending of $17 in per capita terms is only 14% of China’s &4% of UK’s per capita terms
India needs to raise it’s per capita infrastructure spending by 8 times
Spending on Urban Infra should increase to 2% of GDP from the current level of 0.5% annually
50% of investment would be required to remove infrastructure backlog
Large Tier 1 & Tier 2 cities will need per capita investment > $200
Indian Cities need $ 1,200 Billion of Additional
Capital Investment by 2030
Total Capex
NOV 2016-PLATT STEEL
ASIA CONF.
IMPACT OF STEEL ON CONSTRUCTION INDUSTRY-AN END USER’S PERSPECTIVE
26

SUPPLY AND DEMAND PROJECTION- Norms of Steel Demand in Infrastructure Projects - Investment Programme
Demand for Steel (Norms / Illustration)
NHDP - 100 tons for Rs. 50 million spent.
Railways - 300 tons for a double line per km, 24-30 tons for each wagon, additional demand for old bridges
Power Projects - 33,000 tons for 500 MW, additional demand for special steels,.
Power Transmission - 7,000 tons for 200 km, 400 KV (double circuit line)
Oil and Gas Well platform requires 2,000 tons of structural steel and a process platform requires 10,000 tons of steel. A 6-Mtpy capacity refinery requires 85,000 tons of steel
Housing Residential blocks typically require 1000 to 2000 tons of steel per block.
NOV 2016-PLATT STEEL
ASIA CONF.
Source: Compiled on the basis of a paper presented by Shoeb Ahmed D(c),
SAIL at 3rd Steel Raw Material Conference in Delhi, 2007. 27

FACTORS IMPACTING STEEL PRICES
NOV 2016-PLATT STEEL
ASIA CONF.
IMPACT OF STEEL ON CONSTRUCTION INDUSTRY-AN END USER’S PERSPECTIVE
28
• Price movement of raw material like coal , iron ore etc.
• Installed Capacities.
• Product Mix planned by each Producer depending on the returns and demand
STEEL CO.S
• Seasonal.
• Investment policies of Govt. and actual investments. SECTOR DEMAND
• Domestic: Primary( Main) Producers v/s Secondary (Rerolling) Producers
• international: Govt. Policies – trade barriers / Liberalization
COMPETITION

NOV 2016-PLATT STEEL
ASIA CONF.
IMPACT OF STEEL ON CONSTRUCTION INDUSTRY-AN END USER’S PERSPECTIVE
29

NOV 2016-PLATT STEEL
ASIA CONF.
IMPACT OF STEEL ON CONSTRUCTION INDUSTRY-AN END USER’S PERSPECTIVE
30

TREND ANALYSIS- REBARS AND STRUCTURALS-
APR’14 TO OCT 16
MONTH
REBARS LANDED RATE- AV-
RS/MT % CHANGE WRT APR'14
STRUC. STEEL -LANDED RATE
AV-RS/MT
% CHANGE WRT
APR'14
Apr-14 48689.06 56920.47
May-14 48692.64 0.01 64395.84 13.13
Jun-14 49660.86 2.00 61152.33 7.43
Jul-14 50410.95 3.54 59728.72 4.93
Aug-14 50411.68 3.54 49595.98 -12.87
Sep-14 48634.88 -0.11 49029.8 -13.86
Oct-14 48799.77 0.23 51930.64 -8.77
Nov-14 47744.49 -1.94 51729.96 -9.12
Dec-14 46695.34 -4.09 49596.51 -12.87
Jan-15 43873.01 -9.89 49652.27 -12.77
Feb-15 42027.35 -13.68 49556.58 -12.94
Mar-15 42670.65 -12.36 50781.86 -10.78
Apr-15 42072.69 -13.59 51819.2 -8.96
May-15 43121.97 -11.43 47222.53 -17.04
Jun-15 41557.99 -14.65 46844.14 -17.70
Jul-15 40754.62 -16.30 43801 -23.05
Aug-15 38812.22 -20.29 47866.85 -15.91
Sep-15 40345.72 -17.14 48077.09 -15.54
Oct-15 38220.07 -21.50 41055.13 -27.87
Nov-15 36074.19 -25.91 41488.49 -27.11
Dec-15 33268.69 -31.67 40026.33 -29.68
Jan-16 33491.45 -31.21 43909.88 -22.86
Feb-16 35208.9 -27.69 41127 -27.75
Mar-16 37000.28 -24.01 39971.5 -29.78
Apr-16 39278.2 -19.33 43797.1 -23.06
May-16 38957.93 -19.99 47751.04 -16.11
Jun-16 39114.42 -19.66 50288.46 -11.65
Jul-16 37703.02 -22.56 46363.49 -18.55
Aug-16 34418.45 -29.31 44532.46 -21.76
Sep-16 33390.37 -31.42 49187.36 -13.59
Oct-16 33845.87 -30.49 45411.85 -20.22
NOV 2016-PLATT STEEL
ASIA CONF.
IMPACT OF STEEL ON CONSTRUCTION INDUSTRY-AN END USER’S PERSPECTIVE
31

CHALLENGES TO THE BUYERS
Estimating future price trends for bidding purposes.
Compensation for price variation through escalation formulae not in line with the actual price movement.
Financing steel purchases through innovative means.
Availability of all material at project sites on time and within budgeted cost to meet the deadlines.
Mitigating all the above uncertainities by dynamically designing the stocking policies.
Negotiating high volume purchase month on month within first 05 days of the month to make the material available at project sites on time .
NOV 2016-PLATT STEEL
ASIA CONF.
IMPACT OF STEEL ON CONSTRUCTION INDUSTRY-AN END USER’S PERSPECTIVE
32

EXPECTATIONS OF CONSTRUCTION INDUSTRY
FROM STEEL COMPANIES
NOV 2016-PLATT STEEL
ASIA CONF.
IMPACT OF STEEL ON CONSTRUCTION INDUSTRY-AN END USER’S PERSPECTIVE
33
Informing promptly developments / application innovations on regular basis to the project consultants ,owners/ clients and
contractors.
Prices to remain steady for a good 10-11 months of a particular financial year to help in right estimates for bidding of new projects and near accurate budgeting of costs for ongoing projects.
Supply of value added products direct from manufacturer eg .colour coated sheets, cut and bent rebars, cut to length sections, fusion bonded epoxy coated rebars etc.
Supply of products with tighter rolling tolerances without compromising on quality strength and other physical properties.

EXPECTATIONS OF CONSTRUCTION INDUSTRY
FROM STEEL COMPANIES
Steel companies to become facilitators for channel financing the sales of their products to the customers through innovative schemes other than standard instruments like Letter of Credit or against Bank Guarantees.
Fix prices for long period ideally FY(Apr – Mar )with escalation formula of main contract on back to back basis ( for steel component) thus partnering with infra companies in their gains by mitigating the risks of main contract .
NOV 2016-PLATT STEEL
ASIA CONF.
IMPACT OF STEEL ON CONSTRUCTION INDUSTRY-AN END USER’S PERSPECTIVE
34

Thank You
March 2NOV 2016-PLATT
STEEL ASIA CONF.
015
IMPACT OF STEEL ON CONSTRUCTION INDUSTRY-AN END USER’S PERSPECTIVE
35