Embed Size (px)
Citation preview
Hindalco Industries LtdInvestor Presentation
Standalone FY12
Presentation Structure
HighlightsHighlights
Performance Review
Projects Progress
2
Highlights and Financial PerformanceHighlights and Financial Performance
3
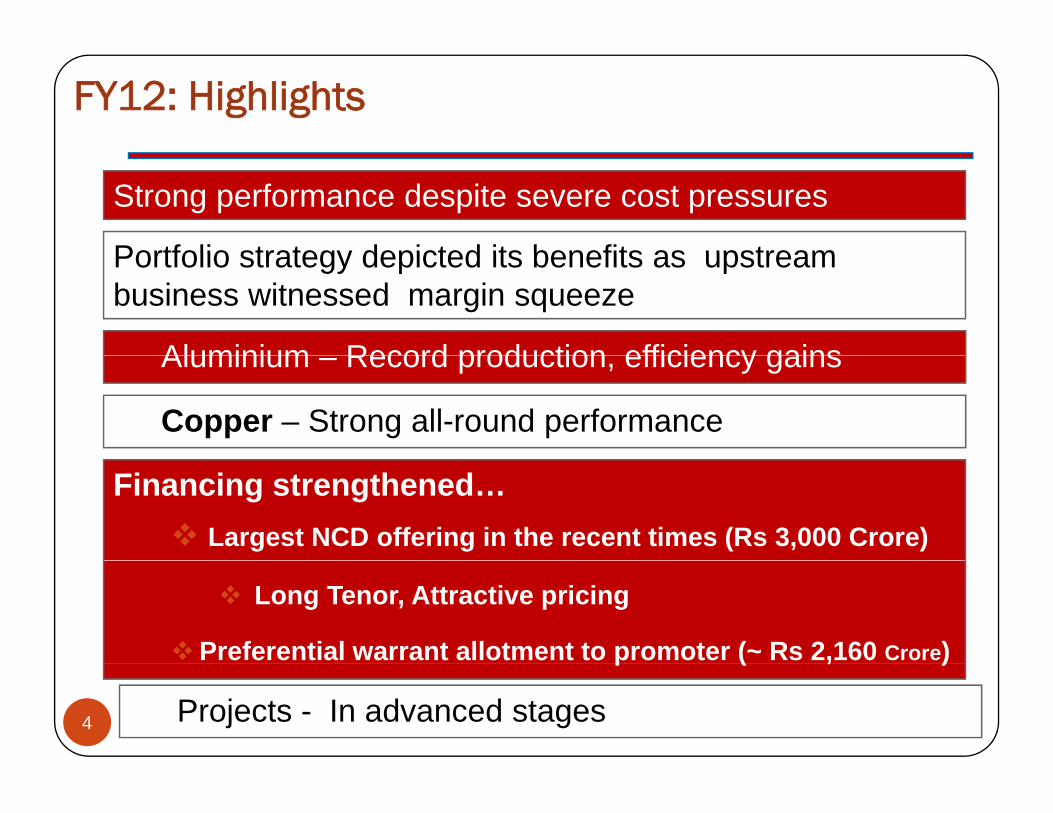
FY12: Highlights
Strong performance despite severe cost pressures
Portfolio strategy depicted its benefits as upstream
Aluminium Record production efficiency gains
Portfolio strategy depicted its benefits as upstream business witnessed margin squeeze
Aluminium – Record production, efficiency gains
Copper – Strong all-round performance
Financing strengthened…Largest NCD offering in the recent times (Rs 3,000 Crore)
Long Tenor, Attractive pricing
Preferential warrant allotment to promoter (~ Rs 2,160 Crore)
4
p ( , )
Projects - In advanced stages
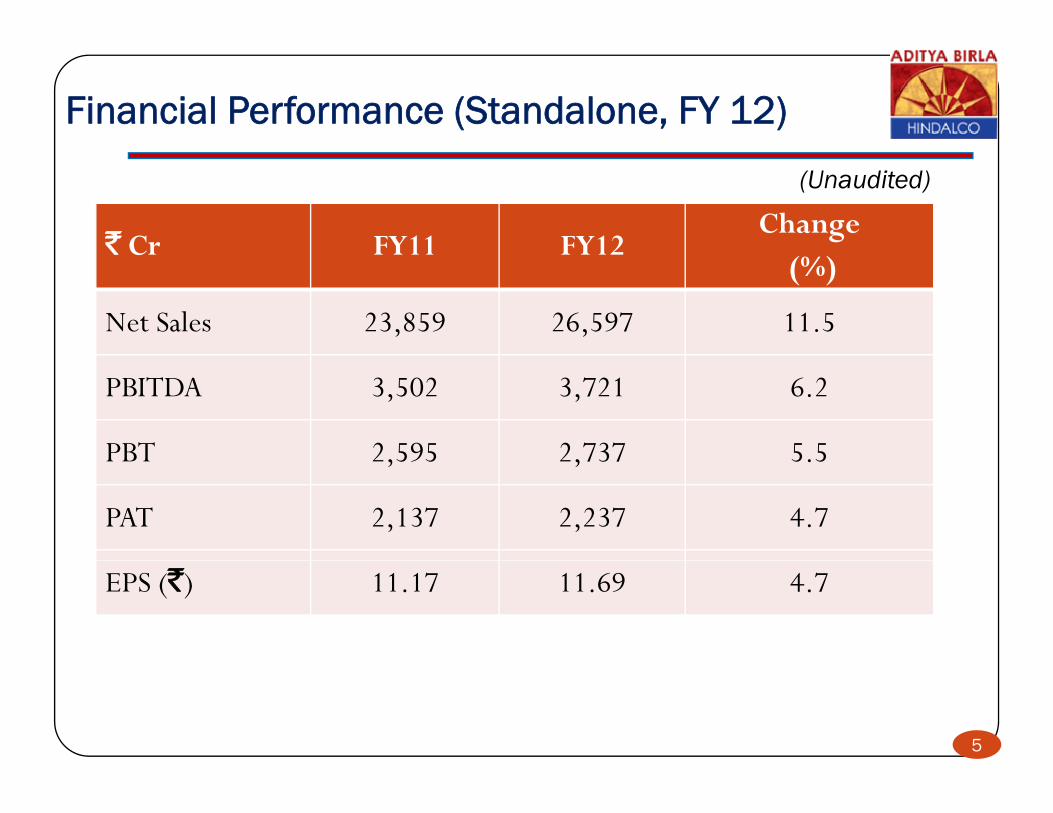
Financial Performance (Standalone, FY 12)
` Cr FY11 FY12Change
(Unaudited)
` Cr FY11 FY12(%)
Net Sales 23,859 26,597 11.5
PBITDA 3,502 3,721 6.2
PBT 2 595 2 737 5 5PBT 2,595 2,737 5.5
PAT 2,137 2,237 4.7
EPS (`) 11.17 11.69 4.7
5
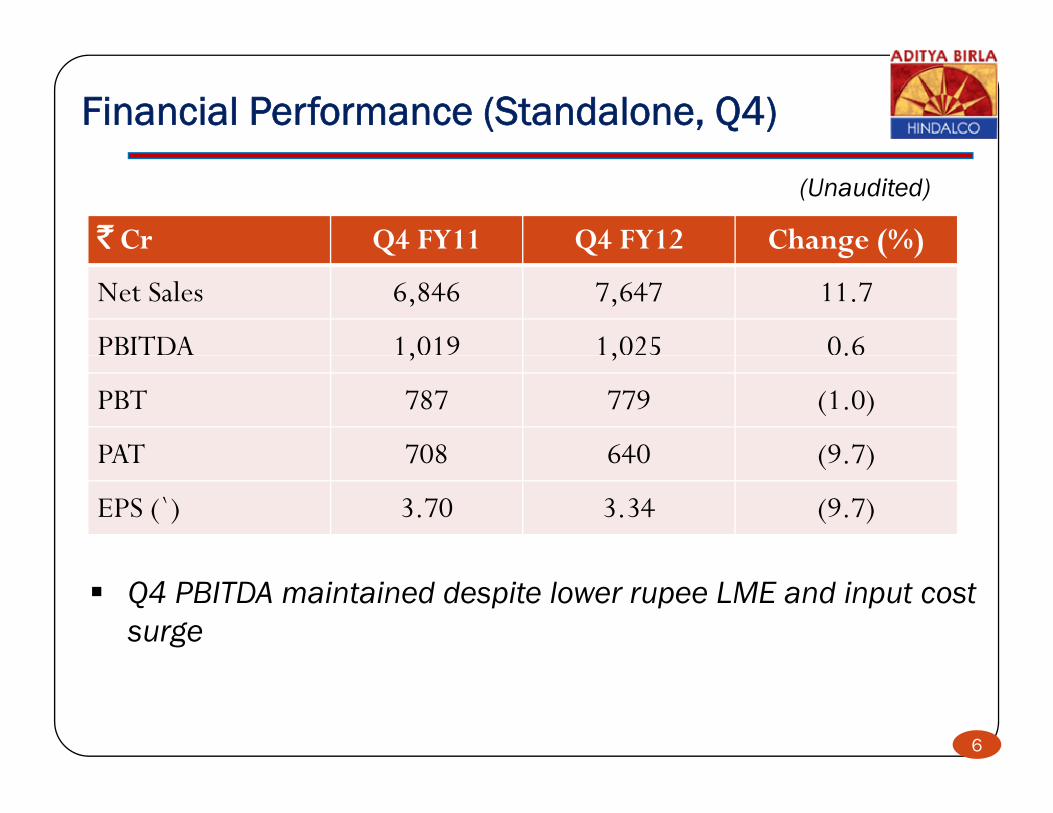
Financial Performance (Standalone, Q4)
` Cr Q4 FY11 Q4 FY12 Change (%)
(Unaudited)
Q Q g ( )
Net Sales 6,846 7,647 11.7
PBITDA 1,019 1,025 0.6, , .
PBT 787 779 (1.0)
PAT 708 640 (9 7)PAT 708 640 (9.7)
EPS (`) 3.70 3.34 (9.7)
Q4 PBITDA maintained despite lower rupee LME and input cost surge
6
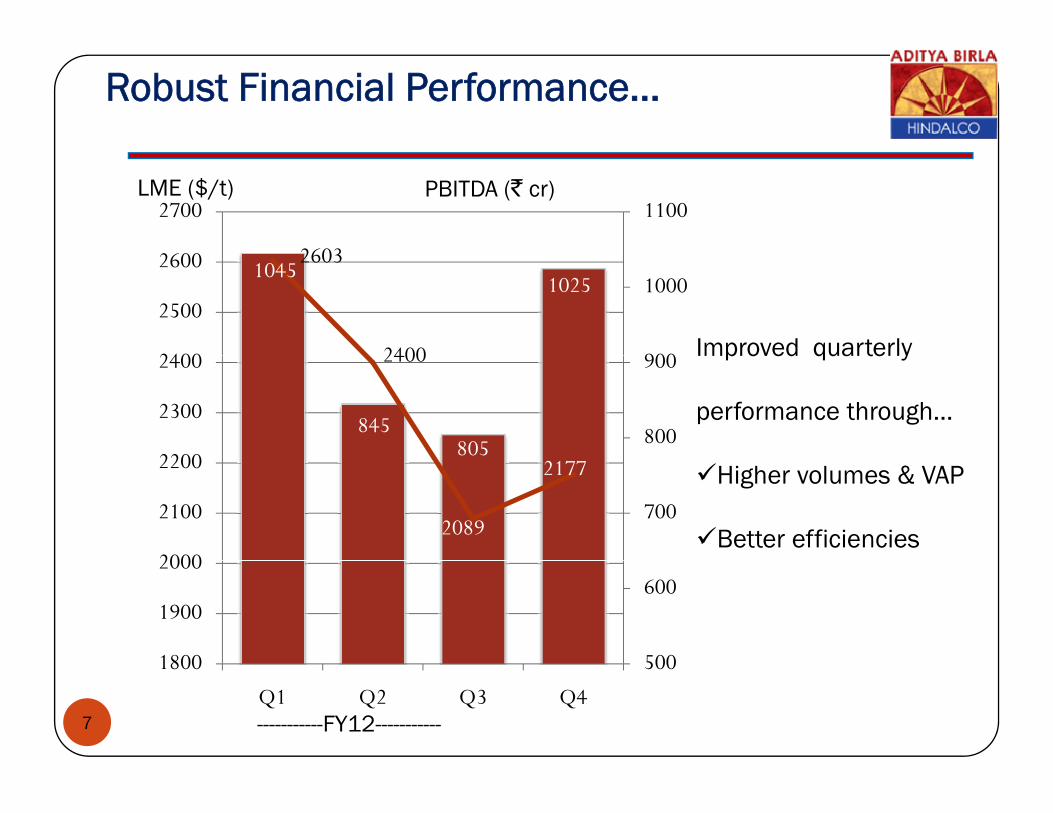
Robust Financial Performance…
2603
11002700LME ($/t) PBITDA (` cr)
10451025
2603
2400 900
1000
2400
2500
2600
Improved quarterly
845805
2400
800
900
2200
2300
2400 Improved quarterly
performance through…
2089
2177
700
2000
2100
2200Higher volumes & VAP
Better efficiencies
500
600
1800
1900
2000
7
5001800
Q1 Q2 Q3 Q4-----------FY12-----------
Business EnvironmentBusiness Environment
8
FY12: A Challenging Year
Year started on an optimistic note with strong LME pricing amidst strong
investor appetite
During the year LME rally fizzled out as global macro economic concerns re-
emerged
Cost push however continued especially energy push due to geo-political Cost push however continued, especially energy push due to geo political
concerns & India specific coal issues
Physical demand continued to remain strong even as inventory overhang
continued…
9Of late, slowdown in China has clouded the demand outlook
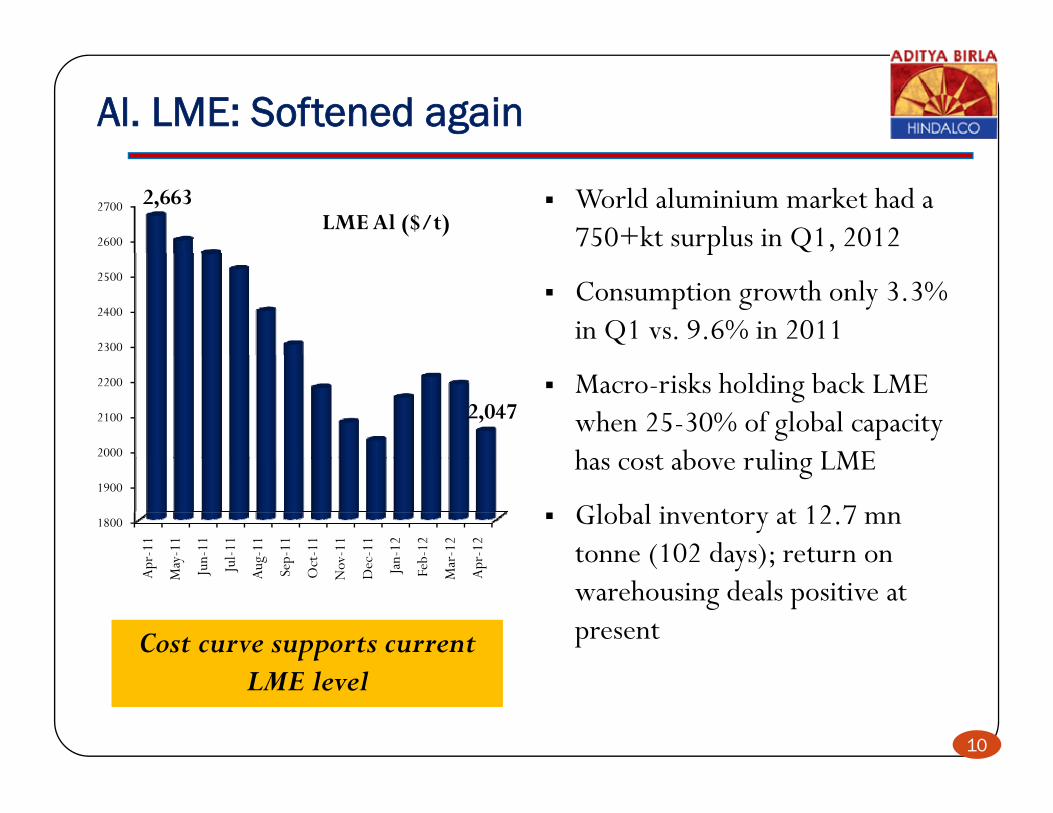
Al. LME: Softened again
2600
2700 2,663LME Al ($/t)
World aluminium market had a 750+kt surplus in Q1, 2012
2300
2400
2500
p
Consumption growth only 3.3% in Q1 vs. 9.6% in 2011
2000
2100
2200
2,047Macro-risks holding back LME when 25-30% of global capacity has cost abo e ruling LME
1800
1900
r-11
y-11
n-11
ul-1
1
g-11
p-11
t-11
v-11
c-11
n-12
b-12
r-12
r-12
has cost above ruling LME
Global inventory at 12.7 mntonne (102 days); return on
Apr
May Jun
Ju Aug Sep
Oct
Nov
Dec Jan
Feb
Mar
Apr tonne (102 days); return on
warehousing deals positive at presentCost curve supports current Cost curve supports current
10
LME levelLME level
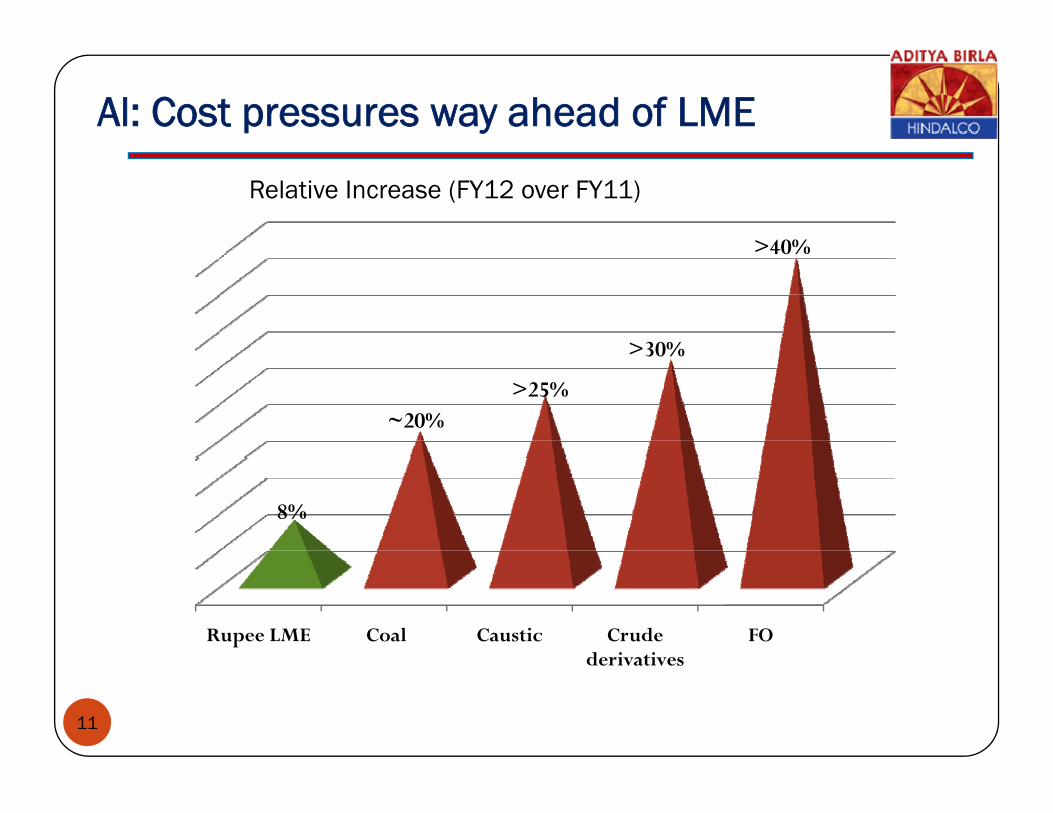
Al: Cost pressures way ahead of LME
>40%
Relative Increase (FY12 over FY11)
>30%
40%
~20%>25%
30%
8%
Rupee LME Coal Caustic Crude derivatives
FO
11
derivatives
Performance ReviewPerformance Review
12
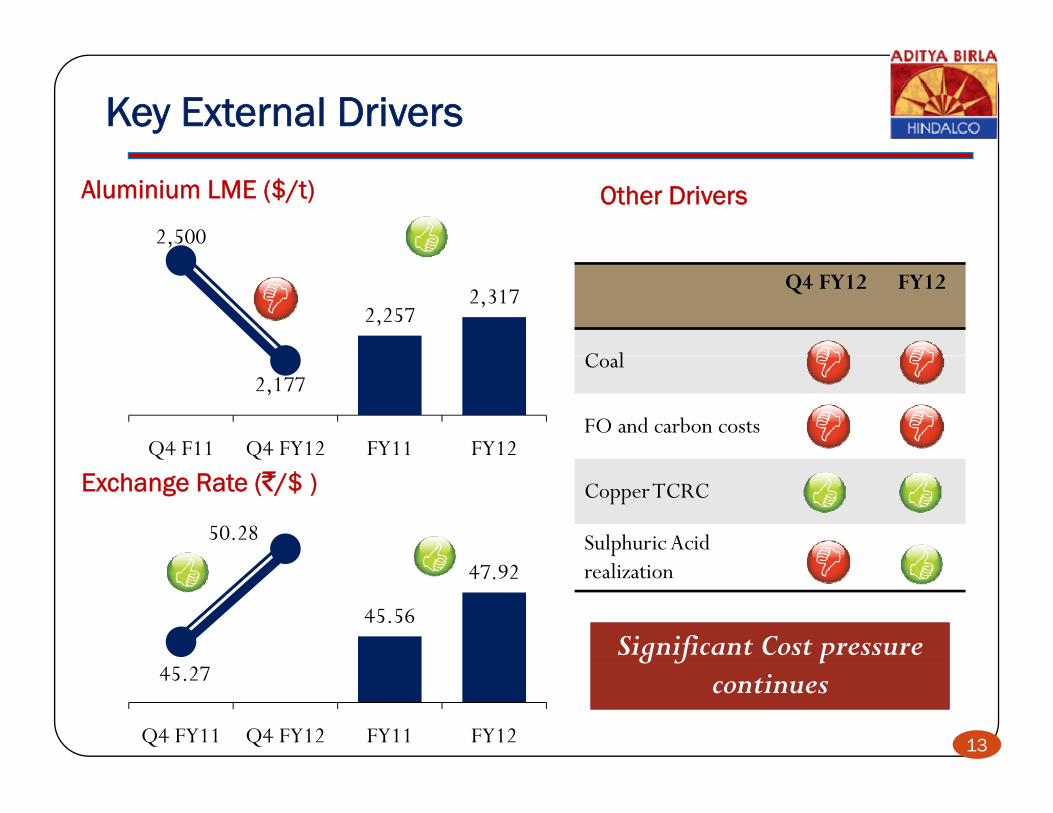
Key External Drivers
Aluminium LME ($/t)
2,500
Other Drivers(vis-à-vis year-ago period)
2,2572,317
Q4 FY12 FY12
C l2,177
Q4 F11 Q4 FY12 FY11 FY12
Coal
FO and carbon costsQ Q
Exchange Rate (`/$ )
50.28
CopperTCRC
Sulphuric Acid
45.56
47.92 realization
Significant Cost pressure Significant Cost pressure
13
45.27
Q4 FY11 Q4 FY12 FY11 FY12
g f pcontinues
g f pcontinues
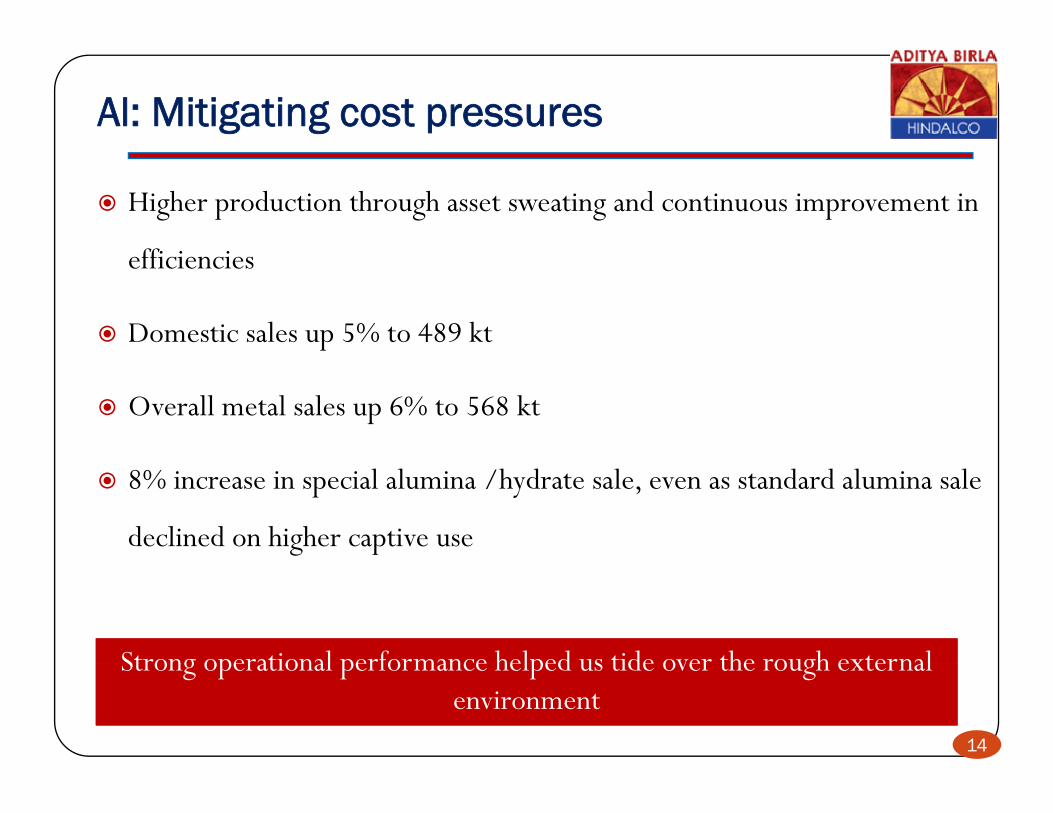
Al: Mitigating cost pressures
Higher production through asset sweating and continuous improvement in
ffi i i efficiencies
Domestic sales up 5% to 489 kt
Overall metal sales up 6% to 568 kt
8% increase in special alumina /hydrate sale, even as standard alumina sale
declined on higher captive use
Strong operational performance helped us tide over the rough external Strong operational performance helped us tide over the rough external
14
Strong operational performance helped us tide over the rough external environment
Strong operational performance helped us tide over the rough external environment
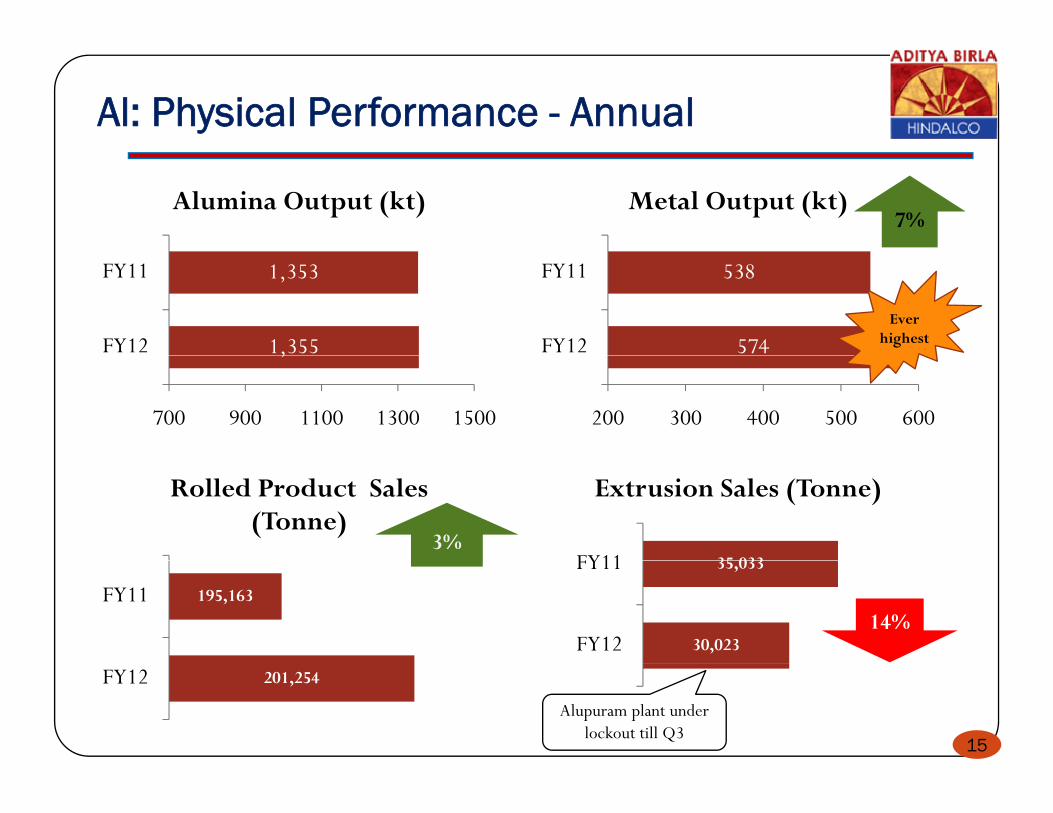
Al: Physical Performance - Annual
Alumina Output (kt) Metal Output (kt)7%
1,355
1,353
FY12
FY11
574
538
FY12
FY11
Ever highest,
700 900 1100 1300 1500 200 300 400 500 600
Rolled Product Sales (Tonne)
3%35 033FY11
Extrusion Sales (Tonne)
195,163FY11
30,023
35,033
FY12
FY11
14%
15
201,254FY12Alupuram plant under
lockout till Q3
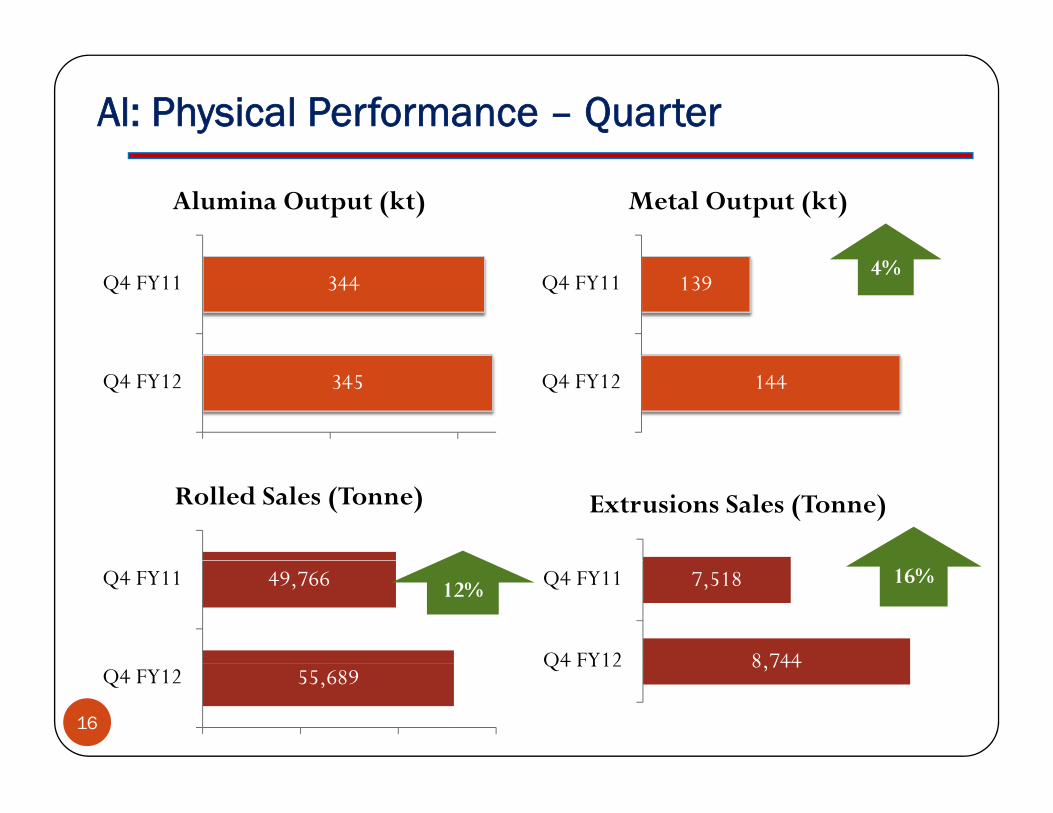
Al: Physical Performance – Quarter
Alumina Output (kt) Metal Output (kt)
344Q4 FY11 139Q4 FY114%
345Q4 FY12 144Q4 FY12
Rolled Sales (Tonne) Extrusions Sales (Tonne)
49,766Q4 FY11 12%
8 744
7,518
Q4 FY12
Q4 FY11 16%
16
55,689Q4 FY128,744Q4 FY12
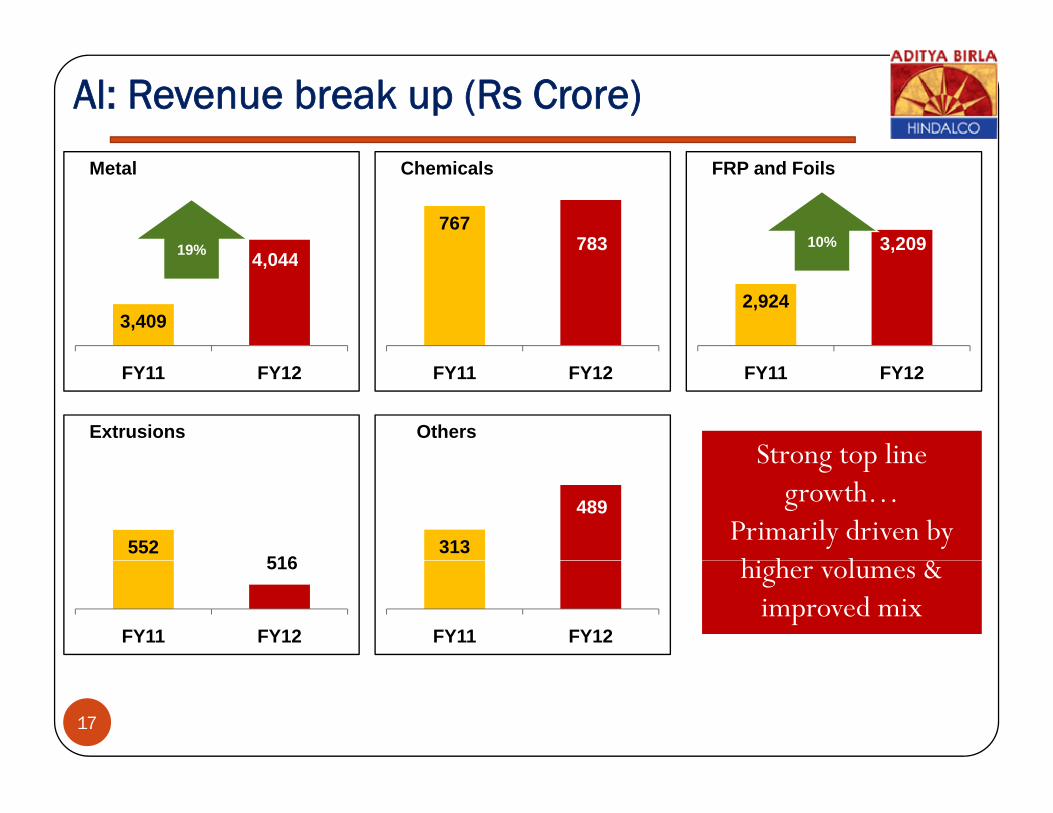
Al: Revenue break up (Rs Crore)
4 04419%
Metal
767783
Chemicals
3,20910%
FRP and Foils
3,409
4,04419%
2,924
,
FY11 FY12 FY11 FY12 FY11 FY12
Extrusions OthersStrong top line Strong top line
552516
313
489
Strong top line growth…
Primarily driven by hi h l &
Strong top line growth…
Primarily driven by hi h l & 516
FY11 FY12 FY11 FY12
higher volumes & improved mix
higher volumes & improved mix
17
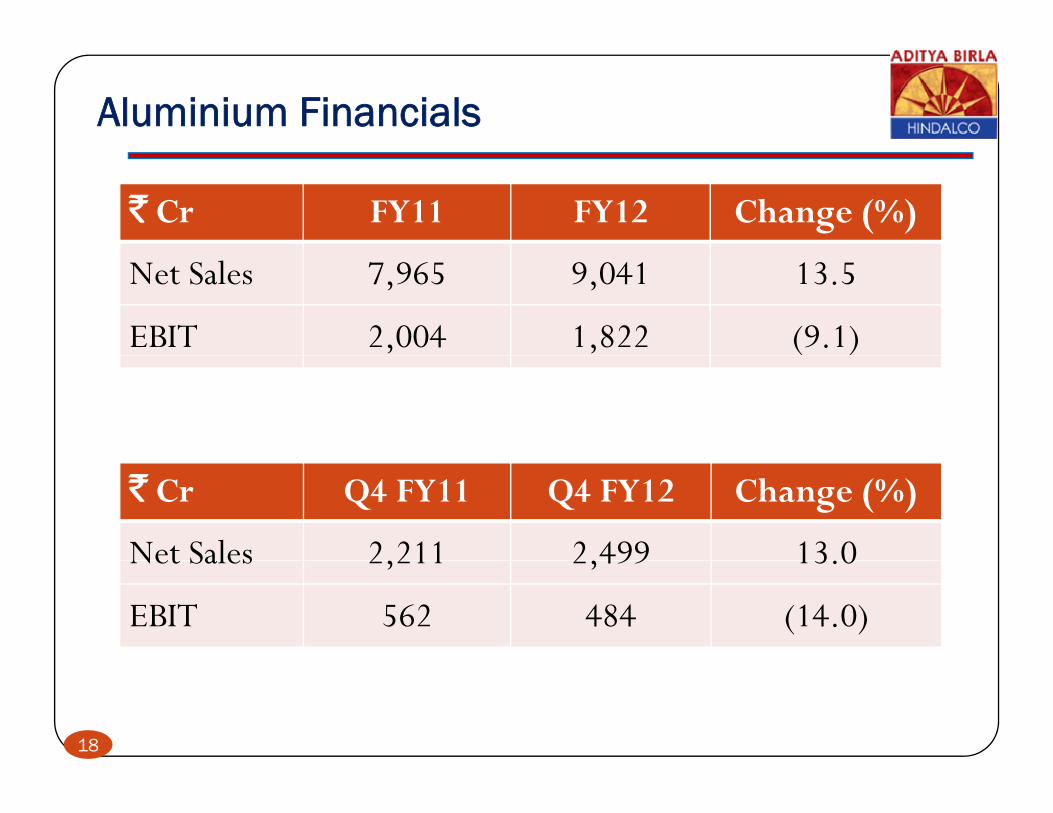
Aluminium Financials
` Cr FY11 FY12 Change (%)
Net Sales 7,965 9,041 13.5
EBIT 2,004 1,822 (9.1)
` Cr Q4 FY11 Q4 FY12 Change (%)
Net Sales 2 211 2 499 13 0Net Sales 2,211 2,499 13.0
EBIT 562 484 (14.0)
18
Copper PerformanceCopper Performance
1919
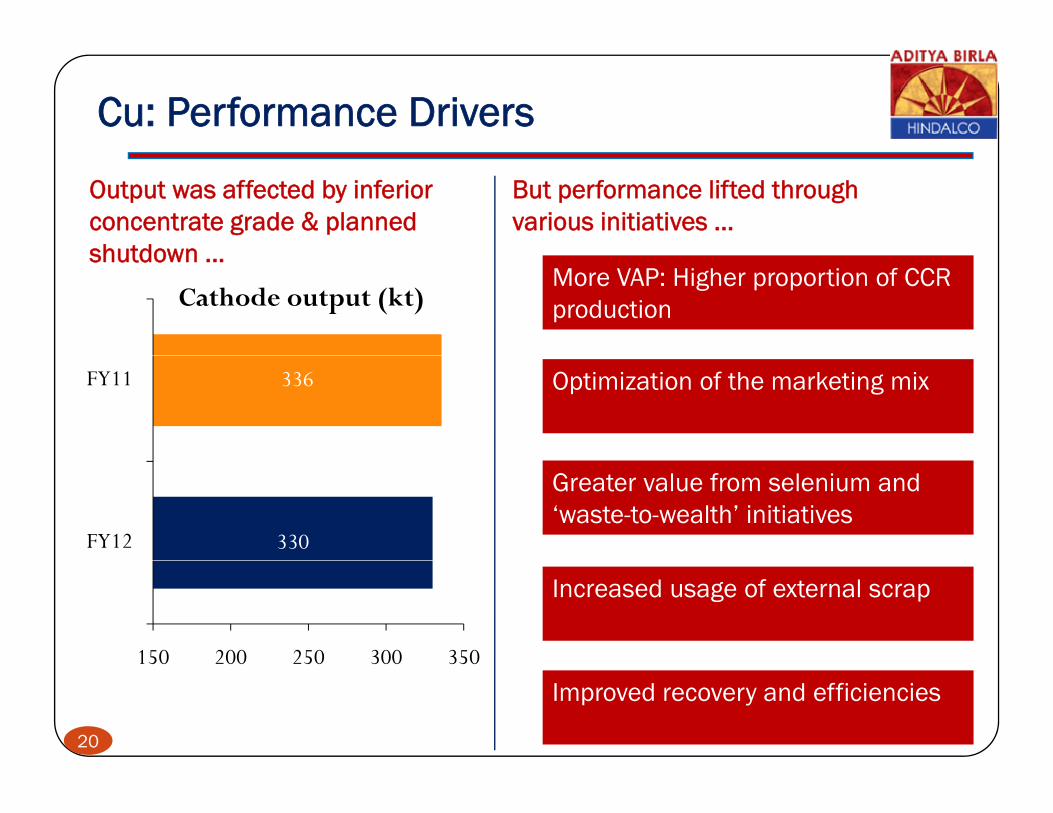
Cu: Performance Drivers
Output was affected by inferior concentrate grade & planned shutdown
But performance lifted through various initiatives …
shutdown …
Cathode output (kt)More VAP: Higher proportion of CCR production
336FY11 Optimization of the marketing mix
330FY12
Greater value from selenium and ‘waste-to-wealth’ initiatives
150 200 250 300 350
Increased usage of external scrap
20
150 200 250 300 350
Improved recovery and efficiencies
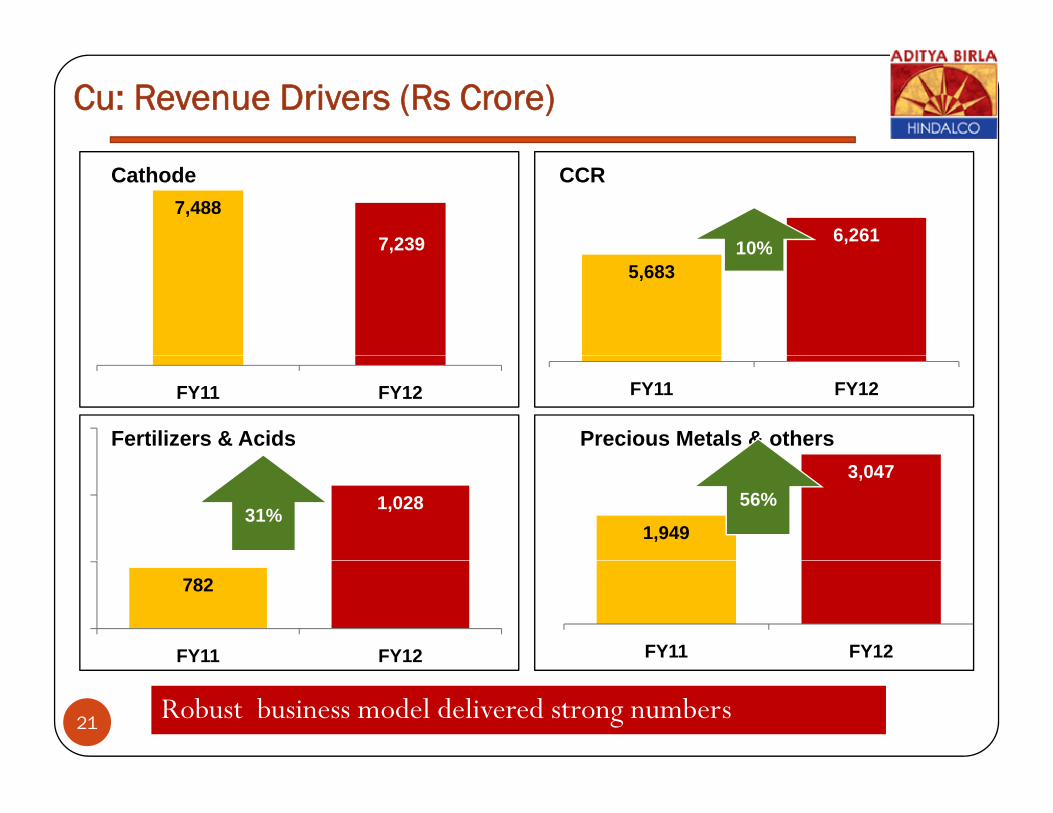
Cu: Revenue Drivers (Rs Crore)
7,488
7,239
Cathode
6,261
CCR
10%,5,683
10%
FY11 FY12
Precious Metals & others
FY11 FY12
Fertilizers & Acids
1,949
3,0471,02831%
56%
FY11 FY12
782
FY11 FY12
21Robust business model delivered strong numbers Robust business model delivered strong numbers
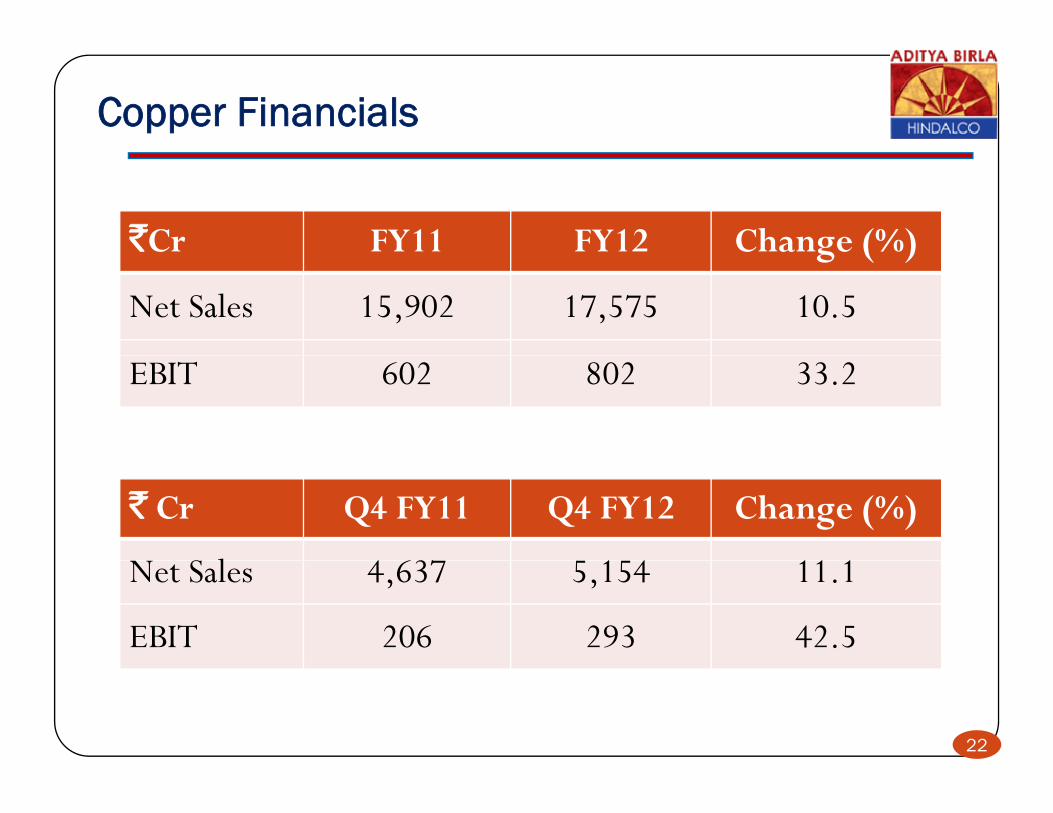
Copper Financials
`Cr FY11 FY12 Change (%)g ( )
Net Sales 15,902 17,575 10.5
EBIT 602 802 33.2
` Cr Q4 FY11 Q4 FY12 Change (%)
S l 4 637 1 4 11 1Net Sales 4,637 5,154 11.1
EBIT 206 293 42.5
22
Projects ProgressProjects Progress
2323
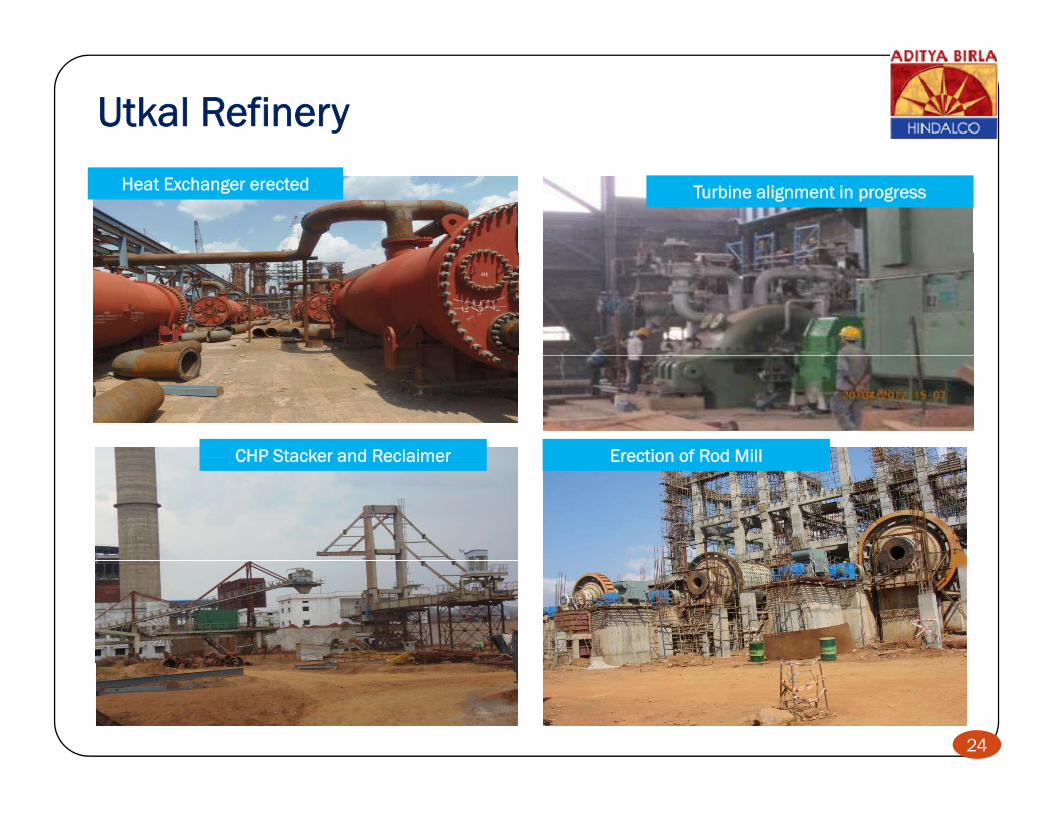
Utkal Refinery
Heat Exchanger erected Turbine alignment in progress
CHP Stacker and Reclaimer Erection of Rod MillCHP Stacker and Reclaimer Erection of Rod Mill
24
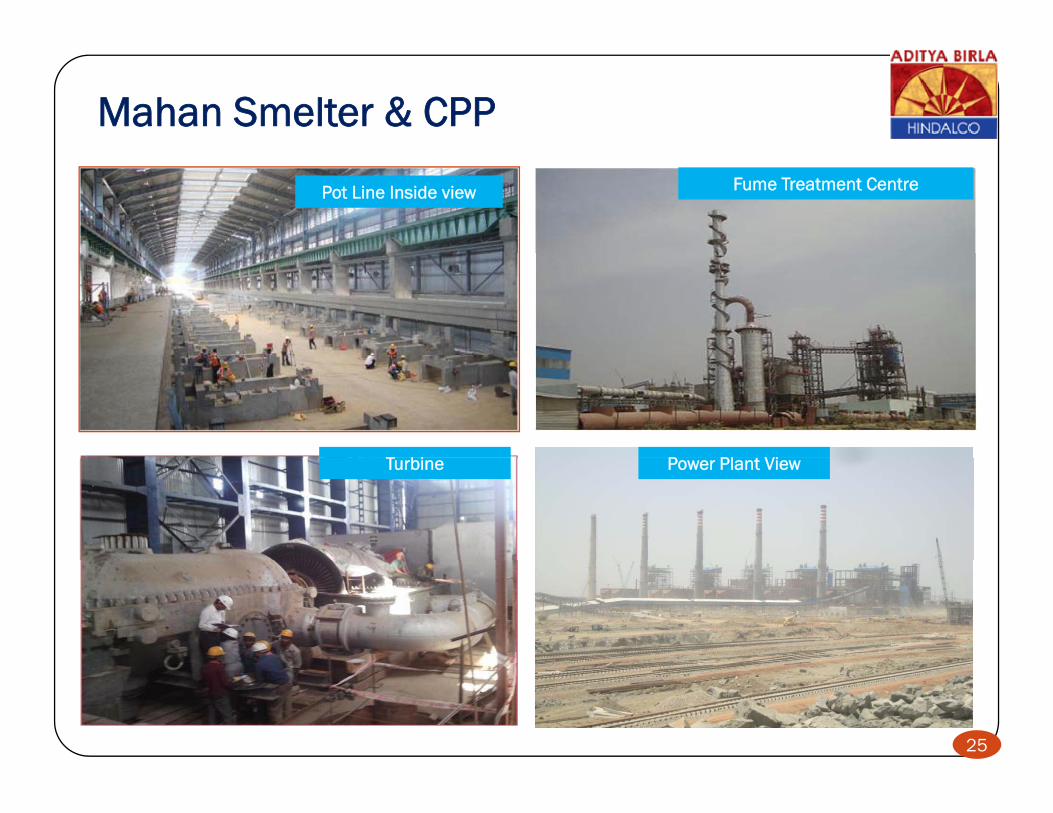
Mahan Smelter & CPP
Pot Line Inside view Fume Treatment Centre
T bi P Pl ViTurbine Power Plant View
25
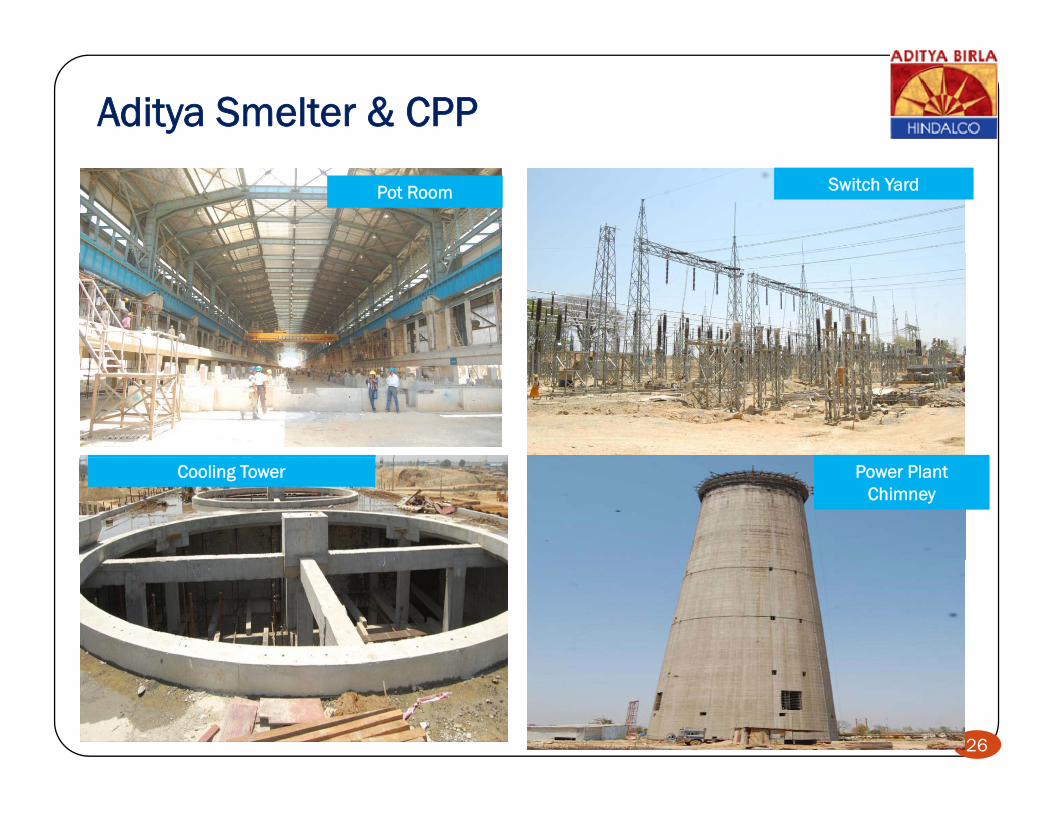
Aditya Smelter & CPP
Pot Room Switch Yard
Cooling Tower Power Plant Chimney
26
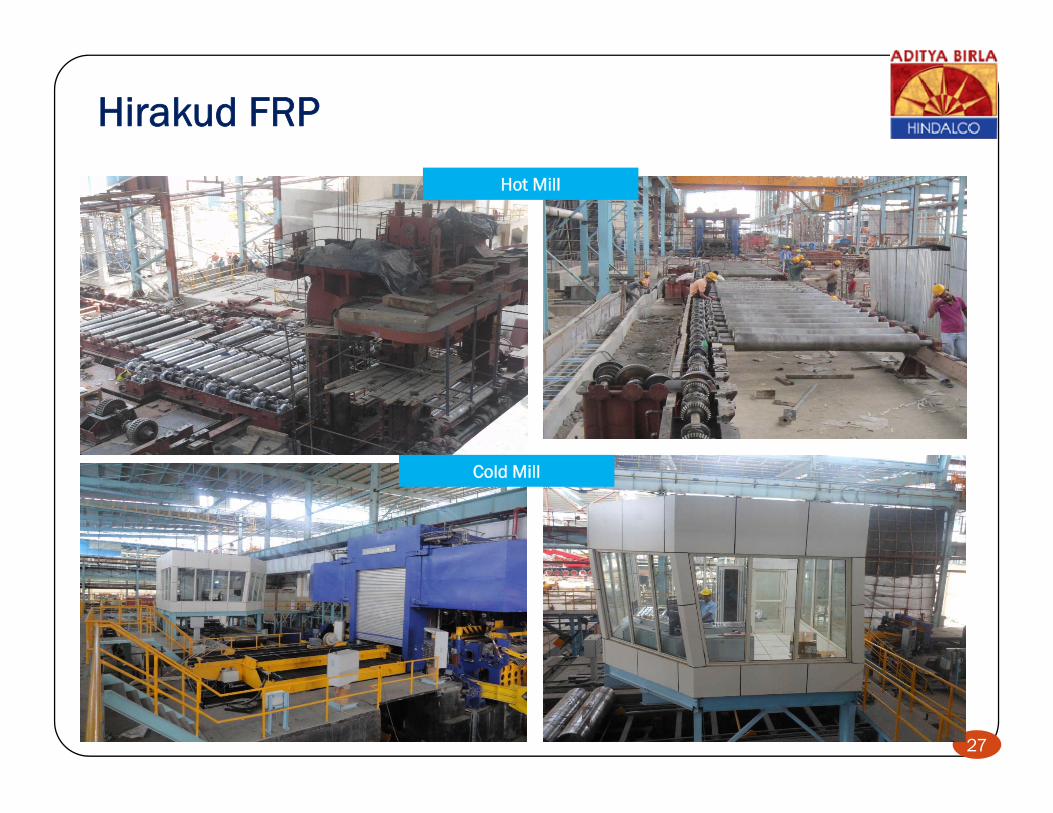
Hirakud FRP
Hot Mill
Cold Mill
27
Summary….
India-specific cost pressures continue – especially p p p yrelating to coal
Operational excellence helped us tide over these challenging timeschallenging times
Robust business model delivering results
28
Thank youThank you