Embed Size (px)
Citation preview

Hilton • Maher • Selto
7Managing Quality and Time to Create Value
McGraw-Hill/Irwin © 2003 The McGraw-Hill Companies, Inc., All Rights Reserved.
7-3
Quality At Any Cost?
Which is more
important?
7-4
Customers will seek out the
highest quality product.
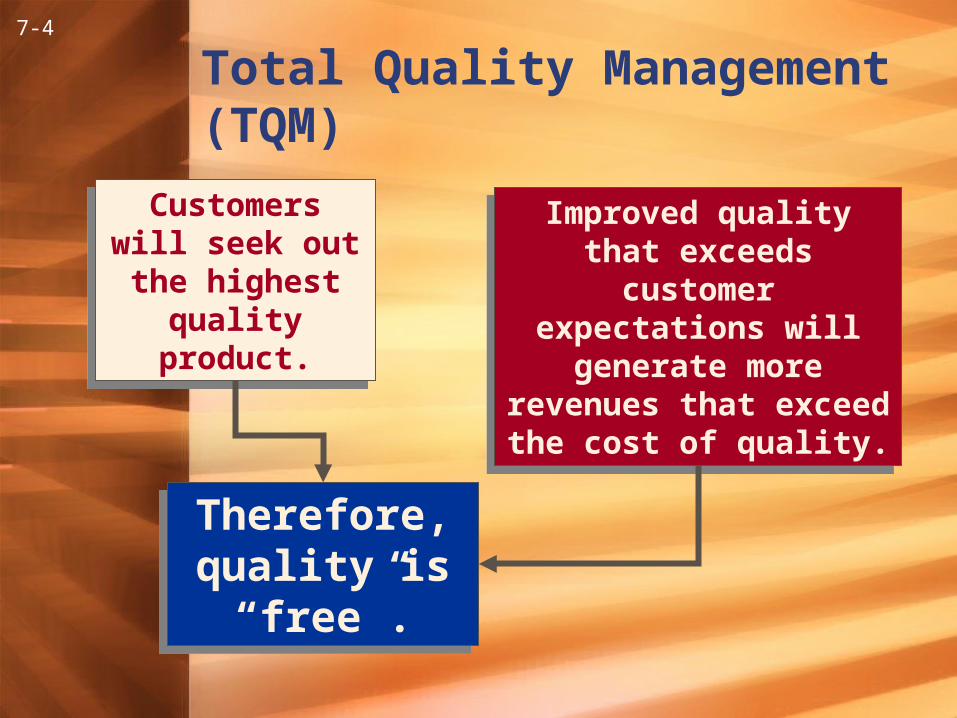
Customers will seek out the
highest quality product.
Improved quality that exceeds customer expectations will
generate more revenues that exceed the cost of
quality.
Improved quality that exceeds customer expectations will
generate more revenues that exceed the cost of
quality.
Therefore, quality is
“free”.
Therefore, quality is
“free”.
Total Quality Management (TQM)
7-5
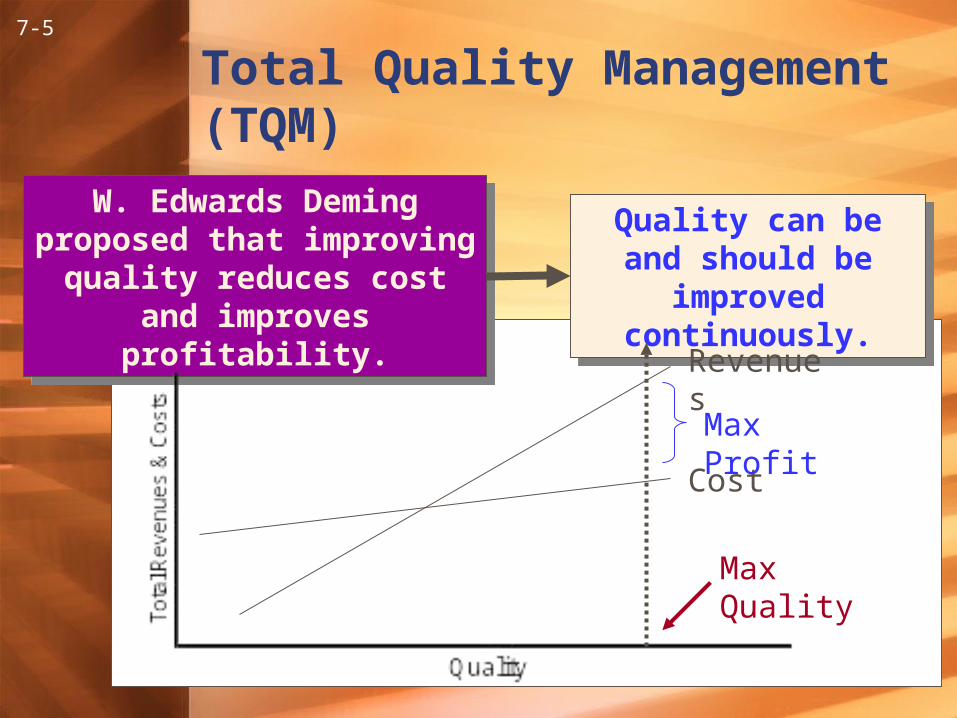
Total Quality Management (TQM)
W. Edwards Deming proposed that improving quality reduces cost and
improves profitability.
W. Edwards Deming proposed that improving quality reduces cost and
improves profitability.
Quality can be and should be improved
continuously.
Quality can be and should be improved
continuously.
Revenues
Cost
Max Profit
Max Quality
7-6
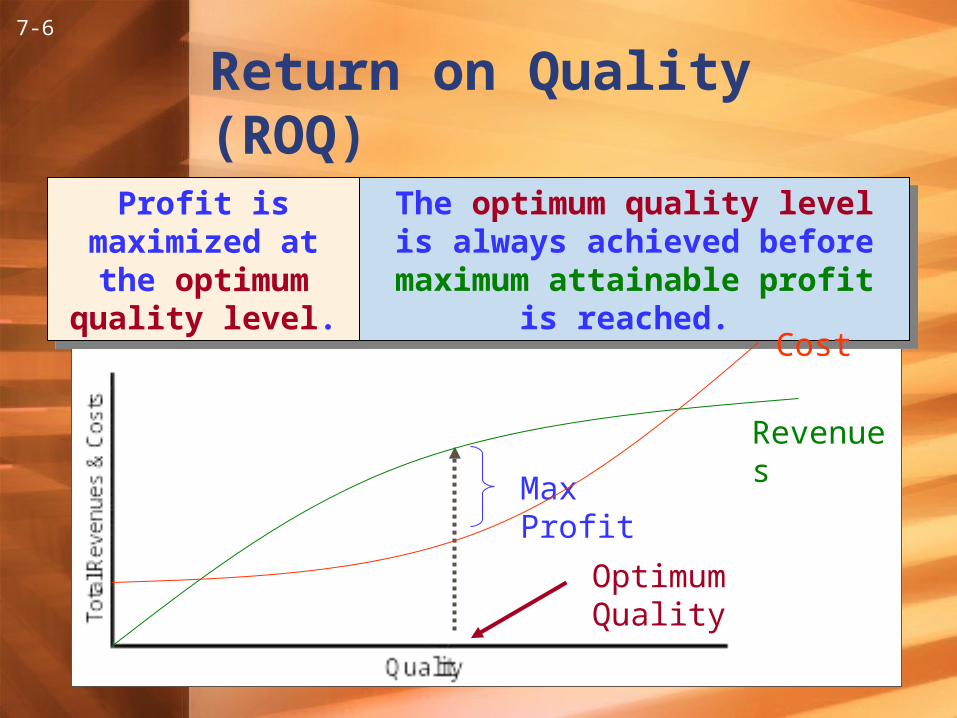
Return on Quality (ROQ)
Profit is maximized at the optimum
quality level.
Profit is maximized at the optimum
quality level.
The optimum quality level is always achieved before maximum
attainable profit is reached.
The optimum quality level is always achieved before maximum
attainable profit is reached.
Revenues
Cost
Max Profit
Optimum Quality
7-7
Lead Indicators of Quality
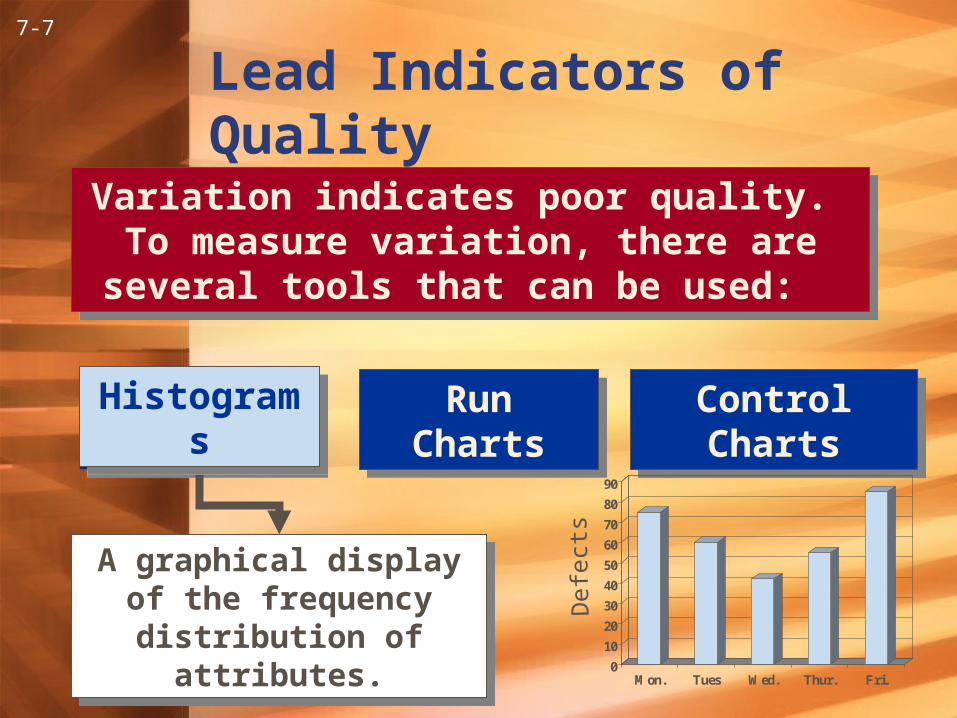
Variation indicates poor quality. To measure variation, there are several tools
that can be used:
Variation indicates poor quality. To measure variation, there are several tools
that can be used:
HistogramsHistograms Run ChartsRun Charts Control ChartsControl Charts
0
10
20
30
40
50
60
70
80
90
Mon. Tues Wed. Thur. Fri.
Def
ects
A graphical display of the frequency distribution of
attributes.
A graphical display of the frequency distribution of
attributes.
HistogramsHistograms
7-8
Lead Indicators of Quality
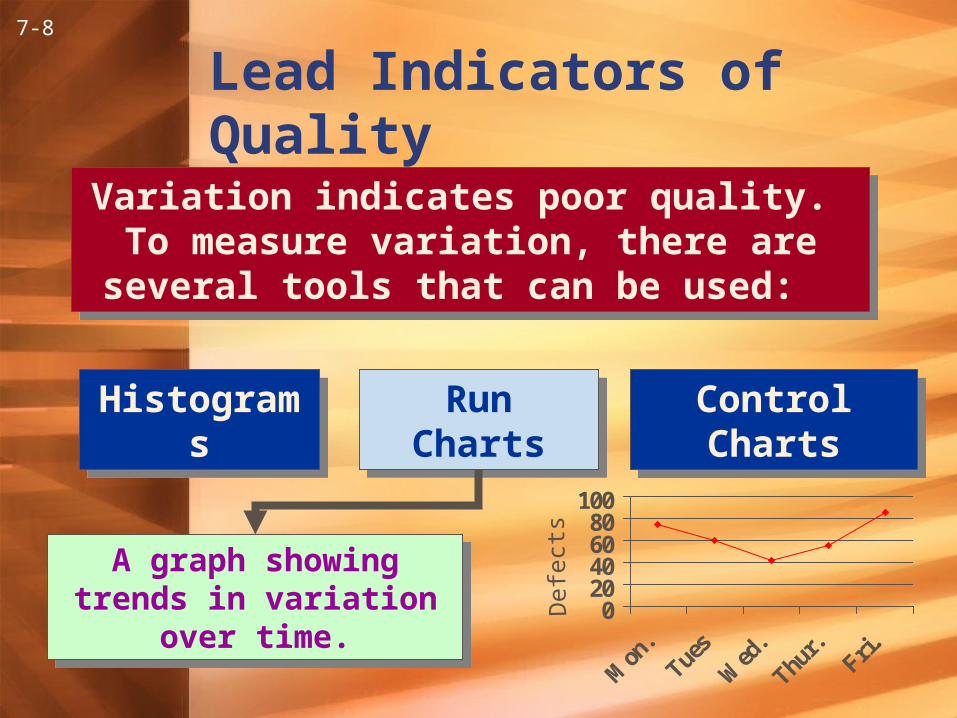
Variation indicates poor quality. To measure variation, there are several tools
that can be used:
Variation indicates poor quality. To measure variation, there are several tools
that can be used:
HistogramsHistograms Run ChartsRun Charts Control ChartsControl Charts
A graph showing trends in variation over time.
A graph showing trends in variation over time. 0
20406080
100
Mon
.Tues
Wed
.
Thur.Fri.
Def
ects
7-9
020406080
100
Mon
.Tues
Wed
.
Thur.Fri.
Def
ects
Lead Indicators of Quality
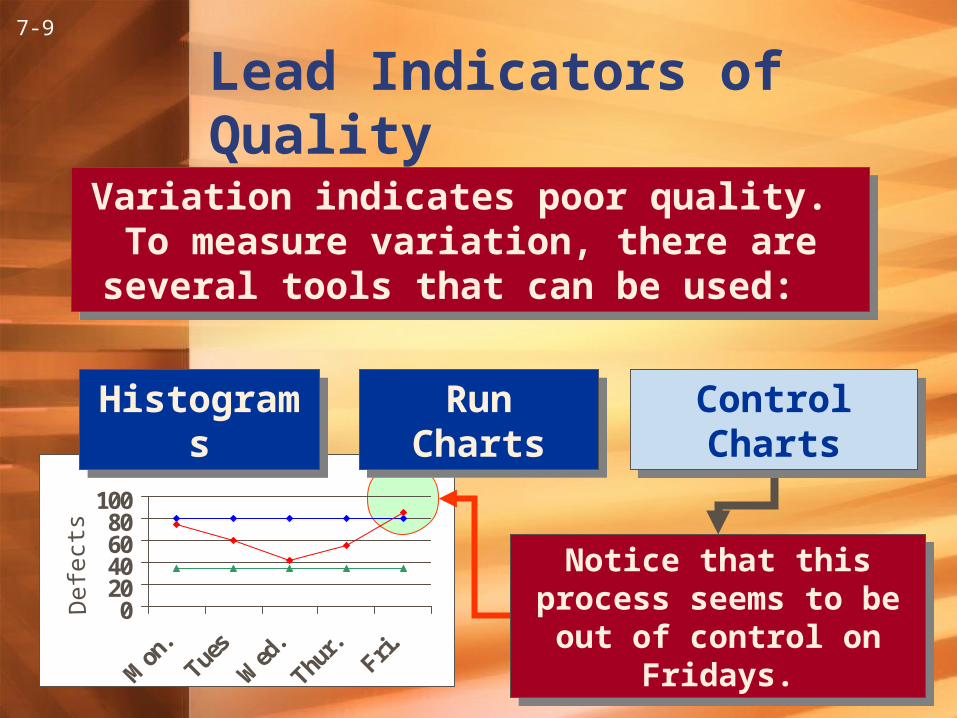
Variation indicates poor quality. To measure variation, there are several tools
that can be used:
Variation indicates poor quality. To measure variation, there are several tools
that can be used:
HistogramsHistograms Run ChartsRun Charts
A run chart with upper and lower control limits.
A run chart with upper and lower control limits.
Control ChartsControl Charts
Notice that this process seems to be out of control on Fridays.
Notice that this process seems to be out of control on Fridays.
7-10
Diagnostic Information
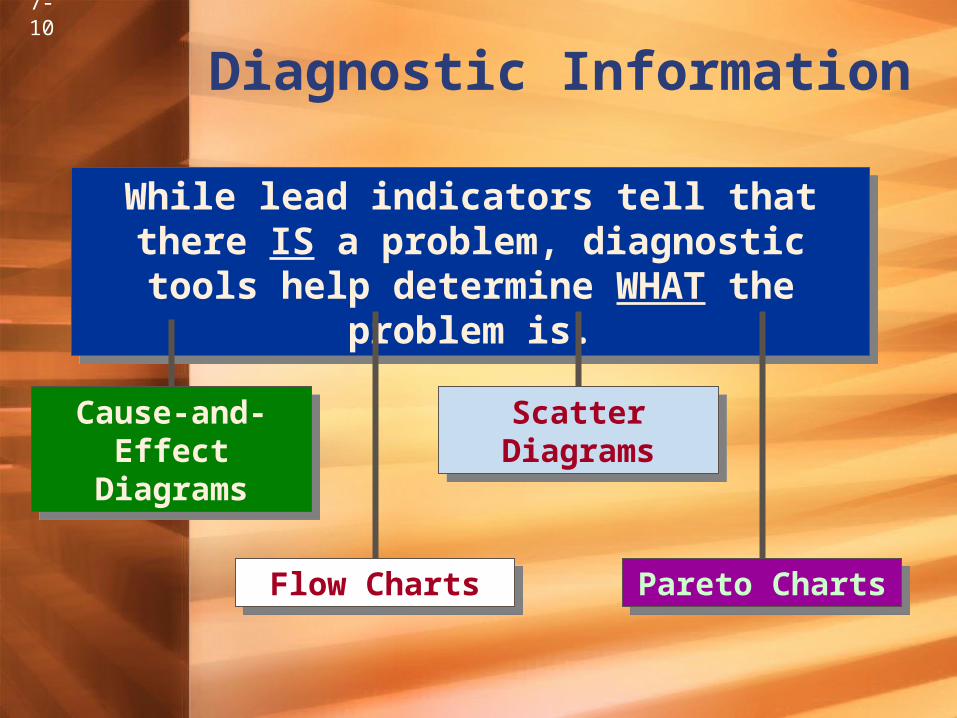
While lead indicators tell that there IS a problem, diagnostic tools help determine
WHAT the problem is.
While lead indicators tell that there IS a problem, diagnostic tools help determine
WHAT the problem is.
Cause-and-Effect Diagrams
Cause-and-Effect Diagrams
Scatter Diagrams
Scatter Diagrams
Flow ChartsFlow Charts Pareto ChartsPareto Charts
7-11
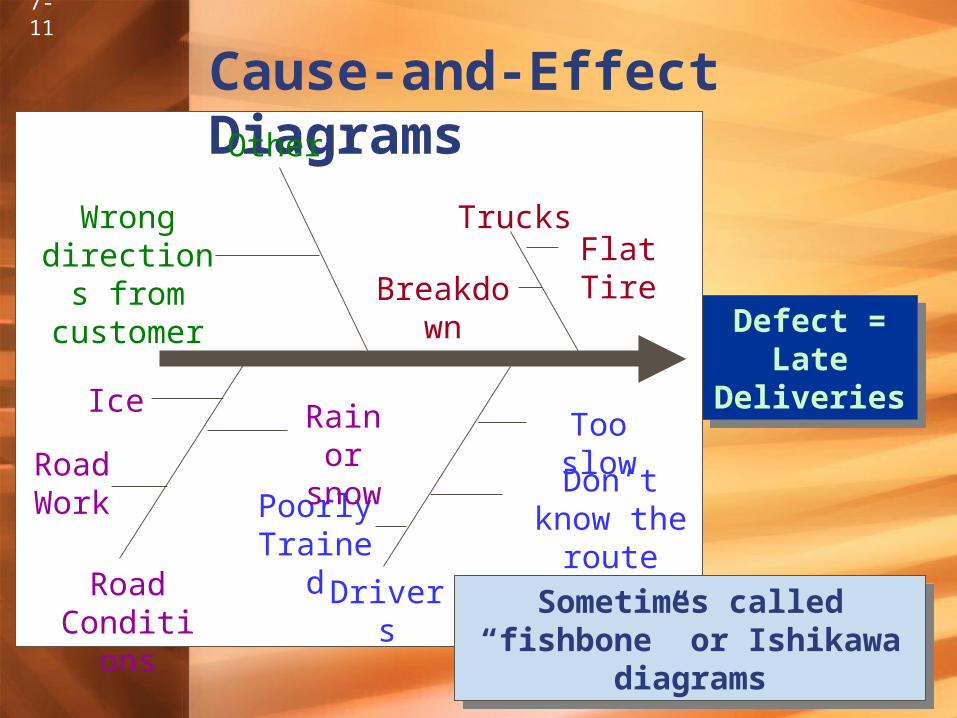
Cause-and-Effect Diagrams
Defect = Late
Deliveries
Defect = Late
Deliveries
Trucks
BreakdownFlat Tire
Drivers
Don’t know the route
Too slow
Poorly Trained
Other
Road Conditions
Rain or snow
Ice
Road Work
Wrong directions
from customer
Sometimes called “fishbone” or Ishikawa diagrams
Sometimes called “fishbone” or Ishikawa diagrams
7-12
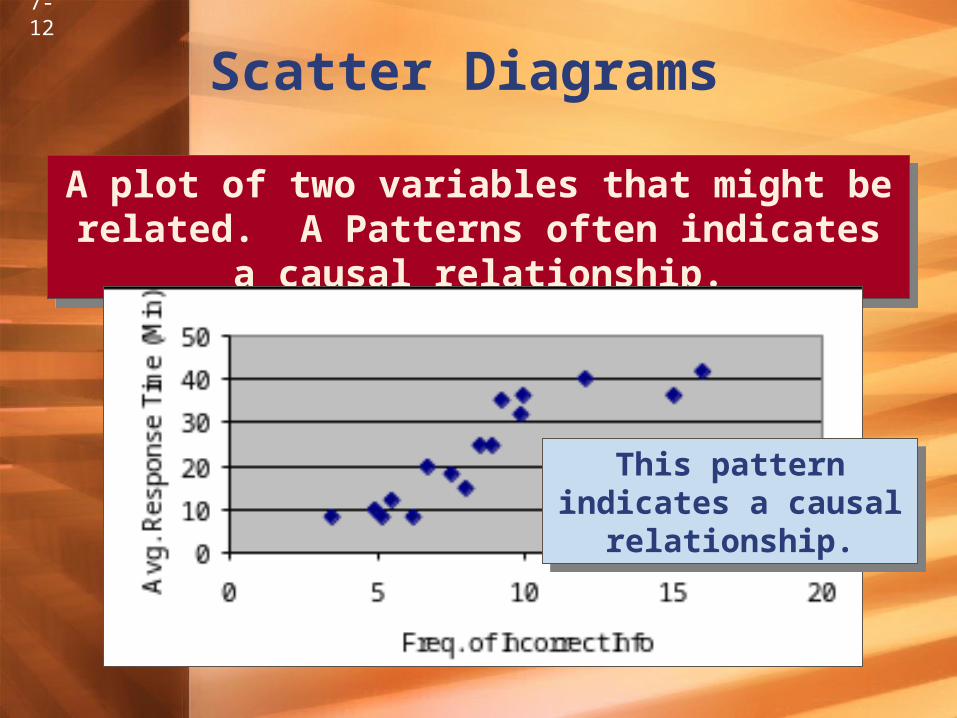
Scatter Diagrams
A plot of two variables that might be related. A Patterns often indicates a causal relationship.
A plot of two variables that might be related. A Patterns often indicates a causal relationship.
This pattern indicates a causal relationship.
This pattern indicates a causal relationship.
7-13
Flowcharts
A graphical illustration of
sequential linkages among process
activities.
Standardized symbols are used to represent decisions, actions, documents, and storage devices.
A graphical illustration of
sequential linkages among process
activities.
Standardized symbols are used to represent decisions, actions, documents, and storage devices.
7-14
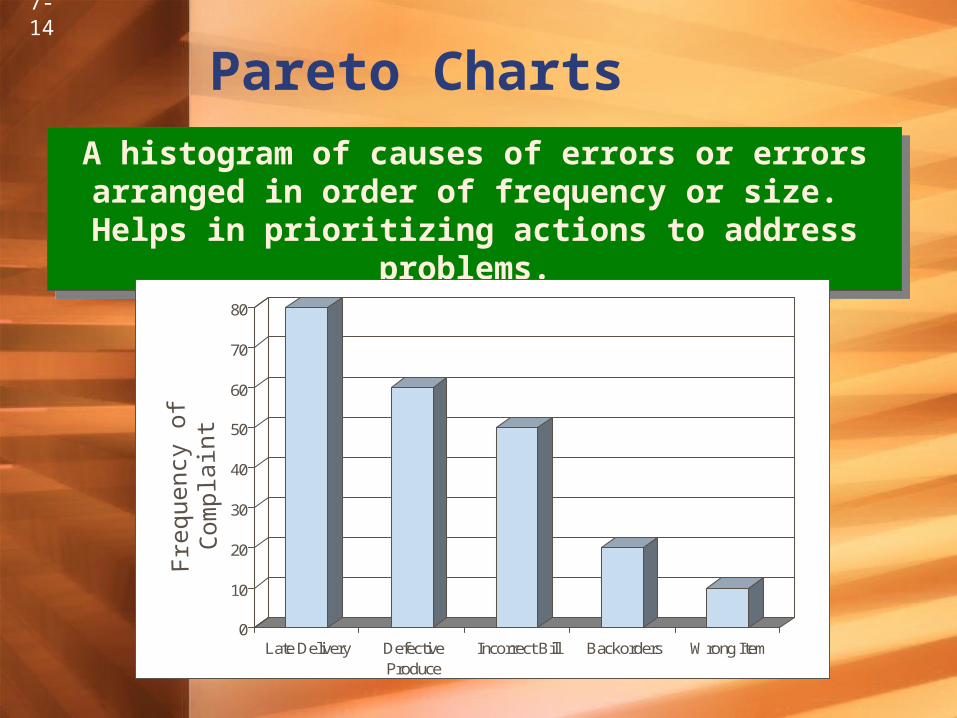
Pareto Charts
A histogram of causes of errors or errors arranged in order of frequency or size. Helps in prioritizing
actions to address problems.
A histogram of causes of errors or errors arranged in order of frequency or size. Helps in prioritizing
actions to address problems.
0
10
20
30
40
50
60
70
80
Late Delivery DefectiveProduce
Incorrect Bill Backorders Wrong Item
Freq
uenc
y of
Com
plai
nt
7-15
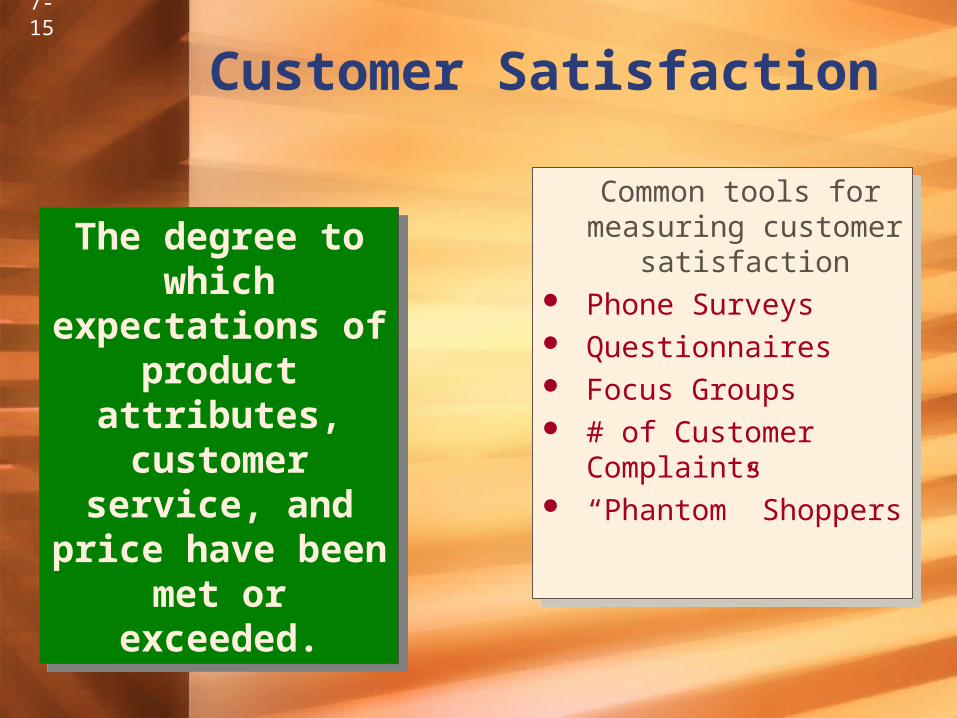
Customer Satisfaction
The degree to which
expectations of product attributes, customer service,
and price have been met or exceeded.
The degree to which
expectations of product attributes, customer service,
and price have been met or exceeded.
Common tools for measuring customer
satisfaction Phone Surveys Questionnaires Focus Groups # of Customer
Complaints “Phantom” Shoppers
Common tools for measuring customer
satisfaction Phone Surveys Questionnaires Focus Groups # of Customer
Complaints “Phantom” Shoppers
7-16
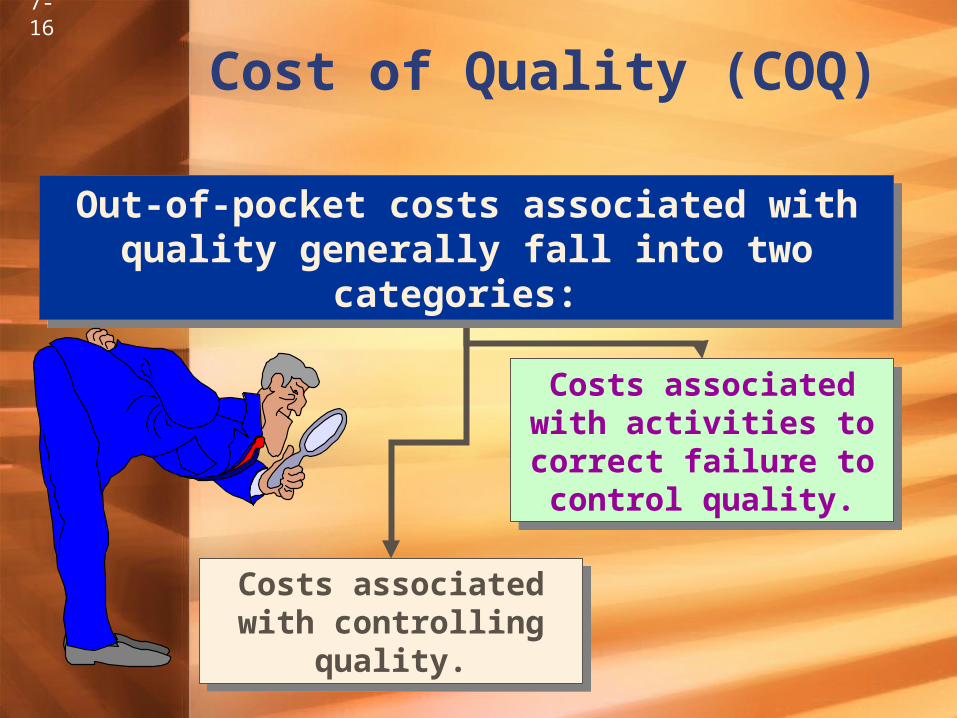
Cost of Quality (COQ)
Costs associated with controlling quality.
Costs associated with controlling quality.
Costs associated with activities to correct
failure to control quality.
Costs associated with activities to correct
failure to control quality.
Out-of-pocket costs associated with quality generally fall into two categories:
Out-of-pocket costs associated with quality generally fall into two categories:
7-17
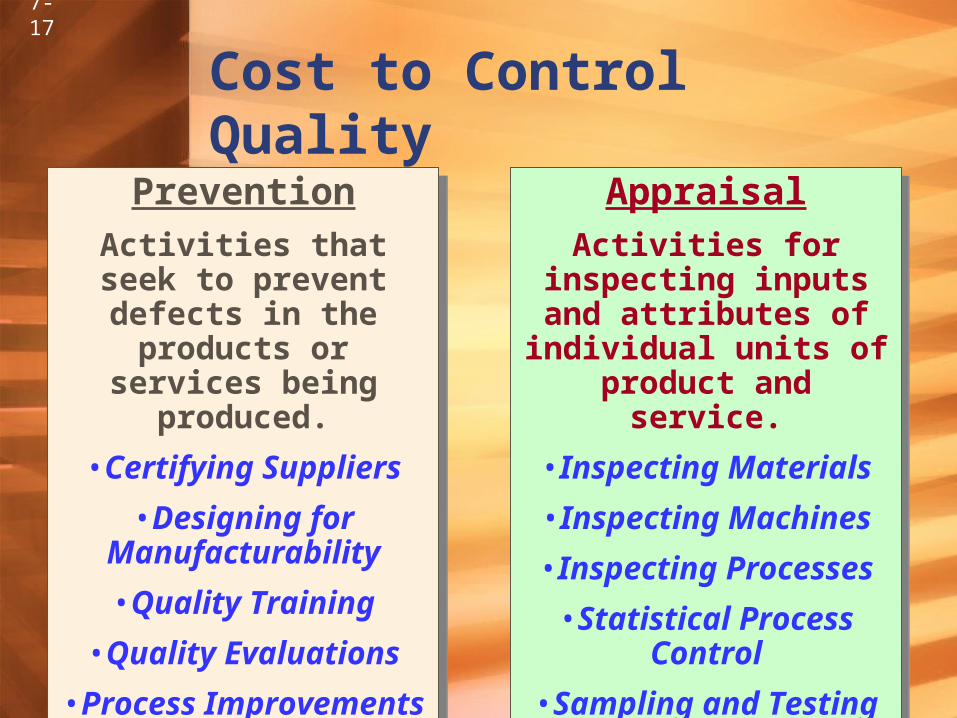
Cost to Control Quality
PreventionActivities that seek to prevent defects in the products or services
being produced.
•Certifying Suppliers
•Designing for Manufacturability
•Quality Training
•Quality Evaluations
•Process Improvements
PreventionActivities that seek to prevent defects in the products or services
being produced.
•Certifying Suppliers
•Designing for Manufacturability
•Quality Training
•Quality Evaluations
•Process Improvements
AppraisalActivities for inspecting inputs and attributes of
individual units of product and service.
•Inspecting Materials
•Inspecting Machines
•Inspecting Processes
•Statistical Process Control
•Sampling and Testing
AppraisalActivities for inspecting inputs and attributes of
individual units of product and service.
•Inspecting Materials
•Inspecting Machines
•Inspecting Processes
•Statistical Process Control
•Sampling and Testing
7-18
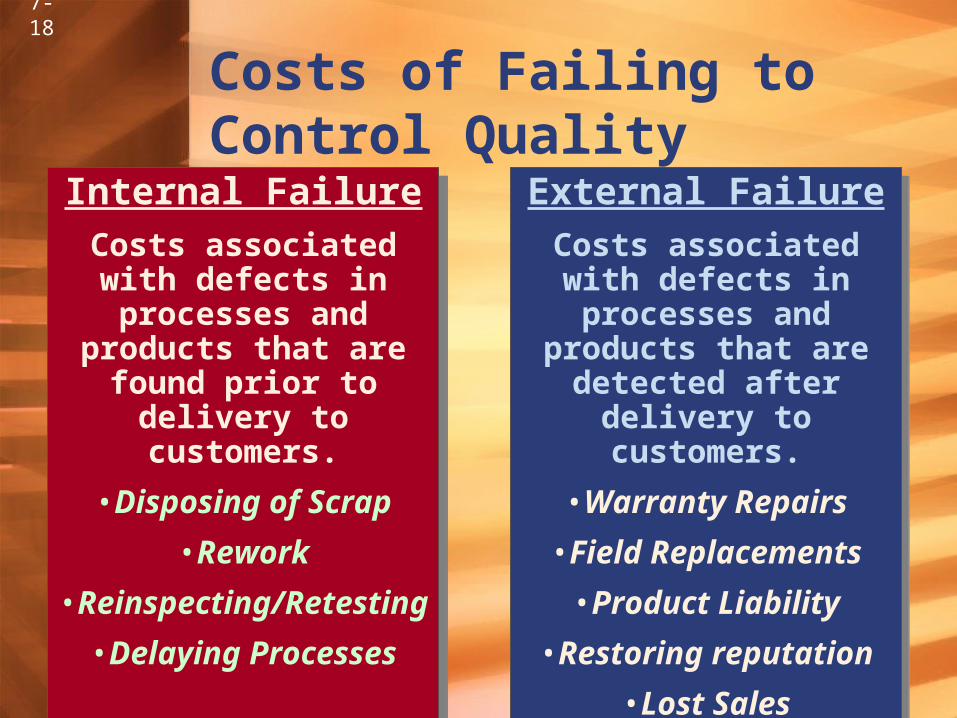
Costs of Failing to Control Quality
Internal FailureCosts associated with defects in processes and products that are found prior to delivery
to customers.
•Disposing of Scrap
•Rework
•Reinspecting/Retesting
•Delaying Processes
Internal FailureCosts associated with defects in processes and products that are found prior to delivery
to customers.
•Disposing of Scrap
•Rework
•Reinspecting/Retesting
•Delaying Processes
External FailureCosts associated with defects in processes and products that are detected after delivery
to customers.
•Warranty Repairs
•Field Replacements
•Product Liability
•Restoring reputation
•Lost Sales
External FailureCosts associated with defects in processes and products that are detected after delivery
to customers.
•Warranty Repairs
•Field Replacements
•Product Liability
•Restoring reputation
•Lost Sales
7-19
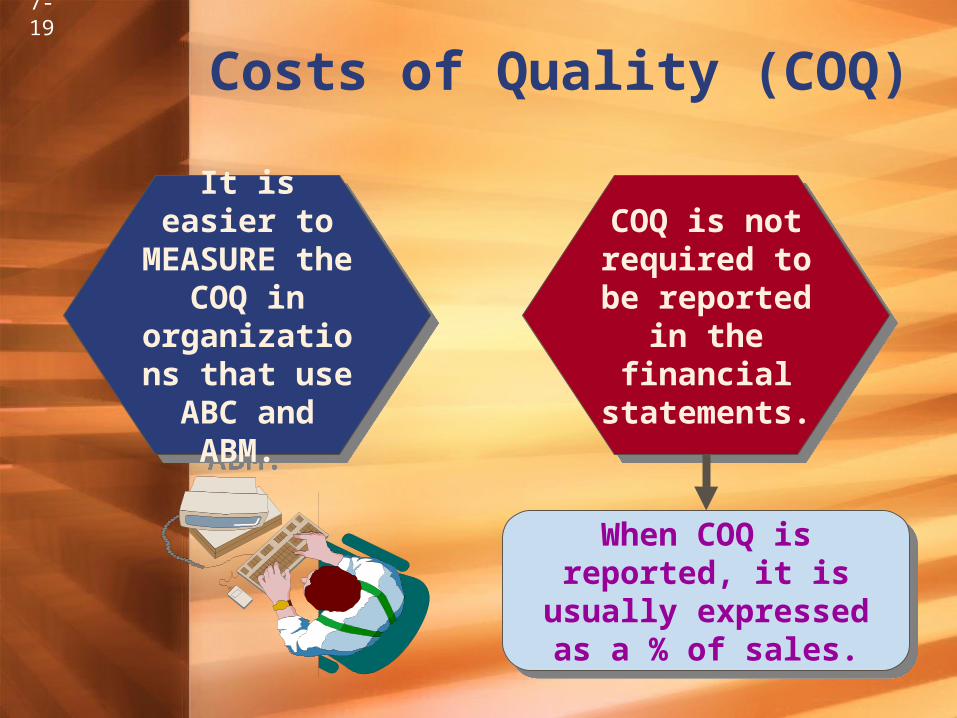
Costs of Quality (COQ)
It is easier to MEASURE the COQ in
organizations that use ABC
and ABM.
It is easier to MEASURE the COQ in
organizations that use ABC
and ABM.
COQ is not required to be reported
in the financial
statements.
COQ is not required to be reported
in the financial
statements.
When COQ is reported, it is usually expressed
as a % of sales.
When COQ is reported, it is usually expressed
as a % of sales.

7-20
Quality Awards and Certificates
JapanEuropean
Community
7-21
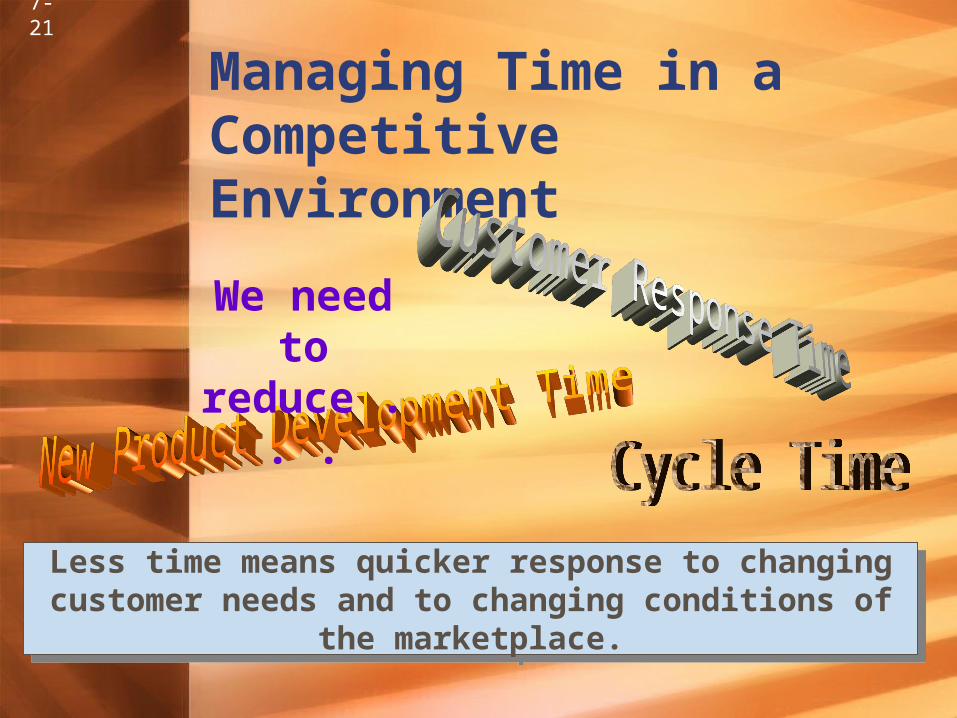
Managing Time in a Competitive Environment
Less time means quicker response to changing customer needs and to changing conditions of the marketplace.
Less time means quicker response to changing customer needs and to changing conditions of the marketplace.
We need to reduce . . .
7-22
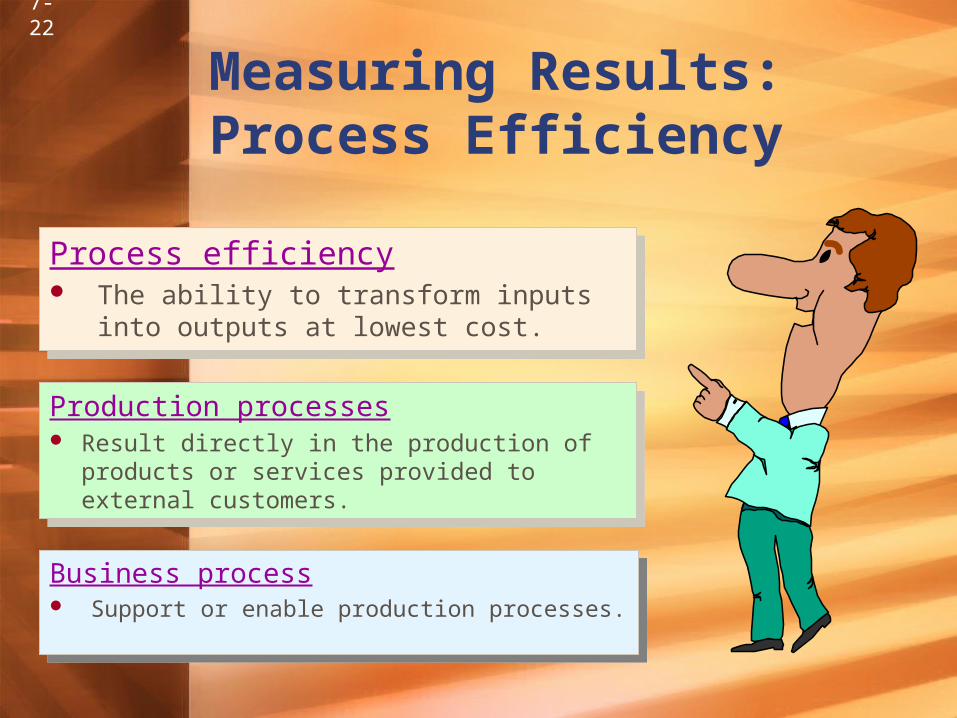
Measuring Results: Process Efficiency
Process efficiency The ability to transform inputs into outputs at
lowest cost.
Process efficiency The ability to transform inputs into outputs at
lowest cost.
Production processes Result directly in the production of products
or services provided to external customers.
Production processes Result directly in the production of products
or services provided to external customers.
Business process Support or enable production processes.
Business process Support or enable production processes.
7-23
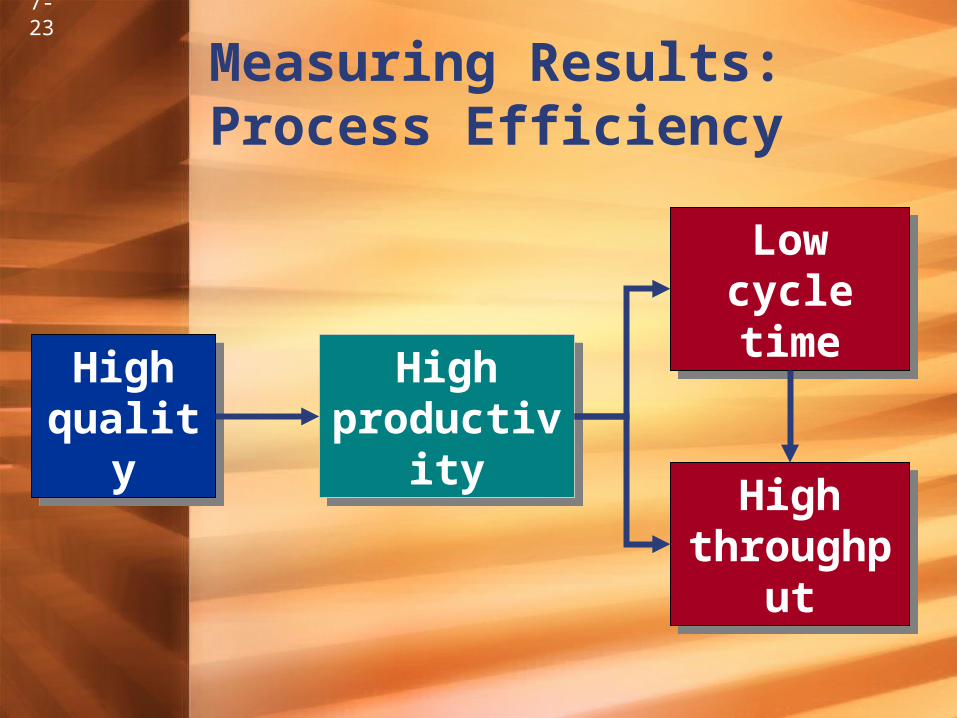
Measuring Results: Process Efficiency
High productivity
High productivity
High quality
High quality
Low cycle time
Low cycle time
High throughput
High throughput
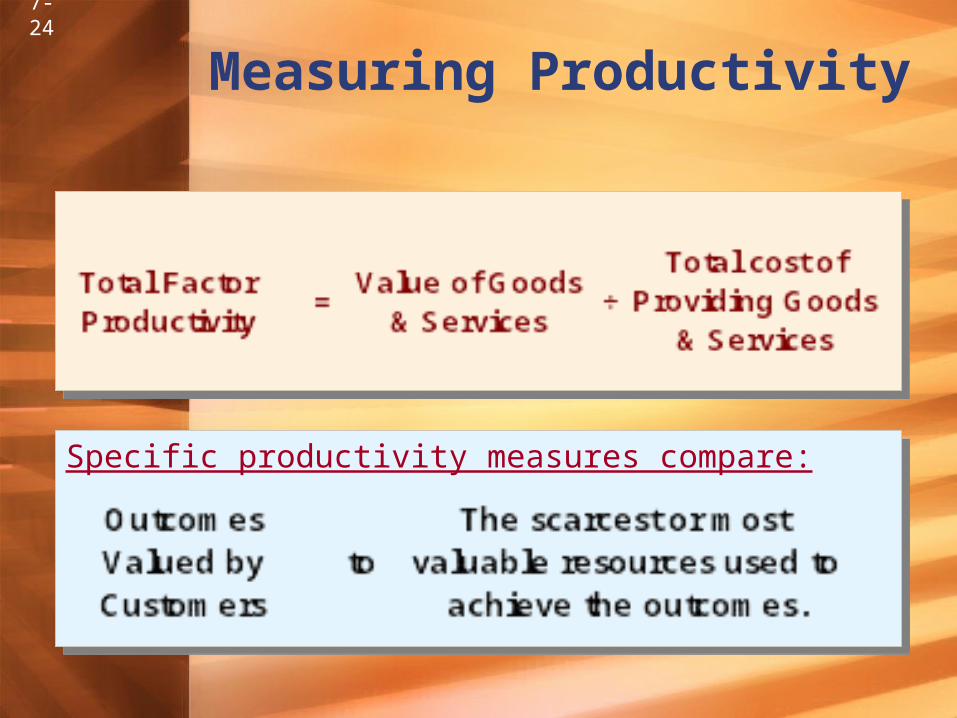
7-24
Measuring Productivity
Specific productivity measures compare:Specific productivity measures compare:
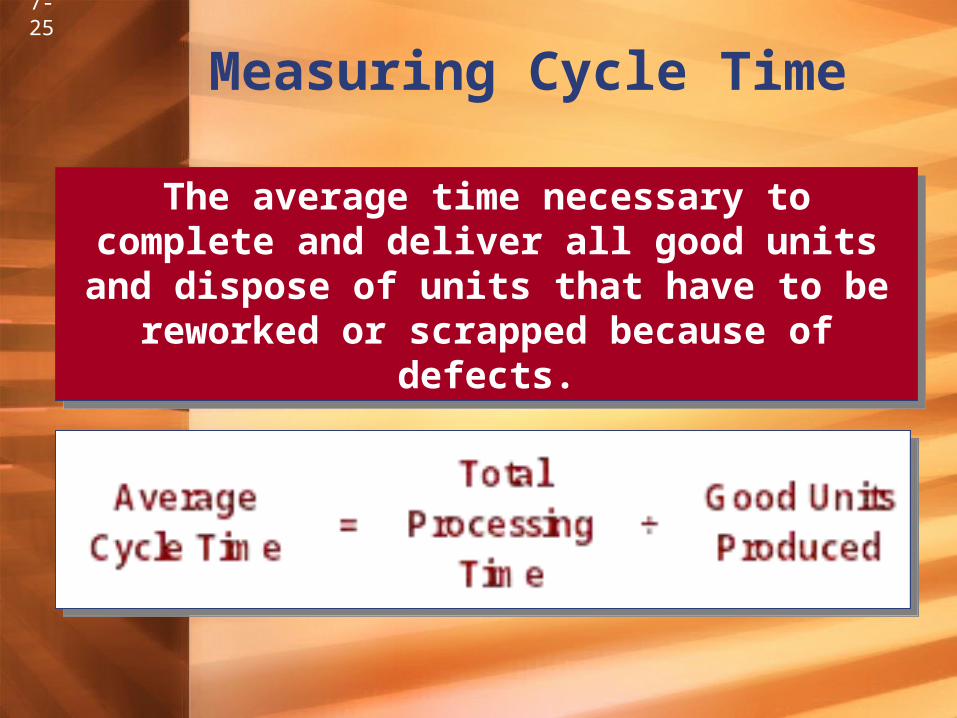
7-25
Measuring Cycle Time
The average time necessary to complete and deliver all good units and dispose of units that have to be reworked or scrapped because of
defects.
The average time necessary to complete and deliver all good units and dispose of units that have to be reworked or scrapped because of
defects.
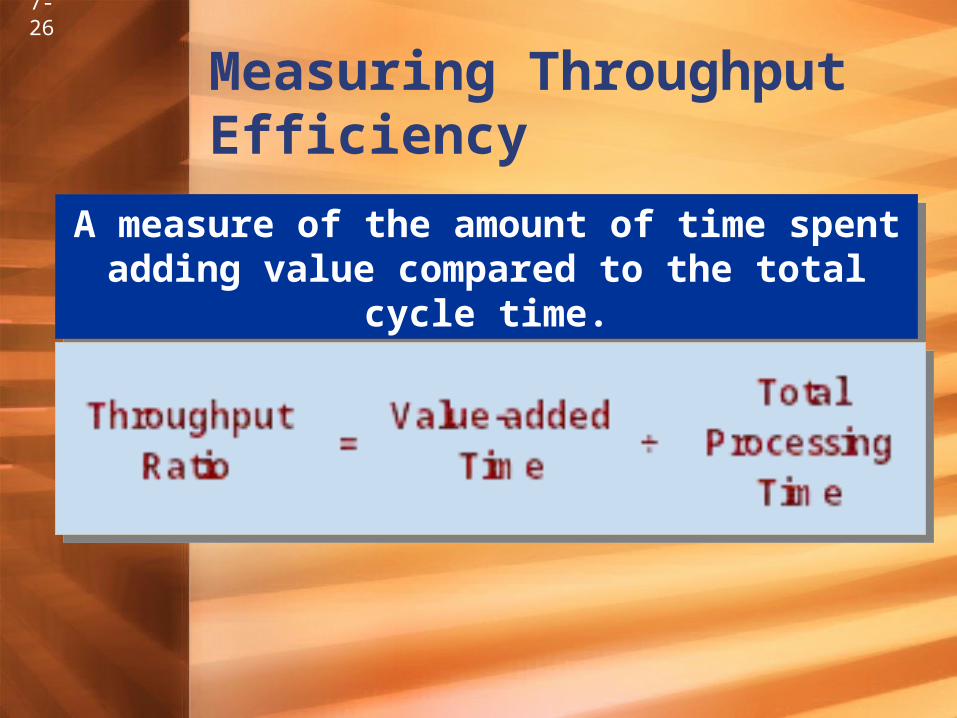
7-26
Measuring Throughput Efficiency
A measure of the amount of time spent adding value compared to the total cycle time.
A measure of the amount of time spent adding value compared to the total cycle time.
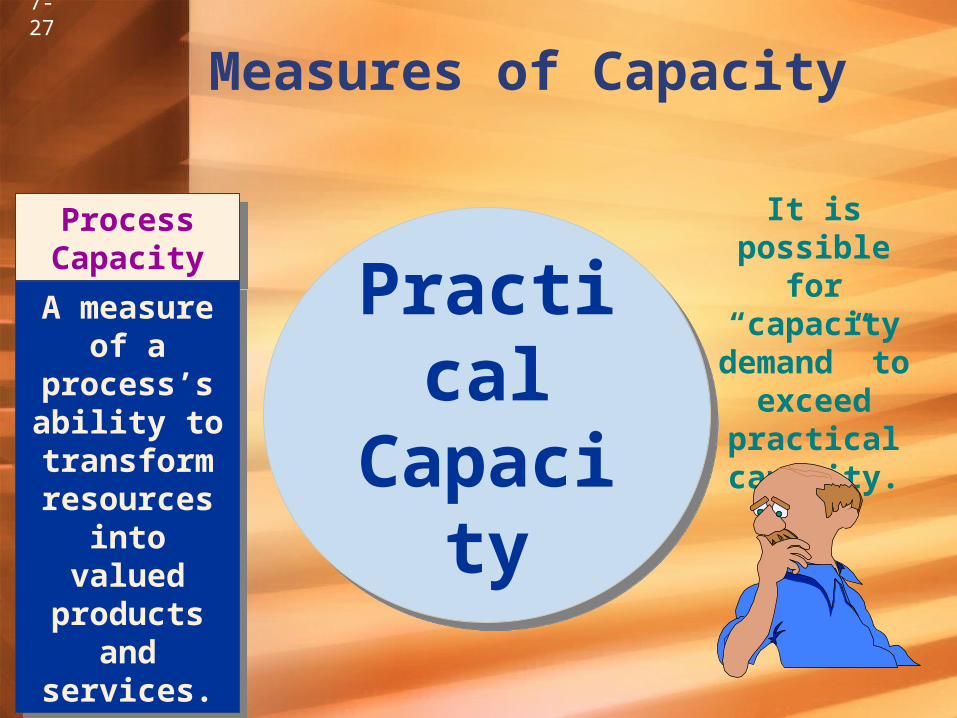
7-27
Measures of Capacity
It is possible for “capacity demand” to
exceed practical capacity.
Practical
Capacity
Practical
Capacity
Process Capacity
Process Capacity
A measure of a process’s
ability to transform resources into valued
products and services.
A measure of a process’s
ability to transform resources into valued
products and services.
7-28
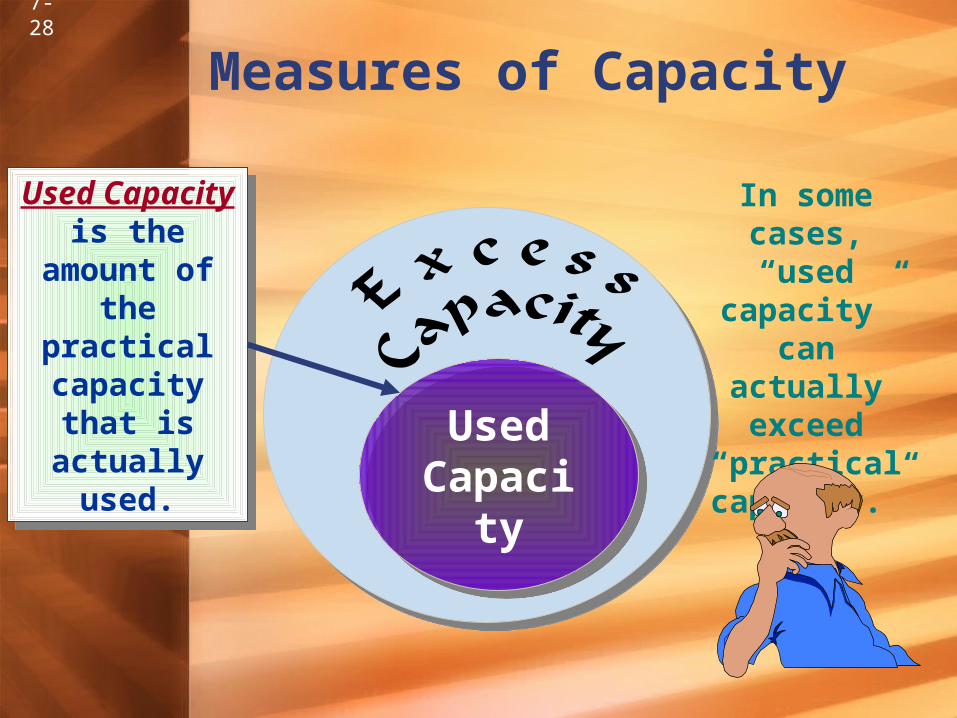
Measures of Capacity
Used Capacity is the amount
of the practical
capacity that is actually
used.
Used Capacity is the amount
of the practical
capacity that is actually
used.Used
CapacityUsed
Capacity
In some cases, “used capacity” can
actually exceed
“practical capacity.”
7-29
Managing Quality + Time + Productivity + Capacity = JIT
The objective of JIT is to . . .
•purchase materials
• produce products
•and deliver products
. . . just when they are needed.
The objective of JIT is to . . .
•purchase materials
• produce products
•and deliver products
. . . just when they are needed.
7-30
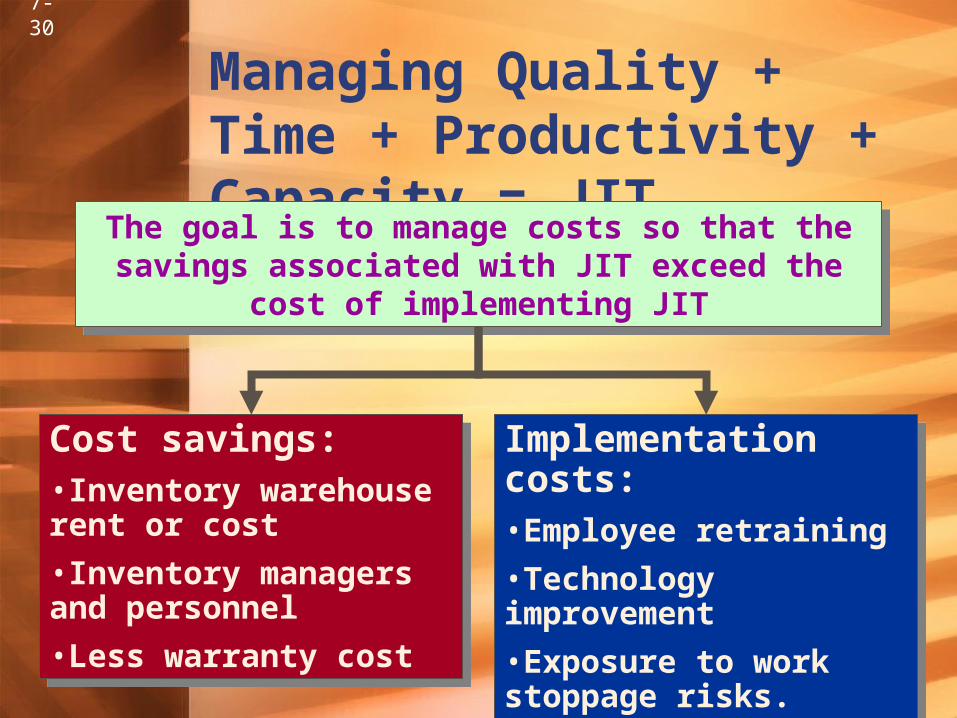
Managing Quality + Time + Productivity + Capacity = JIT
The goal is to manage costs so that the savings associated with JIT exceed the cost of
implementing JIT
The goal is to manage costs so that the savings associated with JIT exceed the cost of
implementing JIT
Cost savings:•Inventory warehouse rent or cost
•Inventory managers and personnel
•Less warranty cost
Cost savings:•Inventory warehouse rent or cost
•Inventory managers and personnel
•Less warranty cost
Implementation costs:•Employee retraining
•Technology improvement
•Exposure to work stoppage risks.
Implementation costs:•Employee retraining
•Technology improvement
•Exposure to work stoppage risks.
7-31
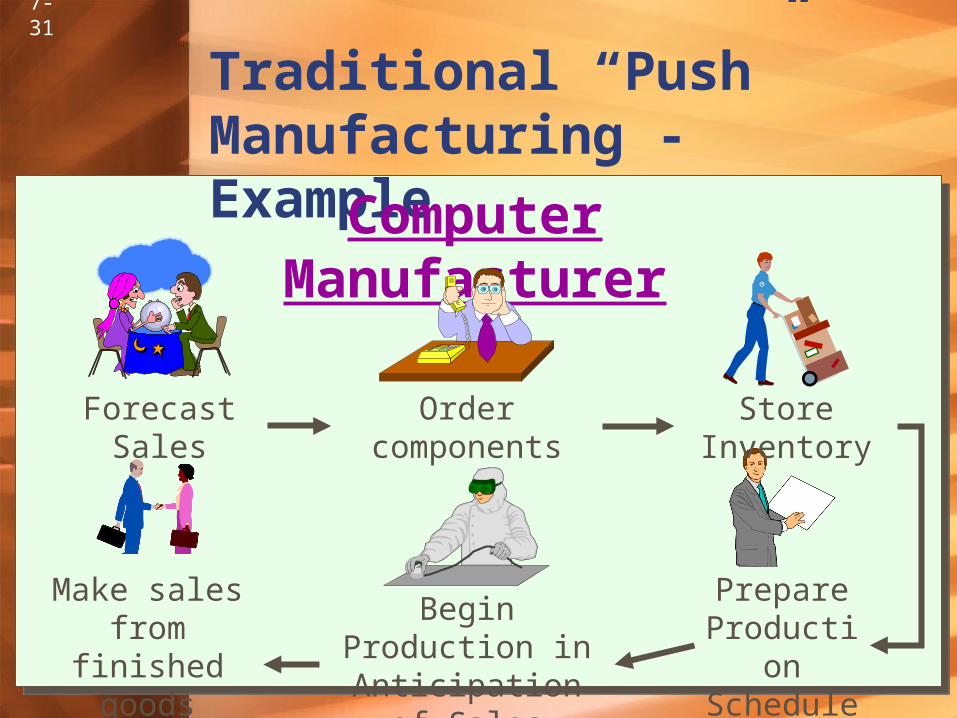
Traditional “Push” Manufacturing - Example
Computer Manufacturer
Forecast Sales Order components
Prepare Production Schedule
Begin Production in Anticipation of Sales
Make sales from finished
goods inventory
Store Inventory
7-32
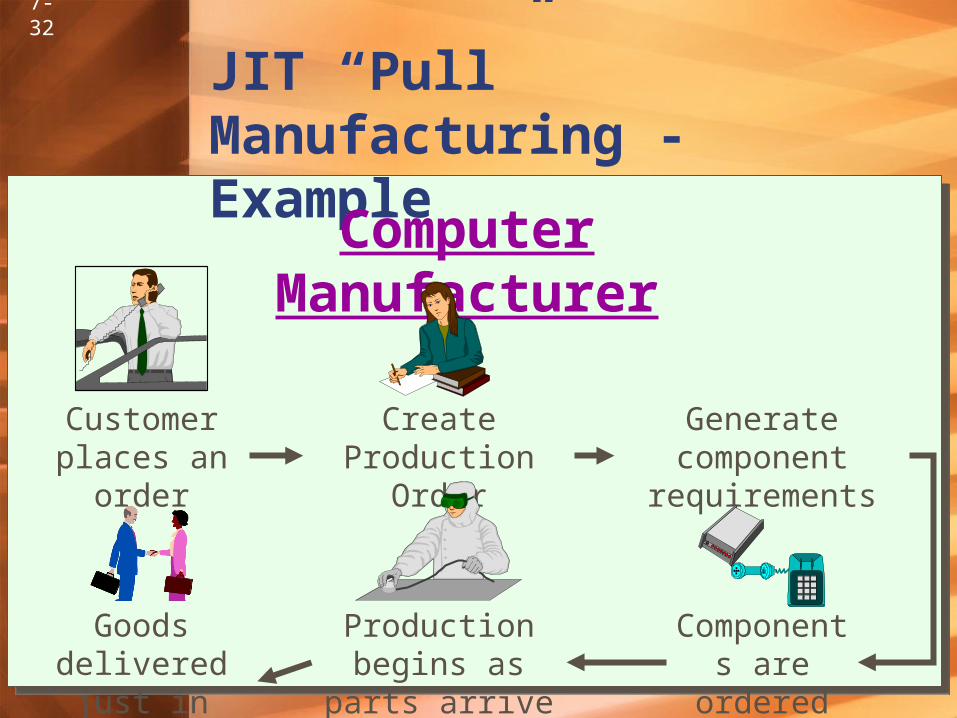
JIT “Pull” Manufacturing - Example
Computer Manufacturer
Customer places an order
Create Production Order
Generate component requirements
Production begins as parts arrive
Goods delivered just in time
Components are ordered

7-33
JIT Success Factors
1. Commitment
to quality.
1. Commitment
to quality.
2. Flexible Capacity.
2. Flexible Capacity.
3. Reliable Supplier
Relations.
3. Reliable Supplier
Relations.4. Smooth Productio
n Flow.
4. Smooth Productio
n Flow.
5. Well-trained
workforce.
5. Well-trained
workforce.
6. Reduced cycle and response
times.
6. Reduced cycle and response
times.

7-34
End of Chapter 7
Uh, Boss? My luggage was Just-in-Time, but I
wasn’t!