Embed Size (px)
Citation preview

Hilltop Middle School 2010-2011
1
SPSA Data Revisions based on 2010 CST Scores
School Demographics/Staff Certificated Certificated Classified Classified
Principal 1 Counselor 3 Clerk/Secretary 6 Tester 1
Assist. Principal 2 School Nurse 1 Campus Assistant 2 Student Program Fac. 2
Sch. Psychologist 1 Librarian 1 Custodian 6 Lab Facilitator 1
Classroom Teacher 50 Special Ed. Teachers 8.2 Cafeteria Workers 4 Comm. Relations Fac. 0
Resource Teacher .2 CIS .2 Health Clerk 10
CIS .4 Instructional Aide 6 Library Media Assist 1
Total Certificated: 68 Total Classified: 39
School Demographics – Students
Student
Enrollment
Ethnicity
(%) Amer. Indian/
Alaskan Native Asian Filipino Hispanic
Black, not of
Hispanic origin
White, not of
Hispanic
origin
Pacific
Islander
2008-2009 .4 2.2 4.2 73 3.7 15 1.5
2009-2010 0 2 4 78 3 13 1
2010-2011
Student Data http://data1.cde.ca.gov/dataquest/ 2008-2009 2009-2010 2010-2011
EL (Formerly LEP) - English Learners whose primary language is other than English. 248 203 165
Redesignated Students - Redesignated from EL to Fully English Proficient (R-FEP).) 224 285 256
Home Language Other Than English - Primary language is other than English. 743 615 588
Title I/SCE - Students identified as basic or below level on CST scores for math and
ELA. 664 n/a n/a
Gifted and Talented Students (GATE) - Identified gifted and talented students 228 222 246
Free and Reduced Lunch Students - Receiving free/reduced priced meals based on
income qualification. 628 631 611
AVID (Advanced Via Individual Determination) – College readiness class. 68 58 100
Special Education Students -Are identified in an Individual Education Plan (IEP), 47 25 71
73 (RSP)
Attendance Suspensions & Expulsions
Year Actual
Attendance
Year
Suspension Expulsions
Number Number
2007-08 96.3% 2007-08 104 4
2008-09 97.2% 2008-09 147 4
2009-10 96.25% 2009-10 183 3
School Mobility Rate Promotion Rates
Year Total Enrollment Male Female
2008-2009 1241 635 619
2009-2010 1202 613 589
2010-2011 1134 584 550
Year Percentage
2007-08 9.18
2008-09 9.15
2009-10 6
Year Number Percentage
2007-08 542 80%
2008-09 552 91%
2009-10 530 86%

Hilltop Middle School 2010-2011
2
ESEA/NCLB PROGRAM IMPROVEMENT SITE REQUIREMENTS (PI Schools Only)
2010-2011 (LEA will provide technical assistance to all schools in Program Improvement.)
For schools in Program Improvement – check the appropriate year of Program Improvement for your site.
X PI Year I PI Year 2 PI Year 3 – Corrective Action PI Year 4 - Restructuring PI Year 5 – Restructuring
Notifies parents of PI status of school and school choice
Revises school plan within 3 months to cover 2-year period
Provides choice to attend another public school in the LEA that is not PI (district/school responsibility)
Establishes peer review process to review revised school plan (district/school responsibility)
Uses 10% of Title I school funds for staff professional development
Implements plan promptly
Parent notification of PI status of school (district/school responsibility)
Offer Supplemental Educational Services to all eligible students
School continues: o Plan implementation o Professional development o Continue School Choice
(district/school responsibility)
Parent notification of PI status of school (district/school responsibility)
LEA identifies school for corrective action and does at least one of the following: o Replaces school staff o Implements new curriculum o Decreases management
authority at school level o Appoints outside expert o Extends school year or day o Restructures internal
organizational structure of school
LEA informs parents and public of corrective actions and allows comment. LEAs may provide direct technical assistance to school site councils in developing school plans.
School continues: o Professional development o Collaboration with district to
improve student achievement o School choice (district/school
responsibility) o Supplemental services
(district/school responsibility)
Parent notification of PI status of school (district/school responsibility)
During Year 4, in consultation with the LEA, prepare plan for alternative governance of school, which must include one of the following: (district/school responsibility) o Reopen school as a charter o Replace all or most staff,
including principal o Contract with outside entity to
manage school o State takeover o Any other major restructuring
LEA provides notice to parents and teachers and allows comment.
School continues: o Professional development o Collaboration with district to
improve student achievement o School choice o Supplemental services
Parent notification of PI status of school, : (district/school responsibility)
Implement alternative governance plan developed in Year 4 (district /school responsibility)
School continues: o Professional development o Collaboration with district
to improve student achievement
o School choice o Supplemental services
School continues in PI, and LEA offers choice and supplemental services until school makes AYP for two consecutive years. School exits PI after two consecutive years of making AYP.
School Accountability: Date ESEA/NCLB Choice letter sent:
September 3, 2010
Date SES letter sent:
September 2010
Date PI letter sent:
September 3,2010
Number of students selecting (Pending 2nd
sem)
ESEA/NCLB Choice: # _____ Granger Junior
#_______ Bonita Vista Middle
Number of Students selecting SES:
(Categorical office will provide # )
Parent PI meeting dates: Tuesday, October 19

Hilltop Middle School 2010-2011
3
Academic Performance Index (API) The API is a single number on a scale of 200 to 1,000 that indicates how well a school performed, based on spring
state testing. The purpose of the API is to measure the academic performance and growth of schools. (Adjust reporting years to show available data for most current three-
year trend).
2007 API Base 2008 API Base 2009 API Base
2006 API (Base) 756 2007 API (Base) 780 2009 API (Base) 775
2006 Statewide Rank 6 2007 Statewide Rank 7 2009 Statewide Rank 6
2006 Similar Schools Rank 6 2007 Similar Schools Rank 8 2009 Similar Schools Rank 6
2006-07 Growth Target 5 2007-08 Growth Target 5 2009-10 Growth Target 5
2006 API Target 761 2008 API Target 785 2010API Target 780
2007-08 Growth 2008-09 Growth 2009-10 Growth
2007 Growth 782 2007 Growth 782 2010Growth 790
2006-07Growth 13 2006-07Growth 2 2009-10Growth 15
Met Growth Target/Schoolwide YES Met Growth Target/Schoolwide NO Met Growth Target/Schoolwide NO
Comparable Improvement NO Comparable Improvement NO Comparable Improvement NO
Both School wide and CI NO Both School wide and CI NO Both School wide and CI NO
Awards Eligible NO Awards Eligible NO Awards Eligible NO
Information compiled from the CDE reports at http://api.cde.ca.gov/
See APPENDIX, Page____ for more information on API criteria.
2007 Subgroup
API (Base)
2007-08 Subgroup
Growth Target
2008 Subgroup
API (Growth)
2007-08 Subgroup
Growth
Met Subgroup
Growth Target
2008 Subgroup
API (Base)
2008-09 Subgroup
Growth Target
2009 Subgroup
API (Growth)
2008-09 Subgroup
Growth
Met Subgroup
Growth Target
2009 Subgroup
API (Base)
2009-10 Subgroup
Growth Target
2010 Subgroup
API (Growth)
2009-10 Subgroup
Growth
Met Subgroup
Growth Target
Amer Indian/Alaskan Native
Asian/Asian American Black/African American
Filipino/Filipino American
Hispanic/Latino 740 5 15 YES 769 767 5 -2 NO 761 5 773 12 YES
Pacific Islander White (non Hispanic origin)
814 A 13 YES 833 827 A -6 YES 821 A 863 42 YES
Socioeconomically Disadv
659 5 39 YES 749 746 5 -3 NO 739 5 763 24 YES
Based on enrollment, only statistically significant numbers are reported. Information compiled from the CDE reports at http://api.cde.ca.gov/

Hilltop Middle School 2010-2011
4
Federal Accountability Adequate Yearly Progress (AYP) Required by the federal No Child Left Behind Act; AYP measures the performance of California schools and districts. In order to achieve this goal and meet annual
performance objectives, districts and schools must improve each year according to set requirements. Data reported show whether all groups of students in the school made
Adequate Yearly Progress (AYP).
School met all 2008
Adequate Yearly Progress
(AYP) Criteria?
2008 School met all 2009 Adequate
Yearly Progress (AYP)
Criteria?
2009 School met all 2010 Adequate
Yearly Progress (AYP) Criteria?
2010
NO NO NO
Information compiled from the CDE reports at: http://www.cde.ca.gov/ta/ac/ay/index.asp
2008AYP Criteria Summary 2009 AYP Criteria Summary 2010 AYP Criteria Summary
Met 2008 AYP
Criteria Met 2009 AYP
Criteria Met 2010AYP
Criteria
AYP Components ELA Math AYP Components ELA Math AYP Components ELA Math
Participation Rate Yes Yes Participation Rate Yes Yes Participation Rate Yes Yes
Percent Proficient Yes Yes Percent Proficient Yes No Percent Proficient No No
API as additional
indicator 756
API as additional
indicator 782
API as additional
indicator 790
ENGLISH LANGUAGE ARTS MATHEMATICS
2007-2008 2008-2009 2009-2010 2007-2008 2008-2009 2009-2010
Participation
95%
Proficient or
above 35.2%
Participation
95%
Proficient or
above 46.0%
Participation
95%
Proficient or
above 56.8%
Participation
95%
Proficient or
above 37%
Participation
95%
Proficient or
above 47.5%
Participation
95%
Proficient or
above 58.0%
Groups
Rat
e
Met
2008 AYP
Crite
ria
Per
cen
t
Met
2008 AYP
Crite
ria
Rat
e
Met
2009AYP
Crite
ria
Per
cen
t
Met
2009AYP
Crite
ria
Rat
e
Met
2010 AYP
Crite
ria
Per
cen
t
Met
2010 AYP
Crite
ria
Rat
e
Met
2008 AYP
Crite
ria
Per
cen
t
Met
2008AYP
Crite
ria
Rat
e
Met
2009AYP
Crite
ria
Per
cen
t
Met
2009 AYP
Crite
ria
Rat
e
Met
2010 AYP
Crite
ria
Per
cen
t
Met
2010AYP
Crite
ria
Schoolwide 58 100 Yes 56.3 Yes 100 Yes 59.6 Yes 100 Yes 44.2 Yes 100 Yes 44.3 No 100 Yes 45.4 No
African Amer. 53.1 100 51.5 100 50.0 100 39.4 100 39.4 100 43.8
Asian 83.1 100 83.3 100 89.5 100 83.3 100 83.3 100 73.7
Filipino 72.7 100 72.7 100 83.8 100 67.4 100 68.2 100 59.5
Hispanic/Latin 100 Yes 54.5 Yes 100 Yes 52.6 Yes 100 Yes 55.5 No 99 Yes 40.8 Yes 99 Yes 40.7 No 100 Yes 42.0 No
Pacific Islander 54.5 99 54.5 100 100 36.4 100 36.4 100
White 100 Yes 70.3 Yes 100 Yes 69.5 Yes 100 Yes 79.4 Yes 100 Yes 53.0 Yes 100 Yes 53.9 Yes 100 Yes 60.3 Yes
Socioecon. Dis 100 Yes 48 Yes 100 Yes 46.0 Yes 100 Yes 51.4 Yes 100 Yes 37.8 Yes 100 Yes 37.9 No 100 Yes 41.6 No
English Learner
100 Yes 35.3 No 100 No 33.9 No 100 Yes 43.3 Yes 100 Yes 30.6 No 100 Yes 31.0 No 100 Yes 38.5 Yes
Students w/ Disabilities
100 yes 34.2 No 99 No 31.5 No 99 Yes 34.7 Yes 99 Yes 18.4 No 99 Yes 23.9 No 100 Yes 25.5 No

Hilltop Middle School 2010-2011
5
California English Language Development Test Report (CELDT) - All Assessments – All Students The CELDT addresses state-adopted English Language Development Standards that covers listening/speaking skills for kindergarten and first grade, and
listening/speaking, reading, and writing skills for grades two through twelve. (Adjust reporting years to show available data for most current three-year trend).
*Granger Jr.
Overall
Proficiency
Middle School
2008-09 2009-10 2010-11
7th 8th *9th Total
Tested 7th 8th *9th
Total
Tested 7th 8th *9th
Total
Tested
Advanced 13 7 n/a 20 36 9 n/a 45 10 10 n/a 20
13% 9% n/a 11% 27% 9% n/a 20% 12% 10% n/a 11%
Early Advanced 45 35 n/a 80 60 44 n/a 104 35 43 n/a 78
43% 45% n/a 44% 45% 46% n/a 46% 41% 42% n/a 41%
Intermediate 29 24 n/a 53 31 28 n/a 59 27 34 n/a 61
28% 31% n/a 39% 31% 28% n/a 26% 32% 33% n/a 32%
Early
Intermediate
8 9 n/a 17 3 8 n/a 11 6 7 n/a 13
8% 12% n/a 9% 2% 80% n/a 50% 7% 7% n/a 7%
Beginning 9 3 n/a 12 2 6 n/a 8 7 9 n/a 16
9% 4% n/a 7% 2% 6% n/a 4% 8% 9% n/a 9%
Number Tested 104 78 n/a 182 132 95 n/a 227 85 103 n/a 188
Data compiled from CDE website at: http://celdt.cde.ca.g

Hilltop Middle School 2010-2011
6
California Standards Test (CST) SCORES - The CSTs for English–language arts, mathematics, science,
and history–social science are administered only to students in California public schools. Except for a writing component that
is administered as part of the grade seven English–language arts tests, all questions are multiple-choice. These tests were
developed specifically to assess students' knowledge of the California content standards. Student scores are reported as
performance level. *Granger Jr.
English Language Arts (ELA) 2010 State Report – All Students (CDE California Standardized Testing and Reporting -STAR)
GRADE Students
Tested
%
Advanced
%
Proficient
%
Basic
% Below
Basic
%
Far Below
Basic
07 441,478 23 32 27 11 7
08 451,376 29 25 27 11 8
*09 490,324 24 30 25 13 8 The Categorical Office will provide state and district scores.
2010 District Report – All Students (CDE California Standardized Testing and Reporting -STAR)
GRADE Students
Tested
%
Advanced
%
Proficient
%
Basic
% Below
Basic
%
Far Below
Basic
07 5384 20 34 29 11 6
08 5736 26 28 29 11 6
*09 6413 24 36 26 11 4 CDE reports available at http://star.cde.ca.gov/ The Categorical Office will provide state and district scores.
2010 Feeder School Report – All Students (CDE California Standardized Testing and Reporting -STAR)
Feeder School
(select top2-3 schools)
PI
School
GRADE Students
Tested
%
Advanced
%
Proficient
%
Basic
%
Below
Basic
%
Far Below
Basic
Hilltop Drive No 06 77 26 35 29 5 5
Cook No 06 75 20 40 25 9 5
Rosebank No 06 104 28 47 22 2 1 CDE reports available at http://star.cde.ca.gov/
2010 School Reporting Clusters – ELA – All Students
Reading Writing
Word Analysis
and Vocabulary
Development
Reading
Comprehension
Literacy
Response and
Analysis
Written
Conventions
Writing
Strategies
# Possible Mean % Correct
# Possible Mean % Correct
# Possible Mean % Correct
# Possible Mean % Correct
# Possible Mean % Correct
Grade 7 11
70
18
72
13
68
16
71
8
n/a
Grade 8 9 58 18 73 15 67 16 66 17 64
The CST Summary list (STAR) testing, spring 2010.

Hilltop Middle School 2010-2011
7
California Standards Test (CST) SCORES
ALL Students
Table 1. CST - English Language Arts, Reported by Percentages - Student scores are reported as
performance levels.
Grade Year Advanced Proficient Basic Below Basic Far Below
Basic
07 2008 23 35 25 12 6
2009 24 38 27 9 3
2010 25 39 26 8 3
08 2008 17 32 30 15 7
2009 21 30 34 12 3
2010 39 27 39 10 6
SUBGROUPS
Table 2. CST – English Language Arts, Reported as Percent Proficient and Above
Data reported are the number of students tested and the percent of students achieving at the proficient or advanced level
(meeting or exceeding the state standards). (Adjust reporting years to show available data for most current three-year trend).
Subgroups
2008 2009 2010 # of Students Tested/% Prof. & Above # of Students Tested/% Prof. & Above # of Students Tested/% Prof. & Above
07 08 *09 07 08 *09 07 08 *09 # % # % # % # % # % # % # % # % # %
Male 323 50 363 45
n/a
281 62 292 49
n/a
248 57 275 53
n/a
Female 284 66 310 53 275 61 288 54 269 70 286 57
Econ Disadv 300 50 317 41 263 51 323 42 279 54 270 48
Non-econ Disadv 307 64 356 55 293 71 257 63 238 74 289 62
English Learner 101 11 101 3 91 8 76 3 68 12 86 9
GATE 118 95 120 87 118 97 121 93 109 99 112 91
African-Amer. 25 32 19 47 8 9 19 47 17 35
Filipino 19 84 8 na 22 86 21 57 15 80 22 86
Hispanic 455 55 508 45 440 56 434 49 412 59 449 51
White 88 72 112 67 61 77 88 66 59 90 56 71
Stud.
w/disabilities 61 2 67 8 30 20 31 19 17 29 31 19
Std. w/no disabil. 546 64 606 53 526 64 549 53 500 65 530 57
Hilltop Middle School 2010-2011
8
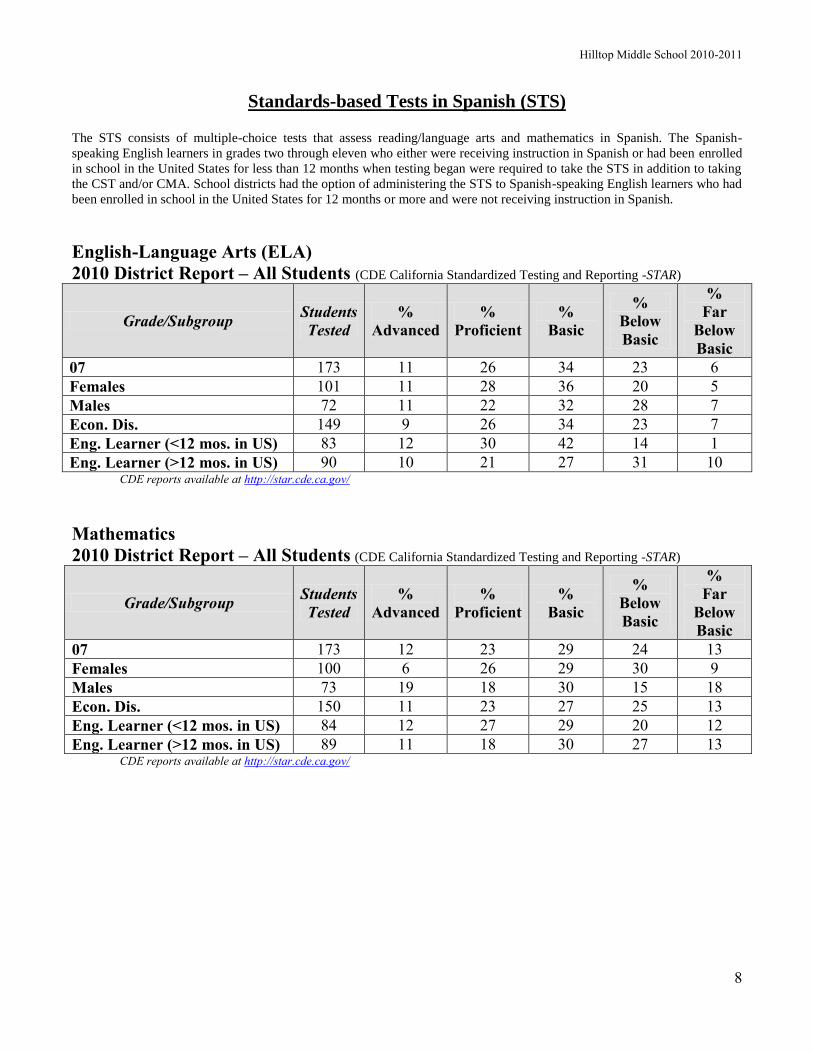
Standards-based Tests in Spanish (STS)
The STS consists of multiple-choice tests that assess reading/language arts and mathematics in Spanish. The Spanish-
speaking English learners in grades two through eleven who either were receiving instruction in Spanish or had been enrolled
in school in the United States for less than 12 months when testing began were required to take the STS in addition to taking
the CST and/or CMA. School districts had the option of administering the STS to Spanish-speaking English learners who had
been enrolled in school in the United States for 12 months or more and were not receiving instruction in Spanish.
English-Language Arts (ELA)
2010 District Report – All Students (CDE California Standardized Testing and Reporting -STAR)
Grade/Subgroup Students
Tested
%
Advanced
%
Proficient
%
Basic
%
Below
Basic
%
Far
Below
Basic
07 173 11 26 34 23 6
Females 101 11 28 36 20 5
Males 72 11 22 32 28 7
Econ. Dis. 149 9 26 34 23 7
Eng. Learner (<12 mos. in US) 83 12 30 42 14 1
Eng. Learner (>12 mos. in US) 90 10 21 27 31 10 CDE reports available at http://star.cde.ca.gov/
Mathematics
2010 District Report – All Students (CDE California Standardized Testing and Reporting -STAR)
Grade/Subgroup Students
Tested
%
Advanced
%
Proficient
%
Basic
%
Below
Basic
%
Far
Below
Basic
07 173 12 23 29 24 13
Females 100 6 26 29 30 9
Males 73 19 18 30 15 18
Econ. Dis. 150 11 23 27 25 13
Eng. Learner (<12 mos. in US) 84 12 27 29 20 12
Eng. Learner (>12 mos. in US) 89 11 18 30 27 13 CDE reports available at http://star.cde.ca.gov/

Hilltop Middle School 2010-2011
9
California Modified Assessment (CMA) The CMA is a standards-based test for students with an individualized education program who meet the eligibility criteria
adopted by the State Board of Education. The No Child Left Behind Act of 2001 calls for a range of assessments appropriate
to students' abilities. The CMA provides an appropriate assessment for a small percentage of students allowing them to
demonstrate their knowledge of skills in the California academic content standards for English–language arts (ELA) (grades
three through nine only), mathematics (grades three through seven), and Algebra I (for eligible students in grades seven
through eleven), and science (grades five, eight, and ten only). Scale scores and performance levels are available only for
CMA results for English–language arts for grades three through eight, mathematics for grades three through seven, and
science for grades five and eight in 2010. For 2010, CMA results are reported as percent correct for English–language arts for
grade nine, Algebra I for grades seven through eleven, and life science for grade ten. Scale scores and performance levels
will be available for those subjects and grades beginning in 2011.
English-Language Arts (ELA) - 2010 District Report – All Students - CDE reports available at
http://star.cde.ca.gov/
Grade/Subgroup Students
Tested
%
Advanced
%
Proficient
%
Basic
%
Below
Basic
%
Far Below
Basic
07 478 15 23 23 29 9
Females 148 20 25 26 24 5
Males 330 13 22 21 32 12
Econ. Dis. 357 13 20 25 31 10
Not Econ. Dis. 120 22 32 15 24 8
English Learner 266 11 21 22 35 11
Hispanic or Latino 377 12 24 23 31 10
Grade/Subgroup Students
Tested
%
Advanced
%
Proficient
%
Basic
%
Below
Basic
%
Far Below
Basic
08 439 8 20 27 31 13
Females 158 8 17 35 28 13
Males 280 8 22 23 34 13
Econ. Dis. 293 9 20 24 31 16
Not Econ. Dis. 146 6 20 34 32 8
English Learner 249 7 17 27 34 15
Hispanic or Latino 357 7 18 26 34 14
Mathematics - 2010 District Report – All Students - CDE reports available at http://star.cde.ca.gov/
Grade/Subgroup Students
Tested
%
Advanced
%
Proficient
%
Basic
%
Below
Basic
%
Far Below
Basic
07 490 13 22 23 27 15
Females 166 10 23 28 25 14
Males 324 15 21 21 28 15
Econ. Dis. 356 11 21 24 29 15
Not Econ. Dis. 133 20 25 21 20 14
English Learner 262 11 19 26 29 15
Hispanic or Latino 386 12 22 23 28 15

(Your School Name/Year)
10
California Alternative Performance Assessment (CAPA) - Students with significant cognitive disabilities who are unable to take the
CSTs even with modifications participated in the STAR Program by taking the CAPA. The CAPA is an individually administered performance assessment with
all tasks linked to the California English–language arts, mathematics, and science content standards.
CAPA English Language Arts (ELA) - All Students STATE
2009-10 Level I
Grade
#
Tested
%
Adv
%
Prof
%
Basic
%
BB
%
FBB
07 1,220 56 24 8 7 5
08 1,265 57 22 8 7 6
*09 1,235 54 19 10 8 8
Level I – Grades two to eleven
2009-10 Level IV
Grade
#
Tested
%
Adv
%
Prof
%
Basic
%
BB
%
FBB
07 3,209 42 30 16 8 3
08 3,279 49 27 15 7 2
Level IV – Grades six through eight
2009-10 Level V
Grade
#
Tested
%
Adv.
%
Prof
%
Basic
%
BB
%
FBB
*09 3,386 41 37 17 3 3
DISTRICT
2009-10 Level I
# Tested % At or above
98 82
Level I – Grades two to eleven
2009-10 Level IV
# Tested % At or Above
117 97
Level IV – Grades six through eight
*2009-10 Level V
# Tested % At or above
173 88
Level V – Grades nine through eleven.

(Your School Name/Year)
24
California Alternative Performance Assessment (CAPA) - Students with significant cognitive disabilities who are unable to take the
CSTs even with modifications participated in the STAR Program by taking the CAPA. The CAPA is an individually administered performance assessment with
all tasks linked to the California English–language arts, mathematics, and science content standards.
CAPA Mathematics - All Students
STATE 2009-10 Level I
Grade
#
Tested
%
Adv
%
Prof
%
Basic
%
BB
%
FBB
07 1,216 33 32 19 8 6
08 1,265 34 33 18 9 7
09 1,229 34 29 19 9 9
Level I – Grades two to eleven
2009-10 Level IV
Grade
#
Tested
%
Adv
%
Prof
%
Basic
%
BB
%
FBB
07 3201 33 35 12 17 3
08 3,271 39 35 9 14 2
Level IV – Grades six through eight
2009-10 Level V
Grade
#
Tested
%
Adv.
%
Prof
%
Basic
%
BB
%
FBB
09 3,374 33 31 21 12 2
Level V – Grades nine through eleven.
DISTRICT
2009-10 Level I
# Tested % At or Above
98 68
Level I – Grades two to eleven
2009-10 Level IV
# Tested % At or Above
117 83
Level IV – Grades six through eight
*2009-10 Level V
# Tested % At or above
173 71
Level V – Grades nine through eleven.

Hilltop Middle School 2010-2011
25
CAPA – SCHOOL * Hilltop Middle
English Language Arts (ELA) - All Students
2007-08
Level I
Grades 2-11 Level IV
Grades 6-8 *Level V
Grades 9-11
# Tested %At
or Above # Tested
%At
or Above # Tested
%At
or Above
1 0 12 67 -- --
2008-09
Level I
Grades 2-11 Level IV
Grades 6-8 *Level V
Grades 9-11
# Tested %At
or Above # Tested
%At
or Above # Tested
%At
or Above
1 0 17 82 -- --
2009-10
Level I
Grades 2-11 Level IV
Grades 6-8 *Level V
Grades 9-11
# Tested %At
or Above # Tested
%At
or Above # Tested
%At
or Above
3 0 18 94 -- --
Mathematics - All Students
2007-08
Level I
Grades 2-11 Level IV
Grades 6-8 *Level V
Grades 9-11
# Tested %At
or Above # Tested
%At
or Above # Tested
%At
or Above
1 0 12 67 -- --
2008-09
Level I
Grades 2-11 Level IV
Grades 6-8 *Level V
Grades 9-11
# Tested %At
or Above # Tested
%At
or Above # Tested
%At
or Above
1 0 17 35 -- --
2009-10
Level I
Grades 2-11 Level IV
Grades 6-8 *Level V
Grades 9-11
# Tested %At
or Above # Tested
%At
or Above # Tested
%At
or Above
3 0 18 82 -- --

Hilltop Middle School 2010-2011
25
California Standards Test (CST) SCORES - The CSTs for English–language arts, mathematics, science,
and history–social science are administered only to students in California public schools. Except for a writing component that
is administered as part of the grade seven English–language arts tests, all questions are multiple-choice. These tests were
developed specifically to assess students' knowledge of the California content standards. Student scores are reported as
performance level. *Granger Jr.
CST Math/General Math
2010 State Report – All Students (CDE California Standardized Testing and Reporting -STAR)
GRADE Students
Tested
%
Advanced
%
Proficient
%
Basic
% Below
Basic
%
Far Below
Basic
07 409,666 18 31 28 17 6
08 164,146 6 25 31 24 14
*09 57,813 2 15 27 31 25 CST math, grade 7. The Categorical Office will provide state and district scores.
2010 District Report – All Students (CDE California Standardized Testing and Reporting -STAR)
GRADE Students
Tested
%
Advanced
%
Proficient
%
Basic
% Below
Basic
%
Far Below
Basic
07 5,243 21 33 28 14 4
08 2,863 4 23 35 25 13
*09 1,516 1 15 33 34 17
2010 Feeder School Report – Mathematics - All Students (CDE California Standardized Testing and Reporting -STAR)
Feeder School
(select top2-3 schools)
PI
School
GRADE Students
Tested
%
Advanced
%
Proficient
%
Basic
%
Below
Basic
%
Far Below
Basic
Hilltop Drive No 06 77 23 44 19 9 4
Cook No 06 74 24 32 24 12 7
Rosebank No 06 108 10 48 21 18 3 CDE reports available at http://star.cde.ca.gov/
2010 School Reporting Clusters – Math/General Mathematics – All Students
Rational Numbers
Exponents,
Powers and Roots
Quantitative
Relationships &
Evaluating
Expressions
Multistep
Problems,Graphing
Functions
Measurement &
Geometry
Statistics, Data
Analysis &
Probability #
Possible
Mean %
Correct
#
Possible
Mean %
Correct
#
Possible
Mean %
Correct
#
Possible
Mean %
Correct
#
Possible
Mean %
Correct
#
Possible
Mean %
Correct
Grade 7 14
62
8
61
10
63
15
65
13
60
5
74
Grade 8 14 48 10 46 11 56 10 49 11 39 9 50
The CST summary list (STAR) testing, spring 2010

Hilltop Middle School 2010-2011
26
California Standards Test (CST) SCORES - *Granger Jr.
ALL Students
Table 1. CST – Math/Gen. Math, Reported by Percentages - Student scores are reported as
performance levels. The five performance levels are Advanced (exceeds state standards); Proficient (meets state standards);
Basic (approaching state standards); Below Basic (below state standards); and Far Below Basic (well below state standards).
Students scoring at the Proficient or Advanced level meet state standards in that content area. (Adjust reporting years to
show available data for most current three-year trend).
Grade Year Advanced Proficient Basic Below Basic Far Below
Basic
07
2008 14 37 31 14 5
2009 15 37 32 11 4
2010 16 42 29 10 3
08
2008 6 24 32 26 12
2009 4 25 40 24 7
2010 4 18 36 26 16
SUBGROUPS
Table 2. CST – Math/General Math, Reported as Percent Proficient and Above Data reported are the number of students tested and the percent of students achieving at the proficient or advanced level
(meeting or exceeding the state standards). (Adjust reporting years to show available data for most current three-year trend).
Subgroups
2008 2009 2010 # of Students Tested/% Prof. & Above # of Students Tested/% Prof. & Above # of Students Tested/% Prof. & Above
07 08 *09 07 08 *09 07 08 *09
# % # % # % # % # % # % # % # % # %
Male 319 49 193 30
n/a
319 49 193 29
n/a
237 57 140 21
n/a
Female 280 53 176 29 280 53 176 30 264 59 132 23
Econ Disadv 299 46 189 25 399 46 189 27 270 51 148 24
Non-econ Disadv 300 55 180 34 300 55 180 * 231 66 122 20
English Learner 99 14 86 15 99 14 86 9 66 21 97 19
GATE 113 95 32 91 113 95 32 71 102 90 9 *
African-Amer. 25 44 12 25 25 44 12 * 18 39 11 27
Filipino 19 79 4 19 79 4 * 15 80 6 *
Hispanic 449 47 288 29 449 47 288 27 400 55 230 20
White 86 63 54 36 86 63 54 35 56 75 23 35
Stud.
w/disabilities 58 7 61 11 58 7 62 9 14 36 67 1
Std. w/no disabil. 541 55 307 33 541 55 307 35 487 59 205 28

Hilltop Middle School 2010-2011
27
California Standards Test (CST) SCORES - The CSTs for English–language arts, mathematics, science,
and history–social science are administered only to students in California public schools. Except for a writing component that
is administered as part of the grade seven English–language arts tests, all questions are multiple-choice. These tests were
developed specifically to assess students' knowledge of the California content standards. Student scores are reported as
performance level.*Granger Jr.
Math - Algebra I
2010 State Report – All Students (CDE California Standardized Testing and Reporting -STAR)
GRADE Students
Tested
%
Advanced
%
Proficient
%
Basic
% Below
Basic
%
Far Below
Basic
07 31,487 50 35 11 4 1
08 274,229 16 30 24 22 7
*09 269,697 3 19 26 36 16 The Categorical Office will provide state and district scores.
2010 District Report – All Students (CDE California Standardized Testing and Reporting -STAR)
GRADE Students
Tested
%
Advanced
%
Proficient
%
Basic
% Below
Basic
%
Far Below
Basic
07 130 53 37 8 2 0
08 3,220 15 43 27 12 2
*09 3,126 3 27 35 27 7
No Feeder School Report added here.
2010 School Reporting Clusters – Algebra I – All Students Number Properties,
Operations, Linear
Equations
Graphing & Systems of
Linear Equations Quadratics & Polynomials
Functions & Rationale
Expressions
# Possible Mean % Correct
# Possible Mean % Correct
# Possible Mean % Correct
# Possible Mean % Correct
Grade 07 17 81 14 62 21 68 13 47
Grade 08 17
68
14
50
21
55
13
39
The CST Summary list (STAR) testing, spring 2010

Hilltop Middle School 2010-2011
28
California Standards Test (CST) SCORES
ALL Students
Table 1. CST – Algebra I, Reported by Percentages - Student scores are reported as performance levels.
The five performance levels are Advanced (exceeds state standards); Proficient (meets state standards); Basic (approaching
state standards); Below Basic (below state standards); and Far Below Basic (well below state standards). Students scoring at
the Proficient or Advanced level meet state standards in that content area. (Adjust reporting years to show available data for
most current three-year trend).
Grade Year
(# tested) Advanced Proficient Basic Below Basic
Far Below
Basic
07
2008 (5) * * * * *
2009 (8) * * * * *
2010 (13) 23 38 23 15 0
08
2008 (303) 5 38 42 14 1
2009 (290) 4 38 35 19 4
2010 (323) 3 37 37 20 2
SUBGROUPS
Table 2. CST – Algebra I, Reported as Percent Proficient and Above Data reported are the number of students tested and the percent of students achieving at the proficient or advanced level
(meeting or exceeding the state standards). (Adjust reporting years to show available data for most current three-year trend).
Subgroups
2008 2009 2010
# of Students Tested/% Prof. & Above
# of Students Tested/% Prof. & Above
# of Students Tested/% Prof. & Above
07 08 *09 07 08 *09 07 08 *09
# % # % # % # % # % # % # % # %
Male 1 * 170 44
n/a
4 * 131 47
n/a
9 0 154 41
n/a
Female 4 * 133 41 4 * 154 38 4 0 169 40
Econ Disadv 0 128 40 1 * 138 37 8 0 412 36
Non-econ
Disadv 5 * 175 45 7 * 152 47 5 0 181 44
English Learner 0 15 * 0 11 9 1 0 13 15
GATE 5 * 88 65 6 * 100 70 7 0 97 68
African-Amer. 0 7 * 0 7 * 0 0 6 0
Filipino 0 4 * 1 * 11 64 0 0 16 50
Hispanic 3 * 220 40 5 * 215 38 9 0 249 38
White 2 * 57 53 0 47 51 4 0 38 47
Stud.
w/disabilities 0 5 * 0 2 * 0 0 8 0
Std. w/no
disabil. 5 * 298 44 8 * 288 43 13 62 315 41

Hilltop Middle School 2010-2011
29
Middle School
California Physical Fitness Report Summary of Expectations: The Fitnessgram, developed by the Cooper Institute for Aerobics Research,
assesses six major health-related areas of physical fitness including aerobic capacity (cardiovascular endurance), body composition
(percentage of body fat), abdominal strength and endurance, trunk strength and flexibility, upper body strength and endurance, and overall
flexibility. A score of 6 indicates that a student is in the healthy fitness zone in all six performance areas, and meets standards to be
considered physically fit. Information can be found at the Standards and Assessment Division's California Physical Fitness Test site.
Grade 7
SCHOOL #
ACHIEVED
2004-2005 2005-2006 2006-2007 2007-2008 2008-2009
# % # % # % # % # %
Total
District
6 of 6
5 of 6
4 of 6
3 of 6
2 of 6
1 of 6
0 of 6
1,746
1,624
1,246
858
531
273
68
28.4
26.4
20.3
13.9
8.6
4.4
1.1
1,897
1,539
1,199
774
486
218
38
30.8
25.0
19.5
12.6
7.9
3.5
0.6
1,896
1,543
1,195
772
452
173
40
31.2
25.4
19.7
12.7
7.4
2.8
0.7
2,014
1,610
1,113
720
450
199
98
32.5
26.0
17.9
11.6
7.3
3.2
1.6
2339
1696
1004
633
325
138
38
37.9
27.5
16.3
10.3
5.3
2.2
36
2008-2009 Physical Fitness test results posted at http://www.cde.ca.gov/ta/tg/pf/pftresults.asp
Grade 7
SCHOOL #
ACHIEVED
2005-2006 2006-2007 2007-2008 2008-2009 2009-2010
# % # % # % # % # %
Hilltop
Middle
6 of 6
5 of 6
4 of 6
3 of 6
2 of 6
1 of 6
0 of 6
287
170
86
58
28
9
1
44.9
26.6
13.5
9.0
4.4
1.4
0.2
259
205
118
70
24
2
0
38.2
30.2
17.4
10.3
3.5
0.3
0
175
170
138
81
34
19
11
27.9
27.1
22.0
12.9
5.4
3.0
1.8
201
163
114
71
27
10
0
34.3
27.8
19.5
12.1
4.6
1.7
0
249
163
80
54
9
3
6
44.1
28.9
14.1
9.5
1.5
0.5
1.0

30
API Academic Performance Index
State of California Accountability System – this
is a “growth” system.
Applies to:
All schools, except ASAM schools only
get an API score for federal accountability and
do not get growth targets or rankings
Based on:
CST scores in ELA, Math,
History/Soc. Sci., Science. Improving
scores of lower achieving students earns
a higher score.
CMA/CAPA
CAHSEE pass rate (>350)–
o (10th
/11th
/12th
grade)
Goal – API of 800 or above (on a scale of 200-
1000); or growth of 5% of the difference
between the school score and 800 each year.
Sanctions:
Reported in media
Ineligible to apply for state award $ /
Disting. Schools
State Monitoring: SAIT – School
Assistance and Intervention Team (not
currently funded)
AYP Adequate Yearly Progress
Federal Accountability System – this is a
criteria based system.
Applies to:
All schools, but sanctions are for Title 1
funded schools only
Based on:
CST proficiency rate (ms) ELA/Math
CAHSEE proficiency rate ELA/Math,
(>380), (hs-10th
grade only)
CMA/CAPA
Participation rate on testing
API
Graduation rate (hs only)
Goals –
ELA % proficient – 66.7% (hs) or
67.6% (ms)
Math % proficient - 66.1% (hs) or
68.5% (ms)
Participation - 95%
API – 710 or show growth
Grad. Rate – 83.3%
Sanctions:
Reported in media
Program Improvement Designation
(PI) with penalties that increase after
each year in PI

31
Common acronyms used by the California Department of Education (Updated 9-18)
ACRONYM STANDS FOR WEB ADDRESS
Acc Accelerated Instruction http://www.cde.ca.gov/sp/g/
ADA Average Daily Attendance http://www.cde.ca.gov/ds/fd/ec/
AMAOs Annual Measurable Achievement Objectives http://www.cde.ca.gov/sp/el/t3/acct.asp
AP Advanced Placement http://www.cde.ca.gov/sp/g/
API Academic Performance Index http://www.cde.ca.gov/ta/ac/ap
APS Academic Program Survey http://www.cde.ca.gov/ta/lp/vl/improvtools.asp#aps
APR Accountability Progress Report http://www.cde.ca.gov/ta/ac/ar/
ASDEG Association of San Diego Educators of the Gifted http://www.asdeg.org
ASES After School Education and Safety Plan http://www.cde.ca.gov/fg/fo/profile.asp?id=1403
AST Academic Support Team
AVID Advancement Via Individual Determination http://www.cde.ca.gov/ci/gs/ps/avidgen.asp
AYP Adequate Yearly Progress http://www.cde.ca.gov/ds/sp/ay/
BTSA Beginning Teacher Support Program http://www.cde.ca.gov/fg/fo/profile.asp?id=523
CAG California Association for the Gifted http://www.cagifted.org
CAHSEE California High School Exit Examination http://www.cde.ca.gov/ta/tg/hs/
CAPA California Alternate Performance Assessment http://www.cde.ca.gov/ta/tg/sr/capa.asp
CBEDS California Basic Educational Data System http://www.cde.ca.gov/ds/ss/cb
CDE California Department of Education http://www.cde.ca.gov
CELDT California English Language Development Test http://www.cde.ca.gov/ta/tg/el
CIS Coordinated Intervention Services
CMA California Modified Assessment http://www.cde.ca.gov/ta/tg/sr/cmastar.asp
COE County Office of Education http://www.cde.ca.gov/re/sd/co/index.asp
CogAT Cognitive Abilities Test http://www.riverpub.com
CPM Categorical Program Monitoring http://www.cde.ca.gov/ta/cr/cc
CST California Standards Testing http://www.cde.ca.gov/ta/tg/sr/cstsciref.asp
DAC District Advisory Council – Title 1 / SCE
DAC GATE District Advisory Council – Gifted and Talented
Education
http://www.suhsd.k12.ca.us
DAS District Assistance Survey http://www.cde.ca.gov/ta/lp/vl/documents/distassistsrvy
1.doc

32
DELAC District English Learners Advisory Council
DSLT District/School Liason Team
DTAT District Technical Assistance Team
EL English Learner http://www.cde.ca.gov/ta/cr/el
ELA English Language Acquisition http://www.cde.ca.gov/sp/el/ii
ELAP English Language Acquisition Program http://www.cde.ca.gov/fg/aa/ca/englishlang.asp
ELD English Language Development http://www.cde.ca.gov/ta/cr/el
ESLRs Expected Schoolwide Learning Results http://www.acswasc.org/process_ca_comprehensive.htm
FEP Fluent-English-Proficient http://www.cde.ca.gov/demographics
FTE Full-Time-Equivalent http://data1.cde.ca.gov/dataquest/gls_fte.htm
GATE Gifted and Talented Education http://www.cde.ca.gov/sp/g/
GEAR-UP Gaining Early Awareness and Readiness for
Undergraduate Programs http://www.ed.gov/programs/gearup/index.html
HPSGP High Priority Schools Grant Program http://www.cde.ca.gov/ta/lp/hp/
IB International Baccalaureate http://www.cde.ca.gov/sp/g/
IEP Individualized Education Program http://www.calstat.org/iep/
ISS Instructional Support Services
LC Language Census http://www.cde.ca.gov/ds/ss/lc
LD Learning Disabled
LEA Local Educational Agency http://www.cde.ca.gov/re/sd
LEP Limited English Proficient
ESEA/NCLB No Child Left Behind http://www.cde.ca.gov/pr/ESEA/NCLB
NAG National Association of the Gifted http://www.nagc.org
PI Program Improvement http://www.cde.ca.gov/ta/ac/ti/programimprov.asp
OLA Office of Language Aquisition
PLC Professional Learning Communities http://www.cde.ca.gov/ta/lp/vl/dshsbpplc.asp
PSAA Public Schools Accountability Act http://www.cde.ca.gov/psaa
PTA Parent Teacher Association http://www.pta.org
R-FEP Redesignated Fluent-English-Proficient http://www.cde.ca.gov/ds/sd/lc/
QEIA Quality Education Investment Act http://www.cde.ca.gov/ta/lp/qe/
RtI Response to Intervention http://www.cde.ca.gov/sp/se/sr/documents/sldeligibltyrti
2.pdf

33
SABE/2 Spanish Assessment of Basic Education http://www.cde.ca.gov/ta/tg/sr
SARC School Accountability Report Card http://www.cde.ca.gov/ta/ac/saa
SBCP School-Based Coordinated Programs
SDCOE San Diego County Office of Education http://www.sdcoe.net/
SEA State Education Agency http://www.cde.ca.gov
SES Supplemental Educational Services
(ESEA/NCLB) http://www.cde.ca.gov/ta/ac/ti/supplemental.asp
SLC Smaller Learning Community http://www.cde.ca.gov/ta/lp/vl/dshsbpslc.asp
SOS Systems of Support http://www.cde.ca.gov/sp/sw/ss/
SSC School Site Council http://www.cde.ca.gov/ESEA/NCLB/sr/le/documents/spsaguid
e.doc
SPSA Single Plan for Student Achievement http://www.cde.ca.gov/ESEA/NCLB/sr/le/documents/spsaguid
e.doc
STAR Standardized Testing and Reporting http://www.cde.ca.gov/ta/tg/sr
TOSA Teacher on Special Assignment
STS Standard-based Test in Spanish
UCP Uniform Complaint Procedures http://www.cde.ca.gov/re/cp/uc
WASC Western Association of Schools and Colleges http://www.acswasc.org