Embed Size (px)
DESCRIPTION
Highways and Sprawl in North Carolina. David T. Hartgen Professor of Transportation Studies UNC Charlotte [email protected] A Report for the John Locke Foundation Raleigh, North Carolina www.johnlocke.org September 24, 2003. Do Roads Cause Sprawl?. - PowerPoint PPT Presentation
Citation preview

Highways and Sprawl in North Carolina
David T. HartgenProfessor of Transportation Studies
A Report for the
John Locke FoundationRaleigh, North Carolina
www.johnlocke.org
September 24, 2003

Do Roads Cause Sprawl? • Road Improvements may lead or follow growth.
• Growth depends on many factors, including roads.
• Growth and roads often occur together.
• In other cases, growth is occurring without road improvements

• Goal Locate population
growth and all major road improvements, 1990-2000
Determine correlation between population growth, road investments, and other factors
Urban and Rural Areas, All 1551 Tracts
Highways and Sprawl in North Carolina

• 100 NC Counties Trends in Population, Employment,
Commuting. 12 “Commuting Regions”
• 17 NC Urbanized Areas Trends in Population Density, Traffic,
Congestion.• 1551 NC Tracts
Road Investments, Demographics, Density. Data from TIPs, 1990 and 2000 Census. Statistical models of growth. Rural and urban analysis.
Method of Analysis

County Population Change, 1990-2000
•Growth Throughout NC
•97 of 100 Counties increased
•Strong Growth in many Suburban, rural and urban counties
•Interstate access varies

•Generally,more traffic in larger cities
•28 % Growth
•Most traffic lower than US averages
•Charlotte, Gastonia, Concord have the highest traffic/lane
Freeway Traffic Per Lane, 1990-2001

NC Commuting, 2000 Census
•12 Regions, based on commuting in 2000
• Work travel is about 25 % of all travel
•Cross-county work travel is 61% of work travel

Population Growth and Major Road Projects, 1990-2000
•Tract growth throughout NC
•Suburban, Urban, Rural
•Ave growth: 972 (21%)
• 312 Major Road Projects
• New: 111 Projects, $ 3.1 B
• Widenings: 201 Projects, $3.1 B
•1558 Miles, $6.2 B

•327 tracts, 69 road projects
•Ave growth: 1099 (27%)
•Fastest growth in suburban tracts
•Growth correlation 0.23
• Key: prior density
•Secondary factors:
•Income
•Distance to City Center
Road Effects:
•Urban Widening: + 525 persons, per mile (13 %)
•New 4-Lane Arterial: 456/mile (11 %)

Charlotte Region-West
•Growth lower and more dispersed
•Weak link to road projects or prior Interstates
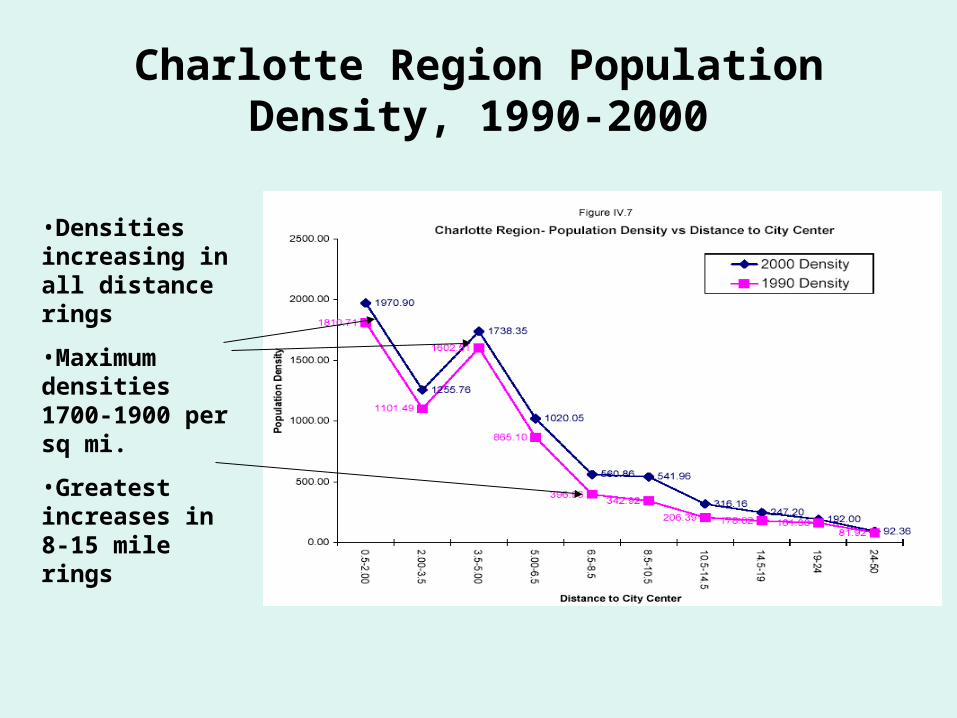
Charlotte Region Population Density, 1990-2000
•Densities increasing in all distance rings
•Maximum densities 1700-1900 per sq mi.
•Greatest increases in 8-15 mile rings

Triangle Region •259 tracts, 41 road projects
•Ave growth: 1513 (36%)
•Fastest growth in suburban Wake and nearby
•Less growth in denser inner tracts
•Growth Model Correlation 0.22
•Key: prior density
•Secondary: Distance to City Center

•Road Effects on Growth
•Widen Freeway to 8 lanes: - 1130 / mile (-28%)
•New Freeway: +354 / mile (8%)
•Densities rising throughout, including inner rings

Triad Region•323 tracts, 57 road projects
•Ave growth: 709 (17%)
•Growth more dispersed, fastest in suburban rings
•Densities rising, but less rapidly

Triad Region
•Correlation: 0.22
•Key: Prior Density
•Secondary: Dist to Interstates
Road Effects: Widened Urban Arterial: +237 / mile (6%)
New Freeway Exit: + 4845 / mile (136%)

Asheville Region
•87 tracts, 21 road projects
•Ave growth: 792 (20%)
•Dispersed thru region
•Correlation: 0.45
•Key: Prior Density
•Secondary: Distance to Interstate
Road Effects: Urban Widening: +107/mile (2.7%)
Rural Widening: + 553/mile (14%)
New Freeway: + 86/mile (2.2%)
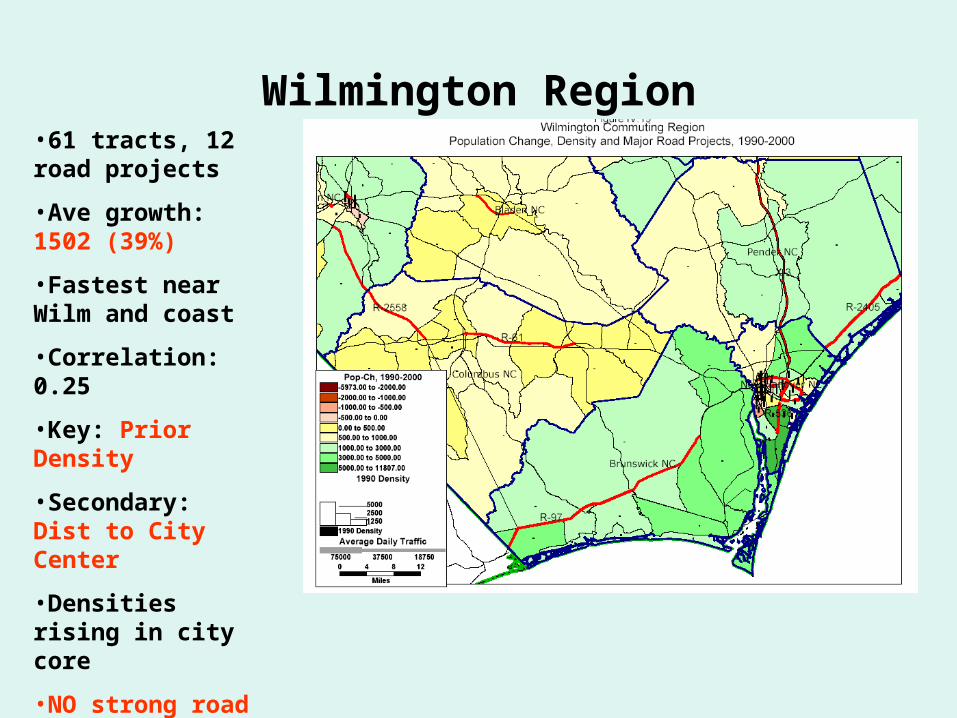
Wilmington Region•61 tracts, 12 road projects
•Ave growth: 1502 (39%)
•Fastest near Wilm and coast
•Correlation: 0.25
•Key: Prior Density
•Secondary: Dist to City Center
•Densities rising in city core
•NO strong road effects

Fayetteville Region
•126 tracts, 38 road projects
•Ave growth: 722 (15%)
•Dispersed, but fastest north and east of Fayetteville
•Military reductions
•Correlation: 0.11
•Key: Prior Density
•Secondary: Distance to City Center
Road Effects: Rural Widenings: +207 pop/mile (3.6%)

Jacksonville Region•55 Tracts, 5 Road Projects
•Ave Growth: 1137 ( 25 %)
•Fastest near Coast
•Military Impacts
•Correlation: 0.20
•Key: Distance to Coast
•Road Effect:
•Widen Rural Arterial : + 193/mile

Greenville-Rocky Mount Region
•157 tracts, 35 road projects
•Ave growth: 495 (11%)
•Very dispersed growth, some declines
•Correlation: 0.16
•Key factors:
•Prior income
•Pct Non-white population
•NO Road Effects

Eastern North Carolina Region
•27 Tracts, 11 Road Projects
•Ave Growth: 1499 (46%)
•Fastest near coast
•Correlation: 0.34
•Key Factor: Prior Density
•Secondary:
•Distance to Coast
•Road Effects;
•Widen Rural Arterial: + 51/mile (1.5%)
•Widen Urban Arterial + 144/mile ( 3.2%)

Hickory-Morganton Region
•77 Tracts, 13 Road projects
•Ave Growth: 726 (17%)
•Faster along I-40
•Correlation: 0.07
•Key Factor: Prior Density
•Secondary: Dist To Interstate
•NO Road Effects

Boone-Spruce Pine Region
•22 Tracts, 4 Road Projects
•Ave Growth: 530 (15%)
•Fastest near Parkway
•Correlation: 0.45
•Key Factor: Dist to Parkway
•Road Effects:
•Widen Rural Arterial: + 123/mile (3.3%)

Western NC Region•30 tracts, 6 road projects
•Ave growth: 694 (21%)
•Dispersed growth, no urban focus.
•Correlation: 0.11
•Key: Distance to Parkway
•Road Effects: Rural Widening: + 78/mile (2.1%)

Summary
• Local Factors largely determine growth– Zoning and density caps– Community economy and attitude– Taxes and schools– Utilities
• Key is prior density: – growth goes where there is room for it– Region grows outward if it can’t grow upward– Zoning determines permissible growth, pushes growth
outward
• Secondary factors: – Distance to City Center, Income

Most Growth is NOT Road-Related
•50 % of growth was in tracts with NO ROAD PROJECTS
•Only 23 % of growth was in tracts that had Road Widenings
•61 % of Tracts had NO Major Projects during the 1990s

Road Effects on Growth Rates• 2-14 percent points, per decade, per mile.
– Rural Widenings: 1.5 % (Eastern NC) to 13.9 % (Asheville)– Urban widenings: 2.7 % (Asheville) to 12.8 % (Charlotte)– New Arterial 10.9 % (Charlotte)– Widen Frwy to 8 L - 28.1 % (Raleigh)– New Freeway 2.2 % (Asheville) to 8.4 % (Raleigh)– New Freeway Exit 0 (11 regions) to 120 % (Triad)
• Maximum traffic impact: a small McDonald’s• At Maximum, About 15% of Added Capacity
• Generally minor, compared to background growth and other effects

Policy Implications
• Determinants of growth are largely local.• Local governments have the lead in directing growth.• Prior Density is the key: Near cities, growth goes where there is
room for it.– Density caps push growth outward.
• Road improvements have minor effects on growth– Generally 2-14% percent points per decade
– At maximum: a small fast-food restaurant.
• Transportation Improvements are generally blunt, inefficient means of spurring or slowing growth– Make such actions to improve mobility or access, not to influence
growth.
– Select projects on the basis of impact on traffic.