Embed Size (px)
Citation preview

Highway‐Rail
Grade Crossing Safety
Action Plan
Florida Department of Transportation
August 26, 2011
Florida’s Highway‐Rail Grade Crossing Safety Action Plan Page i
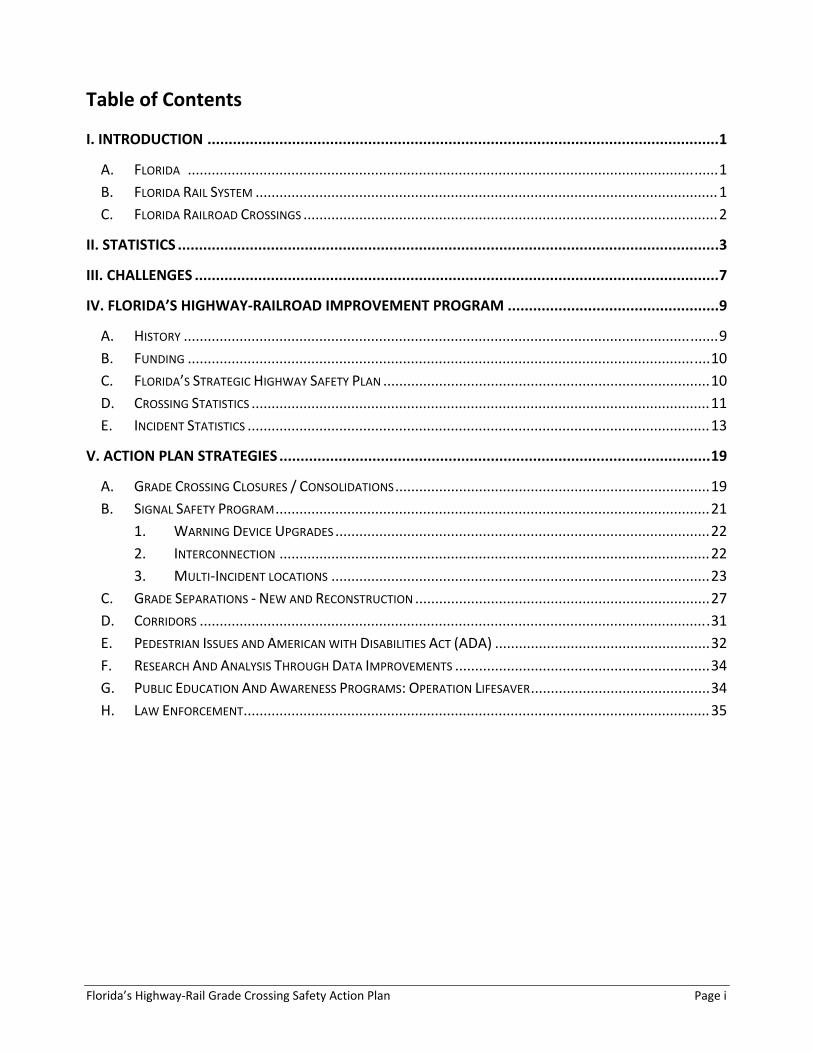
Table of Contents
I. INTRODUCTION ......................................................................................................................... 1
A. FLORIDA ..................................................................................................................................... 1
B. FLORIDA RAIL SYSTEM .................................................................................................................... 1
C. FLORIDA RAILROAD CROSSINGS ........................................................................................................ 2
II. STATISTICS ................................................................................................................................ 3
III. CHALLENGES ............................................................................................................................ 7
IV. FLORIDA’S HIGHWAY‐RAILROAD IMPROVEMENT PROGRAM .................................................. 9
A. HISTORY ...................................................................................................................................... 9
B. FUNDING ................................................................................................................................... 10
C. FLORIDA’S STRATEGIC HIGHWAY SAFETY PLAN .................................................................................. 10
D. CROSSING STATISTICS ................................................................................................................... 11
E. INCIDENT STATISTICS .................................................................................................................... 13
V. ACTION PLAN STRATEGIES ...................................................................................................... 19
A. GRADE CROSSING CLOSURES / CONSOLIDATIONS ............................................................................... 19
B. SIGNAL SAFETY PROGRAM ............................................................................................................. 21
1. WARNING DEVICE UPGRADES .............................................................................................. 22
2. INTERCONNECTION ............................................................................................................ 22
3. MULTI‐INCIDENT LOCATIONS ............................................................................................... 23
C. GRADE SEPARATIONS ‐ NEW AND RECONSTRUCTION .......................................................................... 27
D. CORRIDORS ................................................................................................................................ 31
E. PEDESTRIAN ISSUES AND AMERICAN WITH DISABILITIES ACT (ADA) ...................................................... 32
F. RESEARCH AND ANALYSIS THROUGH DATA IMPROVEMENTS ................................................................ 34
G. PUBLIC EDUCATION AND AWARENESS PROGRAMS: OPERATION LIFESAVER ............................................. 34
H. LAW ENFORCEMENT ..................................................................................................................... 35
Florida’s Highway‐Rail Grade Crossing Safety Action Plan Page ii
List of Figures
FIGURE 1. UNITED STATES OF AMERICA HIGHWAY‐RAIL GRADE CROSSING STATISTICS ............................................ 3
FIGURE 2. FLORIDA HIGHWAY‐RAIL GRADE CROSSING STATISTICS ....................................................................... 4
FIGURE 3. UNITED STATES OF AMERICA RAILROAD TRESPASS STATISTICS .............................................................. 5
FIGURE 4. FLORIDA TRESPASS STATISTICS ....................................................................................................... 6
FIGURE 5. POPULATION DENSITY BY COUNTY MAP, 2009; SOURCE: BEBR, POPULATION ESTIMATES 2009 .............. 7
FIGURE 6. FLORIDA INCIDENTS BY COUNTY (JANUARY 2005 TO DECEMBER 2009); SOURCE: FEDERAL RAILROAD
ADMINISTRATION ...................................................................................................................................... 8
FIGURE 7. HIGHWAY‐RAIL GRADE CROSSING LOCATIONS, 2011 ...................................................................... 12
FIGURE 8. PERCENTAGE OF INCIDENTS AT CROSSINGS WITH ACTIVE WARNING DEVICES ........................................ 18

Florida’s Highway‐Rail Grade Crossing Safety Action Plan Page iii
List of Tables
TABLE 1. FLORIDA HIGHWAY‐RAIL CROSSINGS6 ............................................................................................. 12
TABLE 2. FLORIDA CROSSING INCIDENTS ‐ PUBLIC AND PRIVATE CROSSINGS ........................................................ 13
TABLE 3. TYPE OF CROSSING – ALL INCIDENTS (FLORIDA, 2005 TO 2009) ......................................................... 14
TABLE 4. TYPE OF INCIDENT – ALL INCIDENTS (FLORIDA, 2005 TO 2009) .......................................................... 14
TABLE 5. TYPE OF WARNING DEVICE AT CROSSING – ALL INCIDENTS (FLORIDA, 2005 TO 2009) ........................... 15
TABLE 6. TYPE OF CROSSING – MULTI‐INCIDENT LOCATIONS (FLORIDA, 2005 TO 2009) ...................................... 16
TABLE 7. TYPE OF INCIDENT – MULTI‐INCIDENT LOCATIONS (FLORIDA, 2005 TO 2009) ....................................... 16
TABLE 8. TYPE OF WARNING DEVICE AT CROSSING – MULTI‐INCIDENT LOCATIONS (FLORIDA, 2005 TO 2009) ........ 17
TABLE 9. TYPE OF AREA – MULTI‐INCIDENT LOCATIONS (FLORIDA, 2005 TO 2009) ............................................ 17
TABLE 10. FLORIDA CROSSING CLOSURES (2002 ‐ 2011) ............................................................................... 19
TABLE 11. MULTI‐INCIDENT LOCATIONS EVALUATED FOR REMEDIAL MEASURES ................................................. 23
TABLE 12. RAILROAD CROSSINGS WITH MULTIPLE COLLISIONS ‐ REMEDIAL MEASURES FOR GIVEN DRIVER
CONTRIBUTING CAUSES ............................................................................................................................ 25
TABLE 13. RAILROAD CROSSINGS WITH MULTIPLE COLLISIONS ‐ REMEDIAL MEASURES FOR GIVEN PHYSICAL
CONTRIBUTING CAUSES ............................................................................................................................ 26
TABLE 14. GRADE SEPARATION PROJECTS (2005 TO 2011) ............................................................................ 27
TABLE 15. GRADE SEPARATION PROJECTS (MID‐TERM) .................................................................................. 28
TABLE 16. GRADE SEPARATION PROJECTS (MID‐TO‐LONG TERM) .................................................................... 29
TABLE 17. GRADE SEPARATION PROJECTS (LONG TERM) ................................................................................. 29
TABLE 18. GRADE SEPARATION PROJECTS (TO BE DETERMINED TERM) .............................................................. 31
TABLE 19. LIST OF RECENT CORRIDOR REVIEWS ............................................................................................ 31
TABLE 20. LIST OF POTENTIAL CORRIDOR PROJECTS ....................................................................................... 32

Florida’s Highway‐Rail Grade Crossing Safety Action Plan Page 1
I. INTRODUCTION It is the goal of the State of Florida to carry out a highway‐rail safety program that promotes a
safe, economical and efficient transportation system in the public interest. This goal is
accomplished through the cooperation of the Florida Department of Transportation (FDOT) and
our transportation partners. These efforts include furthering rail safety education, enforcement
and engineering in compliance with all applicable state laws, federal laws, and current practices.
The size of the rail safety challenge in Florida is underscored by noting:
A. Florida 1 2
Florida, now the fourth most populous state, has grown steadily throughout the past
several decades with a 2009 population of over 18.5 million people.
Throughout the 1990’s, Florida’s population grew at an average rate of 2.2 percent
annually, while growth rates from 2000 to 2009 averaged 1.8 percent annually.
From 2000 to 2009, Florida was estimated to have added 316,900 new residents annually.
Forecasts of population from the Bureau of Economic and Business Research (BEBR) at the
University of Florida indicate that Florida is expected to reach over 25.1 million people by
2035, an increase of 57 percent from 2000.
For 2003 to 2006, the Center for Urban Transportation Research estimated that Florida’s
visitors account for about 8.0 to 8.4 percent of all vehicle travel in the state.
The estimated annual number of visits to Florida by non‐state residents increased from
73.8 million in 2002 to 83.8 million in 2006. This is an increase of about 14 percent during
this 5‐year period. In 2009, total visitors dropped to 80.9 million; however, 2010 statistics
show that numbers are rebounding with a total of 82.3 million visitors.3
B. Florida Rail System4
The Florida rail system is comprised of 2,786 miles of track routes owned by 15 line‐haul
railroads and terminal or switching companies, as well as 81 miles owned by the State of
Florida.
Florida’s Highway‐Rail Grade Crossing Safety Action Plan Page 2
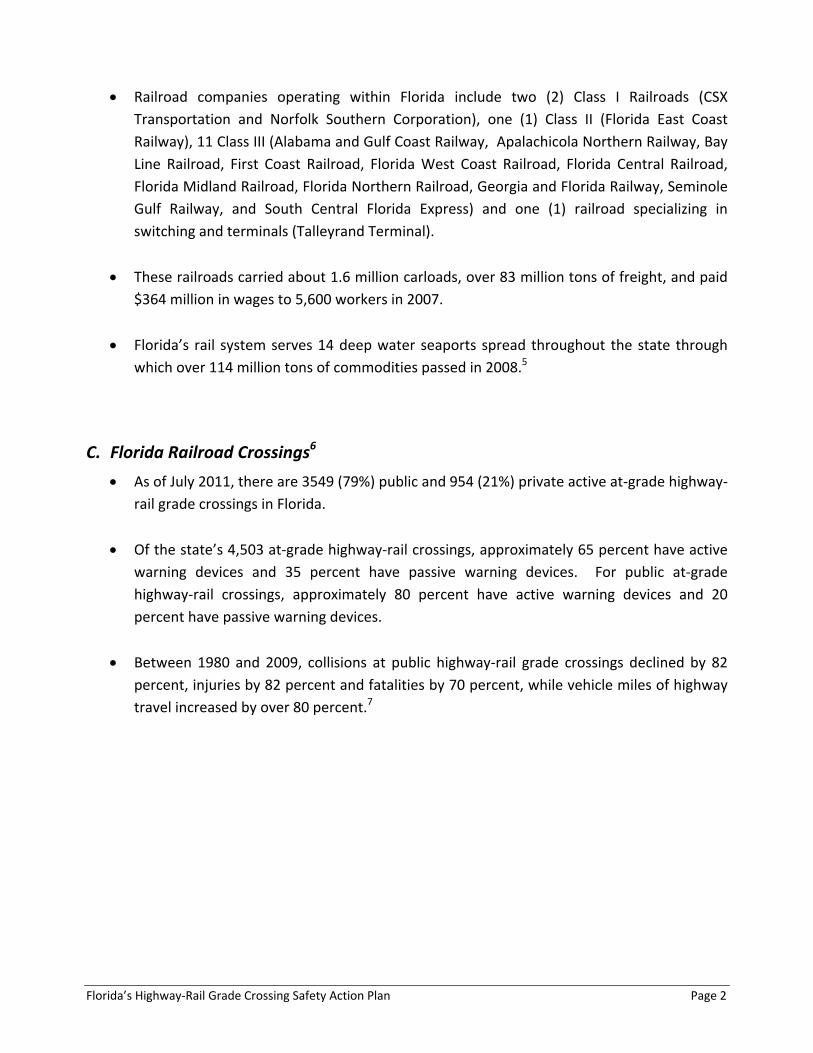
Railroad companies operating within Florida include two (2) Class I Railroads (CSX
Transportation and Norfolk Southern Corporation), one (1) Class II (Florida East Coast
Railway), 11 Class III (Alabama and Gulf Coast Railway, Apalachicola Northern Railway, Bay
Line Railroad, First Coast Railroad, Florida West Coast Railroad, Florida Central Railroad,
Florida Midland Railroad, Florida Northern Railroad, Georgia and Florida Railway, Seminole
Gulf Railway, and South Central Florida Express) and one (1) railroad specializing in
switching and terminals (Talleyrand Terminal).
These railroads carried about 1.6 million carloads, over 83 million tons of freight, and paid
$364 million in wages to 5,600 workers in 2007.
Florida’s rail system serves 14 deep water seaports spread throughout the state through
which over 114 million tons of commodities passed in 2008.5
C. Florida Railroad Crossings6
As of July 2011, there are 3549 (79%) public and 954 (21%) private active at‐grade highway‐
rail grade crossings in Florida.
Of the state’s 4,503 at‐grade highway‐rail crossings, approximately 65 percent have active
warning devices and 35 percent have passive warning devices. For public at‐grade
highway‐rail crossings, approximately 80 percent have active warning devices and 20
percent have passive warning devices.
Between 1980 and 2009, collisions at public highway‐rail grade crossings declined by 82
percent, injuries by 82 percent and fatalities by 70 percent, while vehicle miles of highway
travel increased by over 80 percent.7
Florida’s Highway‐Rail Grade Crossing Safety Action Plan Page 3
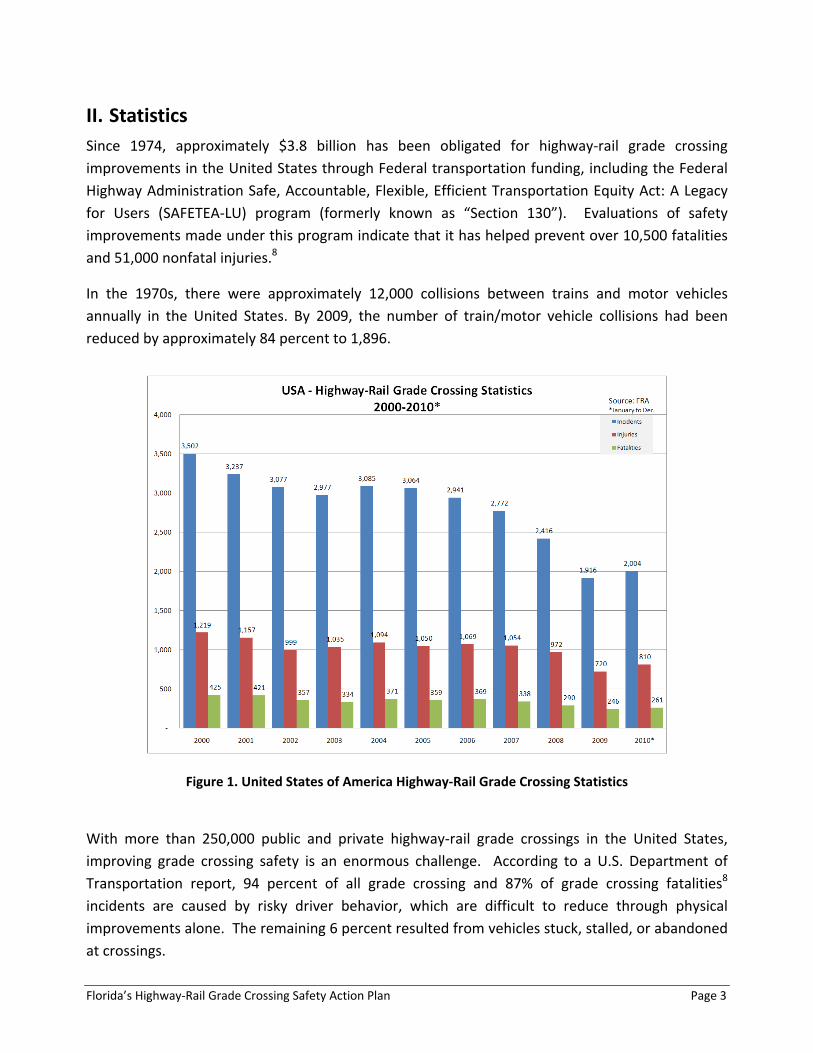
II. Statistics Since 1974, approximately $3.8 billion has been obligated for highway‐rail grade crossing
improvements in the United States through Federal transportation funding, including the Federal
Highway Administration Safe, Accountable, Flexible, Efficient Transportation Equity Act: A Legacy
for Users (SAFETEA‐LU) program (formerly known as “Section 130”). Evaluations of safety
improvements made under this program indicate that it has helped prevent over 10,500 fatalities
and 51,000 nonfatal injuries.8
In the 1970s, there were approximately 12,000 collisions between trains and motor vehicles
annually in the United States. By 2009, the number of train/motor vehicle collisions had been
reduced by approximately 84 percent to 1,896.
Figure 1. United States of America Highway‐Rail Grade Crossing Statistics
With more than 250,000 public and private highway‐rail grade crossings in the United States,
improving grade crossing safety is an enormous challenge. According to a U.S. Department of
Transportation report, 94 percent of all grade crossing and 87% of grade crossing fatalities8
incidents are caused by risky driver behavior, which are difficult to reduce through physical
improvements alone. The remaining 6 percent resulted from vehicles stuck, stalled, or abandoned
at crossings.

Florida’s Highway‐Rail Grade Crossing Safety Action Plan Page 4
According to Florida Statutes 335.141 Regulation of public railroad‐highway grade crossings;
reduction of hazards – the Florida Department of Transportation has regulatory authority over all
public railroad‐highway grade crossings in the state, including the authority to issue permits which
are required prior to the opening and closing of such crossings.9 The Department, in cooperation
with railroad companies operating in the state, develops and adopts a program for the
expenditure of funds available for the implementation of remedial projects for the reduction of
the hazards at public railroad‐highway grade crossings.
From 2000 to 2007, Florida’s crossing incidents held relatively steady with around 100 incidents
per year and fatalities ranging from 10 to 25 annually. Beginning in 2008, the number of incidents
significantly decreased. The direct cause of this decrease can be attributed to many factors
including: improved crossing warning devices, increased outreach and education, safer driving
behavior, and changes in travel trends. During 2007 and 2008, fuel prices increased dramatically,
which has contributed to declining annual total miles traveled in Florida since 2007. It will take
several years to fully understand the adjustments in travel behavior related to travel costs
increases and the impact of safety improvements to highway‐rail grade crossings safety in Florida.
Figure 2. Florida Highway‐Rail Grade Crossing Statistics
Since 1973, the Florida Department of Transportation has worked to reduce incidents at highway‐
rail grade crossings. The Florida Department of Transportation has developed the Strategic
Florida’s Highway‐Rail Grade Crossing Safety Action Plan Page 5
Highway Safety Plan (SHSP) to focus funding and other resources strategically on those problem
areas where the opportunity for improvement is greatest, measured by reductions in fatalities and
serious injuries. Improving the safety of Florida’s surface transportation system for residents and
visitors is the unifying goal of Florida’s safety community and the overarching goal of SHSP. The
SHSP identifies strategic safety priorities in both public and private agencies and organizations at
the national, state, regional, and local levels.
Results of the SHSP, revealed in Figure 2, show that highway/rail crossing incidents have reduced
from a three year average of 110 per year prior to 2007 to a three year average of 64 per year
after 2007, a 42% reduction. Although, the number of collisions at highway‐rail grade crossings in
Florida has dropped significantly, too many collisions and fatalities still occur.
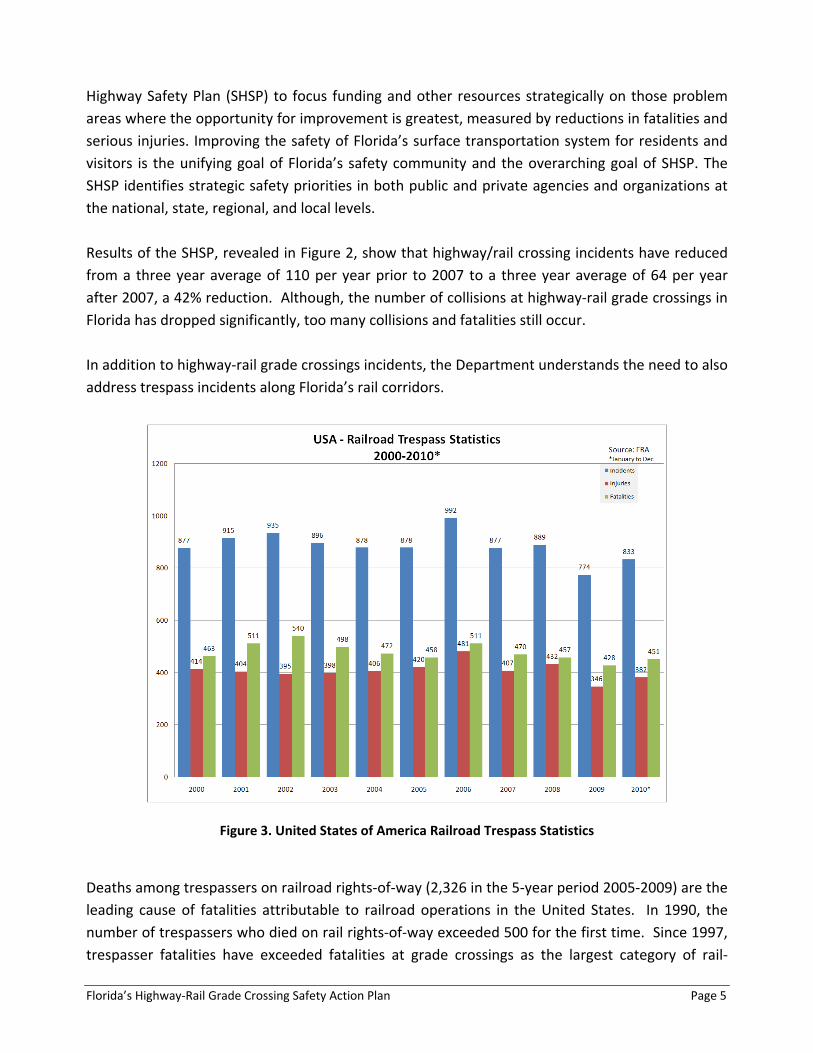
In addition to highway‐rail grade crossings incidents, the Department understands the need to also
address trespass incidents along Florida’s rail corridors.
Figure 3. United States of America Railroad Trespass Statistics
Deaths among trespassers on railroad rights‐of‐way (2,326 in the 5‐year period 2005‐2009) are the
leading cause of fatalities attributable to railroad operations in the United States. In 1990, the
number of trespassers who died on rail rights‐of‐way exceeded 500 for the first time. Since 1997,
trespasser fatalities have exceeded fatalities at grade crossings as the largest category of rail‐
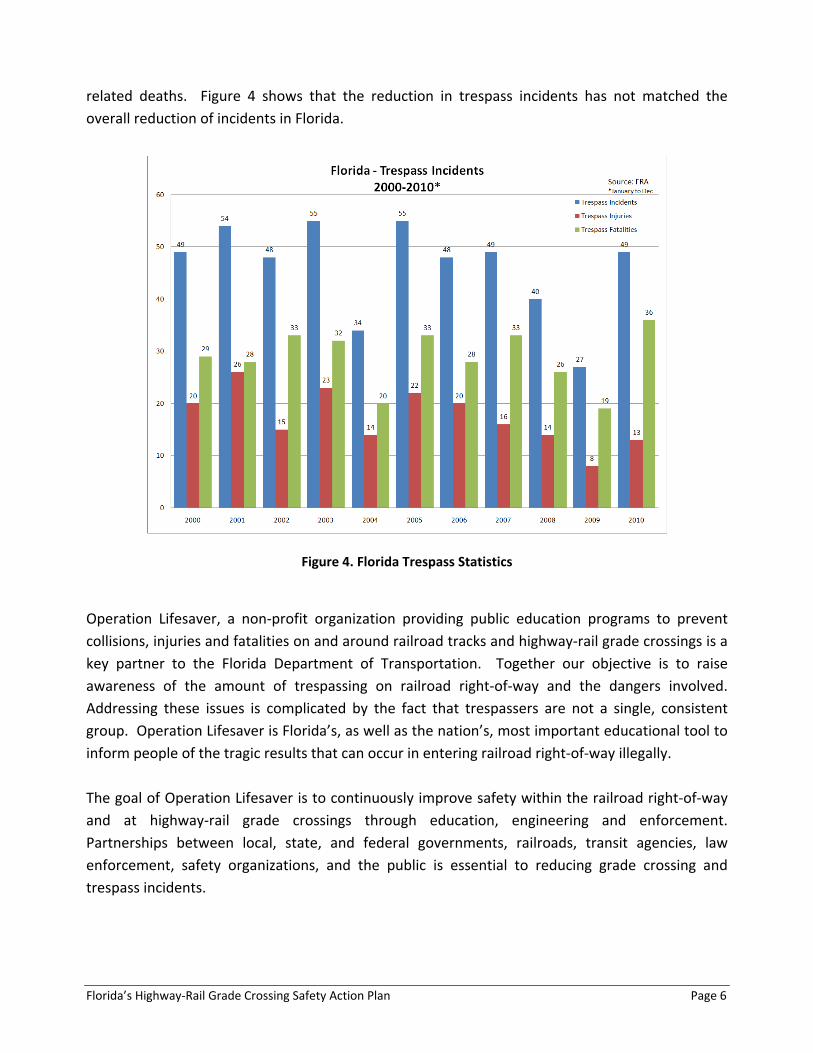
Florida’s Highway‐Rail Grade Crossing Safety Action Plan Page 6
related deaths. Figure 4 shows that the reduction in trespass incidents has not matched the
overall reduction of incidents in Florida.
Figure 4. Florida Trespass Statistics
Operation Lifesaver, a non‐profit organization providing public education programs to prevent
collisions, injuries and fatalities on and around railroad tracks and highway‐rail grade crossings is a
key partner to the Florida Department of Transportation. Together our objective is to raise
awareness of the amount of trespassing on railroad right‐of‐way and the dangers involved.
Addressing these issues is complicated by the fact that trespassers are not a single, consistent
group. Operation Lifesaver is Florida’s, as well as the nation’s, most important educational tool to
inform people of the tragic results that can occur in entering railroad right‐of‐way illegally.
The goal of Operation Lifesaver is to continuously improve safety within the railroad right‐of‐way
and at highway‐rail grade crossings through education, engineering and enforcement.
Partnerships between local, state, and federal governments, railroads, transit agencies, law
enforcement, safety organizations, and the public is essential to reducing grade crossing and
trespass incidents.
Florida’s Highway‐Rail Grade Crossing Safety Action Plan Page 7
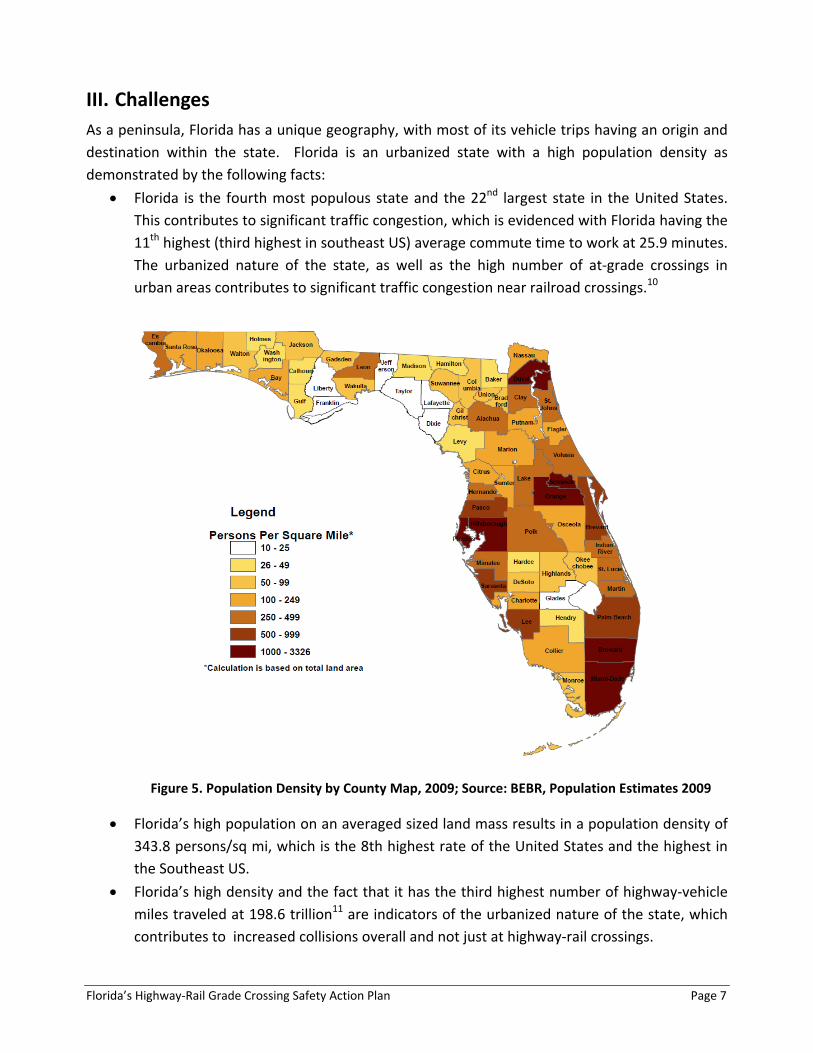
III. Challenges As a peninsula, Florida has a unique geography, with most of its vehicle trips having an origin and
destination within the state. Florida is an urbanized state with a high population density as
demonstrated by the following facts:
Florida is the fourth most populous state and the 22nd largest state in the United States.
This contributes to significant traffic congestion, which is evidenced with Florida having the
11th highest (third highest in southeast US) average commute time to work at 25.9 minutes.
The urbanized nature of the state, as well as the high number of at‐grade crossings in
urban areas contributes to significant traffic congestion near railroad crossings.10
Figure 5. Population Density by County Map, 2009; Source: BEBR, Population Estimates 2009
Florida’s high population on an averaged sized land mass results in a population density of
343.8 persons/sq mi, which is the 8th highest rate of the United States and the highest in
the Southeast US.
Florida’s high density and the fact that it has the third highest number of highway‐vehicle
miles traveled at 198.6 trillion11 are indicators of the urbanized nature of the state, which
contributes to increased collisions overall and not just at highway‐rail crossings.

Florida’s Highway‐Rail Grade Crossing Safety Action Plan Page 8
This observation is further reflected by where in Florida most highway‐rail crossing
collisions have occurred. During the Rail Safety Improvement Act of 2008 (RSIA) period
from 2006 to 2008, Florida’s highway‐rail collisions primarily occurred in the most
urbanized areas, with 70% occurring in the 10 largest counties. From 2000 to 2010, the
percentage of grade‐crossing collisions occurring in the 10 largest counties was over 65%.12
Comparing the number of collisions by county, shown in Figure 6, to population density,
shown in Figure 5, shows a close correlation to urbanization and increased highway‐rail
crossing collisions.
Florida’s urbanized counties also have a high density of crossings per rail mile. In addition,
these areas experience high amounts of freight and passenger rail traffic.
Figure 6. Florida Incidents by County (January 2005 to December 2009); Source: Federal Railroad
Administration

Florida’s Highway‐Rail Grade Crossing Safety Action Plan Page 9
IV. Florida’s Highway‐Railroad Improvement Program
A. History
On December 7, 1973 the Federal Highway Administration issued instructions to the State of
Florida to implement a Railroad‐Highway Improvement Program. The Department of
Transportation’s Central Safety Office was assigned to manage this program for the state. The
program was required to:
develop an inventory of all crossings (maintained by the Department’s Statistics Office until
Rail Office acquired the responsibility);
assign U.S. Department of Transportation (USDOT) inventory number to each crossing; and,
establish a formula to prioritize the most hazardous crossings to receive Federal Funding.
The Central Utility/Rail Office supported the Department’s Safety Office by establishing a District
Railroad Coordinator position in each geographic area of the state to inventory crossings within
their District boundaries. This information was then submitted to the FRA to create a database of
crossings nationwide. Districts furnish installation agreements to the Central Utility/Rail Office in
order to negotiate and fund candidate projects with each individual railroad company.
The Central Safety Office along with a federal grant to Florida State University initially designed a
safety index formula to prioritize these crossings that included certain variables at each crossing to
indicate which crossings were the most hazardous within the state. Some of the variables
included: number of incidents, train traffic, vehicular traffic, and train/vehicle speeds. A
reevaluation of the formula was performed in 2005 to include better data, additional parameters,
and a sensitivity analysis on all parameters.
Once the initial crossing inventory was completed and the priority formula finalized, the Central
Safety Office along with the District Railroad Coordinators began diagnostic field reviews and
made recommendations for signal upgrades. Initially, it was agreed for crossings off the State
Highway System, cities and counties must participate in the annual signal maintenance costs and
fund 10% of the cost to install safety improvements. Later, local governments were not required
to assist in the funding of safety improvements; however, they still contribute to the cost of
maintaining the equipment.
In the mid 1990’s, the Department transitioned the program functions from the Central Safety
Office to the Central Rail Office to keep all rail activities under one office and to better reflect
Federal Highway Administration policies and regulations. This organizational modification also
expanded the use of other safety applications at crossings. Crossing surfaces were upgraded so
vehicular traffic would pay more attention to approaching trains than rough crossing surfaces. The
Florida’s Highway‐Rail Grade Crossing Safety Action Plan Page 10
Central Rail Office implemented a constant warning time program at selective crossings that had
variable train speeds and funded a low cost gate mechanism replacement program at crossings
that had antiquated gates to prolong the life of the gate system. Other low cost programs that
were implemented include:
replacement of aged passive signs with new signs and reflective strips on each side of the
sign support;
new pavement markings on and off the State Highway System;
median barrier systems;
replacement of existing 8 inch lens with 12 inch lens; and
replacement of incandescent lights with light emitting diode (LED) lights for east/west
approach crossings.
B. Funding
At the beginning of the program, funding allotments were $4.2 million and would support a
candidate crossing program of 70 to 80 crossings. Today, there is an allotment of $7.5 million
which allows approximately 35 to 45 crossings to be improved. The lesser number of projects
implemented each year reflects the increased costs of signal installation parts and labor. The
Department’s annual Before and After Report, submitted to the Federal Highway Administration
each year, still reflects the down trend of fatalities at improved crossings around the state.
C. Florida’s Strategic Highway Safety Plan
The Florida Strategic Highway Safety Plan was developed by the Florida Department of
Transportation in late 2005 to provide a safer surface transportation system for residents,
businesses, and visitors. It is included as an element of the 2060 Florida Transportation Plan (FTP)
to address the State’s historically high traffic fatality rates with a special emphasis on high‐fatality
areas, including intersection, pedestrian, and bicycle fatalities. The plan utilizes the 4‐E approach
(engineering, enforcement, education, and emergency management) to focus resources where
opportunities for safety improvements are the greatest based on best available date and trends.
The Florida Strategic Highway Safety Plan is managed by an executive committee made up of
agencies and organizations involved with transportation facilities and safety, law enforcement,
community health, and community education. The members of the executive committee are
listed as follows:
Florida Department of Highway Safety and Motor Vehicles
Florida Department of Education
Florida Department of Health

Florida’s Highway‐Rail Grade Crossing Safety Action Plan Page 11
Florida Department of Transportation
Florida Highway Patrol
Florida Operation Lifesaver
Motor Carrier Compliance
Metropolitan Planning Organization Advisory Council
Florida Police Chiefs Association
Florida Sheriffs Association
Federal Highway Administration
Federal Motor Carrier Safety Administration
The recently completed 2060 Florida Transportation Plan recommends the State of Florida
continue with updating and implementing the Florida Strategic Highway Safety Plan as an
implementation strategy for providing a safe and secure transportation system for all users. The
2060 FTP recognizes the progress that has been made to reduce roadway fatalities in Florida,
which in 2009 was 1.3 fatalities per 100 million vehicle miles traveled – the lowest rate in the 40
years this statistic has been recorded.
The four main areas of emphasis and the percentage of Florida fatalities in 2005 attributable to
them are: aggressive driving (34.8%), intersection crashes (41.2%), vulnerable road users (19.8%),
and lane departure crashes (63.6%). The measures adopted to reduce these factors that
contribute to fatalities in the State are increased law enforcement, increased education efforts,
and identifying roadway features that contribute to crashes and develop mitigation plans for
them. Highway‐rail grade crossing projects focus on improving conditions to address each of these
four main areas of emphasis.
D. Crossing Statistics
Within the state, the Department has the statutory responsibility to improve safety at public
highway‐rail crossings. As of July 2011, there are 4,503 at‐grade highway‐rail crossings in Florida,
of which 3,549 are on public roads and 954 are on private roads. Florida also has 22 pedestrian
crossings in the state with 15 at‐grade crossings and 7 as grade separated crossings. The
Department has no jurisdiction over pedestrian crossings in the state. Agreements and
improvements to pedestrian crossings are handled by the local government agency and the
railroad partner.
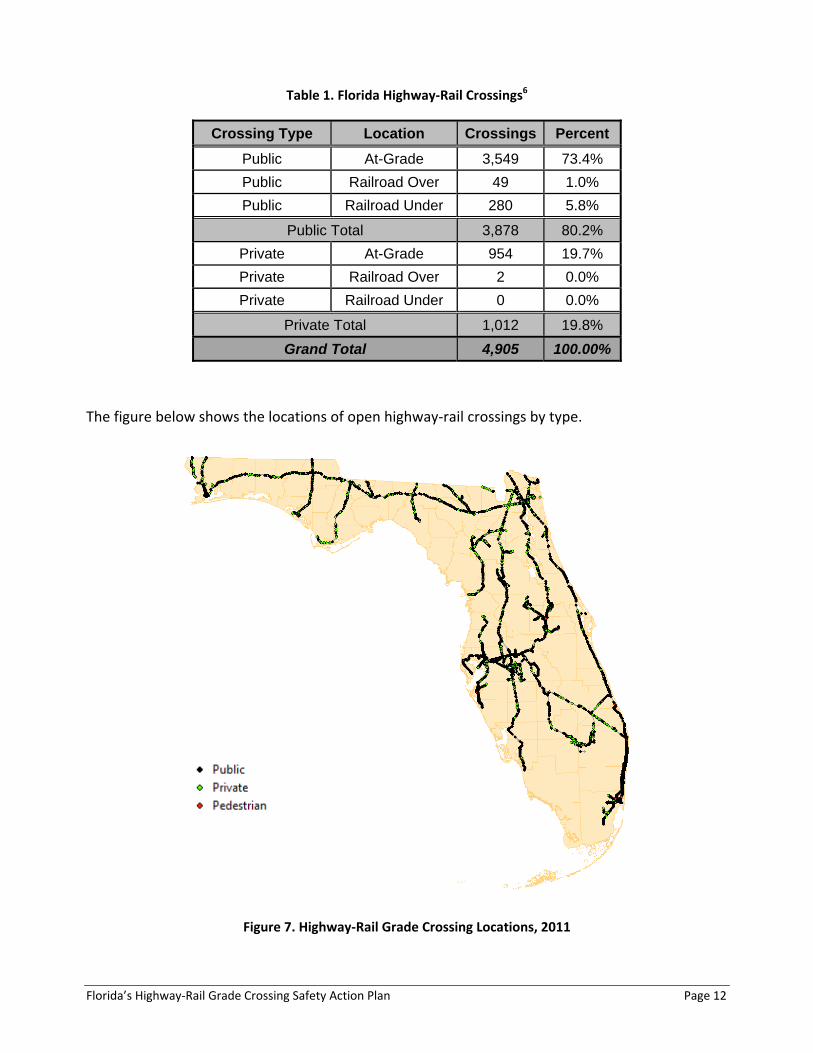
The table below summarizes the quantity of open highway‐rail crossings by type.
Florida’s Highway‐Rail Grade Crossing Safety Action Plan Page 12
Table 1. Florida Highway‐Rail Crossings6
Crossing Type Location Crossings Percent
Public At-Grade 3,549 73.4%
Public Railroad Over 49 1.0%
Public Railroad Under 280 5.8%
Public Total 3,878 80.2%
Private At-Grade 954 19.7%
Private Railroad Over 2 0.0%
Private Railroad Under 0 0.0%
Private Total 1,012 19.8%
Grand Total 4,905 100.00%
The figure below shows the locations of open highway‐rail crossings by type.
Figure 7. Highway‐Rail Grade Crossing Locations, 2011
Florida’s Highway‐Rail Grade Crossing Safety Action Plan Page 13
For safety improvements at crossings located on public roads, the Department pays the majority
of the costs utilizing federal funds.
E. Incident Statistics
From 2000 to 2009, 942 highway‐rail grade crossing incidents occurred in Florida. These incidents
mostly occurred in the state’s urban areas. As mentioned before, the top 10 counties in numbers
of incidents during the period accounted for nearly two thirds (63%) of the state’s population. In
total, fifty‐three (53) of Florida’s sixty‐seven (67) counties recorded incidents; however, only sixty
(60) of Florida’s counties have any highway‐rail grade crossings at all. The five counties that have
highway‐rail grade crossings but had no incidents in the period 2000 to 2009 have a total of 70
open, active highway‐rail grade crossings as follows: Okaloosa (20 crossings), Holmes (21
crossings), Franklin (15 crossings), Hendry (23 crossings), and Hardee (24 crossings). These are also
some of the most rural counties in the state, have less rail traffic, and have a greater number of
grade separations due to terrain.
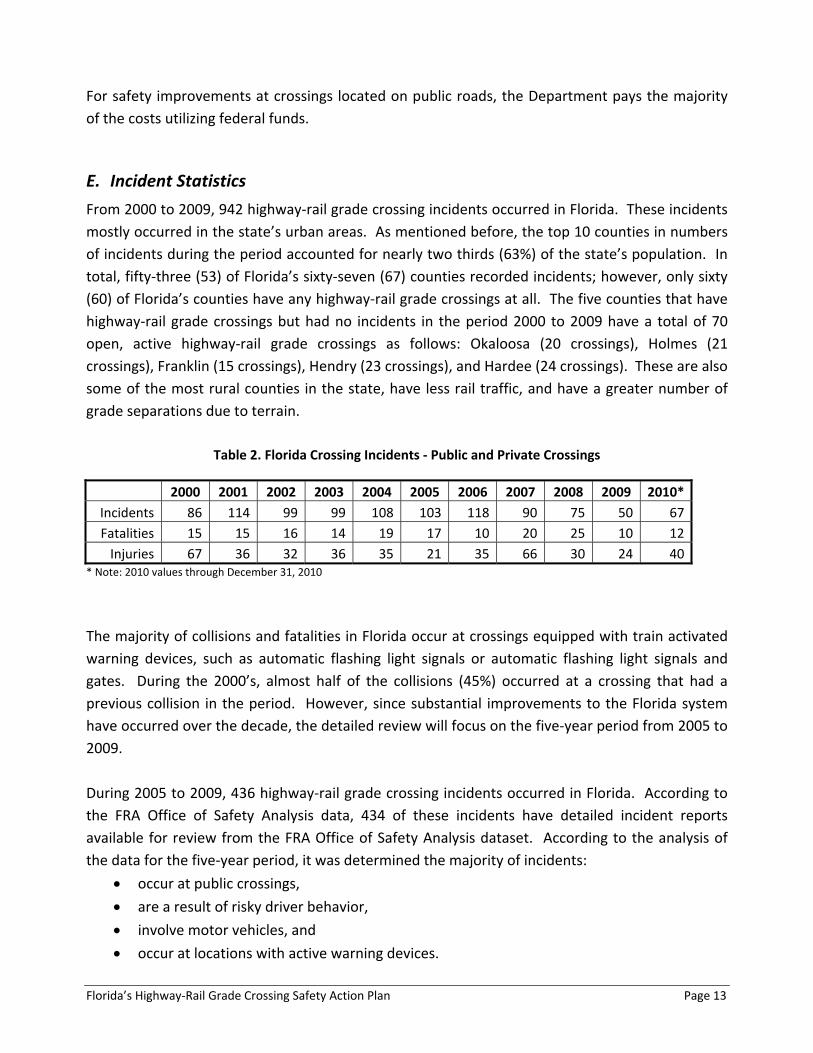
Table 2. Florida Crossing Incidents ‐ Public and Private Crossings
2000 2001 2002 2003 2004 2005 2006 2007 2008 2009 2010*
Incidents 86 114 99 99 108 103 118 90 75 50 67
Fatalities 15 15 16 14 19 17 10 20 25 10 12
Injuries 67 36 32 36 35 21 35 66 30 24 40* Note: 2010 values through December 31, 2010
The majority of collisions and fatalities in Florida occur at crossings equipped with train activated
warning devices, such as automatic flashing light signals or automatic flashing light signals and
gates. During the 2000’s, almost half of the collisions (45%) occurred at a crossing that had a
previous collision in the period. However, since substantial improvements to the Florida system
have occurred over the decade, the detailed review will focus on the five‐year period from 2005 to
2009.
During 2005 to 2009, 436 highway‐rail grade crossing incidents occurred in Florida. According to
the FRA Office of Safety Analysis data, 434 of these incidents have detailed incident reports
available for review from the FRA Office of Safety Analysis dataset. According to the analysis of
the data for the five‐year period, it was determined the majority of incidents:
occur at public crossings,
are a result of risky driver behavior,
involve motor vehicles, and
occur at locations with active warning devices.

Florida’s Highway‐Rail Grade Crossing Safety Action Plan Page 14
The detailed analysis of the crossing incidents and the basis of these conclusions can be seen in
Table 3, Table 4, and Table 5. The tables below and the records from the FRA Office of Safety
Analysis contain some incidents listed as suicides. The FRA doesn’t collect recorded suicides;
however, the cause of these records might have been initially entered and then the cause
modified.
Table 3. Type of Crossing – All Incidents (Florida, 2005 to 2009)
Type of crossing Incidents Percentage
Public 379 87%
Private 55 13%
Table 4. Type of Incident – All Incidents (Florida, 2005 to 2009)
Type of Incident – Vehicle Incidents Percentage
Stopped on 87 20.0%
Around gate 118 27.2%
Did not stop/yield 90 20.7%
Stalled 27 6.2%
Vehicle Abandon 10 2.3%
Car Crash 13 3.0%
Onto to Tracks 19 4.4%
Traffic 12 2.8%
Distracted 10 2.3%
Low Ground Clearance 3 0.7%
Suicide 2 0.5%
Device Malfunction 1 0.2%
Sub Total 392 90.3%
Type of Incident – Non vehicle Incidents Percentage
Pedestrian 30 6.9%
Pedestrian ‐ Suicide 6 1.4%
Bicycle 6 1.4%
Sub Total 42 9.7%
Total 434 100.0%

Florida’s Highway‐Rail Grade Crossing Safety Action Plan Page 15
Table 5. Type of Warning Device at Crossing – All Incidents (Florida, 2005 to 2009)
Type of Crossing Incidents Percentage
Passive Crossings
Crossbuck 75 17.3%
None 6 1.4%
Sub Total 81 19%
Active Crossings without Gates
Flashing Lights 12 2.8%
Cantilever Flashing Lights 8 1.8%
Traffic Signal 2 0.5%
Sub Total 22 5%
Active Crossings with Gates
Flashing Lights and Gates 146 33.6%
Cantilever Flashing Lights and Gates 181 41.7%
Sub Total 327 75%
Other Crossings
Flagged by Crew 4 0.9%
Total 434 100.0%
Of the 434 total incidents, 135 are multiple incident locations (31% of total incidents). The
following tables provide additional information regarding the multi‐incident crossings. According
to the analysis of the data for the five‐year period for just the multi‐incident crossings, the same
conclusions as noted above still hold. It was determined the majority of incidents:
occur at public crossings (greater percentage than data from all incidents),
are a result of risky driver behavior (equivalent percentage to data from all incidents),
involve motor vehicles (lower percentage than data from all incidents), and
occur at locations with active warning devices (greater percentage than data from all
incidents).
The detailed analysis of the crossing incidents and the basis of these conclusions can be seen in
Table 6, Table 7, and Table 8. Each detailed incident report collected by the FRA and available on
the FRA website was reviewed to understand the nature of the incident for all multi‐incident
crossings.
The private crossing incidents occurred at four (4) locations with three (3) of the locations having
crossbucks and the fourth location having flashing lights. For all these incidents at private

Florida’s Highway‐Rail Grade Crossing Safety Action Plan Page 16
crossings the driver did not yield to the train. The determination and funding of improvements to
these locations are the responsibility of the private crossing owner(s).
Table 6. Type of Crossing – Multi‐Incident Locations (Florida, 2005 to 2009)
Table 7. Type of Incident – Multi‐Incident Locations (Florida, 2005 to 2009)
Type of crossing Incidents Percentage
Public 127 94%
Private 8 6%
Type of Incident – Vehicle Incidents Percentage
Stopped on 39 28.9%
Around gate 28 20.7%
Did not stop/yield 16 11.1%
Stalled 9 6.7%
Vehicle Abandon 7 5.2%
Car Crash 6 4.4%
Onto to Tracks 4 3.0%
Traffic 3 2.2%
Distracted 3 2.2%
Low Ground Clearance 2 1.5%
Suicide 1 0.7%
Sub Total 117 86.7%
Type of Incident – Non vehicle Incidents Percentage
Pedestrian 12 8.9%
Pedestrian ‐ Suicide 2 1.5%
Bicycle 4 3.0%
Sub Total 18 13.3%
Total 135 100.0%

Florida’s Highway‐Rail Grade Crossing Safety Action Plan Page 17
Table 8. Type of Warning Device at Crossing – Multi‐Incident Locations (Florida, 2005 to 2009)
In addition, the type of the area (Urban/Rural) was also reviewed for the multi‐incident locations
as seen in Table 9. It was determined 84% of the incidents occur at urban crossings. This result is
expected as the majority of Florida’s rail miles and crossings are located in urban areas and the risk
of exposure in these areas is higher.
Table 9. Type of Area – Multi‐Incident Locations (Florida, 2005 to 2009)
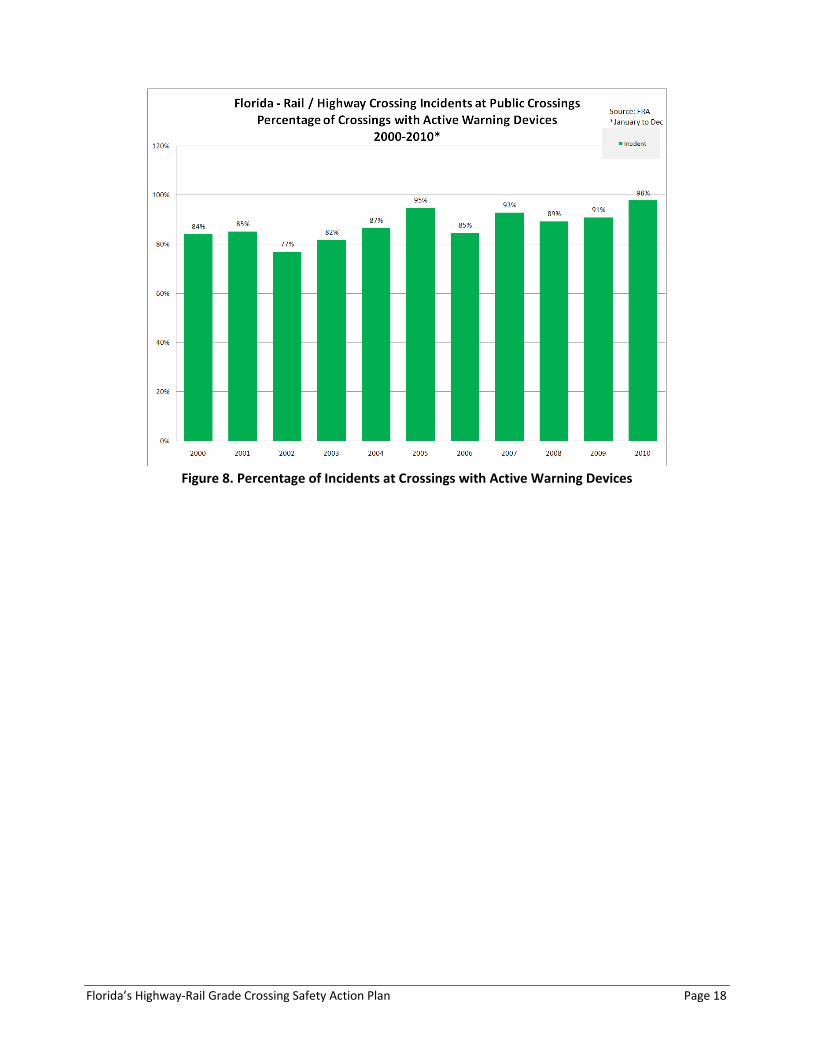
In addition, Figure 8 shows the percent of incidents at public crossings that occurred at locations
that had active warning devices at the time of the incident. In the review period from 2005 to
2009, the percentages ranged from 85% to 95% of incidents occurred at active crossings. In cases
where active devices are provided, often driver inattention or risky driver behavior contributes
significantly to incidents. More detailed analysis of multi‐incident locations follows in the Action
Plan Strategies section of this document.
Type of Crossing Incidents Percentage
Passive Crossings
Crossbuck 6 4.4%
Active Crossings without Gates
Flashing Lights 5 3.7%
Cantilever Flashing Lights 2 1.5%
Sub Total 7 5.2%
Active Crossings With Gates
Flashing Lights and Gates 39 28.9%
Cantilever Flashing Lights and Gates 83 61.5%
Sub Total 122 90.4%
Total 135 100.0%
Type of Area Incidents Percentage
Urban 114 84%
Rural 21 16%
Florida’s Highway‐Rail Grade Crossing Safety Action Plan Page 18
Figure 8. Percentage of Incidents at Crossings with Active Warning Devices
Florida’s Highway‐Rail Grade Crossing Safety Action Plan Page 19
V. ACTION PLAN STRATEGIES
A. Grade Crossing Closures / Consolidations
The Federal Highway Administration’s August 2007 Railroad‐Highway Grade Crossing Handbook
specifically states: “The first alternative that should always be considered for a highway‐rail at‐
grade crossing is elimination. Elimination can be accomplished by grade separating the crossing,
closing the crossing to highway traffic, or closing the crossing to railroad traffic through the
abandonment or relocation of the rail line. The major benefits of crossing elimination include
reductions in collision, highway vehicle delay, rail traffic delay, and maintenance costs of crossing
surfaces and traffic control devices.” The Department has regulatory authority over all public
highway‐rail grade crossings in the state, including the authority to issue permits which shall be
required prior to the opening and closing of highway‐rail grade crossings. With an emphasis on
identifying and eliminating hazardous and redundant crossings, the Department manages the
process in conjunction with railroad companies, local governments, and citizens. The risk of
collisions is reduced by the elimination of redundant crossings; therefore, it is in the best interest
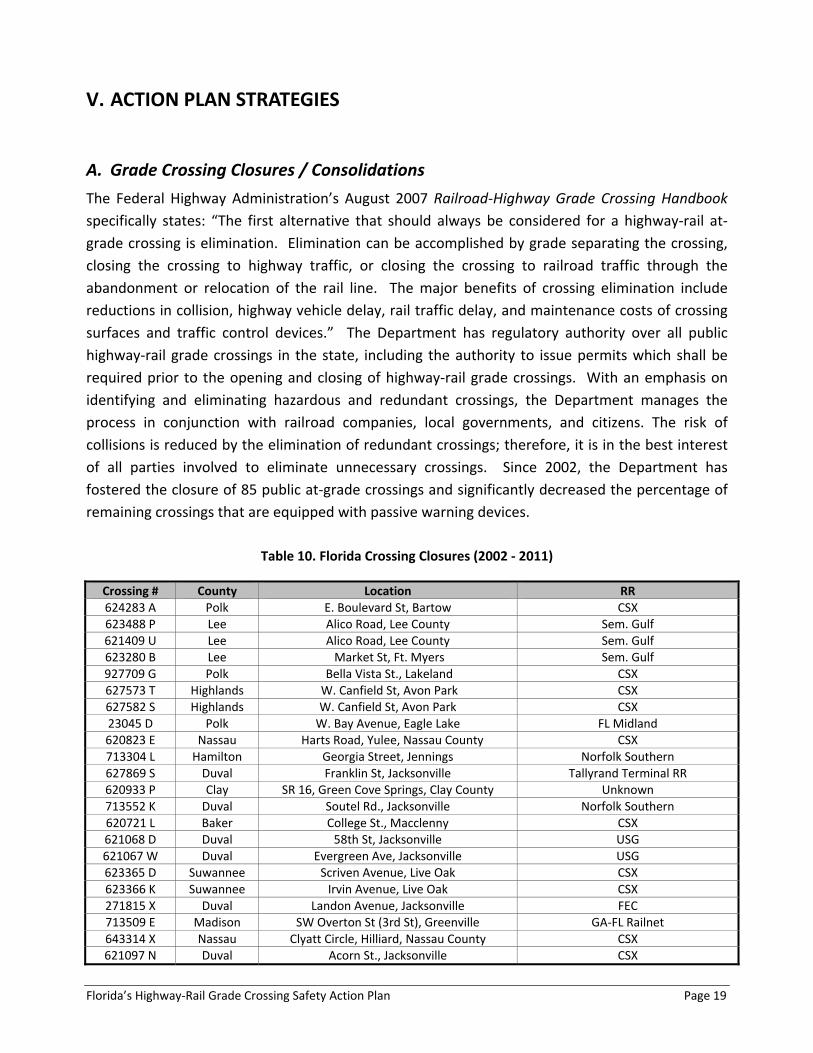
of all parties involved to eliminate unnecessary crossings. Since 2002, the Department has
fostered the closure of 85 public at‐grade crossings and significantly decreased the percentage of
remaining crossings that are equipped with passive warning devices.
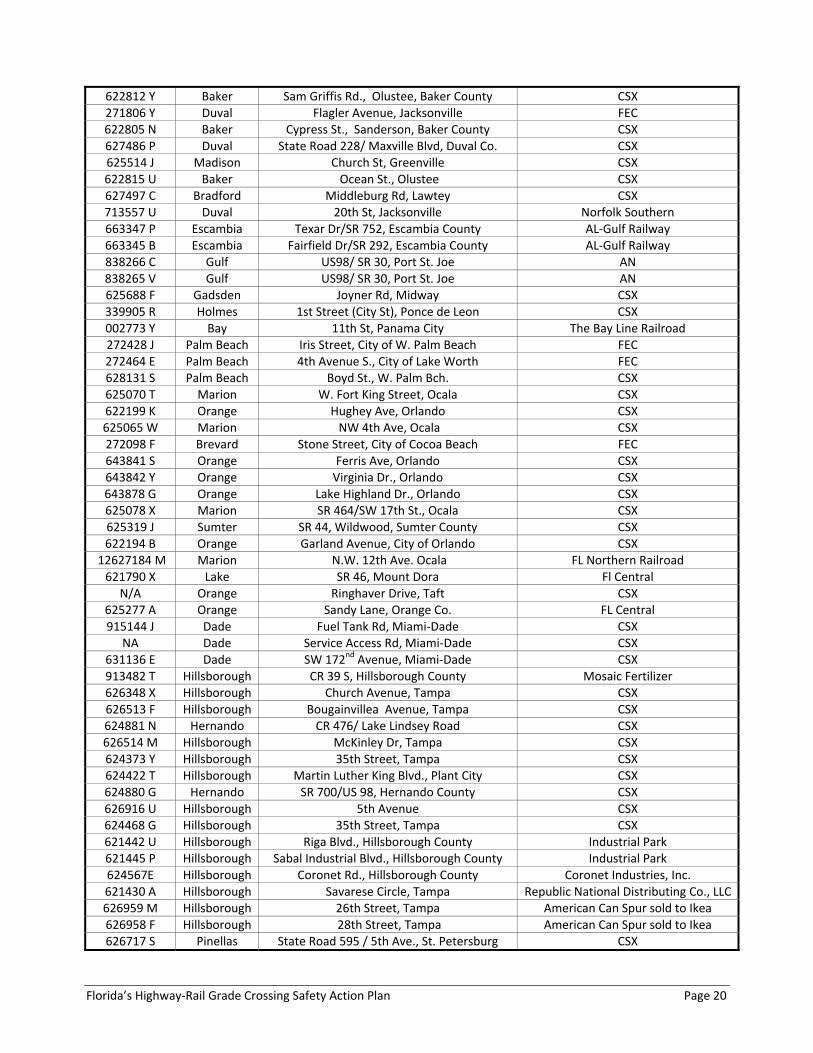
Table 10. Florida Crossing Closures (2002 ‐ 2011)
Crossing # County Location RR 624283 A Polk E. Boulevard St, Bartow CSX 623488 P Lee Alico Road, Lee County Sem. Gulf621409 U Lee Alico Road, Lee County Sem. Gulf623280 B Lee Market St, Ft. Myers Sem. Gulf927709 G Polk Bella Vista St., Lakeland CSX 627573 T Highlands W. Canfield St, Avon Park CSX 627582 S Highlands W. Canfield St, Avon Park CSX 23045 D Polk W. Bay Avenue, Eagle Lake FL Midland620823 E Nassau Harts Road, Yulee, Nassau County CSX 713304 L Hamilton Georgia Street, Jennings Norfolk Southern627869 S Duval Franklin St, Jacksonville Tallyrand Terminal RR620933 P Clay SR 16, Green Cove Springs, Clay County Unknown713552 K Duval Soutel Rd., Jacksonville Norfolk Southern620721 L Baker College St., Macclenny CSX 621068 D Duval 58th St, Jacksonville USG 621067 W Duval Evergreen Ave, Jacksonville USG 623365 D Suwannee Scriven Avenue, Live Oak CSX 623366 K Suwannee Irvin Avenue, Live Oak CSX 271815 X Duval Landon Avenue, Jacksonville FEC 713509 E Madison SW Overton St (3rd St), Greenville GA‐FL Railnet643314 X Nassau Clyatt Circle, Hilliard, Nassau County CSX 621097 N Duval Acorn St., Jacksonville CSX
Florida’s Highway‐Rail Grade Crossing Safety Action Plan Page 20
622812 Y Baker Sam Griffis Rd., Olustee, Baker County CSX 271806 Y Duval Flagler Avenue, Jacksonville FEC 622805 N Baker Cypress St., Sanderson, Baker County CSX 627486 P Duval State Road 228/ Maxville Blvd, Duval Co. CSX 625514 J Madison Church St, Greenville CSX 622815 U Baker Ocean St., Olustee CSX 627497 C Bradford Middleburg Rd, Lawtey CSX 713557 U Duval 20th St, Jacksonville Norfolk Southern663347 P Escambia Texar Dr/SR 752, Escambia County AL‐Gulf Railway663345 B Escambia Fairfield Dr/SR 292, Escambia County AL‐Gulf Railway838266 C Gulf US98/ SR 30, Port St. Joe AN 838265 V Gulf US98/ SR 30, Port St. Joe AN 625688 F Gadsden Joyner Rd, Midway CSX 339905 R Holmes 1st Street (City St), Ponce de Leon CSX 002773 Y Bay 11th St, Panama City The Bay Line Railroad272428 J Palm Beach Iris Street, City of W. Palm Beach FEC 272464 E Palm Beach 4th Avenue S., City of Lake Worth FEC 628131 S Palm Beach Boyd St., W. Palm Bch. CSX 625070 T Marion W. Fort King Street, Ocala CSX 622199 K Orange Hughey Ave, Orlando CSX 625065 W Marion NW 4th Ave, Ocala CSX 272098 F Brevard Stone Street, City of Cocoa Beach FEC 643841 S Orange Ferris Ave, Orlando CSX 643842 Y Orange Virginia Dr., Orlando CSX 643878 G Orange Lake Highland Dr., Orlando CSX 625078 X Marion SR 464/SW 17th St., Ocala CSX 625319 J Sumter SR 44, Wildwood, Sumter County CSX 622194 B Orange Garland Avenue, City of Orlando CSX
12627184 M Marion N.W. 12th Ave. Ocala FL Northern Railroad621790 X Lake SR 46, Mount Dora Fl Central
N/A Orange Ringhaver Drive, Taft CSX 625277 A Orange Sandy Lane, Orange Co. FL Central915144 J Dade Fuel Tank Rd, Miami‐Dade CSX
NA Dade Service Access Rd, Miami‐Dade CSX 631136 E Dade SW 172nd Avenue, Miami‐Dade CSX 913482 T Hillsborough CR 39 S, Hillsborough County Mosaic Fertilizer626348 X Hillsborough Church Avenue, Tampa CSX 626513 F Hillsborough Bougainvillea Avenue, Tampa CSX 624881 N Hernando CR 476/ Lake Lindsey Road CSX 626514 M Hillsborough McKinley Dr, Tampa CSX 624373 Y Hillsborough 35th Street, Tampa CSX 624422 T Hillsborough Martin Luther King Blvd., Plant City CSX 624880 G Hernando SR 700/US 98, Hernando County CSX 626916 U Hillsborough 5th Avenue CSX 624468 G Hillsborough 35th Street, Tampa CSX 621442 U Hillsborough Riga Blvd., Hillsborough County Industrial Park621445 P Hillsborough Sabal Industrial Blvd., Hillsborough County Industrial Park624567E Hillsborough Coronet Rd., Hillsborough County Coronet Industries, Inc.621430 A Hillsborough Savarese Circle, Tampa Republic National Distributing Co., LLC626959 M Hillsborough 26th Street, Tampa American Can Spur sold to Ikea626958 F Hillsborough 28th Street, Tampa American Can Spur sold to Ikea626717 S Pinellas State Road 595 / 5th Ave., St. Petersburg CSX

Florida’s Highway‐Rail Grade Crossing Safety Action Plan Page 21
N/A Hillsborough Jersey Ave, Port Sutton, Hillsborough County Exide Technologies 626874 K Hillsborough Anderson Road, Hillsborough County CSX 626875 S Hillsborough Anderson Road, Hillsborough County CSX 626882 C Hillsborough Anderson Road, Hillsborough County CSX 626718 Y Pinellas 16th Street North, St. Petersburg CSX 626719 F Pinellas Burlington Ave N, St. Petersburg CSX 626720 A Pinellas 2nd Ave N, St. Petersburg CSX 626721 G Pinellas 1st Ave N, St. Petersburg CSX 626722 N Pinellas Central Ave, St. Petersburg CSX 626723 V Pinellas 13th St S, St. Petersburg CSX 626724 C Pinellas 1st Ave S, St. Petersburg CSX
The Department is committed to continuing the crossing consolidation effort. In fact, during
Diagnostic Field Reviews each year, crossings are identified for potential closure. The Department
also conducts a corridor analysis each year which provides notice of potential closures to
stakeholders. The Department participates in this effort with incentive funds of $7,500 per
crossing closure.
B. Signal Safety Program
In the continuing effort to improve warning devices at public highway‐rail grade crossings, the
Department works to identify crossings where certain improvements could potentially increase
safety, with the goal of reducing fatalities and injuries. Florida uses an inventory of rail system
data to produce the annual Safety Index, in which crossings are ranked in order of potential risk.
The rankings are made based on safety considerations, such as; incidents, vehicular traffic, posted
vehicle speed, number of trains per day, maximum timetable train speed, and type of existing
warning devices. The Safety Index systematically identifies crossings with higher risk. Priority
crossings are reviewed and selected crossings undergo Diagnostic Field Reviews performed by the
Department’s review teams. Some higher priority crossings do not undergo field reviews as
improvements require a grade separation, improvements are awaiting implementation, or
improvements are part of a construction project.
Projects are reviewed statewide and project selection occurs based on a number of factors
including: safety index, project cost, incident history, corridor emphasis, and input from local
governments and transportation partners. In the interest of maximizing the impact of limited
funding, low cost improvements are also considered. One low cost application the Department
works to implement is to install light‐emitting diode (LEDs) on east/west crossings to improve
warning visibility for the motoring public.
The Department coordinates with local highway agencies and railroads regarding priority crossings
and utilizes the federal Highway‐Rail Safety Program to fund safety improvements at grade

Florida’s Highway‐Rail Grade Crossing Safety Action Plan Page 22
crossings on state, county, and city roads. Occasionally state safety and state maintenance funds
are also available for funding improvements. When using state funds, the Department identifies,
prioritizes, and implements surface improvement projects at grade crossings only on state
maintained roads.
1. Warning Device Upgrades
The Department continues to use the Safety Index rankings to identify crossings for
consideration by the Diagnostic Field Review teams. Field inspections will be used
to identify upgrades such as:
Installation of new, more reflective crossbuck warning signs at crossings that
do not require automatic warning devices;
installation of other warning signs (Do not stop on tracks, Advanced warning
signs, Quiet zone signs) and pavement markings/treatments;
installation of automatic flashing light signals and gates at public grade
crossings currently not equipped with automatic warning devices;
installation of automatic flashing light signals and gates at public grade
crossings currently equipped only with automatic flashing light signals;
signal circuitry improvements at public grade crossings currently equipped
with automatic warning devices; and
replacement of outdated bulbs with brighter LEDs, allowing for greater
visibility.
2. Interconnection
The Department upgrades the circuitry at grade crossings where warning signals are
connected to the adjacent traffic signals so that the two systems operate in a
synchronized manner. The Department is currently in the process of updating the
state’s inventory data which will assist in the review of existing locations that are
interconnected. Once the correct database information is available, the
Department will review interconnections as part of standard Diagnostic Field
Reviews to ensure the interconnection is correctly functioning.
The Department also would benefit from research on coordinated pre‐emption for
urbanized areas with a significant amount of crossings in close proximity. The
coordinated pre‐emption will allow communication between traffic signals in a
given corridor as a system‐wide approach rather than by individual crossing. The
coordinated pre‐emption concept will allow traffic signals in close proximity to
crossings to be pre‐empted earlier than the current operation. The coordinated

Florida’s Highway‐Rail Grade Crossing Safety Action Plan Page 23
pre‐emption will create more time for downstream vehicles to clear the railroad
crossing and reduce conflicting vehicular movements that may occur at an
intersection. Some challenges for this concept will be the presence of differing
train speeds and types, commuter train stations located between crossings, and
passenger service that stops at certain crossings. The Department wants to
increase safety by removing queues; however, the impact to the vehicular traffic
and the remaining transportation grid must be evaluated.
3. Multi‐Incident locations
The Department has reviewed each of the multiple incident locations where the
vehicle was stopped on the tracks, drove around the gates, drove onto the tracks,
or was obstructed by traffic. Research and analysis of each location was used to
determine:
if the location has a nearby traffic signal,
if the traffic signal is interconnected with the railroad warning devices,
if there are parallel streets or driveways that cause confusion, and
the level of traffic in the proximity of the crossing.
Based on the analysis, it has been determined that the Department will review
these multiple incident locations over the next several years to determine if
cost/effective improvements can be implemented.
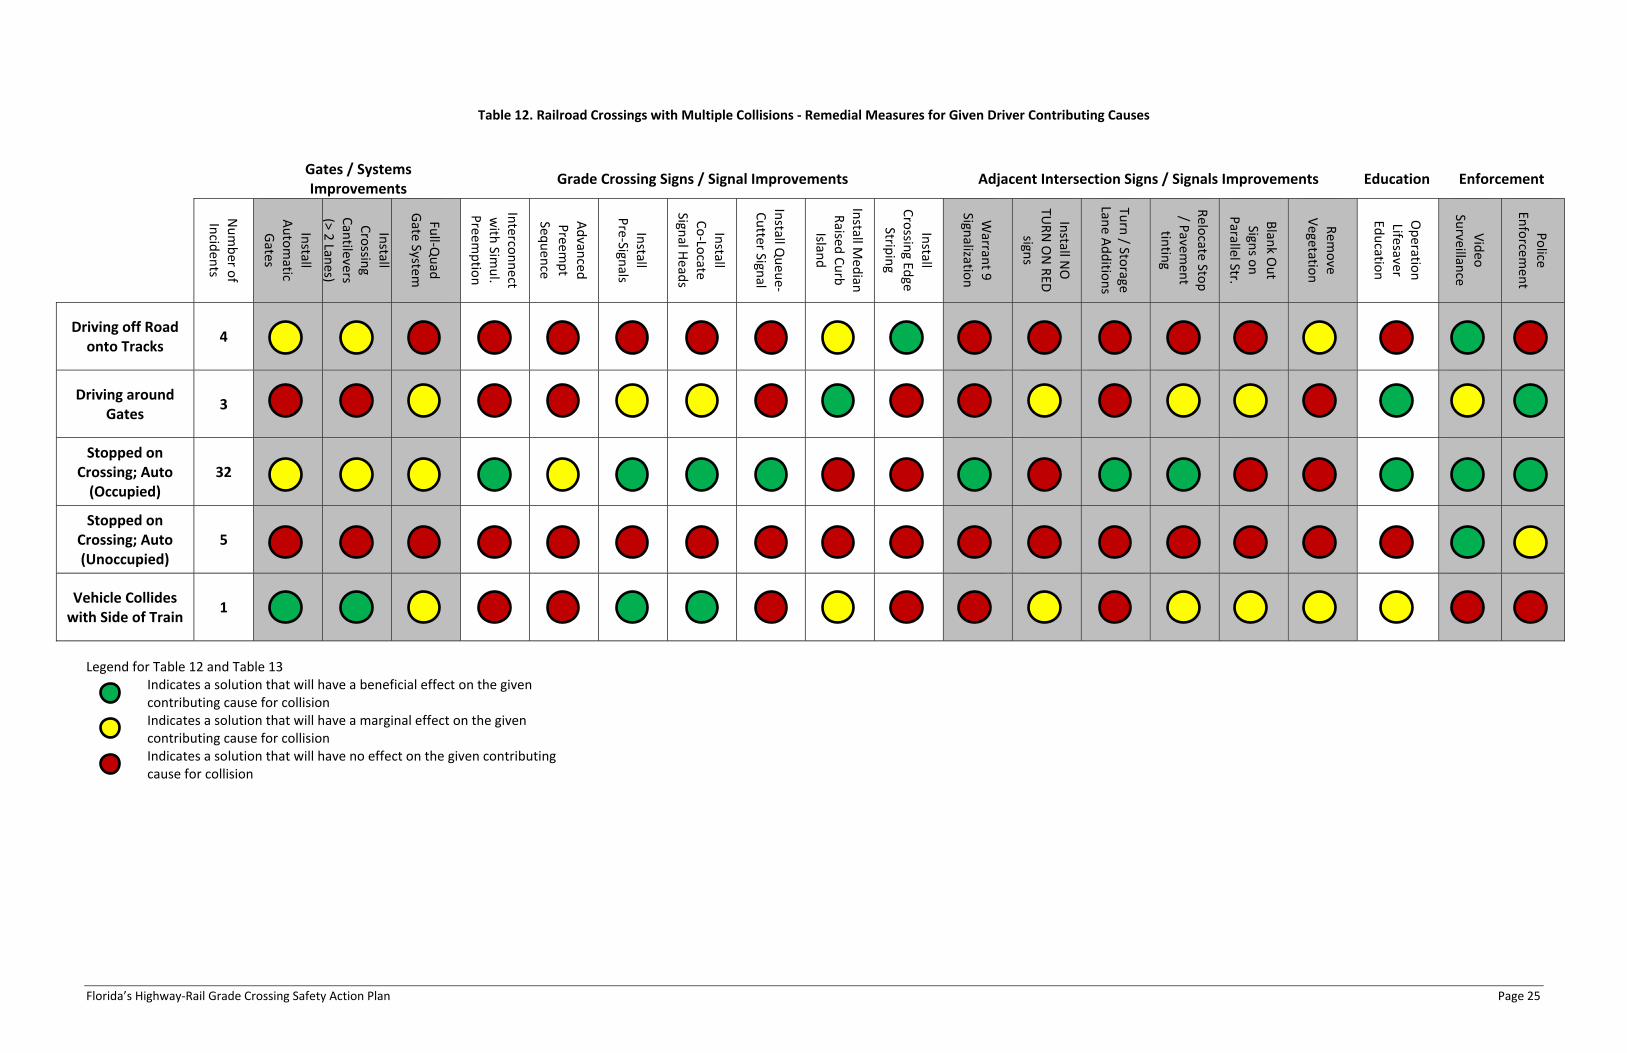
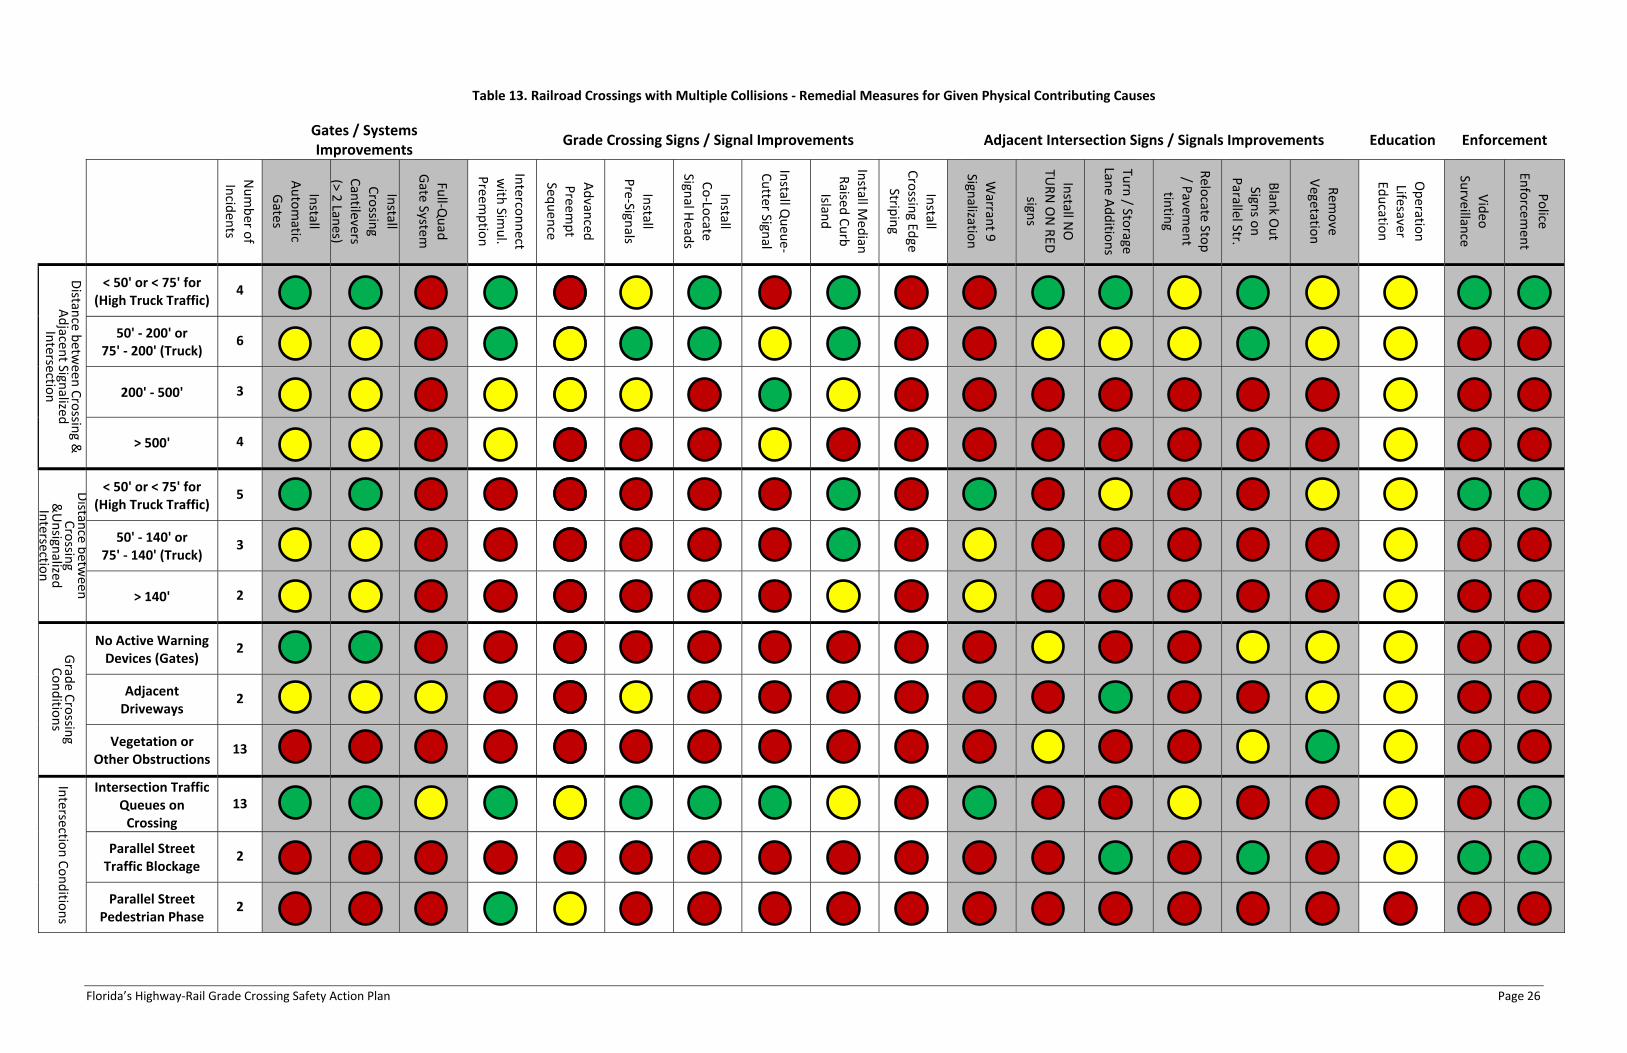
Table 11. Multi‐Incident Locations Evaluated for Remedial Measures
The following two (2) tables present the different factors to consider when recommending
improvements to remediate incident prone grade crossing locations. Recommended remedial
actions are based on detailed analysis of the 74 locations indicated in Table 11. Each of these
locations was reviewed with aerial photography and using the Department’s Rail Highway Crossing
Type of Incident – Vehicle Incidents Percentage
Stopped on 39 28.9%
Around gate 28 20.7%
Onto to Tracks 4 3.0%
Traffic 3 2.2%
Total 74
Florida’s Highway‐Rail Grade Crossing Safety Action Plan Page 24
Inventory data. A variety of improvement strategies were assembled from the US Department of
Transportation Federal Highway Administration Railroad‐Highway Grade Crossing Handbook. The
Department developed this improvement matrix so the findings can be applied to historical
incidents and can be used to help evaluate future incidents and potential improvement strategies
as well.
The first improvement matrix evaluates driver behavior as indicated in the FRA Office of Safety
Analysis incident reports. The results of these analyses are shown in Table 12. Clearly the
different driver behaviors results in a variety of approaches some being more effective than
others.
The second improvement matrix shown in Table 13 evaluates the physical characteristics of the
crossing area as determined by aerial photography and data resources. The physical
characteristics evaluated included the presence of a signalized or unsignalized intersection and the
control conditions at that intersection as well as the conditions in the immediate vicinity of the
crossing.
The indentified improvements evaluated in both tables include: improved active warning devices,
signalization improvements, intersection improvements, signage and pavement marking
improvements, education, and enforcement.
In all cases, the Department will need to weigh the cost of the improvements along with the
effectiveness of the potential improvement project.
Florida’s Highway‐Rail Grade Crossing Safety Action Plan Page 25
Table 12. Railroad Crossings with Multiple Collisions ‐ Remedial Measures for Given Driver Contributing Causes
Gates / Systems
Improvements Grade Crossing Signs / Signal Improvements Adjacent Intersection Signs / Signals Improvements Education Enforcement
Number o
f Incid
ents
Install
Automatic
Gates
Install
Crossin
g Cantilevers
(> 2 Lan
es)
Full‐Q
uad
Gate
System
Interco
nnect
with
Simul.
Preem
ptio
n
Advan
ced
Preem
pt
Sequence
Install
Pre‐Sign
als
Install
Co‐Lo
cate
Signal H
eads
Install Q
ueue‐
Cutter Sign
al
Install M
edian
Raised
Curb
Island
Install
Crossin
g Edge
Striping
Warran
t 9
Signalizatio
n
Install N
O
TURN ON RED
sign
s
Turn / Sto
rage Lan
e Additio
ns
Relo
cate Sto
p
/ Pavem
ent
tintin
g
Blan
k Out
Signs o
n
Parallel Str.
Rem
ove
Vegetatio
n
Operatio
n
Lifesaver
Educatio
n
Video
Surveillan
ce
Police
Enforce
men
t
Driving off Road onto Tracks
4
Driving around Gates
3
Stopped on Crossing; Auto (Occupied)
32
Stopped on Crossing; Auto (Unoccupied)
5
Vehicle Collides with Side of Train
1
Legend for Table 12 and Table 13 Indicates a solution that will have a beneficial effect on the given
contributing cause for collision Indicates a solution that will have a marginal effect on the given
contributing cause for collision Indicates a solution that will have no effect on the given contributing
cause for collision
Florida’s Highway‐Rail Grade Crossing Safety Action Plan Page 26
Table 13. Railroad Crossings with Multiple Collisions ‐ Remedial Measures for Given Physical Contributing Causes
Gates / Systems Improvements
Grade Crossing Signs / Signal Improvements Adjacent Intersection Signs / Signals Improvements Education Enforcement
Number o
f
Incid
ents
Install
Automatic
Gates
Install
Crossin
g Cantilevers
(> 2 Lan
es)
Full‐Q
uad
Gate
System
Interco
nnect
with
Simul.
Preem
ptio
n
Advan
ced
Preem
pt
Sequence
Install
Pre‐Sign
als
Install
Co‐Lo
cate
Signal H
eads
Install Q
ueue‐
Cutter Sign
al
Install M
edian
Raised
Curb
Island
Install
Crossin
g Edge
Striping
Warran
t 9
Signalizatio
n
Install N
O
TURN ON RED
signs
Turn / Sto
rage Lan
e Additio
ns
Relo
cate Sto
p
/ Pavem
ent
tintin
g
Blan
k Out
Signs o
n
Parallel Str.
Rem
ove
Vegetatio
n
Operatio
n
Lifesaver Ed
ucatio
n
Video
Surveillan
ce
Police
Enforce
men
t
Distan
ce betw
een Crossin
g &Adjacen
t Signalized
Intersectio
n
< 50' or < 75' for (High Truck Traffic)
4
50' ‐ 200' or 75' ‐ 200' (Truck)
6
200' ‐ 500' 3
> 500' 4
Distan
ce betw
een
Crossin
g &Unsign
alized
Intersectio
n
< 50' or < 75' for (High Truck Traffic)
5
50' ‐ 140' or 75' ‐ 140' (Truck)
3
> 140' 2
Grad
e Crossin
g Conditio
ns
No Active Warning Devices (Gates)
2
Adjacent Driveways
2
Vegetation or Other Obstructions
13
Intersectio
n Conditio
ns
Intersection Traffic Queues on Crossing
13
Parallel Street Traffic Blockage
2
Parallel Street Pedestrian Phase
2
Florida’s Highway‐Rail Grade Crossing Safety Action Plan Page 27
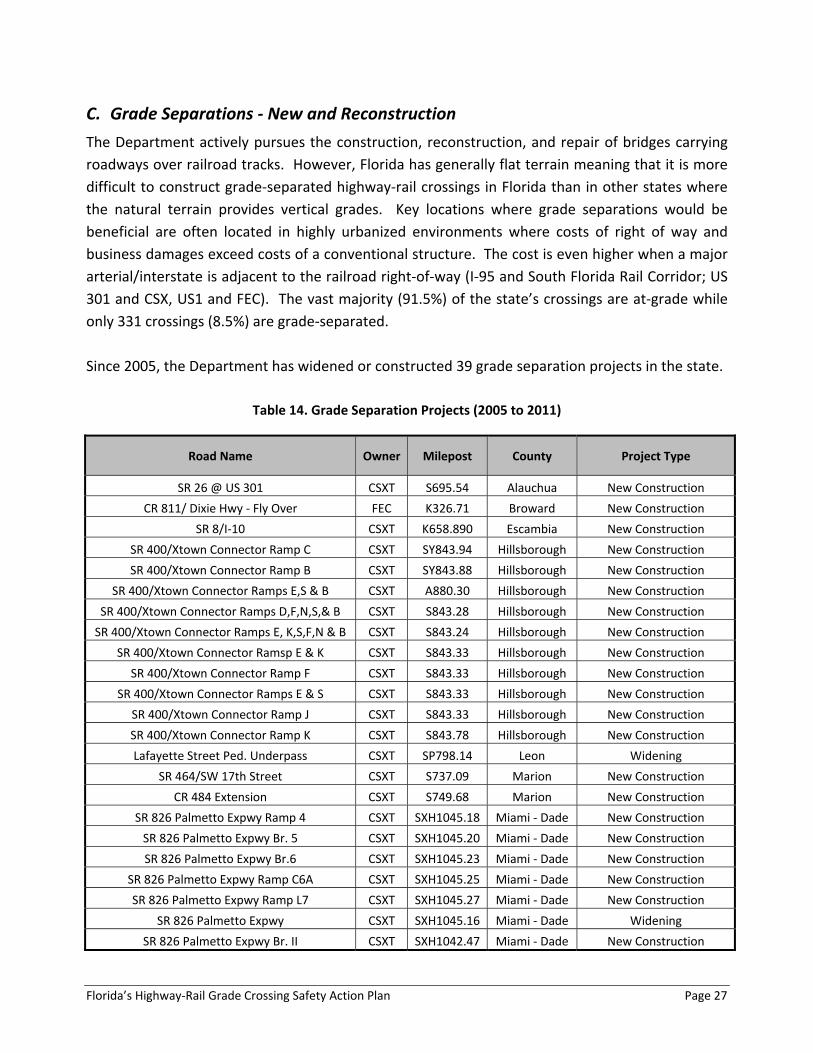
C. Grade Separations ‐ New and Reconstruction
The Department actively pursues the construction, reconstruction, and repair of bridges carrying
roadways over railroad tracks. However, Florida has generally flat terrain meaning that it is more
difficult to construct grade‐separated highway‐rail crossings in Florida than in other states where
the natural terrain provides vertical grades. Key locations where grade separations would be
beneficial are often located in highly urbanized environments where costs of right of way and
business damages exceed costs of a conventional structure. The cost is even higher when a major
arterial/interstate is adjacent to the railroad right‐of‐way (I‐95 and South Florida Rail Corridor; US
301 and CSX, US1 and FEC). The vast majority (91.5%) of the state’s crossings are at‐grade while
only 331 crossings (8.5%) are grade‐separated.
Since 2005, the Department has widened or constructed 39 grade separation projects in the state.
Table 14. Grade Separation Projects (2005 to 2011)
Road Name Owner Milepost County Project Type
SR 26 @ US 301 CSXT S695.54 Alauchua New Construction
CR 811/ Dixie Hwy ‐ Fly Over FEC K326.71 Broward New Construction
SR 8/I‐10 CSXT K658.890 Escambia New Construction
SR 400/Xtown Connector Ramp C CSXT SY843.94 Hillsborough New Construction
SR 400/Xtown Connector Ramp B CSXT SY843.88 Hillsborough New Construction
SR 400/Xtown Connector Ramps E,S & B CSXT A880.30 Hillsborough New Construction
SR 400/Xtown Connector Ramps D,F,N,S,& B CSXT S843.28 Hillsborough New Construction
SR 400/Xtown Connector Ramps E, K,S,F,N & B CSXT S843.24 Hillsborough New Construction
SR 400/Xtown Connector Ramsp E & K CSXT S843.33 Hillsborough New Construction
SR 400/Xtown Connector Ramp F CSXT S843.33 Hillsborough New Construction
SR 400/Xtown Connector Ramps E & S CSXT S843.33 Hillsborough New Construction
SR 400/Xtown Connector Ramp J CSXT S843.33 Hillsborough New Construction
SR 400/Xtown Connector Ramp K CSXT S843.78 Hillsborough New Construction
Lafayette Street Ped. Underpass CSXT SP798.14 Leon Widening
SR 464/SW 17th Street CSXT S737.09 Marion New Construction
CR 484 Extension CSXT S749.68 Marion New Construction
SR 826 Palmetto Expwy Ramp 4 CSXT SXH1045.18 Miami ‐ Dade New Construction
SR 826 Palmetto Expwy Br. 5 CSXT SXH1045.20 Miami ‐ Dade New Construction
SR 826 Palmetto Expwy Br.6 CSXT SXH1045.23 Miami ‐ Dade New Construction
SR 826 Palmetto Expwy Ramp C6A CSXT SXH1045.25 Miami ‐ Dade New Construction
SR 826 Palmetto Expwy Ramp L7 CSXT SXH1045.27 Miami ‐ Dade New Construction
SR 826 Palmetto Expwy CSXT SXH1045.16 Miami ‐ Dade Widening
SR 826 Palmetto Expwy Br. II CSXT SXH1042.47 Miami ‐ Dade New Construction
Florida’s Highway‐Rail Grade Crossing Safety Action Plan Page 28
SR 826 Palmetto Expwy Br. 29B CSXT SXH1042.48 Miami ‐ Dade New Construction
SR 826 Palmetto Expwy Br. 29A CSXT SXH1042.50 Miami ‐ Dade Replacement and Widen
SR 826 Palmetto Expwy Ramp S‐E CSXT SXH1042.53 Miami ‐ Dade New Construction
SR 836 Dolphin Expwy CSXT SXH1040.95 Miami ‐ Dade Widening
NW 25th Street FEC LR10.51 Miami ‐ Dade New Construction
NW 25th Street FEC LR10.74 Miami ‐ Dade New Construction
NW 25th Street FEC LR11.22 Miami ‐ Dade New Construction
SR 9A/I‐95 & 91/Turnpike CSXT SX1026.95 Miami ‐ Dade Widening
SR 400/I‐4, Ramp D‐1 CSXT A790.70 Orange New Construction
SR 400/I‐4 @ SR 408 E/W Expwy CSXT A790.63 Orange New Construction
Lakeland In‐Town Bypass CSXT AR856.25 Polk New Construction
SR 559 CSXT SX821.25 Polk New Construction
SR 281 CSXT K664.20 Santa Rosa New Construction
SR 400/I‐4 EB OFF Ramp B‐1 CSXT A763.72 Seminole New Construction
SR 35/ US 301 CSXT S760.61 Sumter New Construction
SR 44 CSXT S762.55 Sumter New Construction
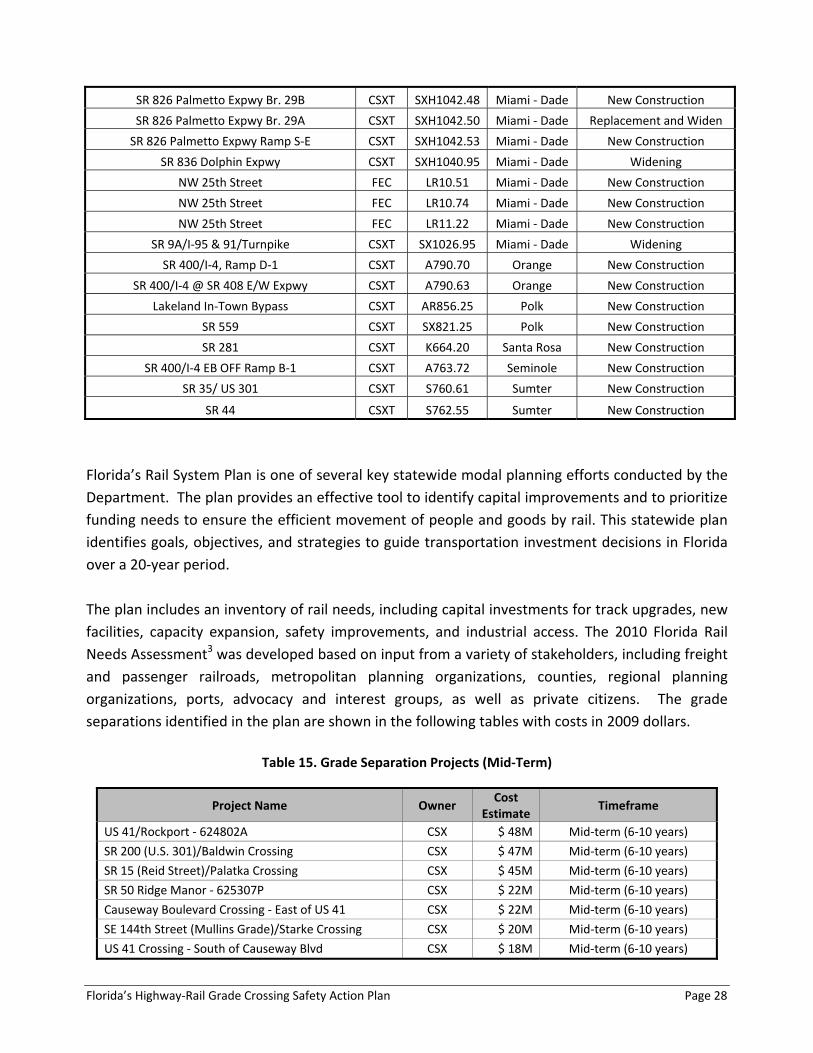
Florida’s Rail System Plan is one of several key statewide modal planning efforts conducted by the
Department. The plan provides an effective tool to identify capital improvements and to prioritize
funding needs to ensure the efficient movement of people and goods by rail. This statewide plan
identifies goals, objectives, and strategies to guide transportation investment decisions in Florida
over a 20‐year period.
The plan includes an inventory of rail needs, including capital investments for track upgrades, new
facilities, capacity expansion, safety improvements, and industrial access. The 2010 Florida Rail
Needs Assessment3 was developed based on input from a variety of stakeholders, including freight
and passenger railroads, metropolitan planning organizations, counties, regional planning
organizations, ports, advocacy and interest groups, as well as private citizens. The grade
separations identified in the plan are shown in the following tables with costs in 2009 dollars.
Table 15. Grade Separation Projects (Mid‐Term)
Project Name Owner Cost
Estimate Timeframe
US 41/Rockport ‐ 624802A CSX $ 48M Mid‐term (6‐10 years)
SR 200 (U.S. 301)/Baldwin Crossing CSX $ 47M Mid‐term (6‐10 years)
SR 15 (Reid Street)/Palatka Crossing CSX $ 45M Mid‐term (6‐10 years)
SR 50 Ridge Manor ‐ 625307P CSX $ 22M Mid‐term (6‐10 years)
Causeway Boulevard Crossing ‐ East of US 41 CSX $ 22M Mid‐term (6‐10 years)
SE 144th Street (Mullins Grade)/Starke Crossing CSX $ 20M Mid‐term (6‐10 years)
US 41 Crossing ‐ South of Causeway Blvd CSX $ 18M Mid‐term (6‐10 years)

Florida’s Highway‐Rail Grade Crossing Safety Action Plan Page 29
Table 16. Grade Separation Projects (Mid‐to‐Long Term)
Project Name Owner Cost
Estimate Timeframe
West Granada Avenue (SR 40) Crossing CSX $ 45M Mid‐to‐long (11‐20 years)
West Colonial Drive (SR 50) Crossing CSX $ 50M Mid‐to‐long (11‐20 years)
SFRC Rail/Arterial Grade Separations SFRTA $ 240M Mid‐to‐long (11‐20 years)
Park Road ‐ 6243139 CSX $ 90M Mid‐to‐long (11‐20 years)
US 41/50th Street ‐ 624368C CSX $ 90M Mid‐to‐long (11‐20 years)
SR 200 (A1A)/Yulee Crossing CSX $ 60M Mid‐to‐long (11‐20 years)
SR 60, W Lake Wales CSX $ 55M Mid‐to‐long (11‐20 years)
CR 28 (Wells Road)/Orange Park Crossing CSX $ 50M Mid‐to‐long (11‐20 years)
SR 224 (Kingsley Ave)/Orange Park Crossing CSX $ 50M Mid‐to‐long (11‐20 years)
Nine Mile Road (SR 10) Crossing CSX $ 45M Mid‐to‐long (11‐20 years)
SR 60, W of Mulberry CSX $ 40M Mid‐to‐long (11‐20 years)
SR 676/Causeway Blvd. ‐ 624815B CSX $ 38M Mid‐to‐long (11‐20 years)
Indiantown Road (SR 706) Crossing FEC $ 30M Mid‐to‐long (11‐20 years)
Okeechobee Boulevard (SR 704) Crossing CSX $ 30M Mid‐to‐long (11‐20 years)
Forest Hill Boulevard (SR 882) Crossing CSX $ 30M Mid‐to‐long (11‐20 years)
Atlantic Avenue (SR 806) Crossing CSX $ 30M Mid‐to‐long (11‐20 years)
SE Yamato Road (SR 794) Crossing CSX $ 30M Mid‐to‐long (11‐20 years)
Commercial Boulevard (SR 870) Crossing CSX $ 30M Mid‐to‐long (11‐20 years)
Hollywood Boulevard (SR 820) Crossing CSX $ 30M Mid‐to‐long (11‐20 years)
NW 36th Street/Sample R (SR 834) Crossing CSX $ 24M Mid‐to‐long (11‐20 years)
NW 62nd/Cypress C Crossing CSX $ 23M Mid‐to‐long (11‐20 years)
Copans Road Crossing CSX $ 20M Mid‐to‐long (11‐20 years)
Atlantic Boulevard (SR 814) Crossing CSX $ 18M Mid‐to‐long (11‐20 years)
Table 17. Grade Separation Projects (Long term)
Project Name Owner Cost
Estimate Timeframe
West Lake Mary B. (CR 4220) Crossing CSX $ 45M More than 20 years
SR 434 Crossing CSX $ 45M More than 20 years
SR 436/Altamonte Crossing CSX $ 45M More than 20 years
East Maitland Avenue (CR 427) Crossing CSX $ 45M More than 20 years
West Lyman Avenue Crossing CSX $ 45M More than 20 years
South Orlando Avenue (SR 15) Crossing CSX $ 45M More than 20 years
CR 54 (CR 54) Crossing ‐ 622845L CSX $ 40M More than 20 years
CR 54 (CR 54) Crossing ‐ 622851P CSX $ 40M More than 20 years
Alexander Street (CR 39A) Crossing CSX $ 40M More than 20 years
Parsons Avenue Crossing CSX $ 40M More than 20 years
SR 599/50th Street (SR 599) Crossing CSX $ 40M More than 20 years
Hillsborough Avenue (SR 600) Crossing CSX $ 40M More than 20 years
SR 60/Adamo Drive ‐ 624820X CSX $ 100M More than 20 years

Florida’s Highway‐Rail Grade Crossing Safety Action Plan Page 30
SR 60/Brandon Boulevard ‐ 624551H CSX $ 94M More than 20 years
Faulkenburg Road ‐ 624359D CSX $ 90M More than 20 years
Faulkenburg Road ‐ 624462R CSX $ 90M More than 20 years
SR 104 (Busch Drive)/ Jacksonville Crossing CSX $ 80M More than 20 years
S Main Street (SR 85) Crossing CSX $ 40M More than 20 years
SR 60/Hopewell ‐ 624572H CSX $ 35M More than 20 years
Magnolia Avenue Crossing CSX $ 30M More than 20 years
Northlake Boulevard (CR 809) Crossing FEC $ 30M More than 20 years
Belvedere Road Crossing FEC $ 30M More than 20 years
Woolbright Road Crossing FEC $ 30M More than 20 years
Linton Boulevard Crossing FEC $ 30M More than 20 years
Yamato Road (SR 794) Crossing FEC $ 30M More than 20 years
Palmetto Park (SR 811) Crossing FEC $ 30M More than 20 years
Hillsboro Boulevard (SR 810) Crossing FEC $ 30M More than 20 years
Sample Road (SR 834) Crossing FEC $ 30M More than 20 years
Atlantic Boulevard (SR 814) Crossing FEC $ 30M More than 20 years
Commercial Boulevard (SR 870) Crossing FEC $ 30M More than 20 years
Oakland Park Boulevard (SR 816) Crossing FEC $ 30M More than 20 years
Sunrise Boulevard (SR 838) Crossing FEC $ 30M More than 20 years
W Broward Boulevard (SR 842) Crossing FEC $ 30M More than 20 years
SW 24th Street/SR 84 (SR 84) Crossing FEC $ 30M More than 20 years
Miramar Parkway (SR 858) Crossing FEC $ 30M More than 20 years
Glades Road (SR 808) Crossing FEC $ 30M More than 20 years
McNab Road Crossing CSX $ 30M More than 20 years
NW 33rd Street Crossing CSX $ 30M More than 20 years
North Lake Boulevard (CR 809A) Crossing CSX $ 30M More than 20 years
Palm Beach Lake Boulevard Crossing CSX $ 30M More than 20 years
Belvedere Road Crossing CSX $ 30M More than 20 years
Linton Boulevard Crossing CSX $ 30M More than 20 years
Palmetto Park (CR 798) Crossing CSX $ 30M More than 20 years
Oakland Park Boulevard (SR 816) Crossing CSX $ 30M More than 20 years
New Griffin Road (SR 818) Crossing CSX $ 30M More than 20 years
Stirling Road (SR 848) Crossing CSX $ 30M More than 20 years
Pembroke Road (SR 824) Crossing CSX $ 30M More than 20 years
Hallandale Beach (SR 858) Crossing CSX $ 30M More than 20 years
Hillsboro Boulevard (SR 810) Crossing CSX $ 21M More than 20 years
Florida’s Highway‐Rail Grade Crossing Safety Action Plan Page 31
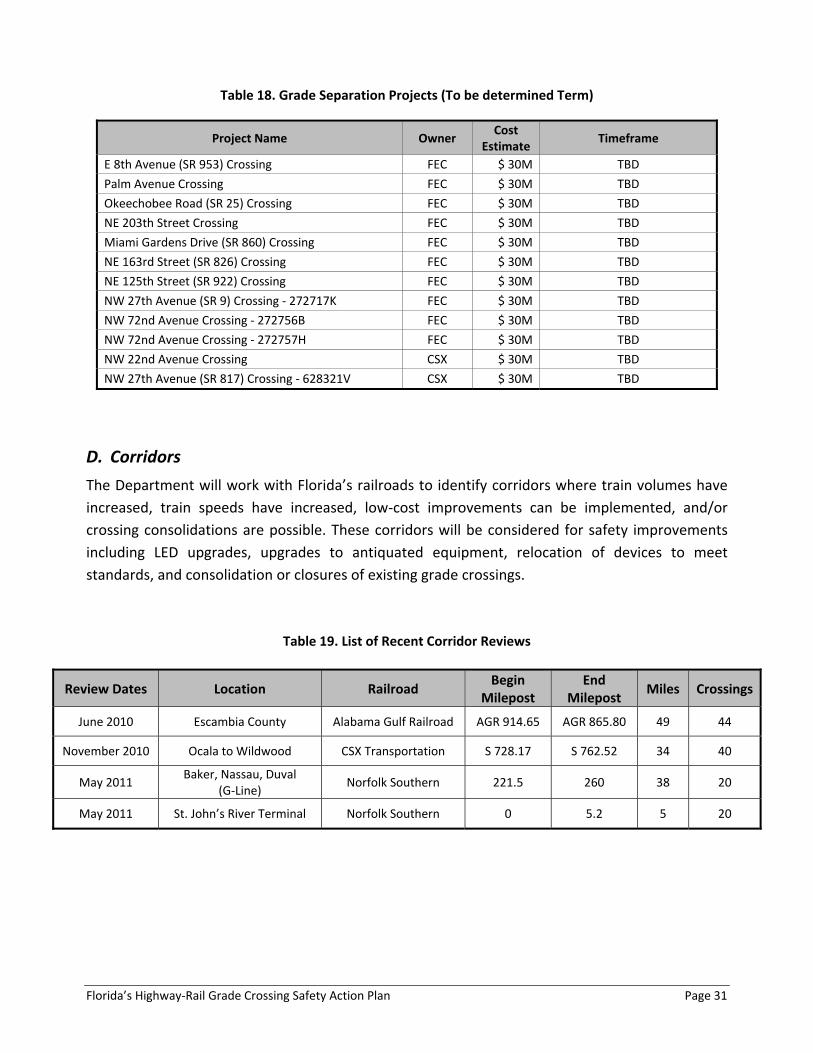
Table 18. Grade Separation Projects (To be determined Term)
Project Name Owner Cost
Estimate Timeframe
E 8th Avenue (SR 953) Crossing FEC $ 30M TBD
Palm Avenue Crossing FEC $ 30M TBD
Okeechobee Road (SR 25) Crossing FEC $ 30M TBD
NE 203th Street Crossing FEC $ 30M TBD
Miami Gardens Drive (SR 860) Crossing FEC $ 30M TBD
NE 163rd Street (SR 826) Crossing FEC $ 30M TBD
NE 125th Street (SR 922) Crossing FEC $ 30M TBD
NW 27th Avenue (SR 9) Crossing ‐ 272717K FEC $ 30M TBD
NW 72nd Avenue Crossing ‐ 272756B FEC $ 30M TBD
NW 72nd Avenue Crossing ‐ 272757H FEC $ 30M TBD
NW 22nd Avenue Crossing CSX $ 30M TBD
NW 27th Avenue (SR 817) Crossing ‐ 628321V CSX $ 30M TBD
D. Corridors
The Department will work with Florida’s railroads to identify corridors where train volumes have
increased, train speeds have increased, low‐cost improvements can be implemented, and/or
crossing consolidations are possible. These corridors will be considered for safety improvements
including LED upgrades, upgrades to antiquated equipment, relocation of devices to meet
standards, and consolidation or closures of existing grade crossings.
Table 19. List of Recent Corridor Reviews
Review Dates Location Railroad Begin
Milepost End
Milepost Miles Crossings
June 2010 Escambia County Alabama Gulf Railroad AGR 914.65 AGR 865.80 49 44
November 2010 Ocala to Wildwood CSX Transportation S 728.17 S 762.52 34 40
May 2011 Baker, Nassau, Duval
(G‐Line) Norfolk Southern 221.5 260 38 20
May 2011 St. John’s River Terminal Norfolk Southern 0 5.2 5 20

Florida’s Highway‐Rail Grade Crossing Safety Action Plan Page 32
Table 20. List of Potential Corridor Projects
E. Pedestrian Issues and American with Disabilities Act (ADA)
During Diagnostic Field Reviews in 2009, the Department surveyed thirty crossings for ADA
accessibility issues along with the standard highway‐rail review items. Five areas of improvement
were identified and reviewed with the Federal Highway Administration – Florida Division:
1. Sidewalk ends near the crossing with sidewalk connecting to the roadway
2. Sidewalk passes through the crossing but connection outside the railroad right‐of‐way is
incomplete/impassible
3. Sidewalk ends abruptly short of the crossing often at the railroad right‐of‐way
4. Large gap greater than 3” ADA standard for freight rail within the crossing surface
5. Confusing pedestrian crossings occurring with multiple crossings in close proximity at
different angles can also include substantial grade changes
In December 2009, the Federal Railroad Administration, the Federal Highway Administration –
Florida Division, and the Department met to field review pedestrian issues and discuss possible
solutions. Possible solutions to each issue are as follows:
1. Connection to the roadway is an acceptable application in a rural area as the ADA allows
the pedestrian way to be the roadway as confirmed by the US Access Board. To be
effective, signage should be placed where there is an alternate route available.
Location Railroad Begin
Milepost End
Milepost Miles Crossings
Gadsden County to Liberty County
Apalachicola Northern AN 88.80 AN 40.50 48 34
Jackson County BayLine M 65.48 M 35.08 30 30
Clearwater, Pinellas County
CSX Transportation SY 871.26 ARE 898.10 27 59
Dade City, Sumter County to Hernando County
CSX Transportation S 769.72 S 791.82 22 18
Dade Co., South Miami to Homestead
CSX Transportation SXH 1044.30 SXH 1066.55 22 32
Ybor City, Hillsborough County
CSX Transportation A 866.52 A 889.90 23 10
Lake Co., Tavares to Mt. Dora
Florida Central ATA 822.20 ATA 786.85 35 25
Polk Co., Lake Wales to Frostproof
Florida Midland AVC 843.59 AVC 857.89 14 30
Alachua County Florida Northern AR 716.88 AR 741.36 24 21
Marcy ,Martin Co. to Belle Glade ,Palm Bch Co.
South Central Florida Express
BY 26.49 BY 58.97 32 12

Florida’s Highway‐Rail Grade Crossing Safety Action Plan Page 33
2. Work with local governments to improve connections outside the railroad right‐of‐way.
3. Completion of the missing segment will require cooperation from the local agency and the
railroad. The railroad will likely perform the improvements with the funding coming from
the local government.
4. The gap between the rail and crossing panel can been filled as long as the crossing
maintains a permissible change in level.
5. Advanced signage some distance back that might reroute pedestrians away from
inadequate highway‐rail grade crossings.
The Department continues to include ADA accessibility reviews as part of diagnostic field reviews.
In addition, the Department is considering identifying a section of rail and performing a
comprehensive review of all crossings within a jurisdiction for ADA issues. This way, the
Department could ensure that all issues in an area are identified and then issues can be ranked in
order of importance (pedestrian traffic, area characteristics, travel pattern). This process will
allow local funding to be efficiently spent on the most important issues first.
In case of a complaint in the state, the Federal Highway Administration – Florida Division has
developed a Calling Tree that can be activated in the event of an issue in order to contact the
correct people for action, follow‐up, and information. If the crossing is only for private or for
pedestrian access, the Department has no jurisdiction because the crossing does not involve a
public roadway.
The Department has solid relationships with Florida’s rail companies. The Department would like
FRA/AASHTO to develop national standards for railroad companies related to ADA issues, stressing
that local or state requests for improved pedestrian access at crossings be more easily
implemented.
The Federal Highway Administration – Florida Division will continue to educate local governments
(sub‐recipients) on:
the responsibilities for monitoring facilities and rights of way;
the responsibilities under ADA;
the decision to end sidewalks before a railroad crossing does not provide acceptable access
and turning pathways into the roadway may be unsafe and unreasonable;
the importance of full inspection; and
the importance of the Department reviewing roadway improvement plans.

Florida’s Highway‐Rail Grade Crossing Safety Action Plan Page 34
F. Research And Analysis Through Data Improvements
The Department works on a continuous basis to improve the state’s highway‐rail crossing
inventory. Starting in August 2010, the Department initiated a new consultant contract to assist
collecting new data related to the state’s rail crossings. The initial effort focused on the use of
Geographic Information Systems (GIS) to verify and correct the rail line network data. Next
highway‐rail grade crossing locations were mapped and verified using information from aerial
photography, Departmental data, railroad partner data, and the FRA. In addition, efforts will be
made to reconcile any differences in the grade crossing inventory databases of the FRA, the
Department and the railroads.
The Department will then collect as many data elements as possible using available resources in
the office environment before finally collecting the remaining data through field data collection.
The Department is also creating a new user website interface for the state’s database which will
allow railroad partners to review information, provide updates, and connect to other information
systems (data, maps, agreements, and photos).
The Department continues to research and implement new innovations and technologies whenever available and cost effective. Some of these promising technologies (Texas Modified Median Barrier Curb/Florida’s 6 inch barrier curb, Four Quadrant Gate Systems, Video Monitoring) require additional research and/or funding.
G. Public Education And Awareness Programs: Operation Lifesaver
The Department will continue to focus on public education through the Operation Lifesaver
program. Florida Operation Lifesaver seeks to continue and expand its public education efforts
through the following:
Developing and airing public service announcements, directed toward target audiences;
Continuing to educate and expand volunteer recruitment through the Florida Operation
Lifesaver website and social networking tools such as Facebook and Twitter;
Expanding educational events during Train Safety Awareness Week (TSAW) and
International Level Crossing Awareness Day;
Promoting active enforcement of traffic laws related to highway‐rail grade crossings and on
railroad right of way; and
Improving driver and pedestrian behavior at railroad crossings by encouraging compliance
with traffic laws relating to crossing signs and signals.
Florida’s Highway‐Rail Grade Crossing Safety Action Plan Page 35
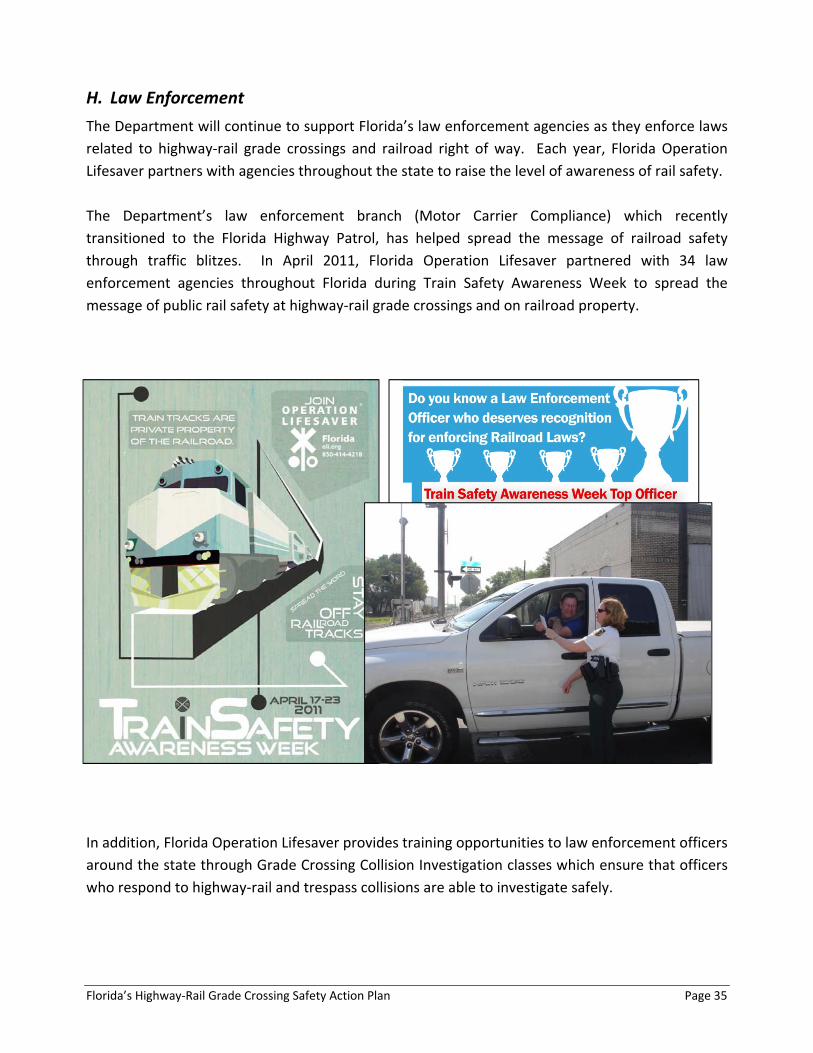
H. Law Enforcement
The Department will continue to support Florida’s law enforcement agencies as they enforce laws
related to highway‐rail grade crossings and railroad right of way. Each year, Florida Operation
Lifesaver partners with agencies throughout the state to raise the level of awareness of rail safety.
The Department’s law enforcement branch (Motor Carrier Compliance) which recently
transitioned to the Florida Highway Patrol, has helped spread the message of railroad safety
through traffic blitzes. In April 2011, Florida Operation Lifesaver partnered with 34 law
enforcement agencies throughout Florida during Train Safety Awareness Week to spread the
message of public rail safety at highway‐rail grade crossings and on railroad property.
In addition, Florida Operation Lifesaver provides training opportunities to law enforcement officers
around the state through Grade Crossing Collision Investigation classes which ensure that officers
who respond to highway‐rail and trespass collisions are able to investigate safely.
Florida’s Highway‐Rail Grade Crossing Safety Action Plan Page 36
1 The Office of Policy Planning of the Florida Department of Transportation and the Center for Urban Transportation
Research at the University of South Florida, TRAVEL DEMAND: Population Growth and Characteristics (August 2010),
1‐30.
2 The Office of Policy Planning of the Florida Department of Transportation and the Center for Urban Transportation
Research at the University of South Florida, TRAVEL DEMAND: Visitors and Tourists (November 2008), 1.
3VISIT FLORIDA®, VISIT FLORIDA Research, http://media.visitflorida.org/research.php
4 Florida Department of Transportation, The Florida Rail System Plan: Investment Element (December 2010).
5 Florida Department of Transportation Seaport Office and Florida Ports Council, A Five‐Year Plan to Achieve the
Mission of Florida’s Seaports: 2007/2008‐2011/2012 (2008).
6 Florida Department of Transportation, Rail Highway Crossing Inventory (as of July 2011).
7 Association of American Railroads, Raise the Grade on Grade Crossing Safety (April 2010).
8 Federal Railroad Administration, Highway‐Rail Crossing Program Summary (as of December 2, 2010),
http://www.fra.dot.gov/Pages/86.shtml
9 The Florida Legislature, 2010 Florida Statutes,
http://www.leg.state.fl.us/STATUTES/index.cfm?App_mode=Display_Statute&URL=0300‐
0399/0335/0335ContentsIndex.html
10 United States Census, Summary: 2000 – 2000 Census of Population and Housing (April 2004), , Table 17. Area
Measurements: 2000; and Population and Housing Unit Density: 1980 to 2000.
11 United States Department of Transportation, Bureau of Transportation Statistics, State Transportation Statistics –
2009 (2008), Table 5‐3: Highway Vehicle‐Miles Traveled (VMT):2003.
12 Federal Railroad Administration, Office of Safety Analysis, Highway‐Rail Crossing Accident/Incident data (current
through the end of September 30, 2010), http://safetydata.fra.dot.gov/officeofsafety/