Embed Size (px)
Citation preview

Highway 53 Relocation: Economic Impact Study
Economic Impact AnalysisStudy Findings and Conclusions
November 7, 2013

Presentation Outline
• Study Objectives
• Study Scope and Tasks
• Service Provider Coordination
• Economic Analysis

• Determine impact of the project alternatives on the local and regional economies
• Engage stakeholders to understand the range of issues
• Provide a comprehensive economic impact analysis to include in the EIS
Study Objectives

• Stakeholder Outreach
• Data Collection
• Economic Impact Analysis
• Documentation
Study Scope and Tasks

W1A

• Stakeholders– Municipalities– Emergency Services– School Districts
• Outreach and Coordination– June 18th Coordination Meeting– Data Collection follow-up
Service Provider Stakeholder Coordination

• Implementation of Alternative W1-A would introduce very substantial adverse impacts to roadway dependent operations including fire and rescue, school bus operations, and municipal maintenance activities
• There are no substantive operational impacts associated with the remaining “build” alternatives
Overall Conclusions

• Virginia – $21 million in capital expenditures
• Virginia Emergency Services - $3.8 million capital and $2.0 million additional annual operations
• Eveleth – $28,000 additional annual costs
• Virginia Schools – $1.6 million additional annual costs
• Eveleth-Gilbert Schools – $66,000 additional annual operational costs
Stakeholder Financial Impacts

• City of Virginia - businesses located on the existing Highway 53 corridor are at significant risk if the westerly route is selected;
• City of Eveleth – loss of mutual aid services with Virginia;
• City of Gilbert – increased ambulance service time to Virginia hospital and loss of water interconnect with Virginia;
Other Stakeholder Impacts

Other Stakeholder Impacts (cont…)• City of Biwabik – increased travel time for
commuters and shoppers to Virginia and long term land development impacts because of increased distance to Virginia
• City of Hoyt Lakes – increased ambulance service time to Virginia hospital (Duluth might become primary destination)
• Virginia and Eveleth-Gilbert Schools - schools transport children among the various communities. Increased travel time will put shared services programs at risk

DISTANCE AND TRAVEL TIMES FROM NEW HIGHWAY 53 INTERSECTION IN VIRGINIATO EAST IRON RANGE CITIES
Current 2017-2023 2024-2037Town Miles Minutes Miles Minutes Miles Minutes
Midway 2.4 2:45 11.1 13:30 18.3 21:15Eveleth 4.3 4:45 9.2 11:30 17.4 19:15Gilbert 5.5 6:30 12.8 17:00 21.3 24:45McKinley 8.8 12:15 16.7 22:30 25.2 29:15Biwabik 12.2 15:30 20.1 25:45 28.6 33:30Giants Ridge 17.7 22:45 25.8 32:45 34.3 40:30Aurora 17.5 22:15 25.6 32:15 34.1 40:00Hoyt Lakes 22.7 30:15 30.6 40:15 39.1 48:00
Source: McComb Group, Ltd.

Highway 53 Travelsheds

TRAVELSHED DEMOGRAPHIC CHARACTERISTICS; 2011 ESTIMATES
MedianHousehold
Travelshed Number Percent Number Percent Income
Virginia 7,408 9.5 % 3,722 10.3 % 36,003$ A 14,757 18.9 6,762 18.7 40,281 B 2,716 3.5 1,214 3.4 42,769 C-1 1,906 2.4 810 2.2 47,139 C-2 20,050 25.7 9,062 25.1 37,846 D 15,010 19.2 6,872 19.1 39,011 E 16,199 20.8 7,629 21.1 42,367
Total/Average 78,046 100.0 % 36,071 100.0 % 39,665$
Source: Scan/US and McComb Group, Ltd.
Population Households

HIGHWAY 53 CUSTOMER SPOTTING; JULY 2013VIRGINIA BUSINESSES
CUSTOMER RESIDENCY BY TRAVELSHED
MedicalTravelshed Center*
Virginia 23.4 % 28.9 % 34.4 % 36.4 %A 28.5 20.8 25.4 37.8 B 3.9 5.8 2.1 0.4 C-1 3.1 0.3 2.1 2.8 C-2 5.4 5.5 3.7 1.0 D 14.3 11.3 10.5 8.2 E 12.1 20.2 18.8 12.3
Total 90.7 % 92.8 % 97.1 % 98.8 %Inflow 9.3 % 7.2 % 2.9 % 1.2 %
Total 100.0 % 100.0 % 100.0 % 100.0 %
* Zip code data.Note: Totals may not add due to rounding.Source: McComb Group, Ltd.
Thunderbird Downtown Northgate

VIRGINIA ESTIMATED RETAIL SALES, SALES TRANSFER, AND LOST JOBS; 2017 AND 2024(In Thousands of Dollars)
Estimated Percent LostArea Sales Percent Sales Dollars of Sales Jobs
2017Thunderbird 243,620$ 35% 84,090$ 19,711$ 8.1% 148.3 Downtown 73,290 28% 20,369 5,386 7.3% 63.9 Northgate 193,985 33% 64,192 12,138 6.3% 129.3 Other 50,035 30% 15,011 4,423 8.8% 30.0 Total 560,930$ 33% 183,661$ 41,657$ 7.4% 371.6
2024Thunderbird 279,846$ 35% 96,594$ 44,849$ 16.0% 333.7 Downtown 84,188 28% 23,398 12,050 14.3% 141.8 Northgate 222,831 33% 73,737 28,259 12.7% 302.1 Other 57,475 30% 17,243 9,686 16.9% 65.7 Total 644,340$ 33% 210,972$ 94,845$ 14.7% 843.3
Source: McComb Group, Ltd.
Sales TransferA & B Travelshed

HIGHWAY 53 CUSTOMER SPOTTING; JULY 2013EVELETH BUSINESSES
CUSTOMER RESIDENCY BY TRAVELSHED
Travelshed
Virginia 10.6 %A 28.2 B 6.5 C-1 1.6 C-2 10.6 D 7.2 E 10.1
Total 74.7 %Inflow 25.3 %
Total 100.0 %
Note: Totals may not add due to rounding.Source: McComb Group, Ltd.
Eveleth

EVELETH ESTIMATED RETAIL SALES, SALES TRANSFER, AND LOST JOBS; 2017 AND 2024(In Thousands of Dollars)
Estimated Percent LostYear Sales Percent Sales Dollars of Sales Jobs
2017 87,175$ 34% 29,884$ 9,193$ 10.5% 76.0 2024 100,138 34% 34,328 20,116 20.1% 154.4
Source: McComb Group, Ltd.
Virginia, Sales TransferD & E Travelsheds

Travelshed Sales Percent Sales Percent Sales Percent
Virginia 5,820$ 28.0 % 2,288 10.5 % 378 11.2 %A 4,098 19.7 5,155 23.6 1,267 37.7 B 2,092 10.1 312 1.4 447 13.3 C 1,945 9.4 459 2.1 106 3.2 D 2,044 9.8 9,594 43.8 295 8.8 E 2,207 10.6 3,101 14.2 353 10.5 Inflow 2,556 12.3 982 4.5 517 15.4
Total 20,762$ 100.0 % 21,890$ 100.0 % 3,364$ 100.0 %
Source: McComb Group, Ltd.
PHASE II SURVEYBUSINESS SALES DERIVED FROM TRAVELSHEDS BY COMMUNITY
(Thousands of Dollars)
Virginia Eveleth Other East Range Cities

LODGING INDUSTRY OPERATING CHARACTERISTICS; 2012
Virgina/ Eveleth/Characteristic Mountain Iron Midway Total
Motels Surveyed 5 3 8 Total Rooms 269 91 360 Annual Room Nights 98,185 36,865 135,050 Occupied Room Nights 61,163 21,226 82,389 Average Occupancy Rate 62.3 % 57.6 % 61.0 %Average Daily Room Rate 89.76$ 58.50$ 81.71$ Business Percent 53.7 % 52.8 % 53.6 %Tourist and Other Percent 46.3 % 47.2 % 46.4 %Eestimated Employees 89 27 116
Source: McComb Group, Ltd.

ACTIVITY AND ATTRACTION ROOM NIGHTS
Type Number Percent Number Percent
General 14,067 57.5 % 3,184 51.7 %East Range 8,562 35.0 2,547 41.4 West Range 1,835 7.5 425 6.9 Total 24,464 100.0 % 6,156 100.0 %
Source: McComb Group, Ltd.
Virginia/Mountain Iron Eveleth/Midway

ESTIMATED INCREASED ANNUAL BUSINESS TRAVEL COST; 2017-2023 AND 2024-2037RESULTING FROM ALTERNATIVE W-1A
Weekly Cost CostTrip by Vehicle Trips 2017-2023 2024-2037
Virginia to Travelshed A 447 1,003,771.39$ 3,070,359.55$ Virginia to Travelshed B 226 299,158.39 299,158.39 Travelshed A to Virginia, Travelsheds D & E 646 1,454,802.34 4,449,983.62 Total 1,319 2,757,732.12$ 7,819,501.56$
Average per Business 34 70,711.08$ 200,500.04$ Estimated Businesses 650 650 650 Total 21,983 45,962,202.00$ 130,325,026.00$
Source: McComb Group, Ltd.
Annual Annual

ARROWHEAD TRANSITALTERNATIVE W-1A OPERATING IMPACTS
Item 2013-2023 2024-2037
Minutes Per Run 40 60
Daily Runs 338,000$ 507,000$ Weekly and Monthly 9,576 14,083 Weekend Runs 22,533 33,800 Total 370,109$ 554,883$
Source: Arrowhead Transit .

MESABI RANGE COMMUNITY AND TECHNICAL COLLEGESTUDENT PERMANENT RESIDENCE ZIP CODE BY TRAVELSHED; FALL 2012
College Students High School StudentsTravelshed Number Percent Number Percent
Virginia 288 19.5 % 87 20.9 %A 381 25.8 125 30.0 B 15 1.0 5 1.2 C-1 31 2.1 13 3.1 C-2 107 7.3 19 4.6 D 139 9.4 34 8.2 E 233 15.8 89 21.4 Inflow 280 19.0 44 10.6 Total 1,474 100.0 % 416 100.0 %
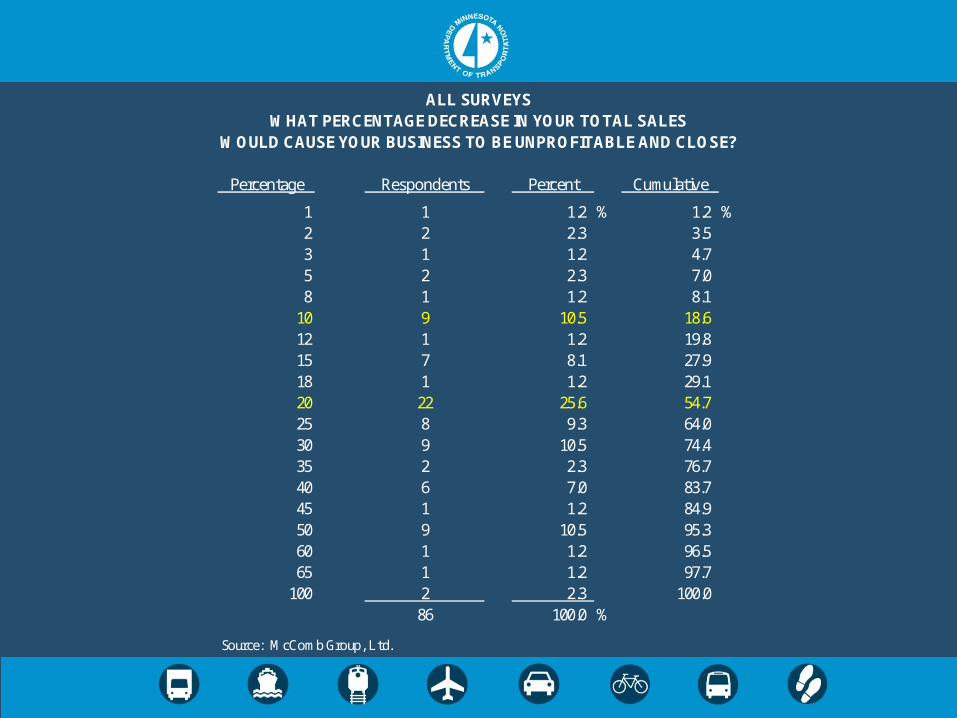
ALL SURVEYSWHAT PERCENTAGE DECREASE IN YOUR TOTAL SALES
WOULD CAUSE YOUR BUSINESS TO BE UNPROFITABLE AND CLOSE?
Percentage Respondents Percent Cumulative
1 1 1.2 % 1.2 %2 2 2.3 3.5 3 1 1.2 4.7 5 2 2.3 7.0 8 1 1.2 8.1
10 9 10.5 18.6 12 1 1.2 19.8 15 7 8.1 27.9 18 1 1.2 29.1 20 22 25.6 54.7 25 8 9.3 64.0 30 9 10.5 74.4 35 2 2.3 76.7 40 6 7.0 83.7 45 1 1.2 84.9 50 9 10.5 95.3 60 1 1.2 96.5 65 1 1.2 97.7
100 2 2.3 100.0 86 100.0 %
Source: McComb Group, Ltd.

TRAVELESHED A EMPLOYEE AGE DISTRIBUTION; 2011
Age Cohort Number Percent Number Percent
29 or Younger 1,454 20.9 % - - %30 to 54 3,883 55.8 2,427 62.5 55 or Older 1,621 23.3 1,621 100.0 Total 6,958 100.0 % 4,048 58.2 %
Virginia D & E 2,429 34.9 % 1,413 34.9 %
Source: U.S. Census and McComb Group, Ltd.
Estimated Retirements2012 to 2037Employees

ESTIMATED NEW EMPLOYEE POSITIONS; 2017-2037
Items Jobs
Employment GrowthIron Mining - Baseline Growth 847 Iron Mining - New Projects 4,200 Non-Ferrous Mining 1,363 Indirect and Induced 4,540 Total 10,950
Travelshed A Retirements 4,050 Total 15,000
Source: UMD and McComb Group, Ltd.
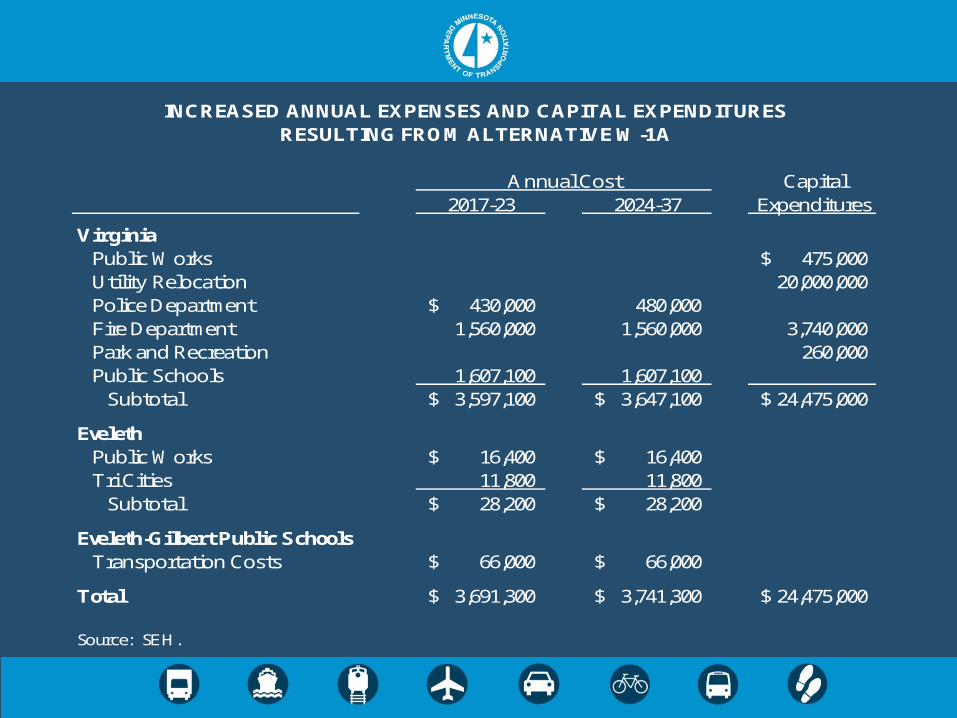
INCREASED ANNUAL EXPENSES AND CAPITAL EXPENDITURESRESULTING FROM ALTERNATIVE W-1A
Capital2017-23 2024-37 Expenditures
VirginiaPublic Works 475,000$ Utility Relocation 20,000,000 Police Department 430,000$ 480,000 Fire Department 1,560,000 1,560,000 3,740,000 Park and Recreation 260,000 Public Schools 1,607,100 1,607,100 Subtotal 3,597,100$ 3,647,100$ 24,475,000$
EvelethPublic Works 16,400$ 16,400$ Tri Cities 11,800 11,800 Subtotal 28,200$ 28,200$
Eveleth-Gilbert Public SchoolsTransportation Costs 66,000$ 66,000$
Total 3,691,300$ 3,741,300$ 24,475,000$
Source: SEH.
Annual Cost

INCREASED ANNUAL COSTSSELECTED IMPACT CATEGORIES
Impact Category 2017-23 2024-37
Employee Commuting Costs 13,256,060$ 22,292,756$ Business Increased Travel Costs 45,904,447 97,043,447 Arrowhead Transit Increased Costs 370,109 554,883 Toal 59,530,616 119,891,086
Virginia Lost Retail Sales 41,657,000 94,845,000 Eveleth Lost Retail Sales 9,193,000 20,116,000 Total 50,850,000$ 114,961,000$
Lost Retail JobsVirginia 372 843 Eveleth 76 154 Total 448 997
Source: McComb Group, Ltd.

Foreseeable additional impacts in Travelshed A communities resulting from the longer distance and travel times resulting from Alternative W-1A include:
• Employees living in Virginia and Travelshed D and some portions of Travelshed E will experience higher commuting costs.
• Employers will experience difficulty in retaining and attracting workers from Virginia and Travelsheds D and E.
• Convenience retail and services will experience short-term increase in business until declining population reduces demand.
• Businesses will experience higher costs to serve customers in Virginia and Travelsheds D and E.
• Reduced demand for housing and lower prices for existing homes.

• Higher commuting costs may cause workers to seek jobs closer to home.
• Increased travel costs for work, shopping, and other trips will reduce income for other household purchases.
• Residents and businesses that use St. Louis County services will experience longer travel times to government offices.
• St. Louis County will experience higher costs to provide services in the East Range area.
These are but a few of the economic and social impacts of Alternative W-1A on residents, businesses, and other entities in Travelshed A.