Embed Size (px)
DESCRIPTION
In the first decade of the 21st century, the NYC Department of Education implemented a set of large-scale and much debated high school reforms, which included closing large, low-performing schools, opening new small schools and extending high school choice to students throughout the district. The school closure process was the most controversial of these efforts. Yet, apart from the general sense that school closures are painful, there has never been a rigorous assessment of their impact in NYC.To begin to fill this gap, the Research Alliance undertook a study of the 29 low-performing high schools that were designated for closure in New York City between 2002 and 2008, looking particularly at the impact of these closures on students’ academic performance, attendance, and mobility.
Citation preview
High School Closures in New York City Impacts on Students’ Academic Outcomes, Attendance, and Mobility
BRIEF
James J. Kemple
November 2015
James J. Kemple
November 2015
Find this report online at: http://steinhardt.nyu.edu/research_alliance/publications/hs_closures_in_nyc
© 2015 Research Alliance for New York City Schools. All rights reserved. You may make copies of and distribute this work for non-commercial educational and scholarly purposes. For any other uses, including the making of derivative works, permission must be obtained from the Research Alliance for New York City Schools, unless fair use exceptions to copyright law apply.
BRIEF High School Closures in New York City: Impacts on Students’ Academic Outcomes, Attendance, and Mobility
1
Background Despite decades of concern about “dropout crises” and a “rising tide of mediocrity,” the turn of the 21st century was marked by nearly unchecked dismal performance in many of America’s large urban high schools. 1 In his seminal 2004 report, Johns Hopkins University researcher Robert Balfanz identified more than 2,000 “dropout factories” around the country—schools that were failing to graduate 40 percent (or more) of the 2.6 million students they were serving. This report singled out New York City as having the highest concentration of “dropout factories” in the nation.2
Over the next 10 years, however, New York City’s high schools improved dramatically. Between 2003 and 2011, for example, on-time graduation rates increased from 51 percent to 69 percent.3 This growth was concentrated among students earning the newly mandated New York State Regents diploma, which required passing five academic subject assessments, in addition to completing 44 course credits. Notably, college enrollment rates during this period kept pace with the increasing number of high school graduates.4
Among the forces behind these trends were a set of sweeping and interconnected high school reforms that the New York City Department of Education (NYC DOE) implemented at an unprecedented pace and scale. These reforms were anchored in closing large, persistently low-performing high schools, opening new small schools, and extending high school choice to all students throughout the district. By implementing these changes together, district leaders hoped to upgrade the educational options available to students who had historically been assigned to failing schools, largely by virtue of where they lived.
The high school closure process was the most politically charged feature of the reform effort. As in other cities around the country, school closures in New York sparked lawsuits and protests, with advocates arguing that the district had not invested enough in school improvement efforts, and that students would be harmed by the elimination of an important neighborhood institution. Students enrolled in schools designated for closure were often described in the press as casualties—bearing the brunt of persistent school failure and having their lives further disrupted when officials decided to close their school. The NYC DOE elected to close high schools by “phasing them out” over time, which prompted one journalist to describe a “purgatory of schools marked for closing,” with “elective classes and after-school programs falling away” and “favorite teachers seeking new jobs.”5
2 HIGH SCHOOL CLOSURES IN NYC
Yet, apart from the general sense that closure policies are controversial and painful, there has never been a rigorous assessment of the impact of school closures in New York City. In fact, even nationally, few studies have looked what actually happens to students during and after a performance-based high school closure. Does the closure process harm students who are enrolled in a school while it is being phased out? Are future cohorts of high school students better off because a low-performing option has been eliminated? Do they attend better schools and have better outcomes as a result of the closure? Surprisingly, until now, there has been almost no rigorous evidence on these questions.
To begin filling this gap, the Research Alliance conducted a study of the high school closures that were undertaken between 2002 and 2008 in New York City public schools. Our analyses focused on the students who were enrolled in the schools as they were being phased out—and on the subsequent cohort of students who were forced to choose another high school when their most likely option was closed. The study examined the degree to which the closure policy affected a range of outcomes for these students, including mobility, attendance, and performance. This brief summarizes key findings and implications from the study. A longer technical report, available on our website, provides detailed information about the context, samples, data sources, methods, and statistical results that underlie our findings.
Were the high schools designated for closure, in fact, the lowest-performing high schools in the City?
Between 2002 and 2008, the NYC DOE designated 29 low-performing high schools for closure. The process for identifying and implementing school closures became more codified over time, eventually incorporating multiple measures of school performance as well as documentation of school improvements made and action plans going forward. However, during the period covered by this study, the district was frequently critiqued for making closure decisions in a manner that was opaque and unregulated.6 Given this ambiguity, we set out to analyze the historical performance of the schools designated for closure relative to other schools in the district.
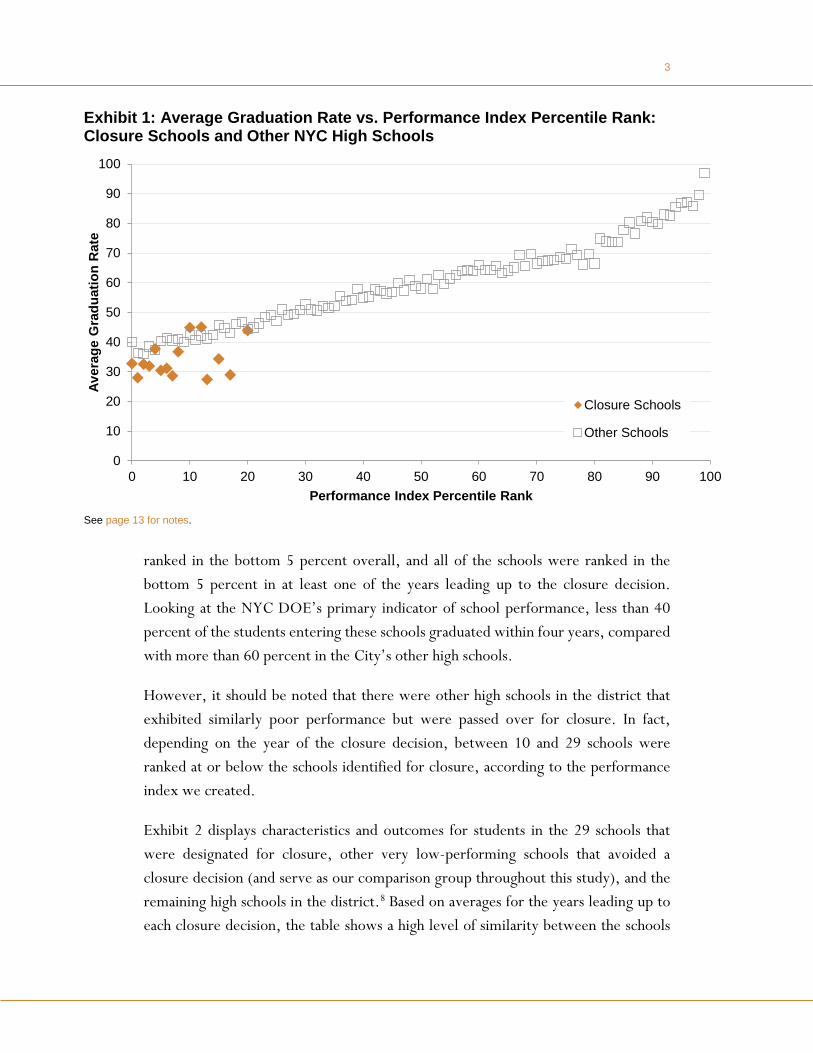
Our analyses showed that, based on a wide range of indicators, the 29 schools designated for closure were consistently among the lowest-performing high schools in the City. Exhibit 1 shows that none of these schools were ranked above the 20th percentile citywide, based on a composite of 10 performance indicators averaged over four years prior to the closure decision.7 A majority of the schools were
3
ranked in the bottom 5 percent overall, and all of the schools were ranked in the bottom 5 percent in at least one of the years leading up to the closure decision. Looking at the NYC DOE’s primary indicator of school performance, less than 40 percent of the students entering these schools graduated within four years, compared with more than 60 percent in the City’s other high schools.
However, it should be noted that there were other high schools in the district that exhibited similarly poor performance but were passed over for closure. In fact, depending on the year of the closure decision, between 10 and 29 schools were ranked at or below the schools identified for closure, according to the performance index we created.
Exhibit 2 displays characteristics and outcomes for students in the 29 schools that were designated for closure, other very low-performing schools that avoided a closure decision (and serve as our comparison group throughout this study), and the remaining high schools in the district.8 Based on averages for the years leading up to each closure decision, the table shows a high level of similarity between the schools
Exhibit 1: Average Graduation Rate vs. Performance Index Percentile Rank: Closure Schools and Other NYC High Schools
See page 13 for notes.
0
10
20
30
40
50
60
70
80
90
100
0 10 20 30 40 50 60 70 80 90 100
Aver
age
Gra
duat
ion
Rat
e
Performance Index Percentile Rank
Closure Schools
Other Schools

4 HIGH SCHOOL CLOSURES IN NYC
designated for closure and the other low-performing schools, particularly in terms of entering students’ prior attendance and test scores and their receipt of special education and English language learning services. Students in the schools designated
Exhibit 2: Historical Characteristics and Outcomes: Closure Schools, Comparison Schools, and Other Schools
Closure Schools
Comparison Schools
Other NYC High Schools
Demographic Characteristics of Incoming 9th Graders
Gender (%)
Female 47.7 44.9 0.0 52.6 *
Male 52.3 55.1 0.0 47.4 *
Ethnicity (%)
Latino 38.4 50.4 * 42.0 0 Black 53.8 40.0 * 37.4 *
White 1.8 3.7 0.0 10.7 * Asian 5.2 5.0 0.0 9.0 0 Other 0.8 0.8 0.0 1.0 0
Prior Performance and Characteristics of Incoming 9th Graders
School Services (8th grade) (%)
Eligible for free or reduced price lunch 65.1 69.9 0.0 60.8 Received English language learning services 11.2 13.5 0.0 9.6 Received special education services 10.0 10.4 0.0 9.5
8th Grade Performance (%) 0.0 Attendance rate 85.6 86.6 0.0 90.3 * Chronic absentee 46.0 43.9 0.0 29.1 * ELA or math in bottom 20% 43.9 41.0 0.0 26.4 *
Overage for grade 9 44.8 41.8 28.1 *
High School Outcomes (9th-12th Grades)
On track at end of 9th grade (%) 11.6 13.3 # 34.3 *
Average attendance rate (%) 76.3 75.7 0 84.1 *
Cumulative credits earned 25.7 25.8 0 34.2 *
Graduation rate (%) 38.7 36.8 # 60.6 *
Diploma Type
Regents diploma (%) 16.8 19.1 # 38.4 *
Local diploma (%) 22.6 19.8 # 24.1 0
Number of Schools Per Closure Decision Year 2-8 3-9 153-290 Number of Students Per Closure Decision Year 3,378-12,692 7,799-19,514 150,000-256,687
See page 13 for notes.
5
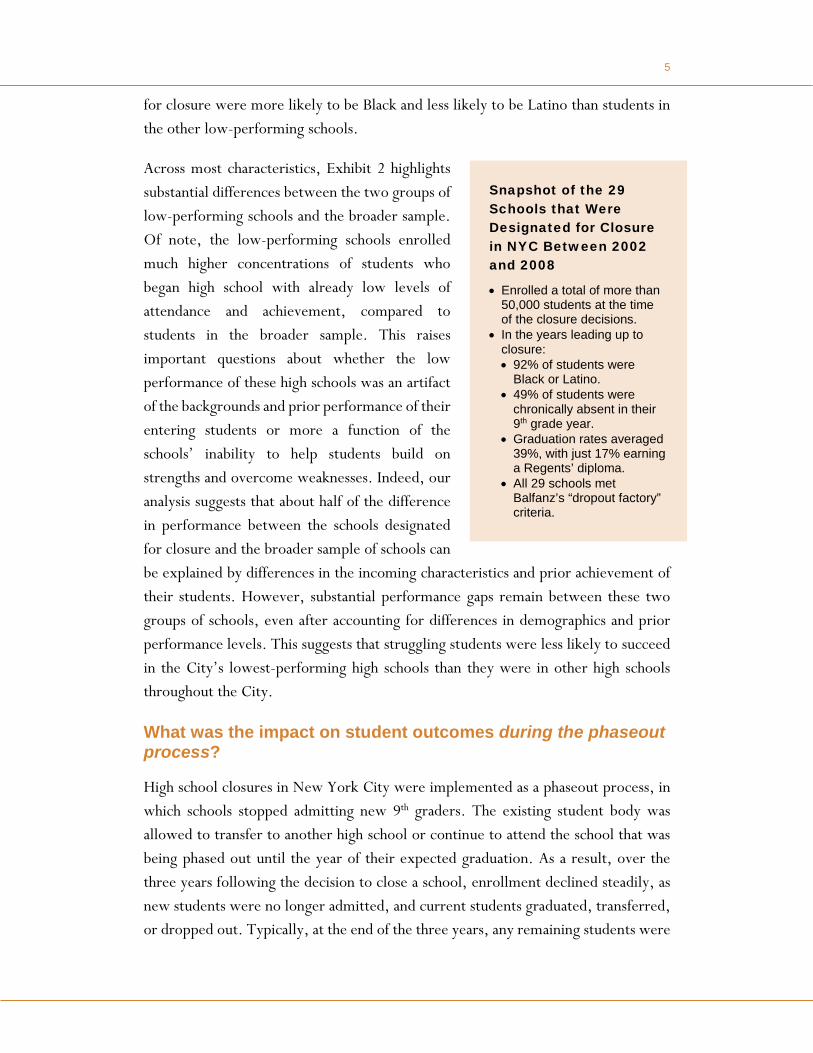
for closure were more likely to be Black and less likely to be Latino than students in the other low-performing schools.
Across most characteristics, Exhibit 2 highlights substantial differences between the two groups of low-performing schools and the broader sample. Of note, the low-performing schools enrolled much higher concentrations of students who began high school with already low levels of attendance and achievement, compared to students in the broader sample. This raises important questions about whether the low performance of these high schools was an artifact of the backgrounds and prior performance of their entering students or more a function of the schools’ inability to help students build on strengths and overcome weaknesses. Indeed, our analysis suggests that about half of the difference in performance between the schools designated for closure and the broader sample of schools can be explained by differences in the incoming characteristics and prior achievement of their students. However, substantial performance gaps remain between these two groups of schools, even after accounting for differences in demographics and prior performance levels. This suggests that struggling students were less likely to succeed in the City’s lowest-performing high schools than they were in other high schools throughout the City.
What was the impact on student outcomes during the phaseout process?
High school closures in New York City were implemented as a phaseout process, in which schools stopped admitting new 9th graders. The existing student body was allowed to transfer to another high school or continue to attend the school that was being phased out until the year of their expected graduation. As a result, over the three years following the decision to close a school, enrollment declined steadily, as new students were no longer admitted, and current students graduated, transferred, or dropped out. Typically, at the end of the three years, any remaining students were
Snapshot of the 29 Schools that Were Designated for Closure in NYC Between 2002 and 2008
• Enrolled a total of more than 50,000 students at the time of the closure decisions.
• In the years leading up to closure: • 92% of students were
Black or Latino. • 49% of students were
chronically absent in their 9th grade year.
• Graduation rates averaged 39%, with just 17% earning a Regents’ diploma.
• All 29 schools met Balfanz’s “dropout factory” criteria.
6 HIGH SCHOOL CLOSURES IN NYC
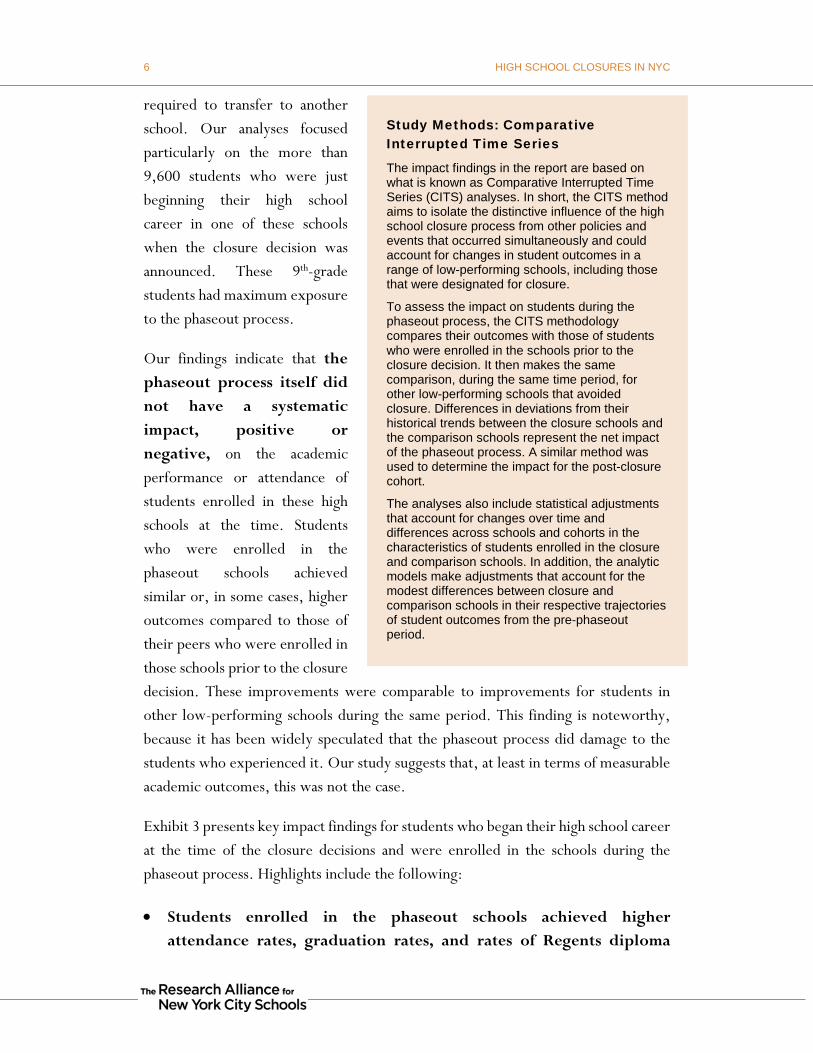
required to transfer to another school. Our analyses focused particularly on the more than 9,600 students who were just beginning their high school career in one of these schools when the closure decision was announced. These 9th-grade students had maximum exposure to the phaseout process.
Our findings indicate that the phaseout process itself did not have a systematic impact, positive or negative, on the academic performance or attendance of students enrolled in these high schools at the time. Students who were enrolled in the phaseout schools achieved similar or, in some cases, higher outcomes compared to those of their peers who were enrolled in those schools prior to the closure decision. These improvements were comparable to improvements for students in other low-performing schools during the same period. This finding is noteworthy, because it has been widely speculated that the phaseout process did damage to the students who experienced it. Our study suggests that, at least in terms of measurable academic outcomes, this was not the case.
Exhibit 3 presents key impact findings for students who began their high school career at the time of the closure decisions and were enrolled in the schools during the phaseout process. Highlights include the following:
• Students enrolled in the phaseout schools achieved higher attendance rates, graduation rates, and rates of Regents diploma
Study Methods: Comparative Interrupted Time Series
The impact findings in the report are based on what is known as Comparative Interrupted Time Series (CITS) analyses. In short, the CITS method aims to isolate the distinctive influence of the high school closure process from other policies and events that occurred simultaneously and could account for changes in student outcomes in a range of low-performing schools, including those that were designated for closure.
To assess the impact on students during the phaseout process, the CITS methodology compares their outcomes with those of students who were enrolled in the schools prior to the closure decision. It then makes the same comparison, during the same time period, for other low-performing schools that avoided closure. Differences in deviations from their historical trends between the closure schools and the comparison schools represent the net impact of the phaseout process. A similar method was used to determine the impact for the post-closure cohort.
The analyses also include statistical adjustments that account for changes over time and differences across schools and cohorts in the characteristics of students enrolled in the closure and comparison schools. In addition, the analytic models make adjustments that account for the modest differences between closure and comparison schools in their respective trajectories of student outcomes from the pre-phaseout period.

7
receipt, compared to students enrolled in these high schools prior to the closure decision. Graduation rates improved by nearly 7 percentage points, and Regents diploma receipt rates improved by 19 percentage points for students enrolled in the phaseout schools, compared to the rates for earlier cohorts of students. Despite these gains, graduation rates remained low—below 50 percent, with fewer than 35 percent of students earning the more demanding Regent’s diploma.
• Gains made by students in the phaseout schools were generally similar to gains made by students in other low-performing high schools that avoided closure. While graduation rates improved more in the phaseout schools, the difference between the two sets of schools was not statistically significant, suggesting it was likely due to chance.
• The phaseout process increased student mobility, predominantly through transfers to other NYC high schools, rather than through dropping out or transfers to other districts. Although the transfer rate was higher during the phaseout process, the characteristics of students who transferred were virtually the same as those of students who had transferred prior to the closure decision. The phaseout process did not appear to have a systematic impact, positive or negative, on the subset of students who transferred. There is suggestive evidence, however, that the phaseout process may have contributed to the improvement in graduation rates for students who stayed in the schools throughout the process.9
Exhibit 3: Select Impacts on Student Attendance and Performance: Phaseout Cohort
Baseline
Projection
Phaseout School Change
Comparison School Change
Estimated Impact
Average attendance rate, grades 9-12 (%)
71.9 # 2.7 * 3.2 * -0.5 #
Cumulative credits earned 28.1 # 0.6 0.0 3.1 * -2.5 #
Graduation rate (%) 39.2 # 6.5 * 1.4 5.0 #
Diploma Type
Regents diploma (%) 14.6 # 19.1 * 10.6 * 8.5 #
Local diploma (%) 25.5 # -9.4 * -7.4 * -2.0 #
Number of schools per closure decision year 5-17 2-8 3-9
Number of students per closure decision year
11,379-26,795 547-3,740 1,579-5,104
See page 13 for notes.

8 HIGH SCHOOL CLOSURES IN NYC
What was the impact on student outcomes after high schools closed?
In the wake of a school closure decision, middle school students from the surrounding community were compelled to attend a different high school. For the purposes of this brief, we refer to these students as the “post-closure cohort.” The NYC DOE’s open choice system provided these students with access to schools throughout the City. This often included one or more new small schools that had been opened in the same building as the school that had been closed.
Our study found that meaningful benefits accrued to the post-closure cohort. These students attended higher-performing high schools, compared to the closed schools they likely would have attended. This shift in their enrollment options led to improvements in students’ attendance, progress toward graduation, and ultimately, their graduation rates—with large increases in the share of students earning a Regents diploma.
Exhibit 4: Historical Characteristics and Outcomes: Closed Schools and Schools Attended by Post-Closure Cohort
Closed Schools
Schools Attended by Post-Closure Cohort
School Services (8th grade)
Eligible for free or reduced price lunch 65.1 65.4
Received English language learner
services 11.2 10.5
Received special education services 10.0 9.6
Incoming Students’ 8th Grade Performance Average attendance rate 85.6 89.4 Chronic absentee 46.0 33.1 ELA or math in bottom 20% 43.9 31.9 Overage for grade 9 44.8 33.1
High School Outcomes (9th-12th Grades)
On track at end of 9th grade 11.6 31.1 Average attendance rate 76.3 81.7
Cumulative credits earned 25.7 38.1
Graduation rate 38.7 58.9
Diploma Typea
Regents diploma 16.8 40.2
Local diploma 22.6 18.7
Number of Schools 29 374 See page 13 for notes.

9
Exhibits 4 and 5 provide a summary of key findings, including:
• Students in the post-closure cohort enrolled in higher-performing high schools, both in terms of the characteristics of entering students and on the basis of longer-term outcomes. The group of students who likely would have attended each closed school enrolled, instead, in an average of 82 different high schools around the City. Approximately 45 percent of these students attended a new school in the same building as the school that had closed; more than 85 percent attended a high school in the same borough as the closed school. On average, the schools attended by the post-closure cohort were smaller than the closed schools. Exhibit 4 shows that they also enrolled students with somewhat higher 8th grade attendance and ELA and math achievement levels. Historically, the schools attended by post-closure students had higher graduation rates (59 vs. 39 percent) and higher Regents diploma receipt rates (40 vs. 17 percent) than the closed schools.
• Closing a high school had a systematic and large impact on graduation rates for the post-closure cohort, including the rate at which these students earned the more rigorous Regents diploma. Growth in post-closure students’ graduation rates outpaced that of comparison students by more than 15 percentage points.
Exhibit 5: Select Impacts on Performance and Attendance: Post-Closure Cohort
Baseline
Projection Phaseout Change
Comparison Change
Estimated Impact
Average attendance rate, grades 9-12 (%) 72.6 # 6.3 * 4.1 * 2.2 # Cumulative credits earned 29.5 5.1 * 3.0 * 2.1 #
Graduation rate (%) 40.4 # 15.5 * 0.4 0.0 15.1 * Diploma Type
Regents diploma (%) 12.0 # 33.7 * 16.3 * 17.4 * Local diploma (%) 26.8 # -16.4 * -14.6 * -1.9 # Number of schools per closure decision
year 5-17 2-8 3-9 Number of students per closure decision
year 11,379-26,795 568-5,303 1,184-5,303
See page 13 for notes.
10 HIGH SCHOOL CLOSURES IN NYC
What should readers consider when interpreting these results? Debates about the efficacy of school closures as a key element of educational improvement policies should be sensitive both to the limitations inherent in this study and to several critical issues that have not yet been addressed by this or other research:
First, high school closures were politically volatile and fraught with emotional backlash from the affected school communities. Our study does not examine closures’ effects on educators, parents, and neighborhoods (or on aspects of students’ experiences not reflected in their attendance, mobility, and academic outcomes). For cities that elect to close low-performing schools, it is crucial to be attentive to the possibility of these collateral impacts, and to look for ways to mitigate the pain that closures may bring. One way to do that may be to authentically engage local stakeholders in the process—in tracking a school’s performance over time; selecting and implementing improvement strategies; developing criteria for deciding to close a school; and, if absolutely necessary, phasing the school out in a way that maintains support for enrolled students.
Second, while our study shows that students who likely would have attended the closed schools fared better elsewhere, they still did not fare well. On average, just 56 percent of these students graduated from high school within four years, and less than half earned a Regents diploma. This highlights deeply entrenched inequalities in the City’s schools, where poor students of color lag far behind their more privileged peers on wide range of measures. Whether or not closures are part of the policy framework, there is a need to invest in these vulnerable students and identify structures and supports that maximize their odds of success.
Third, deciding how to deal with chronically low-performing schools demands a better understanding of the mechanisms that promote or impede school improvement. Notably, this study provides evidence of systematic gains among a broad swath of low-performing high schools, including those that avoided closure. It is not clear what accounts for this pattern. How did these schools make use of supports provided by the NYC DOE, and did these supports contribute to their improvement? While the report documents improvements in some of the City’s lowest-performing schools, it cannot tell us whether similar gains in student outcomes could have been attained without the closure policy. Did these schools feel pressure to improve lest they be next in line to be closed? If so, how did they respond, and what specific actions did they take to promote better student outcomes? These questions must await future research.
11
What do the findings suggest for policy?
In spite of the considerations outlined above, many readers will still want to know: Should districts keep the option of closing very low-performing schools on the table? While there is no simple way of answering this question, our findings suggest two different, but equally important insights:
• School closures in New York City were a central part of a multi-dimensional, comprehensive effort to improve secondary education.
During this era, the City developed a portfolio of more than 200 new high schools, most of which are small and unscreened (i.e., admission is not based on prior performance), and implemented an open choice system making the options available on citywide basis. The growth of small schools was possible, in part, because of the physical space and “demand” created by closing many of the City’s large comprehensive high schools.
A rigorous and ongoing study of these small schools by the research firm MDRC has provided compelling evidence of their positive and persistent impact on a wide range of student outcomes, including attendance, credit accumulation, high school graduation and college going.10 As the MDRC study notes, “it is rare to find such large effects for a rigorously evaluated large-scale education reform and rarer still to see such effects continue into college.” 11 Other recent research suggests that the introduction of small schools in New York City “lifted all boats…improving outcomes for students in all types of schools: large, small, continuously operating, and new.”12
Collectively, therefore, recent studies provide rigorous evidence about the effectiveness of this constellation of reforms—showing the positive impacts of small high schools, meaningful benefits for students who were able to avoid attending a very low-performing school because it was closed, and a lack of harmful effects on academic performance for students who experienced the phaseout process directly. This accumulation of evidence offers support for the strategic use of school closures as part of a multi-dimensional high school reform strategy. That being said…
• The landscape and expectations of New York City’s high schools look very different today than they did at the turn of the 21st century.
The reform strategies that included high school closures were conceived and implemented at a time when 70 percent of New York City’s high school students
12 HIGH SCHOOL CLOSURES IN NYC
attended a school that met Robert Balfanz’s “dropout factory” criteria. Although the numbers are still high, we estimate that less than a third of the City’s students are currently enrolled in such schools. Dramatic actions like school closures may have set the system on a positive trajectory, but they may not be sufficient for the challenges of today and the future.
For example, expectations for high schools are very different than they were 15 years ago. Economic self-sufficiency is increasingly tied to the attainment of a post-secondary credential, preferably a four-year college degree. Thus, even a Regents diploma is no longer considered an acceptable end-point credential. High schools are now expected to produce “college and career ready” graduates, and a school’s performance is assessed, in part, based on the ability to get students enrolled in college. This is a new set of challenges, even for high schools with relatively strong graduation rates.
In addition, despite the improvements generated by recent reforms, large numbers of students are still being left behind. Approximately 30 percent of New York City’s entering high school students fail to graduate within four years, including more than half of the City’s Black and Latino young men.13 Thus, while the reforms of the last decade appear to have “lifted all boats,” the system is still characterized by wide disparities in student outcomes, based on race and socio-economic status. More targeted strategies are likely needed to move the needle on this problem.
In short, the current landscape and expectations for high schools may demand a different set of strategies for improvement. While the option of closing schools has not been taken off the table in New York City, the NYC DOE has deemphasized both high-stakes, outcomes-based consequences for low-performing schools and the creation of new options to replace those that do not measure up. The district’s current strategy for school improvement focuses on capacity-building through learning partnerships and tapping into community resources among geographically proximate schools that face common challenges. The NYC DOE has also placed a strong emphasis on family engagement and on increasing high school students’ access to advanced course work and college counseling.14 Looking ahead, it will be important to continue conducting rigorous analyses that shed light on whether these new approaches produce hoped-for gains in students’ performance.
13
Exhibit Notes
Source: Research Alliance calculations using NYC Department of Education administrative records from the 1999-2000 to the 2012-2013 school years. See full report for sample information and definitions of variables. Exhibit 1: The index is based on 10 performance indicators: 9th grade attendance rates; on-track rates at the end of the 9th, 10th, and 11th grade; credit and Regents test accumulation by grade 12; dropout and transfer rates; high school graduation rates within four years of entering high school; and rates of receiving a Regents diploma within four years of entering high school. These measures were averaged over two to four years prior to each of the district’s school closure decisions between 2002 and 2008. For each of these years, all schools in the sample were then ranked on each measure relative to the lowest performance for that measure in that year. Combined, these relative rankings yielded a “performance index” that reflects the overall difference between a school’s performance and the lowest performance in the system for a given year. Each point on the graph represents the group of schools that were ranked in a given percentile at least once between 2002 through 2008 (the diamonds represent the schools identified for closure between 2002 and 2008, and the squares represent other NYC high schools). Exhibit 2: Averages are calculated across schools for each year, up to four years prior to each closure decision year. These are then averaged across the closure decision years from 2002 through 2008.
Sample sizes are presented as ranges based on the number of schools in each closure decision year (see Table 1 in full report).
A two-tailed t-test was applied to differences between closure schools and comparison schools and between closure schools and other schools. The statistical significance level is indicated as * = p <= .05.
Exhibit 3: Baseline trends were estimated for outcomes that were observed over two to four years prior to the closure decision. The baseline projections are estimates of the extension of these trends for up to three years following the closure decision. The baseline projection estimates in the table correspond to the year in which the last cohort of 9th graders to enroll in the closure schools reached the relevant grade level. Therefore, baseline projection estimates for Grade 9 outcomes are presented for the first year following the closure decision. Baseline projection estimates for Grade 10 outcomes are presented for the second year following the closure decision. Baseline projection estimates for Grade 11, 12, and cumulative outcomes are presented for the third year following the closure decision.
The baseline projections in the table have been regression adjusted to account for differences between closure schools and comparison schools in their respective trends during the pre-phaseout period. They are also adjusted for differences over time and between schools in student demographic and prior performance characteristics. For ease of comparison, the baseline projections are centered on the characteristics and trends of the schools designated for closure.
Sample sizes are presented as ranges based on the number of schools in each closure decision year (see Table 1 in full report).
A two-tailed t-test was applied to the phaseout school changes (relative to the baseline projection), to the comparison school change (relative to the baseline projection), and to the estimated impact
14 HIGH SCHOOL CLOSURES IN NYC
(the difference between the phaseout and comparison school changes). The statistical significance level is indicated as * = p <= .05.
Due to data limitations, impacts on cumulative outcomes are only available for schools that faced a closure decision between 2003 and 2008. Due to data limitations, impacts on Regents and Local diploma receipt rates are only available for schools that faced a closure decision between 2005 and 2008.
Exhibit 4: Outcomes for the closure schools are taken from Table 2 in the full report. Outcomes for the schools attended by the post-closure cohort are based on outcomes for students who enrolled in those schools one year before the post-closure cohort. Averages are weighted by the number of post-closure cohort students in each school. This means that outcomes for schools which enrolled a large number of students from the post-closure cohort are given more weight than those for schools with only a few students from the post-closure cohort. Tests of statistical significance were not performed for the comparison between the closure schools and the schools attended by the post-closure cohort. Exhibit 5: Baseline trends were estimated for outcomes at each expected grade level over two to four years prior to each closure decision year. The baseline projections are estimates of the extension of these trends for up to four years following the closure decision. The baseline projection estimates presented in the table correspond to the year in which the post-closure cohort reached the relevant grade level. Baseline projection estimates for Grade 9 outcomes are presented for the second year following the closure decision. Baseline projection estimates for Grade 10 outcomes are
presented for the third year following the closure decision. Baseline projection estimates for Grade 11, 12, and cumulative outcomes are presented for the fourth year following the closure decision.
The baseline projections presented in the table have been regression adjusted to account for differences between closing schools and comparison schools in their respective trends during the pre-phaseout period. They are also adjusted for differences over time and between schools in student demographic characteristics and prior performance. For ease of comparison, the baseline projections are centered on the characteristics and trends of the schools designated for closure.
Sample sizes are presented as ranges based on the number of schools in each closure decision year (see Table 1 in full report). Students in the post-closure cohort are considered to be clustered based on the closed high schools on which the matched comparison was based. The sample sizes for the post-closure cohort reflect this clustering approach.
A two-tailed t-test was applied to the post-closure change (relative to the baseline projection), to the comparison change (relative to the baseline projection), and to the estimated impact (the difference between the post-closure and comparison school changes). The statistical significance level is indicated as * = p <= .05.
Due to data limitations, impacts on cumulative outcomes are only available for schools that were designated for closure between 2003 and 2008. Due to data limitations, impact on Regents and Local diploma receipt cumulative outcomes are only available for schools that were designated for closure between 2005 and 2008.
15
Endnotes 1 See Balfanz (2004) and U.S. Department of Education (1983).
2 See Balfanz (2004) page 14, “Spotlight on New York City” and Balfanz et al., (2014).
3 See Kemple (2013). 4 See Coca (2014). 5 See Powell (2012). 6 In 2009, as part of the New York State Legislature’s review of mayoral control, a provision was added to NYS education law offering specific and extensive process requirements related to school closures. See: http://schools.nyc.gov/NR/rdonlyres/7D8147A2-7A0C-4BAC-A762-33B69C137AD6/0/A190SignificantChangesinSchoolUtilizationRegulation.pdf
7 The composite performance index includes 9th grade attendance rates; on-track rates at the end of the 9th, 10th, and 11th grade; grade 9-12 credit and Regents test accumulation; dropout and transfer rates; high school graduation rates; and Regents diploma receipt rates.
8 The sample does not include: (1) High schools that were scheduled for closure prior to 2002, because our database does not include sufficient historical information on these schools. (2) New schools that had not yet enrolled at least two cohorts of incoming 9th graders between 2000 and 2008. This is because the primary analytic methods used in the study are based on trends in student outcomes over several years prior to a decision to close a school. (3) NYC’s nine specialized high schools, because we determined that these highly selective high schools do not provide relevant comparisons with the low-performing schools that serve as the main focus of this study. (4) Schools designated exclusively for students requiring full-time special education services (i.e., District 75 schools), which include ungraded students
for whom it is not possible to identify a 9th-grade year. See the full report for details about how we selected comparison schools.
9 This finding is characterized as “suggestive” because is confined to a self-selected subsample of students who stayed in their 9th grade school. In addition, the estimate of impact on graduation rates was one of very few that were statistically significant for these “non-mobile” students.
10 See Bloom, Thompson, and Unterman (2010); Bloom and Unterman (2012); and Unterman (2014).
11 Unterman (2014), p. 8. 12 See Stiefel, Schwartz, and Wiswall (2015).
13 See Kemple (2013). 14 See NYC Mayor’s Office (2015).
References
Balfanz, R., Bridgeland, J. M., Fox, J. H., DePaoli, J., Ingram, E., & Maushard, M. (2014). Building a Grad Nation: Progress and Challenge in Ending the High School Dropout Epidemic. Baltimore, MD: Civic Enterprises.
Balfanz, R., & Letgers, N. (2004). Locating the Dropout Crisis: Which High Schools Produce the Nation's Dropouts? Where Are They Located? Who Attends Them? Baltimore, MD: Center for Research on the Education of Students Placed at Risk.
Bloom, H. S., Thompson, S. L., & Unterman, R. (2010). Transforming the High School Experience: How New York City’s New Small Schools Are Boosting Student Achievement and Graduation Rates. New York, NY: MDRC.
Bloom, H. S., & Unterman, R. (2012). Sustained Positive Effects on Graduation Rates Produced by New York City's Small Public High Schools of Choice. New York, NY: MDRC.

16 HIGH SCHOOL CLOSURES IN NYC
Coca, V. (2014). New York City Goes to College: A First Look. New York, NY: The Research Alliance for New York City Schools. http://steinhardt.nyu.edu/research_alliance/publications/nyc_goes_to_college_first_look
Kemple, J. J. (2013). The Condition of New York City High Schools: Examining Trends and Looking Toward the Future. New York, NY: The Research Alliance for New York City Schools. http://steinhardt.nyu.edu/research_alliance/publications/condition_of_nyc_hs
New York City Mayor’s Office (2015). “Equity and Excellence: Mayor de Blasio Announces Reforms to Raise Achievement Across All Public Schools.” Retrieved from: http://www1.nyc.gov/office-of-the-mayor/news/618-15/equity-excellence-mayor-de-blasio-reforms-raise-achievement-across-all-public
Powell, M. (2012). “In Schools Cut by The City Ax, Students Bleed.” The New York
Times. Retrieved from: http://www.nytimes.com/2012/04/17/nyregion/in-schools-cut-by-new-york-citys-ax-students-bleed.html
Stiefel, L., Schwartz, A. E., & Wiswall, M. (2015). “Does Small High School Reform Lift Urban Districts? Evidence from New York City.” Educational Researcher, 44(3), 161-172.
Unterman, R. (2014). Headed to College: The Effects of New York City's Small High Schools of Choice on Postsecondary Enrollment. New York, NY: MDRC.
United States Department of Education (1983). A Nation at Risk: The Imperative for Educational Reform. Retrieved from http://www2.ed.gov/pubs/NatAtRisk/index.html

17
Research Alliance publications are made possible by the support of a generous group of funders who underwrite the Research Alliance’s core operations, including flexible research capacity, communications, and public engagement efforts.
These include Carnegie Corporation of New York, the Ford Foundation, the Spencer Foundation, The Wallace Foundation, and the William T. Grant Foundation.
This publication reflects the findings, interpretations, and conclusions of the Research Alliance for NYC Schools, and not necessarily those of our funders.
Acknowledgements
This report has been more than two years in the making and benefited greatly from guidance, insights, and critique provided by colleagues at the Research Alliance and elsewhere. At the Research Alliance, Michael Segeritz was instrumental in clarifying the statistical models and many features of the analytic design. Christy Baker-Smith provided many hours of assistance with data management, early versions of the analysis, and the initial presentations of the empirical findings. Adriana Villavicencio offered constructive feedback on multiple iterations of the findings and drafts of the report. The author is especially grateful for the innumerable discussions with Saskia Levy Thompson about the broader context of high school reform in New York City over the past decade. Saskia’s extraordinary insights were drawn from her more than 15 years of work with the City’s schools as a practitioner at the Urban Assembly, a Research Fellow at MDRC, a Deputy Chancellor at the Department of Education, and Deputy Director for the Research Alliance.
The Research Alliance Steering Committee provided feedback and insights both at an early stage of the report’s development and after the findings had been refined and tested for robustness. Their guidance was instrumental is shaping the nuance and balance with which the findings and policy implications are presented.
Many staff at the New York City Department of Education reviewed iterations of the analysis and provided feedback on drafts of the report. The author is especially grateful for the insights and feedback from Phil Weinberg, Ailish Brady, Michelle Paladino, Josh Winters, and Alice Brown. The author also wishes to thank Rebecca Unterman and Marie-André Somers at MDRC for their careful review and generous feedback on the technical analyses.
Finally, any clarity or coherence in the presentation of the information in this report owes an incalculable debt to Chelsea Farley, the Research Alliance Director of Communications, and Shifra Goldenberg, our Communications Coordinator. Chelsea read and edited multiple drafts of the report and helped craft the discussion section of the report and the brief. Shifra formatted every detail of the text and exhibits, in addition to providing thoughtful input throughout the editorial process. Any remaining problems with clarity and coherence, as well as errors of commission or omission, remain with the author.

The Research Alliance for
New York City Schools conducts
rigorous studies on topics that
matter to the city’s public schools.
We strive to advance equity and
excellence in education by
providing nonpartisan evidence
about policies and practices that
promote students’ development
and academic success.
285 Mercer Street, 3rd Floor | New York, New York 10003-9502
212 992 7697 | 212 995 4910 fax
[email protected] | www.steinhardt.nyu.edu/research_alliance