Embed Size (px)
Citation preview
This document is downloaded from DR‑NTU (https://dr.ntu.edu.sg)Nanyang Technological University, Singapore.
Highly sensitive naked eye detection of Iron (III)and H2O2 using poly‑(tannic acid) (PTA) coated Aunanocomposite
Fang, Yan; Tan, Jiajun; Choi, Hyunjun; Lim, Sierin; Kim, Dong‑Hwan
2017
Fang, Y., Tan, J., Choi, H., Lim, S., & Kim, D.‑H. (2018). Highly sensitive naked eye detectionof Iron (III) and H2O2 using poly‑(tannic acid) (PTA) coated Au nanocomposite. Sensors andActuators B: Chemical, 259, 155‑161. doi:10.1016/j.snb.2017.12.031
https://hdl.handle.net/10356/91753
https://doi.org/10.1016/j.snb.2017.12.031
© 2017 Elsevier B.V. All rights reserved. This paper was published in Sensors and ActuatorsB: Chemical and is made available with permission of Elsevier B.V.
Downloaded on 01 Dec 2021 05:59:47 SGT
Highly sensitive naked eye detection of Iron (III) and H2O2 using 1
poly-(tannic acid) (PTA) coated Au nanocomposite 2
Yan Fanga,b
**, Jiajun Tanb**, Hyunjun Choi
c, Sierin Lim
b,d, Dong-Hwan Kim
c* 3
4
aState Key Laboratory of Materials-Oriented Chemical Engineering, College of 5
Biotechnology and Pharmaceutical Engineering, Nanjing Tech University, Nanjing, 6
211816, People’s Republic of China 7
bSchool of Chemical and Biomedical Engineering, Nanyang Technological University, 70 8
Nanyang Drive, Block N1.3, Singapore 637457 9
cSchool of Chemical Engineering, Sungkyunkwan University, 16419, Republic of Korea 10
dNTU-Northwestern Institute for Nanomedicine, Nanyang Technological University, 50 11
Nanyang Drive, Singapore 6374553 12
13
14
*Email: [email protected] 15
** Equal contribution to this work. 16
17
18
19
20
21
22
23
24
25
ABSTRACT 1
In the present study, we present a room temperature-, one-pot method for the synthesis of 2
functional poly (tannic acid) (PTA)-based core@shell nanocomposites (core@PTA). The 3
addition of tannic acid (TA) to gold (Au) salt solutions at mildly alkaline pH induced 4
reduction of the metal salts to Au nanoparticles (NPs) while TA was oxidized and 5
self-polymerized before encapsulating the AuNPs to form Au@PTA. Through the use of 6
coordination chemistry, the synthesized Au@PTA was utilized as a naked eye sensor for 7
iron (III) ions and H2O2. In the presence of Fe3+
, Au@PTA aggregated and resulted in 8
visible color change, showing high selectivity towards Fe3+
with visual detection limit of 9
20 M. Extension of the approach is used to detect H2O2 with visual detection limit of 0.4 10
M. Observation of the UV-vis spectra after the addition of analytes for the two detection 11
systems revealed an additional peak in the H2O2 detection system at ~ 650 nm. This is due 12
to the presence of “wire-like” oligomer structures in the H2O2 detection system as opposed 13
to nanocomposite aggregation observed in the former system. 14
KEYWORDS: tannic acid (TA); visual detection; naked eye; Fe3+
; H2O2; core@shell 15
nanocomposites; 16
17
18
Introduction 1
Polymer coated metal nanoparticles (metal@polymer) are preferred over the 2
nanoparticles capped with stabilizing agents from the point of view of stability and 3
dispersion.[1] However, current methods of synthesizing metal@polymer nanocomposites 4
not only require energy input but also are done in multiple steps. Usually, for the synthesis 5
of metal@polymer nanocomposites, two reaction steps are generally required: the 6
reduction of the metal ions to form the core, and subsequent shell formation through 7
thiol-metal binding or covalent polymerization.[2-4] Here, we hypothesized that 8
polyphenols capable of undergoing oxidative self-polymerization could self-assemble 9
polymeric shells of metal@polymer nanocomposites in a single step without the need of 10
cross-linkers or UV radiation. 11
One such poly-phenolic material would be tannic acid (TA). TA has been shown to 12
undergo oxidative self-polymerization to poly-tannic acid (PTA) before coating onto 13
graphene oxide surface.[5] Furthermore, tannic acid has also been used as a sole reducing 14
and capping agent in heating-free green synthesis of metal nanoparticles.[6, 7] These two 15
properties make tannic acid an advantageous candidate for the synthesis of 16
metal@polymer nanocomposite.[8] Nevertheless, current methods of synthesizing 17
metal@polyphenol nanocomposite with tannic acid shell as described by Zeng et al. still 18
relied on iron (III) ions to induce coordination between TA to form the shell.[9] 19
Here we show that metal@polymer nanocomposite with PTA shell can be 20
synthesized without any cross-linkers. As proof of concept, gold (Au) was used in our 21
experiment to form the metal core of our metal@polymer nanocomposite. The 22
gold@poly-tannic acid (Au@PTA) was further applied as a sensor to detect the presence 1
of iron (III) ions as well as hydrogen peroxide (H2O2). 2
Various elements, such as carbon, oxygen and hydrogen are necessary for the 3
survival of living organisms. Particularly, iron is considered an indispensable element for 4
life. It exists in both ferrous (Fe2+
) and ferric (Fe3+
) states to perform various biological 5
functions.[10, 11] Many cellular processes, such as oxygen transportation and DNA 6
synthesis, involve electron transfer between the two iron oxidation states.[12, 13] Iron 7
levels are also crucial in biochemical, pharmacological, and toxicological functions in 8
biological systems. Iron deficiency or iron overload can lead to various disorders and 9
diseases.[14, 15] As such, much effort has been made to develop techniques for iron 10
detection. These include absorbance measurements,[16] electrochemistry techniques,[17] 11
magnetic resonance imaging,[18] high-performance liquid chromatography,[19] and 12
fluorescence.[20] However, these methods are inconvenient as they require the use of 13
measuring instruments. In this work, we have developed a simple and highly visual 14
method for detecting Fe3+
. This technique relies on Au@PTA aggregation in aqueous 15
solutions using coordination chemistry between PTA and Fe3+
. Fe3+
coordinates with the 16
three galloyl groups in TA to form a stable octahedral complex and cross-linked structure, 17
resulting in Au@PTA aggregation. The aggregation in turn gave rise to our read-out which 18
was an observable naked eye color change. H2O2 plays an important role as an 19
intermediate chemical in various industrial fields, such as food[21], pharmaceutical[22], 20
clinical[23], and for environmental analysis[24]. As such a convenient and highly sensitive 21
detection method is required to examine the presence of H2O2. By utilizing H2O2 to 22
oxidize Fe2+
to Fe3+
, we could induce the aggregation of Au@PTA, thus signaling the 1
presence of H2O2. 2
3
Results and discussion 4
Synthesis of Au@PTA nanocomposite 5
Au@PTA nanocomposite was synthesized by one-pot synthesis mixing of Au3+
and 6
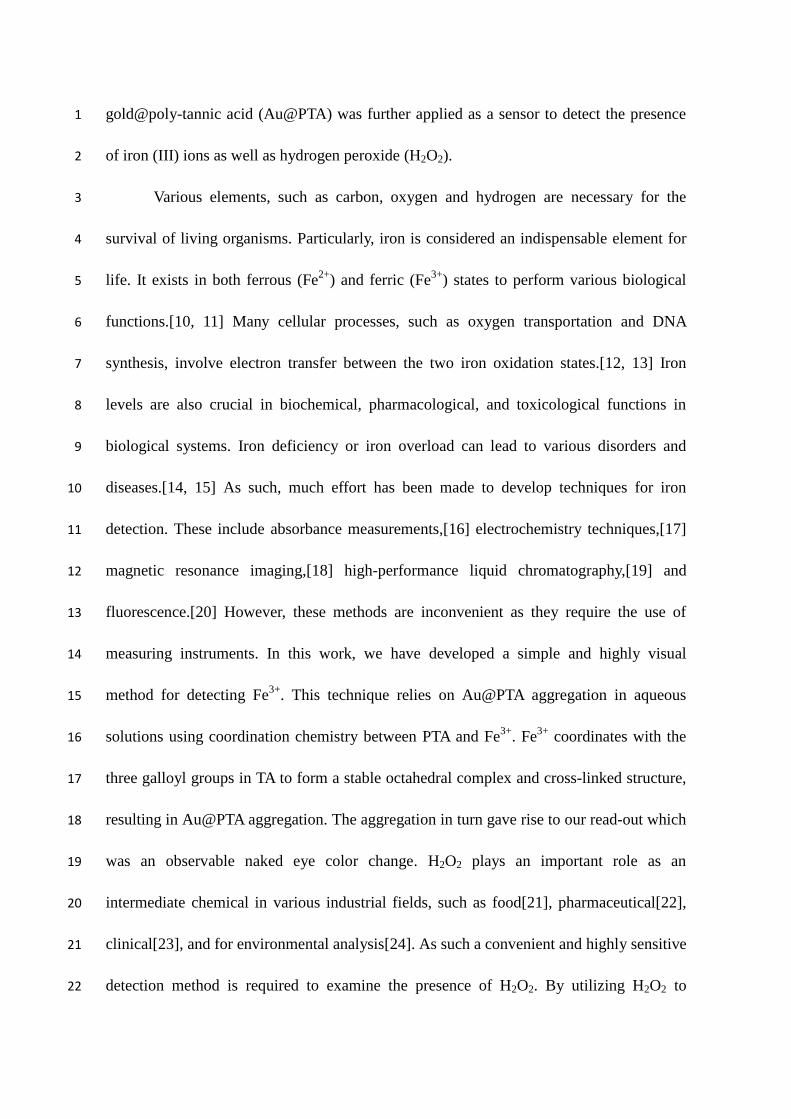
TA under mildly alkaline condition. The TEM image (Figure 1a) showed that Au@PTA 7
nanocomposites comprised two components with distinct electronic densities as compared 8
with bare gold nanoparticles (AuNPs) (Figure 1a, inset).[9] The average diameter of the 9
core of Au@PTA was ~ 20 nm, while the shell thickness was ~ 5 nm. The solution of 10
Au@PTA nanocomposites exhibited a red color similar to that of typical Au 11
colloids.[25-27] The UV-Vis spectra of an Au@PTA solution showed an extinction peak at 12
around 550 nm (Figure 1b). The slight red-shift in the extinction peak of Au@PTA in 13
comparison with that of 20 nm AuNPs (extinction peak of ~ 520 nm) was due to the 14
increase of refractive index around AuNPs arising from the PTA coating on AuNPs.[9, 28] 15
The corresponding element linear mapping of a single nanocomposite (Figure 1c, d) 16
showed the distribution of the various elements in the nanocomposite, comprising Au 17
(green), C (red), and O (black), indicating that the nanocomposites were composed of Au 18
at its core and PTA as its shell.[29] Fourier transform infrared (FTIR) spectra confirmed 19
that TA was oxidized by HAuCl4 (Figure S1), which was in good agreement with previous 20
reports.[30] Integration of the PTA shell onto the surface of the Au cores decreased the 21
zeta potential from -11.5 0.5 mV to -17.2 0.5 mV due to the presence of acidic galloyl 22
groups in TA (Table S1). 23
1
Figure 1. (a) TEM images of the bare AuNPs (the inset image) and Au@PTA; (b) UV-Vis 2
spectra of the dispersed suspensions of bare AuNPs and Au@PTA. The inset is its optical 3
image (c) STEM image of a single Au@PTA nanoparticle; (d) relevant element linear 4
mapping: Au, C, and O. 5
To determine the optimal pH for Au@PTA synthesis, we carried out experiments to 6
synthesize the Au@PTA in various pH conditions. The estimated pKa value of TA is 7
8.5.[31] TA monomer was stable in solutions at pH 7.0 because oxidation of TA is 8
inhibited in acidic condition. However, TA solutions underwent oxidation at pH 7.0 with 9
atmospheric oxygen. When such oxidation occurs, self-polymerization of TA will take 10
place spontaneously, causing the TA solution to turn faint yellow (Figure S2). Based on 11
this observation, it could be inferred that, for each Au@PTA nanocomposite, TA were 12
cross-linked through oxidation by HAuCl4 and oxygen dissolved in the solution before 13
self-assembling into the shell surrounding the AuNP cores. In this manner, the Au@PTA 14
nanocomposites can be synthesized in a fast, one-pot synthesis pathway. Nevertheless, if 15
the pH of the solution was high (i.e., pH > 8.5), the speed of TA oxidation and 1
self-polymerization would be too fast and the polymerized TA would be further oxidized 2
and disassembled into smaller soluble molecules.[32] As a result, the shell would be 3
unable to assemble on the AuNP core and the core@shell structure would not be formed. 4
We determined that the optimal pH for Au@PTA nanocomposite synthesis to be pH = 7.8 5
(Table S2). 6
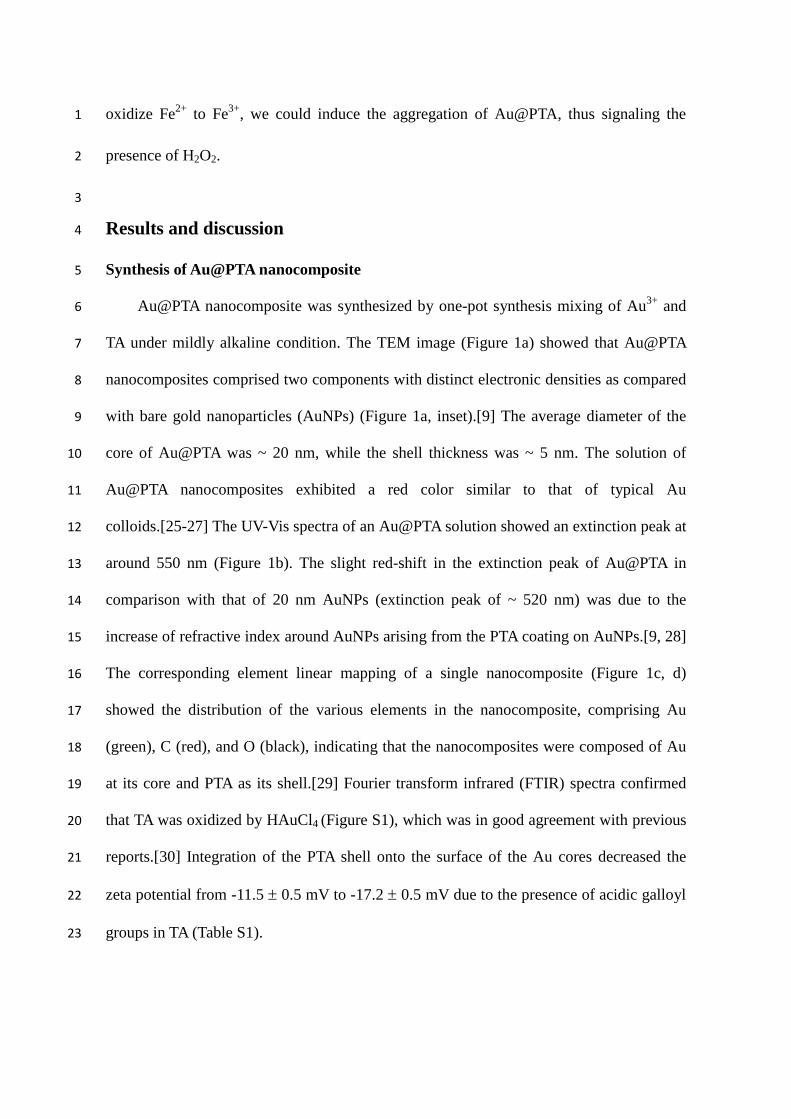
Time-course experiment was conducted to determine the growth mechanism of 7
Au@PTA nanocomposites by monitoring the morphology of the nanocomposites using 8
TEM at synthesis time points of 5, 10 and 20 min. Similar to other nanoparticle synthesis 9
techniques, the electronic density at the beginning of the synthesis process (5 min) was not 10
uniform and the nanoparticles aggregated in a “like-attracts-like” manner (Figure 2a). The 11
white halo around the nanoparticles may be attributed to the presence of partially 12
polymerized PTA. We may attribute the “like-attracts-like” aggregation of nanoparticles to 13
the fusion between metal nanoclusters, which would grow into larger mesocrystals, as 14
observed in many biomineralization processes.[33-35] At 10 min, although we observed 15
capping of PTA onto the mesocrystals, uniformed Au@PTA nanocomposites were still not 16
fully assembled (Figure 2b). After 20 min, capping of PTA is completed and a shell of 17
thickness of ~5 nm was observed around the Au core (Figure 2c). 18
19
20
Figure 2. TEM images of Au@PTA nanocomposites collected at different times during the 21
preparation process under pH = 7.8: (a) 5 min, (b) 10 min, and (c) 20 min. 22
400 500 600 700 800
0.0
0.2
0.4
0.6
0.8
1.0
Ab
so
rban
ce
Wavelength (nm)
(b)
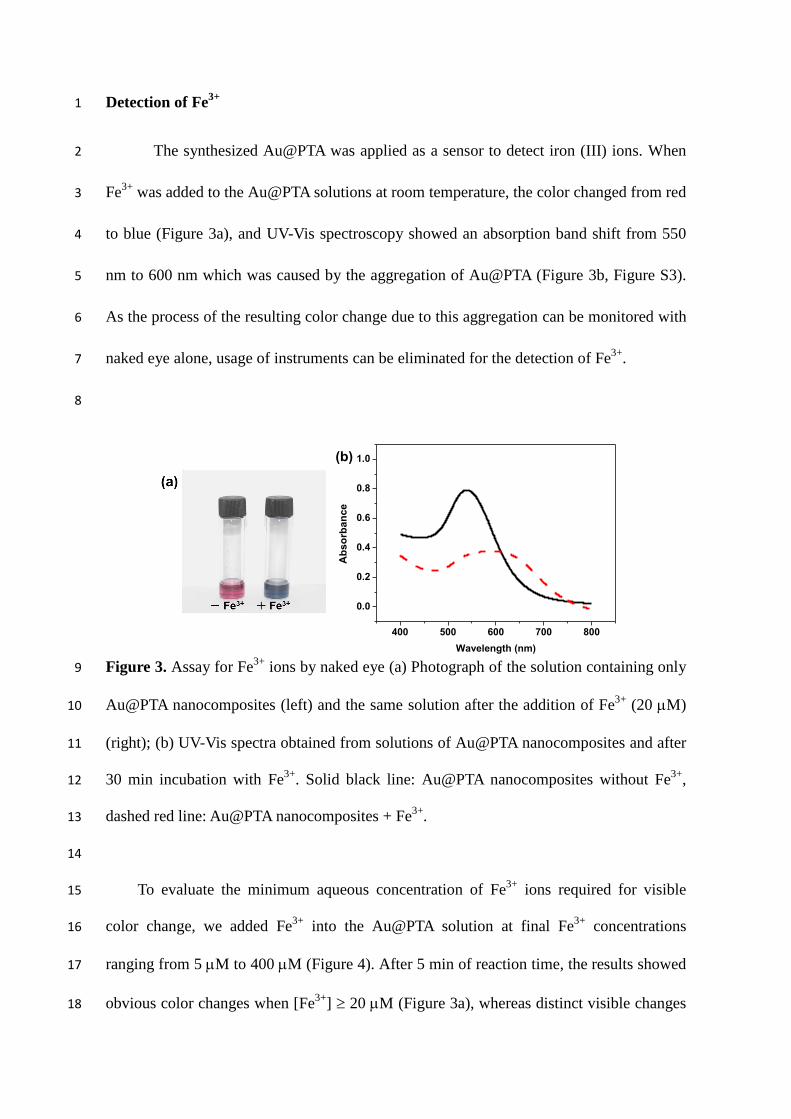
Detection of Fe3+
1
The synthesized Au@PTA was applied as a sensor to detect iron (III) ions. When 2
Fe3+
was added to the Au@PTA solutions at room temperature, the color changed from red 3
to blue (Figure 3a), and UV-Vis spectroscopy showed an absorption band shift from 550 4
nm to 600 nm which was caused by the aggregation of Au@PTA (Figure 3b, Figure S3). 5
As the process of the resulting color change due to this aggregation can be monitored with 6
naked eye alone, usage of instruments can be eliminated for the detection of Fe3+
. 7
8
Figure 3. Assay for Fe3+
ions by naked eye (a) Photograph of the solution containing only 9
Au@PTA nanocomposites (left) and the same solution after the addition of Fe3+
(20 M) 10
(right); (b) UV-Vis spectra obtained from solutions of Au@PTA nanocomposites and after 11
30 min incubation with Fe3+
. Solid black line: Au@PTA nanocomposites without Fe3+
, 12
dashed red line: Au@PTA nanocomposites + Fe3+
. 13
14
To evaluate the minimum aqueous concentration of Fe3+
ions required for visible 15
color change, we added Fe3+
into the Au@PTA solution at final Fe3+
concentrations 16
ranging from 5 M to 400 M (Figure 4). After 5 min of reaction time, the results showed 17
obvious color changes when [Fe3+
] 20 M (Figure 3a), whereas distinct visible changes 18
of the solution color were not observed when [Fe3+
] < 5 M (Figure S4). To our 1
knowledge, our system offers the lowest detection limit for the visual detection of Fe3+
2
ions.[17-20] 3
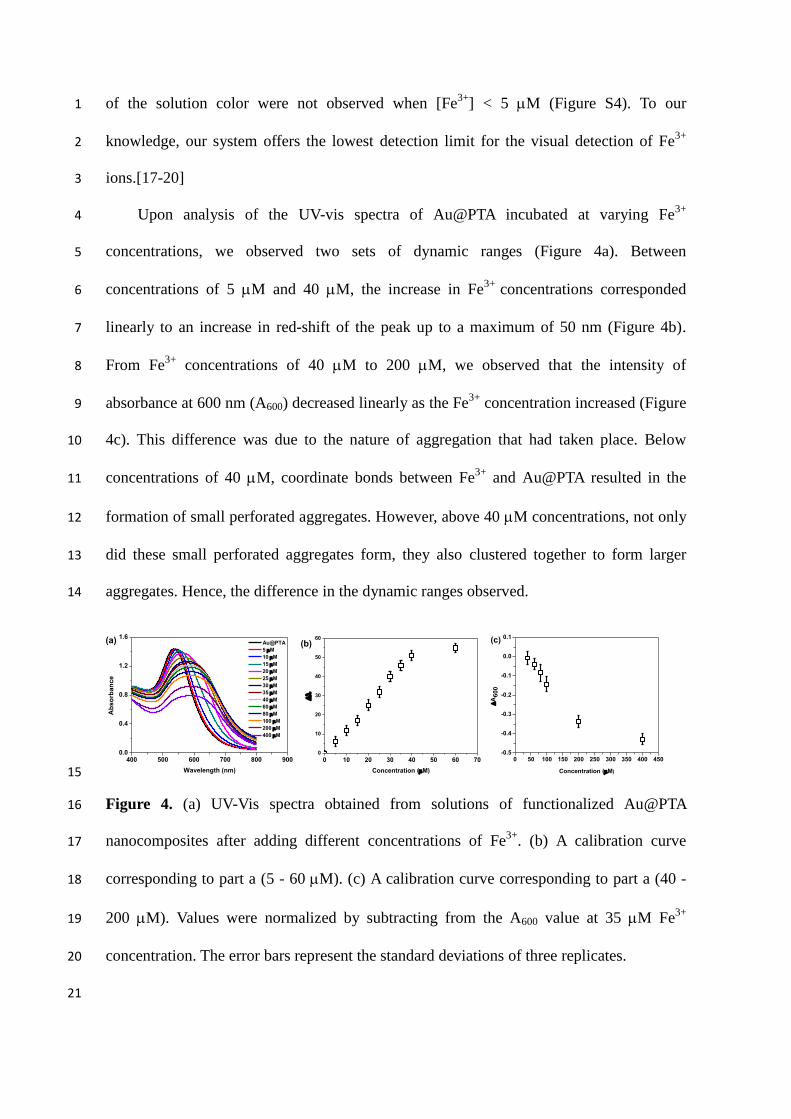
Upon analysis of the UV-vis spectra of Au@PTA incubated at varying Fe3+
4
concentrations, we observed two sets of dynamic ranges (Figure 4a). Between 5
concentrations of 5 M and 40 M, the increase in Fe3+
concentrations corresponded 6
linearly to an increase in red-shift of the peak up to a maximum of 50 nm (Figure 4b). 7
From Fe3+
concentrations of 40 M to 200 M, we observed that the intensity of 8
absorbance at 600 nm (A600) decreased linearly as the Fe3+
concentration increased (Figure 9
4c). This difference was due to the nature of aggregation that had taken place. Below 10
concentrations of 40 M, coordinate bonds between Fe3+
and Au@PTA resulted in the 11
formation of small perforated aggregates. However, above 40 M concentrations, not only 12
did these small perforated aggregates form, they also clustered together to form larger 13
aggregates. Hence, the difference in the dynamic ranges observed. 14
400 500 600 700 800 9000.0
0.4
0.8
1.2
1.6
Ab
so
rban
ce
Wavelength (nm)
Au@PTA
5 M
10 M
15 M
20 M
25 M
30 M
35 M
40 M
60 M
80 M
100 M
200 M
400 M
(a)
0 10 20 30 40 50 60 700
10
20
30
40
50
60
Concentration (M)
(b)
0 50 100 150 200 250 300 350 400 450-0.5
-0.4
-0.3
-0.2
-0.1
0.0
0.1
Concentration (M)
(c)
A
60
0
15
Figure 4. (a) UV-Vis spectra obtained from solutions of functionalized Au@PTA 16
nanocomposites after adding different concentrations of Fe3+
. (b) A calibration curve 17
corresponding to part a (5 - 60 M). (c) A calibration curve corresponding to part a (40 - 18
200 M). Values were normalized by subtracting from the A600 value at 35 M Fe3+
19
concentration. The error bars represent the standard deviations of three replicates. 20
21
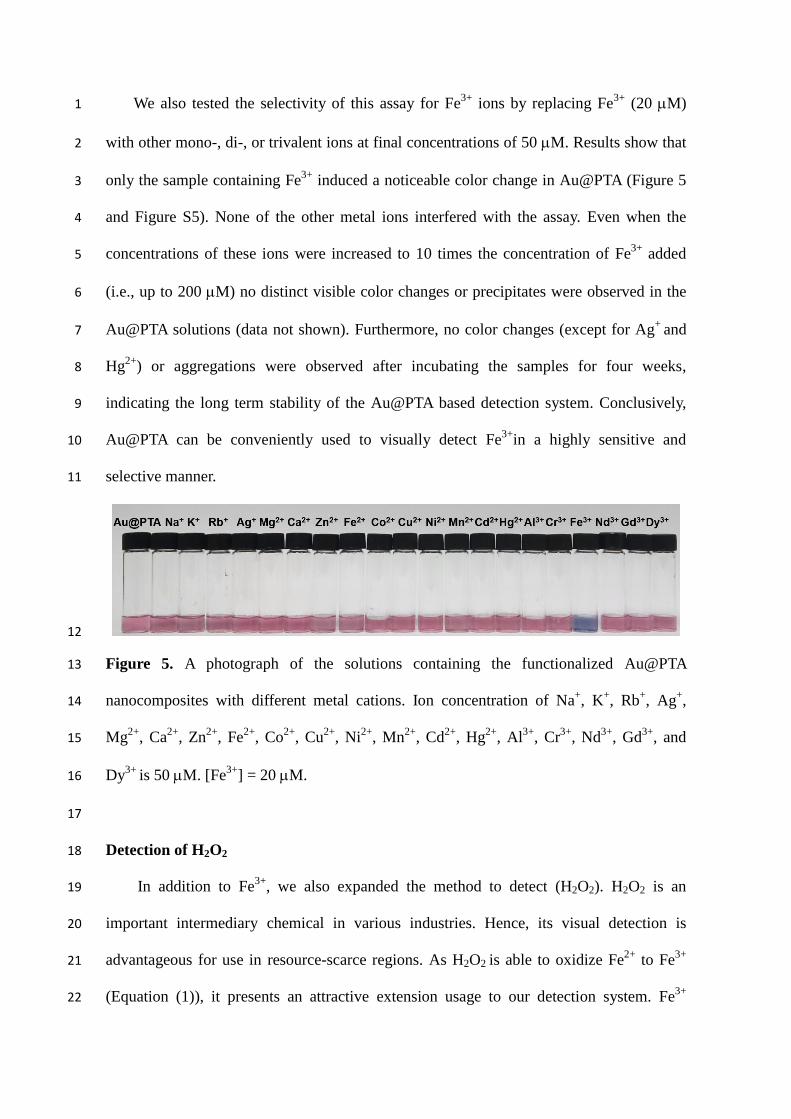
We also tested the selectivity of this assay for Fe3+
ions by replacing Fe3+
(20 M) 1
with other mono-, di-, or trivalent ions at final concentrations of 50 M. Results show that 2
only the sample containing Fe3+
induced a noticeable color change in Au@PTA (Figure 5 3
and Figure S5). None of the other metal ions interfered with the assay. Even when the 4
concentrations of these ions were increased to 10 times the concentration of Fe3+
added 5
(i.e., up to 200 M) no distinct visible color changes or precipitates were observed in the 6
Au@PTA solutions (data not shown). Furthermore, no color changes (except for Ag+
and 7
Hg2+
) or aggregations were observed after incubating the samples for four weeks, 8
indicating the long term stability of the Au@PTA based detection system. Conclusively, 9
Au@PTA can be conveniently used to visually detect Fe3+
in a highly sensitive and 10
selective manner. 11
12
Figure 5. A photograph of the solutions containing the functionalized Au@PTA 13
nanocomposites with different metal cations. Ion concentration of Na+, K
+, Rb
+, Ag
+, 14
Mg2+
, Ca2+
, Zn2+
, Fe2+
, Co2+
, Cu2+
, Ni2+
, Mn2+
, Cd2+
, Hg2+
, Al3+
, Cr3+
, Nd3+
, Gd3+
, and 15
Dy3+
is 50 M. [Fe3+
] = 20 M. 16
17
Detection of H2O2 18
In addition to Fe3+
, we also expanded the method to detect (H2O2). H2O2 is an 19
important intermediary chemical in various industries. Hence, its visual detection is 20
advantageous for use in resource-scarce regions. As H2O2 is able to oxidize Fe2+
to Fe3+
21
(Equation (1)), it presents an attractive extension usage to our detection system. Fe3+
22
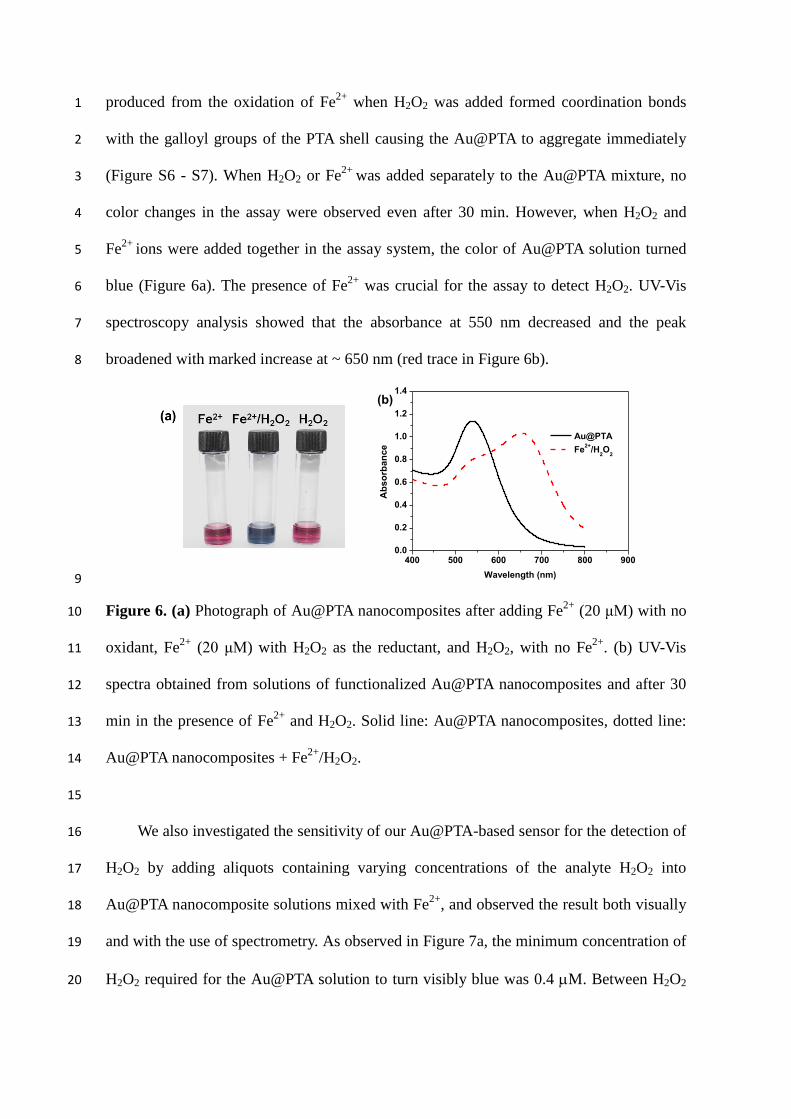
produced from the oxidation of Fe2+
when H2O2 was added formed coordination bonds 1
with the galloyl groups of the PTA shell causing the Au@PTA to aggregate immediately 2
(Figure S6 - S7). When H2O2 or Fe2+
was added separately to the Au@PTA mixture, no 3
color changes in the assay were observed even after 30 min. However, when H2O2 and 4
Fe2+
ions were added together in the assay system, the color of Au@PTA solution turned 5
blue (Figure 6a). The presence of Fe2+
was crucial for the assay to detect H2O2. UV-Vis 6
spectroscopy analysis showed that the absorbance at 550 nm decreased and the peak 7
broadened with marked increase at ~ 650 nm (red trace in Figure 6b). 8
9
Figure 6. (a) Photograph of Au@PTA nanocomposites after adding Fe2+
(20 μM) with no 10
oxidant, Fe2+
(20 μM) with H2O2 as the reductant, and H2O2, with no Fe2+
. (b) UV-Vis 11
spectra obtained from solutions of functionalized Au@PTA nanocomposites and after 30 12
min in the presence of Fe2+
and H2O2. Solid line: Au@PTA nanocomposites, dotted line: 13
Au@PTA nanocomposites + Fe2+
/H2O2. 14
15
We also investigated the sensitivity of our Au@PTA-based sensor for the detection of 16
H2O2 by adding aliquots containing varying concentrations of the analyte H2O2 into 17
Au@PTA nanocomposite solutions mixed with Fe2+
, and observed the result both visually 18
and with the use of spectrometry. As observed in Figure 7a, the minimum concentration of 19
H2O2 required for the Au@PTA solution to turn visibly blue was 0.4 M. Between H2O2 20
400 500 600 700 800 9000.0
0.2
0.4
0.6
0.8
1.0
1.2
1.4
Au@PTA
Fe2+
/H2O
2
A
bs
orb
an
ce
Wavelength (nm)
(b)
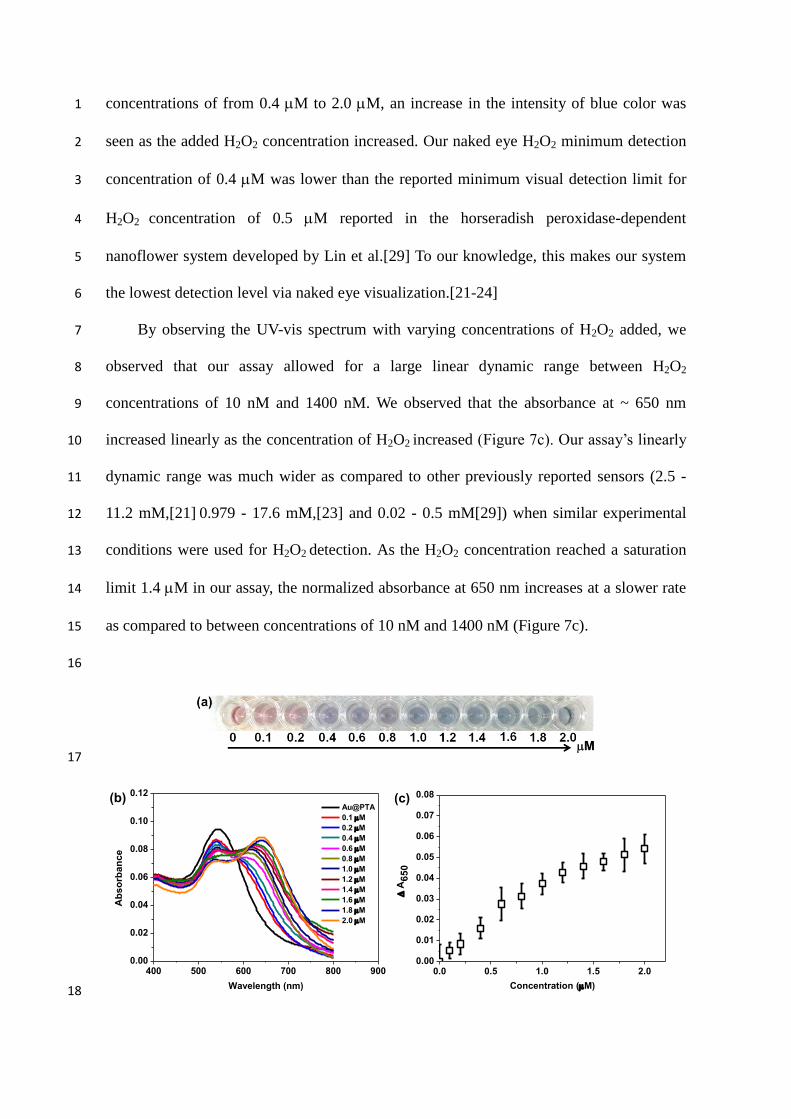
concentrations of from 0.4 M to 2.0 M, an increase in the intensity of blue color was 1
seen as the added H2O2 concentration increased. Our naked eye H2O2 minimum detection 2
concentration of 0.4 M was lower than the reported minimum visual detection limit for 3
H2O2 concentration of 0.5 M reported in the horseradish peroxidase-dependent 4
nanoflower system developed by Lin et al.[29] To our knowledge, this makes our system 5
the lowest detection level via naked eye visualization.[21-24] 6
By observing the UV-vis spectrum with varying concentrations of H2O2 added, we 7
observed that our assay allowed for a large linear dynamic range between H2O2 8
concentrations of 10 nM and 1400 nM. We observed that the absorbance at ~ 650 nm 9
increased linearly as the concentration of H2O2 increased (Figure 7c). Our assay’s linearly 10
dynamic range was much wider as compared to other previously reported sensors (2.5 - 11
11.2 mM,[21] 0.979 - 17.6 mM,[23] and 0.02 - 0.5 mM[29]) when similar experimental 12
conditions were used for H2O2 detection. As the H2O2 concentration reached a saturation 13
limit 1.4 M in our assay, the normalized absorbance at 650 nm increases at a slower rate 14
as compared to between concentrations of 10 nM and 1400 nM (Figure 7c). 15
16
17
400 500 600 700 800 9000.00
0.02
0.04
0.06
0.08
0.10
0.12
Ab
so
rban
ce
Wavelength (nm)
Au@PTA
0.1 M
0.2 M
0.4 M
0.6 M
0.8 M
1.0 M
1.2 M
1.4 M
1.6 M
1.8 M
2.0 M
(b)
18
0.0 0.5 1.0 1.5 2.00.00
0.01
0.02
0.03
0.04
0.05
0.06
0.07
0.08
A
65
0
Concentration (M)
(c)
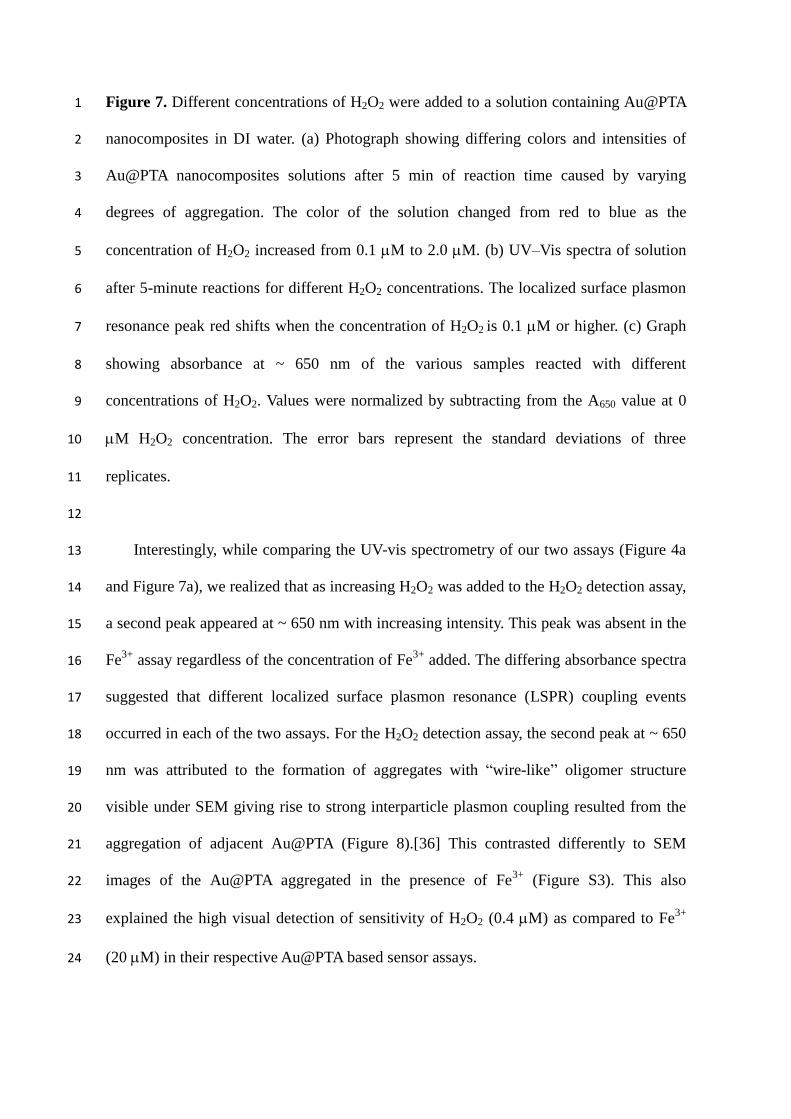
Figure 7. Different concentrations of H2O2 were added to a solution containing Au@PTA 1
nanocomposites in DI water. (a) Photograph showing differing colors and intensities of 2
Au@PTA nanocomposites solutions after 5 min of reaction time caused by varying 3
degrees of aggregation. The color of the solution changed from red to blue as the 4
concentration of H2O2 increased from 0.1 M to 2.0 M. (b) UV–Vis spectra of solution 5
after 5-minute reactions for different H2O2 concentrations. The localized surface plasmon 6
resonance peak red shifts when the concentration of H2O2 is 0.1 M or higher. (c) Graph 7
showing absorbance at ~ 650 nm of the various samples reacted with different 8
concentrations of H2O2. Values were normalized by subtracting from the A650 value at 0 9
M H2O2 concentration. The error bars represent the standard deviations of three 10
replicates. 11
12
Interestingly, while comparing the UV-vis spectrometry of our two assays (Figure 4a 13
and Figure 7a), we realized that as increasing H2O2 was added to the H2O2 detection assay, 14
a second peak appeared at ~ 650 nm with increasing intensity. This peak was absent in the 15
Fe3+
assay regardless of the concentration of Fe3+
added. The differing absorbance spectra 16
suggested that different localized surface plasmon resonance (LSPR) coupling events 17
occurred in each of the two assays. For the H2O2 detection assay, the second peak at ~ 650 18
nm was attributed to the formation of aggregates with “wire-like” oligomer structure 19
visible under SEM giving rise to strong interparticle plasmon coupling resulted from the 20
aggregation of adjacent Au@PTA (Figure 8).[36] This contrasted differently to SEM 21
images of the Au@PTA aggregated in the presence of Fe3+
(Figure S3). This also 22
explained the high visual detection of sensitivity of H2O2 (0.4 M) as compared to Fe3+
23
(20 M) in their respective Au@PTA based sensor assays. 24
1
Figure 8. (a) SEM images of Au@PTA nanocomposites + Fe2+
. (b) SEM image of the 2
Au@PTA nanocomposites + Fe2+
+ H2O2 with lower and higher magnification (inset). 3
4
To account for the “wire-like” oligomer structure present in the H2O2 detection assay 5
but absent in the Fe3+
detection assay, we examine the chemistry taking place for each 6
assay. In the Fe3+
detection assay, the addition of Fe3+
Au@PTA resulted in an aggregation 7
induced by the coordination between Fe3+
and the galloyl groups of PTA. However, when 8
H2O2 was added to the mixture of Au@PTA and Fe2+
ions, a multi-step reaction took place. 9
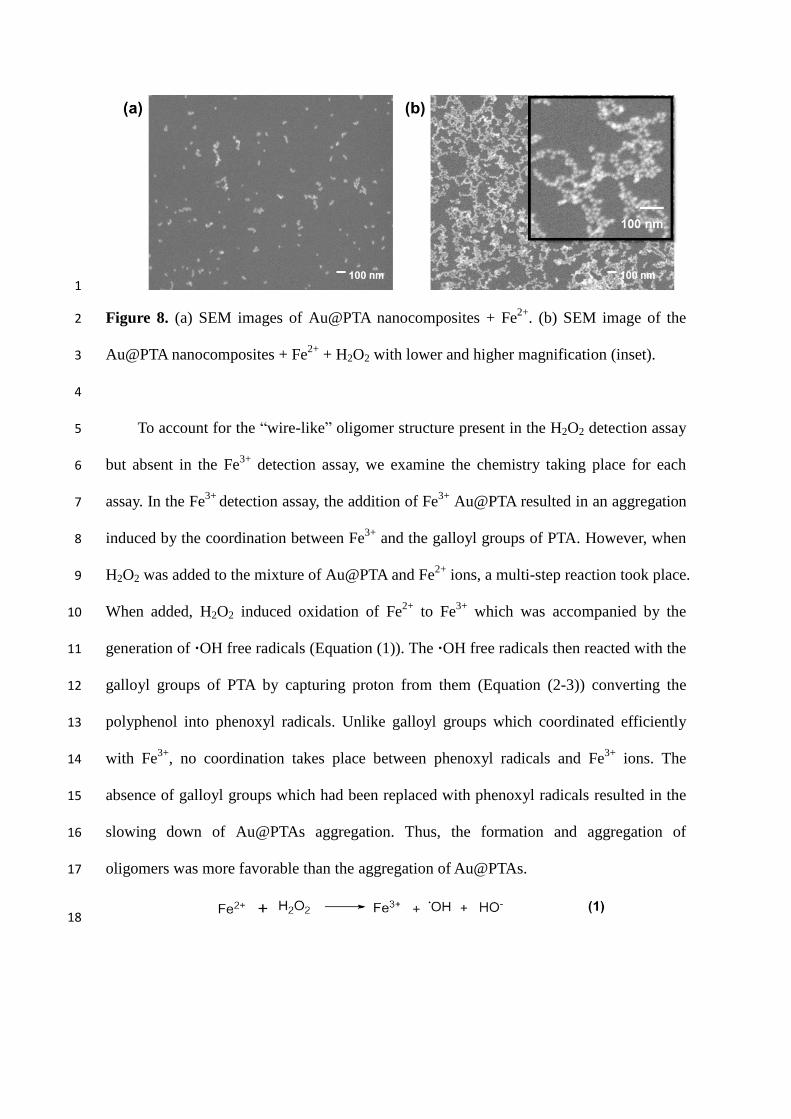
When added, H2O2 induced oxidation of Fe2+
to Fe3+
which was accompanied by the 10
generation of ·OH free radicals (Equation (1)). The ·OH free radicals then reacted with the 11
galloyl groups of PTA by capturing proton from them (Equation (2-3)) converting the 12
polyphenol into phenoxyl radicals. Unlike galloyl groups which coordinated efficiently 13
with Fe3+
, no coordination takes place between phenoxyl radicals and Fe3+
ions. The 14
absence of galloyl groups which had been replaced with phenoxyl radicals resulted in the 15
slowing down of Au@PTAs aggregation. Thus, the formation and aggregation of 16
oligomers was more favorable than the aggregation of Au@PTAs. 17
18
1
2
Conclusion 3
In conclusion, we have developed a highly sensitive Fe3+
and H2O2 sensor based on 4
Au@PTA core@shell nanocomposites. The one-pot synthesis of Au@PTA was prepared 5
by mixing TA and gold salt together in mildly alkaline pH condition under constant vortex 6
for 20 min at room temperature. TA reduced the gold salt to form AuNP and itself oxidized 7
into PTA. The PTA then assembled onto the AuNP to form Au@PTA nanocomposites. 8
Relying on Fe3+
coordination to galloyl groups on TA, we developed a highly 9
selective and sensitive sensor for detecting Fe3+
. The minimum detection limit for naked 10
eye color change from red to blue in the presence of Fe3+
only is a hitherto unreported low 11
of 20 M. Leveraging on the oxidation of Fe2+
to Fe3+
by H2O2, we were able to develop 12
our sensor further to detect H2O2 when Au@PTA was mixed together with Fe2+
. The 13
naked eye detectable color change for this assay was 0.4 M of H2O2. The high sensitivity 14
of the H2O2 assay maybe explained by the formation of “wire-like” oligomer formed due 15
to the presence of phenoxyl groups and the absence of galloyl groups. 16
As iron and its ions are important biological minerals while H2O2 is an important 17
chemical intermediary in various industries, it is imperative that a highly sensitive, 18
selective and easily visible read-out is available to detect the presence of Fe3+
and H2O2. 19
Herein, we have developed a PTA coated Au core@shell nanocomposite that fulfills these 20
criteria. Coupled with its green, one-pot and one-step synthesis method, our assay is 21
highly advantageous. 22
Experimental 1
Materials. Hydrogen Tetrachloroaurate Hydrate (HAuCl43H2O), Hydrogen Peroxide 2
(H2O2), Trisodium Citrate, Tannic Acid (TA), Sodium Borohydride (NaBH4), Silver 3
Nitrate (AgNO3), Rubidium Chloride (RbCl), Calcium Chloride (CaCl2), Manganese 4
Chloride Tetrahydrate (MnCl24H2O), Colbalt(II) Nitrate Hexhydrate (Co(NO3)24H2O), 5
Nickel Sulfate Hexahydrate (Ni2SO46H2O), Copper(II) Sulfate Pentahydrate 6
(CuSO45H2O), Zinc Sulfate Heptahydrate (Zn2SO46H2O), Cadmium Chloride (CdCl2), 7
Mercury(II) Chloride (HgCl2), Aluminium Postassium Sulfate Dodecahydrate 8
(AlKO8S212H2O), Potassium Chromium(III) Sulfate Dodecahydrate (CrKO8S212H2O), 9
Neodymium(III) Chloride Hexahydrate (NdCl36H2O), Gadolinium(III) Chloride 10
Hexahydrate (Cl3Gd6H2O), Dysprosium(III) Chloride Hexahydrate (Cl3Dy6H2O), 11
Iron(III) Chloride Hexahydrate (FeCl36H2O), and Iron(II) Chloride (FeCl2), were 12
purchased from Sigma-Aldrich, Sodium Chloride (NaCl), Potassium Chloride (KCl) were 13
purchased from Merck. Magnesium Sulfate Anhydrous (MgSO4) was purchased from MP 14
Biomedicals. All chemicals were used as received. Phosphate buffer (PB), sodium salt (pH 15
= 7.8, 10 mM) was used for synthesizing PTA-based core@shell nanocomposites. Water 16
used in all experiments was deionized and ultrafiltered to 18 Mcm using a Milipore 17
Milli-Q gradient system. 18
Synthesis of core-shell metal@PTA nanocomposites. Au@PTA nanocomposites were 19
prepared by pipetting 50 L of TA (40 mg mL-1
) into 10 mL HAuCl4·3H2O (1 mM) in 10 20
mM PB (pH = 7.8) at room temperature in Corning conical tube. It is to be noted that 21
synthesis in other tubes (e.g. BD Falcon) did not yield any nanoparticle. The suspension 22
was then vigorously mixed with a vortex mixer for 20 min. The color of the solution 1
turned red and gradually deepened until no further color change was observed. The 2
obtained Au@PTA were collected by centrifugation (9000 x g for 15 min) and rinsed with 3
water twice. Bare AuNPs were synthesized with the same method, except that PB solution 4
(pH = 7.8, 10 mM) was replaced with DI water. When conducting pH-dependent 5
experiments, various buffer systems were used to adjust the pH value: 6
pH = 3.3, glycine - HCl (10 mM); pH = 6.0, 7.0, 7.8, PB (10 mM); pH = 8.5, Tris-HCl (10 7
mM). 8
Characterization. The size and morphology of the synthesized materials were 9
characterized using field-emission scanning electron microscopy (FE-SEM, JEOL 10
JSM-6700F) at an acceleration voltage of 5 kV, transmission electron microscope (TEM, 11
Hitachi H-7500), and HRTEM with an energy dispersive X-ray spectrometry 12
(HRTEM-EDX, FEI, Tecnai G2 F20). Zeta-potential measurements were conducted in 13
water by a potential analyzer (Zetasizer Nano ZS, Malvern Instruments). UV-Vis 14
absorption tests were carried out on Shimadzu UV-2450 spectrophotometer in 15
transmission mode. 16
Highly selective visual detection of iron(Ⅲ) cations. The standard procedure is as 17
follows. Briefly, aliquots of 1 mM Fe3+
were added to the aqueous Au@PTA solutions (1 18
mL) to yield the final concentration series (1.0 μM - 400μM). We also investigated the 19
selectivity of our new approach for Fe3+
over other metal ions (Na+, K
+, Rb
+, Ag
+, Mg
2+, 20
Ca2+
, Mn2+
, Fe2+
, Co2+
, Ni2+
, Cu2+
, Zn2+
, Cd2+
, Hg2+
, Al3+
, Cr3+
, Dy
3+, Gd
3+, Nd
3+) under 21
the same conditions. The color change from red to blue indicates successful detection of 22
specific ions. It is to be noted that aggregates may form after a few days. UV-Vis spectra 23
were acquired to investigate the interaction between the ions and Au@PTA. 24
Visual detection of H2O2. Au@PTA solution was added to a 96-well plate to a volume of 1
100 L. Subsequently, Fe2+
was added to final concentration of 20 M. The reaction was 2
started by adding various volume of 100 M H2O2. 3
Acknowledgment 4
This paper was supported by Samsung Research Fund, Sungkyunkwan University, 5
2015. 6
Reference 7
[1] F. Faupel, V. Zaporojtchenko, T. Strunskus, M. Elbahri, Metal-Polymer 8
Nanocomposites for Functional Applications, Adv. Eng. Mater. 12 (2010) 1177-1190. 9
[2] D. Li, Q. He, J. Li, Smart core/shell nanocomposites: intelligent polymers modified 10
gold nanoparticles, Adv. Colloid Interface Sci. 149 (2009) 28-38. 11
[3] R. Ghosh Chaudhuri, S. Paria, Core/Shell nanoparticles: classes, properties, synthesis 12
mechanisms, characterization, and applications, Chem. Rev. 112 (2012) 2373-2433. 13
[4] H. Roghani-Mamaqani, V. Haddadi-Asl, M. Salami-Kalajahi, In situ controlled radical 14
polymerization: a review on synthesis of well-defined nanocomposites, Polym. Rev. 52 15
(2012) 142-188. 16
[5] H.J. Kim, Y.S. Choi, M.Y. Lim, K.H. Jung, D.G. Kim, J.J. Kim, et al., Reverse osmosis 17
nanocomposite membranes containing graphene oxides coated by tannic acid with 18
chlorine-tolerant and antimicrobial properties, J. Membrane Sci. 514 (2016) 25-34. 19
[6] Y.Z. Cao, R.F. Zheng, X.H. Ji, H. Liu, R.G. Xie, W.S. Yang, Syntheses and 20
characterization of nearly monodispersed, size-tunable silver nanoparticles over a wide 21
size range of 7-200 nm by tannic acid reduction, Langmuir, 30 (2014) 3876-3882. 22
[7] T.Y. Kim, S.H. Cha, S. Cho, Y. Park, Tannic acid-mediated green synthesis of 1
antibacterial silver nanoparticles, Arch. Pharm. Res. 39 (2016) 465-473. 2
[8] Y. Fang, J. Tan, T. Lan , S.G. F. Foo , D. G. Pyun, S. Lim, D.H. Kim, Universal 3
one-pot, one-step synthesis of core–shell nanocomposites with self-assembled tannic acid 4
shell and their antibacterial and catalytic activities, J. Appl. Polym. Sci. 135 (2018) 45829. 5
[9] T. Zeng, X.L. Zhang, Y.Y. Guo, H.Y. Niu, Y.Q. Cai, Enhanced catalytic application of 6
Au@polyphenol-metal nanocomposites synthesized by a facile and green method, J. Mater. 7
Chem. A 2 (2014) 14807-14811. 8
[10] M.J. Behrenfeld, A.J. Bale, Z.S. Kolber, J. Aiken, P.G. Falkowski, Confirmation of 9
iron limitation of phytoplankton photosynthesis in the equatorial pacific ocean, Nature 383 10
(1996) 508-511. 11
[11] P.G. Falkowski, R.T. Barber, V.V. Smetacek, Biogeochemical Controls and Feedbacks 12
on Ocean Primary Production, Science 281 (1998) 200-207. 13
[12] M.A. Smith, P.L. Harris, L.M. Sayre, G. Perry, Iron accumulation in Alzheimer 14
disease is a source of redox-generated free radicals, Proc. Natl. Acad. Sci. U. S. A. 94 15
(1997) 9866-9868. 16
[13] O. Blokhina, E. Virolainen, K.V. Fagerstedt, Antioxidants, oxidative damage and 17
oxygen deprivation stress: a review, Ann. Bot. 91 (2003) 179-194. 18
[14] M.P. Mattson, Pathways towards and away from Alzheimer's disease, Nature 430 19
(2004) 631-639. 20
[15] X. Liu, E.C. Theil, Ferritins: dynamic management of biological iron and oxygen 21
chemistry, Acc. Chem. Res. 38 (2005) 167-175. 22
[16] X.J. Zhao, R.X. He, M. Li, N.W. Zhao, Y.F. Li, C.Z. Huang, Formation of blue 1
fluorescent ribbons of 4', 4''''-(1, 4-phenylene) bis (2, 2': 6', 2''-terpyridine) and highly 2
selective visual detection of iron (ii) cations, RSC Adv. 3 (2013) 111-116. 3
[17] R.L. Liu, H.Y. Lu, M. Li, S.Z. Hu, C.F. Chen, Simple, efficient and selective 4
colorimetric sensors for naked eye detection of Hg2+
, Cu2+
and Fe3+
, RSC Adv. 2 (2012) 5
4415-4420. 6
[18] A. Mitra, B. Ramanujam, C.P. Rao, 7
1-(d-Glucopyranosyl-2′-deoxy-2′-iminomethyl)-2-hydroxynaphthalene as chemo-sensor 8
for Fe3+
in aqueous HEPES buffer based on colour changes observable with the naked eye, 9
Tetrahedron Lett. 50 (2009) 776-780. 10
[19] S.P. Wu, Y.P. Chen, Y.M. Sung, Colorimetric detection of Fe3+
ions using 11
pyrophosphate functionalized gold nanoparticles, Analyst 136 (2011) 1887-1891. 12
[20] D. Wei, Y. Sun, J. Yin, G. Wei, Y. Du, Design and application of Fe3+ probe for 13
“naked-eye” colorimetric detection in fully aqueous system, Sens. Actuators, B 160 (2011) 14
1316-1321. 15
[21] X. Chen, X. Zhou, J. Hu, Pt-DNA complexes as peroxidase mimetics and their 16
applications in colorimetric detection of H2O2 and glucose, Anal. Methods 4 (2012) 17
2183-2187. 18
[22] K. Nitinaivinij, T. Parnklang, C. Thammacharoen, S. Ekgasit, K. Wongravee, 19
Colorimetric determination of hydrogen peroxide by morphological decomposition of 20
silver nanoprisms coupled with chromaticity analysis, Anal. Methods 6 (2014) 9816-9824. 21
[23] T. Chen, L. Tian, Y. Chen, B. Liu, J. Zhang, A facile one-pot synthesis of Au/Cu2O 22
nanocomposites for nonenzymatic detection of hydrogen peroxide, Nanoscale Res. Lett. 1
10 (2015) 935. 2
[24] J. Guan, J. Peng, X. Jin, Synthesis of copper sulfide nanorods as peroxidase mimics 3
for the colorimetric detection of hydrogen peroxide, Anal. Methods 7 (2015) 5454-5461. 4
[25] L. Guo, A.R. Ferhan, H. Chen, C. Li, G. Chen, S. Hong, et al., Distance-mediated 5
plasmonic dimers for reusable colorimetric switches: a measurable peak shift of more than 6
60 nm, Small 9 (2013) 234-40. 7
[26] M. Grzelczak, J. Perez-Juste, P. Mulvaney, L.M. Liz-Marzan, Shape control in gold 8
nanoparticle synthesis, Chem. Soc. Rev. 37 (2008) 1783-1791. 9
[27] Y. Sun, Y. Xia, Shape-controlled synthesis of gold and silver nanoparticles, Science 10
298 (2002) 2176-2179. 11
[28] T.S. Sileika, D.G. Barrett, R. Zhang, K.H.A. Lau, P.B. Messersmith, Colorless 12
multifunctional coatings inspired by polyphenols found in tea, chocolate, and wine, Angew. 13
Chem. Int. Edit. 52 (2013) 10766-10770. 14
[29] J. Fei, J. Zhao, C. Du, A. Wang, H. Zhang, L. Dai, et al., One-pot ultrafast 15
self-assembly of autofluorescent polyphenol-based core@shell nanostructures and their 16
selective antibacterial applications, ACS Nano 8 (2014) 8529-8536. 17
[30] M. Jastrzebska, J. Zalewska-Rejdak, R. Wrzalik, A. Kocot, I. Mroz, B. Barwinski, et 18
al., Tannic acid-stabilized pericardium tissue: IR spectroscopy, atomic force microscopy, 19
and dielectric spectroscopy investigations, J. Biomed. Mater. Res., Part A 78 (2006) 20
148-156. 21
[31] I. Erel-Unal, S.A. Sukhishvili, Hydrogen-bonded multilayers of a neutral polymer 22
and a polyphenol, Macromolecules 41(2008) 3962-3970. 1
[32] L. Lybaert, E. De Vlieghere, R. De Rycke, N. Vanparijs, O. De Wever, S. De Koker, 2
et al., Bio-hybrid tumor cell-templated capsules: a generic formulation strategy for tumor 3
associated antigens in view of immune therapy, Adv. Funct. Mater. 24 (2014) 7139-7150. 4
[33] D. Gursoy, T. Bicer, J.D. Almer, R. Kettimuthu, S.R. Stock, F. De Carlo, Maximum a 5
posteriori estimation of crystallographic phases in X-ray diffraction tomography, Philos. 6
Trans. A. Math. Phys. Eng. Sci. 373 (2015). 7
[34] K. Liang, R. Ricco, C.M. Doherty, M.J. Styles, S. Bell, N. Kirby, et al., Biomimetic 8
mineralization of metal-organic frameworks as protective coatings for biomacromolecules, 9
Nat. Comm. 6 (2015) 7240. 10
[35] D.J. Tobler, J.D. Rodriguez-Blanco, K. Dideriksen, N. Bovet, K.K. Sand, S.L.S. Stipp, 11
Citrate effects on amorphous calcium carbonate (ACC) structure, stability, and 12
crystallization, Adv. Funct. Mater. 25 (2015) 3081-3090. 13
[36] X. Guo, Y. Ying, L. Tong, Photonic nanowires: from subwavelength wave guides to 14
optical sensors, Acc. Chem. Res. 47 (2013) 656-666. 15
16