Embed Size (px)
Citation preview

© 2014 OCULUS INFO INC.
Strata NY: Hadoop and Beyond, 10/17/2014 David Jonker, Rob Harper
Highly Scalable Tile-Based Visualization for Exploratory Data Analysis

2"© 2014 OCULUS INFO INC.
Making Sense of Big Data
Big Data for us is in complexity. We have complex data. We have big complexity. – Analyst No one wants more data, everyone wants better data. - Analyst
“
“ ”
”Report Static Snapshot
‘Slice and Dice’ Unstructured toolbox of widgets for data exploration
Dashboard Basic charts assembled through drag and drop
?"
More Information Available To make an effective decision
Less Time Required
to acquire insights
Overwhelming
Oversimplified
3"© 2014 OCULUS INFO INC.
Challenges of Effective Visual Analytics
ESSENTIAL o Richly informative and true to reality. o Answers easily arrived at, easily understood. ALSO, every business problem is unique, but cannot afford an entirely unique solution for every problem. o Need relatively universal, repeatable technical approaches.

4"© 2014 OCULUS INFO INC.
Tile-Based Visualization for Big Data
WEB MAPPING APPS have an established model for intuitively navigating and understanding big data, based on zoomable multiresolution tiles and layers.
BUT geospatial data is relatively static. How can a tiled, layered approach be applied with dynamic data, and non-geospatial problems, at scale?
5"© 2014 OCULUS INFO INC.
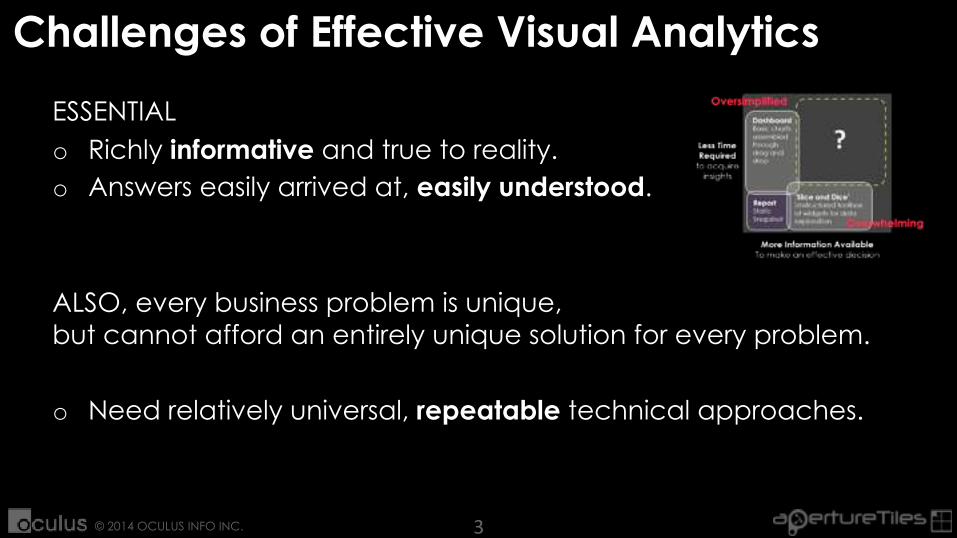
Aperture Tiles
TILE-BASED VISUAL ANALYTICS o Hierarchical data tiling using cluster computing. o Interactive on-demand image tile generation. o Layers of raw data and derivative analytics.
OPEN SOURCE o Oculus research product. o Built on Apache Spark and Hadoop. o Preparing for version one product release.

6"© 2014 OCULUS INFO INC.
Example Applications
Social Media Biomedical Geospatial Financial

187,000,000 NYC Taxi Trips
Photo by Sakeeb Sabakka, CC

8"© 2014 OCULUS INFO INC.
NYC Taxi Data
Taxi ID Hack, Medallion, Vendor
Origin Location, Time
Dest Location, Time
Trip Duration, Distance, # Passengers
Fare $ Base, Tip, Tolls, Taxes, Payment method
FOIL request by Chris Whong, March 2014

Visualizing NYC Taxi Data
Eric Fischer, MapBox
www.mapbox.com/blog/nyc-taxi/

Continue presentation
Demo

Visualizing all of the data including “bad data” helps identify source of errors, understand how errors manifest, and how they may affect analysis
Pick-up/drop-off GPS fixes enroute
Location data errors
GPS blurring likely caused by tall buildings

Spanish Harlem
Brooklyn
Brooklyn
Comparing Pick-up and Drop-off Locations Red – Pick-up Locations Blue – Drop-off Locations Multi-scale visualization allows exploration of macro and micro trends.

Average Tip % by Pick-up Location* Red ~15% Green ~20% Yellow ~25% *CC payments only
Using a spectral color ramp helps us compare differences across the data (luminance better for multi-series). Tiles uses aggregate data to generate rasters, not pre-computed images
Downtown bankers tip less than mid-town shoppers?
LaGuardia passengers tip more than those from JFK?

Distance Red = 1m
Yellow = 18m
Easily switching between fully zoomable multi-scale layers makes the task of understanding the data easier.
Very short ride anomaly in upper east side exposed by range filtering – hospital sending patients on a short ride to clinic?
Roles reversed

Average $/hr by Pick-up Location Red $30/hr Yellow $75/hr Calculated using: (fare + tip) / (duration of trip + time until next fare)
Brooklyn
Hot zones at ends of tunnels due to GPS fix lag observed earlier? Profitability correlates with pickup likelihood on one-way streets

Average $/hr by Drop-off Location Red $30/hr Yellow $60/hr Calculated using: (fare + tip) / (duration of trip + time until next fare)
Up until now have focused on pick-up location, what about drop-off?

Average annual taxi income by pick-up location Red $80k Yellow $100k

Fare Total vs Time Feb 2013 “Nor`easter storm” Expensive fares drop off by low fares unaffected
Tiles approach isn’t limited to geographic plots X-Y crossplots can show 3 arbitrary dimensions and expose macro and micro patterns. e.g. Time + Fare Total + Frequency

World Cup Tweets player @mentions
Photo by paulisson miura, CC

100M geolocated tweets during the World Cup

Analytic overlays showing @mention summaries

Team and Player @mention sentiment Interactive overlays

Tiles from 10,000’

24"© 2014 OCULUS INFO INC.
Three Tiers
Source Data
Tiled Data Views
Query results
Tile Generation
Tile Service
Tile Client

25"© 2014 OCULUS INFO INC.
Tile Generation
Source Data
Tile Generation
Tiled Data Views

26"© 2014 OCULUS INFO INC.
Tiled Data Views
Indexed by tile key - one view/row per tile
Aggregate views of source data designed for answering analytic questions
Optimized for query speed
AVRO / Thrift

27"© 2014 OCULUS INFO INC.
16% 17% 14% 10%
18% 20% 17% 15% 12%
21% 22% 21% 19% 14%
20% 21% 17% 15%
21% 19% 18%
16% 17% 14%
18% 20% 17% 15%
21% 22% 21% 19%
20% 21% 17% 15% 12%
21% 19% 18% 14% 13%
16% 17% 14% 10% 21%
18% 20% 17% 15% 20%
21% 22% 21% 19% 16%
20% 21% 17% 15% 18%
21% 19% 18% 18% 19%
16% 17% 14% 10% 14%
18% 20% 17% 15%
21% 22% 21%
20% 21%
21% 19%
Tiled Data Views
16% 17% 14% 10%
18% 20% 17% 15% 12%
21% 22% 21% 19% 14%
20% 21% 17% 15%
21% 19% 18%
Taxi Tip %

28"© 2014 OCULUS INFO INC.
Tiled Data Views
World Cup Sentiment
Top Mentions: [ … ] Sentiment Values: [ … ] Tweets per minute: [ … ]
Top Mentions: [ … ] Sentiment Values: [ … ] Tweets per minute: [ … ]
Top Mentions: [ … ] Sentiment Values: [ … ] Tweets per minute: [ … ]
Top Mentions: [ … ] Sentiment Values: [ … ] Tweets per minute: [ … ]

29"© 2014 OCULUS INFO INC.
Tile Generation
Tile Service
query 16% 17% 14% 10%
18% 20% 17% 15% 12%
21% 22% 21% 19% 14%
20% 21% 17% 15%
21% 19% 18%

30"© 2014 OCULUS INFO INC.
Tile Client
Tile Map Service (TMS) http://{rootURL}/{layer}/{zoom}/{x}/{y}.png
OpenLayers
ESRI

31"© 2014 OCULUS INFO INC.
Tile Client
Ready-to-go Tiled Data Browser

https://github.com/oculusinfo/aperture-tiles
http://tiles.oculusinfo.com

33"© 2014 OCULUS INFO INC.
Key Points of Value
PLOTTING ALL of the data for richer, truer insights. o Reveals truths in the data that summaries cannot. o Provides important context and evidence for analytics. TILED, LAYERED user interface for natural, scalable exploration. o Intuitive navigation and understanding. o Analytic layers at levels of detail, down to raw provenance.
INTERACTIVE analysis with data tiling and analytics. o Rapidly repeatable tailored solutions, with filtering + selection.

What’s Next?
50,000,000 link interactive graph 1 trillion+ pixels of resolution

35"© 2014 OCULUS INFO INC.
What’s Next?
Oculus gratefully acknowledges the support of DARPA in research and development of this work.
Streaming Data and live query
More advanced filtering and analytics
Interactive Tiled Graphs
01010100110 >
Questions?