Embed Size (px)
Citation preview

S1
Highly porous and stable metal-organic frameworks for uranium
extraction
Michaël Carboni,
a† Carter W. Abney,a† Shubin Liu,
b and Wenbin Lin*
a
aDepartment of Chemistry, CB#3290, University of North Carolina,
Chapel Hill, NC 27599; [email protected]
bResearch Computing Center, University of North Carolina, Chapel
Hill, NC 27599.
Table of Contents
1 – General Procedures Page S2
2 – Ligand Synthesis Pages S3-S4
3 – Synthesis of MOFs Pages S4-S5
4 – Characterization of Materials Pages S5-S11
5 – Uranyl uptake Studies Pages S12-S15
6 – Computational Data Pages S15 – S17
7 – References Page S19
1 - General Experimental:
All solvents were purchased from commercial sources and used without further purification.
Thermogravimetric analysis (TGA) was performed in air using a Shimadzu TGA-50 equipped
with a platinum pan and heated at a rate of 5 °C per minute under air. 1H,
13C, and DEPT-135
NMR spectra were recorded on Bruker NMR 400 NB and 400 DRX Spectrometers at 400 MHz.
The 1H spectra were referenced to the proton resonance resulting from incomplete deuteration of
deuterated DMSO-d6 (δ 2.49). The 13
C spectra were referenced to deuterated DMSO-d6 (δ 39.52).
Mass spectrometric analyses were conducted using positive-ion electrospray ionization on a
Bruker BioTOF Mass Spectrometer. Powder X-ray diffraction (PXRD) patterns were collected
on a Bruker SMART APEX II diffractometer using Cu radiation. The PXRD patterns were
Electronic Supplementary Material (ESI) for Chemical ScienceThis journal is © The Royal Society of Chemistry 2013

S2
processed with the APEX II package using PILOT plug-in. Uranium concentration was
determined by UV-Vis measurements using a UV-2401 PC UV-Vis recording spectrometer.
Arsenazo(III) dye was used as a chelating agent, binding free U in solution and providing an
intense absorption at 652 nm (Talanta, 2005, 66, 961; Talanta, 2010, 82, 19). A stock solution of
arsenazo III 0.1% (w/v) was prepared to ensure consistency throughout all experiments. Aliquots
of supernatant were combined with 40 μL concentrated HNO3 and 200 μL arsenazo III stock
solution prior to thorough mixing and sample analysis. Confirmation of U concentration was
obtained with a Varian 820-MS Inductively Coupled Plasma-Mass Spectrometer (ICP-MS). A
Hitachi 4700 field emission scanning electron microscope (SEM) was used to determine particle
size and morphology. To prepare SEM samples, nanoparticulate dispersions were diluted and
thoroughly dispersed in EtOH via sonication. A drop of the dispersion was then placed on glass
substrate and allowed to air dry. A Cressington 108 Auto Sputter Coater equipped with a Au/Pd
(80/20) target and MTM-10 thickness monitor was then used to coat the sample with a thin
conductive layer before taking SEM images. Energy dispersive X-ray spectroscopy (EDS) was
used to determine elemental composition of MOF 3, using an Oxford Instruments 7200 INCA
PentaFET×3 Energy Dispersive X-ray Spectrometer. The EDS data were processed with the Inca
Microanalysis Suite. Each EDS sample was prepared by placing a powder sample on carbon
tape. The spectrometer was referenced to Cu immediately prior to obtaining elemental
composition by EDS.
2 – Ligand Synthesis:
Figure S1: Scheme depicting synthesis of ligands H2L1 and H2L2.
Me2L1 H2L1 H2L2
Electronic Supplementary Material (ESI) for Chemical ScienceThis journal is © The Royal Society of Chemistry 2013

S3
2-1 Synthesis of Me2L1: Ligand Me2L1was prepared by a slighly modified protocol from
Chem. Eur. J. 2011, 17, 6643. Under air- and moisture-sensitive conditions, 2,5-dibromoaniline
(0.5 g, 2.0 mmol), 4-(methoxycarbonyl)phenylboronic acid (1.1 g, 6.1 mmol), and CsF (2 g, 1.3
mmol) were dissolved in THF (15 mL). To this solution, 0.15 g (0.7 mmol) of Pd(OAc)2, and 0.4
g (2 mmol) of PPh3 were added, and the reaction mixture was stirred at 60°C for 48 h. After
cooling to room temperature, the reaction mixture was poured into deionized water (25 mL) and
the aqueous phase was extracted with CH2Cl2. The combined organic phases were concentrated
in vacuo. The brown solid residue was dissolved in CH2Cl2 and purified by silica gel column
chromatography. Elution with CH2Cl2/Et2O (50 :1 by volume; Rf = 0.35) gave a slightly yellow
solid (0.33 g, 1 mmol Yield : 25 %). 1H NMR (400 MHz, (CD3)2SO): 8.05 (4H), 7.79 (2H), 7.66
(2H), 7.17 (2H), 7.04 (1H), 5.13 (2H, NH2), 3.89 (6H, OMe).
2-2 Synthesis of H2L1: A suspension of Me2L1 (0.33 g, 1 mmol) in THF (65 mL) was
heated to 40°C. A solution of KOH in methanol (5.5 mol.L-1
; 32 mL, 0.18 mol) was added and
the reaction mixture was stirred at 40°C for 16 h. The suspension was cooled to room
temperature and precipitate was collected by centrifugation. The isolated colorless solid was
suspended in THF (25 mL) and 3.3 mL trifluoroacetic acid was added. After the suspension had
been stirred for 1.5 h at room temperature, 65 mL of water were added and the yellow solid was
isolated, washed with Et2O and dried in vacuo to obtain 0.3 g (0.9 mmol, Yield : 90 %) of slight
yellow powder. 1H NMR: (400 MHz, (CD3)2SO):12.94 (brs, 2H, OH), 8.02 (4H), 7.72 (2H), 7.61
(2H), 7.15 (2H), 7.03 (1H), 5.11 (brs, 2H, NH2). 13
C NMR: (100 MHz, (CD3)2SO, the signal
assignement is in agreement with the DEPT-135 spectrum): 167.63 (COOH) ; 146.20, 144.99,
144.24, 139.96 (C1, C1’, C4’, C1’’) ; 131.31, 130.40, 130.28 (CH); 129.99, 129.56 (C4, C4’’);
129.19, 126.96 (CH); 125.07 (C2’); 115.99 (C5’); 114.29 (C3’).
2-3 Synthesis of H2L2: Under air- and moisture-sensitive conditions, 100 mg (0.3 mmol)
of H2L1 was dissolved in 5 mL of dry DMSO, to which 1.2 eq. of OCN-P(O)(OEt)2 (0.055 ml,
0.36 mmol) was added. The solution was stirred 24 h at 50°C. The solvent was removed under
vaccuum and the product used without further purification. 1H NMR: (400 MHz, (CD3)2SO):
12.97 (brs, 2H, OH), 8.62 (d, 1H, NH), 8.25 (d, 2H), 8.05 (dd, 4H), 7.81 (d, 2H), 7.52 (d, 2H),
7.38 (d, 1H), 4.45 (1H, NH), 3.98 (q, 6H, CH2), 1,21 (t, 9H, CH3). 13
C NMR: (100 MHz,
Electronic Supplementary Material (ESI) for Chemical ScienceThis journal is © The Royal Society of Chemistry 2013
S4
(CD3)2SO, the signal assignement is in agreement with the DEPT-135 spectrum): 166.97
(COOH); 151.95 (CO); 143.56, 142.14, 139.10, 135.59 (C1, C1’, C4’, C1’’); 132.48 (C4);
129.96, 129.86 (CH) ; 129.82 (C4’’), 129.62, 129.20, 126.69 (CH), 122.66, 121.34 (CH5’,
CH3’), 62.72 (CH2), 15.76 (CH3). ESI-MS: m/z [M+H+]= 513.19.
3 - Synthesis of Metal-Organic-Frameworks:
3-1 Synthesis of MOF 1: 60 mg of Zr(Cl4) (0.25 mmol), 970 mg of benzoic acid (8
mmol) were dissolved in 12 mL of DMF, aided by 5 minutes of sonication . To this clear
solution, 102 mg (0.3 mmol) of H2L1 were dissolved and 0.021 mL of water were added. The
solution was heated to 70°C for 3 days yielding a white crystaline powder. The solid was
collected by centrifugation, followed by washing 5 times with DMF and 3 times with EtOH
followed by drying under vacuum.
3-2 Synthesis of MOF 2: 65 mg of Zr(Cl4) (0.27 mmol) and 1.05 g (8.6 mmol) of benzoic
acid were dissolved in 12 mL of DMF, aided by 5 minutes of sonication. To this clear solution,
100 mg (0.32 mmol) of H2L2 were dissolved. The solution was heated to 70°C for 3 days. The
solvent was collected by centrifugation and the resulting material was washed 5 times with DMF
and 3 times with EtOH prior to drying under vacuum.
3-3 Synthesis of MOF 3: 60 mg of MOF 2 was suspended in 4 mL of CH2Cl2, to which
0.240 mL of Me3SiBr was added. After 12 hours, the material is isolated by centriguation,
washed with CH2Cl2 and and dispersed in CH2Cl2. 1 mL of water was added and the solution was
stirred for an additional 1 hour. The material was isolated by centrifugation, washed 3 times with
DMF and 3 times with EtOH before drying under vacuum.
4 - Characterization of Materials:
4-1 SEM analysis:
Electronic Supplementary Material (ESI) for Chemical ScienceThis journal is © The Royal Society of Chemistry 2013

S5
Figure S2: SEM of MOF 1.
Figure S3: SEM of MOF 3.
4-2 TGA analysis:
100 200 300 400 500 60020
30
40
50
60
70
80
90
100
% W
eigh
t re
main
ing
Temperature (C)
Electronic Supplementary Material (ESI) for Chemical ScienceThis journal is © The Royal Society of Chemistry 2013

S6
Figure S4: TGA analysis of MOF 1 (green), MOF 2 (red) and MOF 3 (blue).
Table S1: Comparison between measured and calculated TGA mass loss (%)
% MOF 1 MOF 2 MOF 3
Calculated Synthesized Corrected Calculated Synthesized Corrected Calculated Synthesized Corrected
Guest - 17 - - 19 - - 14 -
Linker 68 44 53 77 56 70 74 56 65
Residue 32 39 47 23 24 30 26 30 35
4-3 N2-uptake and Surface Area Analysis: The analyses were made with about 20 mg of
MOF washed successively with DMF, methanol, CH2Cl2 and benzene. The MOF was allowed to
soak overnight in benzene to ensure complete exchange of solvent. The benzene-filled material is
frozen at 0 °C and solvent is sublimed under vacuum overnight. The MOF is further desolvated
by heating for an additional 18 hours at 60 °C under vaccuum.
Figure S5: Top: Pore size distribution for MOF 1 (left), MOF 2 (right). Bottom: Pore size
distribution for MOF 3.
2 4 6 8 10 12 14 16 18 20
0.00
0.05
0.10
0.15
0.20
0.25
0.30
0.35
Dv(
d)
(m2/
g)
Pore diameter (nm)
2 4 6 8 10 12 14 16 18 20
0.00
0.01
0.02
0.03
0.04
0.05
0.06
0.07
Dv(
d) (m
2/g)
Pore diameter (A)
2 4 6 8 10 12 14 16 18 20
0.00
0.05
0.10
Dv(
d) (m
2/g)
Pore diameter (nm)
Electronic Supplementary Material (ESI) for Chemical ScienceThis journal is © The Royal Society of Chemistry 2013

S7
4-4 EDS analysis
Figure S6: EDS analysis of MOF 3.
4-5 Dye Uptake Experiment. Fresh crystals of MOFs (10 mg) were isolated by
centrifugation after synthesis. After washing the material with DMF and ethanol, the materials
were soaked overnight in a 1:1 water:methanol solution of 24 mM dye (Brilliant Blue R-250 or
Eosin Y, 24 mM, 2 mL). The resulting colored crystals were washed with water thoroughly until
supernatant was colorless. The washed samples were dried under vaccuum and analyzed by TGA.
With Brilliant Blue R 250 (BBR-250):
MOF-1 = 29.6 %, MOF-2= 0 %; MOF-3 = 19.6 %
With Eosin Y:
200 300 400 500 600
20
30
40
50
60
70
80
90
100 UiO-68-NH2
Dye
200 300 400 500 600
20
30
40
50
60
70
80
90
100
Dye
UiO-68-P(O)(OEt)2
200 300 400 500 600
0
20
40
60
80
100 Dye
UiO-68-P(O)(OH)2
Electronic Supplementary Material (ESI) for Chemical ScienceThis journal is © The Royal Society of Chemistry 2013

S8
MOF-1 = 44.84 %, MOF-2 = 0 % ; MOF-3 = 9.99 %
Figure S7: TGA analysis of Dye experiments with BBR-250 and Eosin Y.
4-6 Simulation of BET Surface Area and Determination of Solvent Accessible Volume
Simulation of N2 uptake for MOFs 1-3 was performed with Materials Studio version 5.0.0.0. The
sorption calculation module was used, with the task set to Adsorption Isotherm and the method to
Metropolis. The unit cells for MOFs 1-3 were packed with N2 molecules from a starting pressure
of 0.0001 kPa to 100 kPa at a temperature of 77 K. Equilibration steps were set to 2500000,
production steps were set to 100000, fugacity steps were set to 40, and the sorption isotherm was
set to logarithmic. Simulated surface areas were obtained by plotting a linearized BET equation
over the partial pressure region of 0.05 < P/P0 < 0.35, the slope of which equals the volume of a
monolayer of N2. To improve precision, calculations were performed using the slope and
intercept equations of Microsoft Excel 2010, version 14.0.6123.5001. Linear regressions over the
described range provided correlation coefficients greater than 0.9990 for all three MOFs. The
adsorption cross section used for N2 at 77K was 0.16 nm2.
Porosity in MOFs 1-3 was calculated with PLATON v 1.16, build date 05/29/2011 using the
SOLV subroutine to determine potential solvent-containing voids.
4-5 MOF Deprotection Study.
MOFs 2 and 3 were thoroughly washed with water before digestion in d6-DMSO with 0.1 M
D3PO4 and subsequent analysis by 1H NMR. Integrated values of the ethoxy protons were
compared to integrations in the aromatic region to determine the percent deprotected. Peaks
200 300 400 500 600
20
40
60
80
100
Temperature (C)
Wei
ght r
emai
ning
(%
) UiO-68-NH
2
Dye
200 300 400 500 600
0
20
40
60
80
100
Temperature (C)
Wei
ght r
emai
ning
(%
)
UiO-68-P(O)(OEt)2
Dye
200 300 400 500 600
20
40
60
80
100
Temperature (C)
Wei
ght r
emai
ning
(%
)
UiO-68-P(O)(OH)2
Dye
Electronic Supplementary Material (ESI) for Chemical ScienceThis journal is © The Royal Society of Chemistry 2013
S9
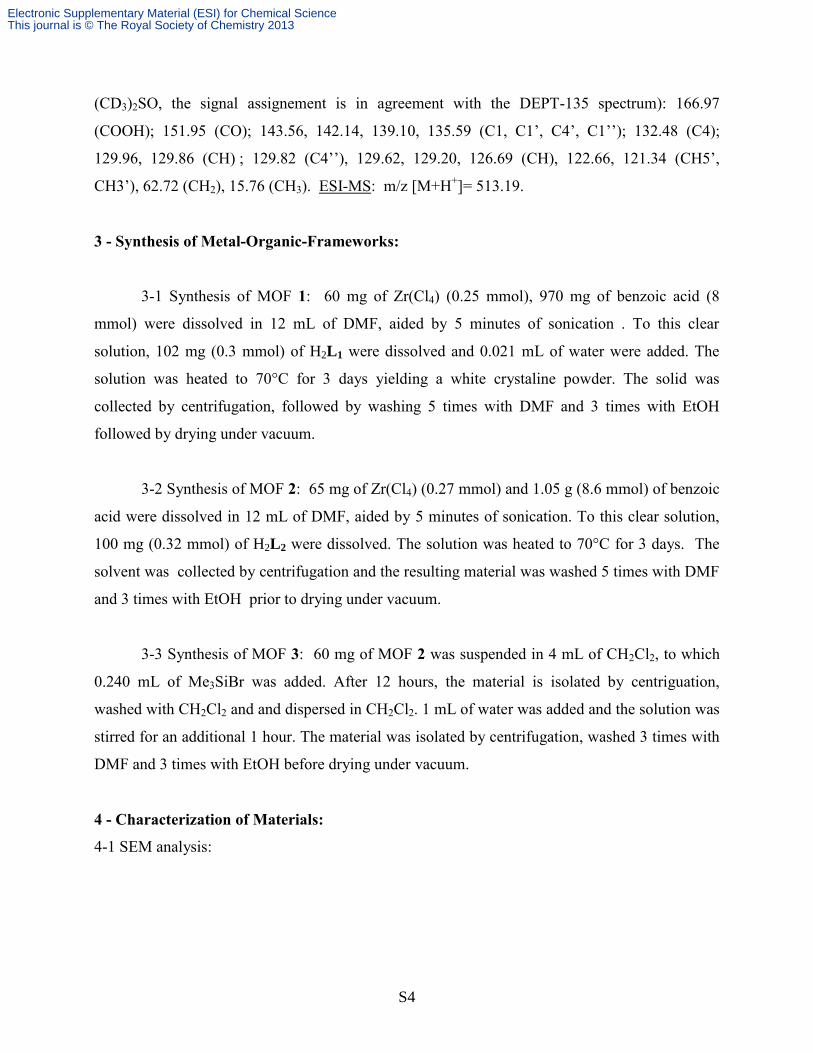
observed at δ = 7.95 and 7.50 can be assigned to benzoic acid bound to site defects in the Zr
SBU.
Figure S8:
1H NMR of digested MOF 2 (top) and
1H COSEY NMR (bottom).
Electronic Supplementary Material (ESI) for Chemical ScienceThis journal is © The Royal Society of Chemistry 2013

S10
Figure S9: 1H NMR of digested MOF 3 (top) and
1H COSEY NMR (bottom).
Electronic Supplementary Material (ESI) for Chemical ScienceThis journal is © The Royal Society of Chemistry 2013

S11
5 - Uptake of uranyl in solution of water: [U] = 5 ppm, pH = 2.5, m = 10 mg and V = 10 mL
5 – 1 Methodology
A stock uranium(VI) solution ([U] = 100 ppm) was prepared with uranyl acetate in nanopure
water. Solution pH was adjusted to 2.5 (±0.1) using HCl (3 M) solution to avoid precipitation of
uranyl at higher pH. In a typical sorption experiment, 10 mg of sorbent was added to 10 mL of U
solution at the desired concentration in a high-density polyethylene bottle (previously cleaned
with 5 % HNO3 and rinsed three times with nanopure water). The solutions were shaken at 300
rpm for 1 hour using a PRO Scientific VSOS-4P orbital shaker. The sorbent was separated via
centrifugation for 15 minutes at 12000 rpm. An aliquot of supernatant was analysed by UV-vis
spectroscopy. A sample of U solution without sorbent material was analyzed during each sorption
experiment as a negative control. The sorption capacity (qe (mg/g)) of U(VI) was calculated with
the following equation:
( )
where C0 and Ce are the concentration of U(VI) initially and at equilibrium, respectively. V is the
volume of solution, and m is the mass of sorbent in solution.
5-2 Desorption studies
The U adsorbed in the UiO materials was eluted by washing with 0.01 M; 0.1 M and 1 M HCl
aqueous solutions, successively. The elution step consists of the addition of 10 mL of HCl
solution followed by sonication to complete suspension (approximately 10 minutes) and
collection by centrifugation (15 minutes at 12000 rpm). This experiment was repeated with 0.1 M
and finally with 1 M HCl. U concentration in the washing solution was determined by UV-Vis,
as described previously.
5-3 Sorption studies with amidoxime Fibers:
Electronic Supplementary Material (ESI) for Chemical ScienceThis journal is © The Royal Society of Chemistry 2013

S12
Figure S8: Sorption and desorption studies under the same conditions as the MOFs for
amidoxime fibers.
5-3 Isotherms: Langmuir sorption isotherms were obtained by slight modification of the
process for sorption experiments. Samples of 10 mL water or artificial seawater were prepared
with uranyl concentrations of 30, 60, 80, 100, 150, 200, 250 and 300 ppm at pH 2.5. 10 mg of
sorbent was added to each sample and shaken as described previously. Sorbent was separated by
centrifugation, and U concentration in the supernatant was determined by UV-vis spectroscopy.
Table S2: Langmuir parameters obtained for MOF-2 and MOF-3 in water and artificial seawater
at pH=2.5
Table S3: Langmuir parameters obtained for MOF-2 in water at pH = 5
0
1
2
3
4
5 Water
Seawater
qe max
Elution
1 M HCl
Elution
0.1 M HCl
Elution
0.01 M HCl
Supernatant
qe
(mg/
g)
Langmuir parameters qmax (mg/g sorbent) KL (L/mg) R2
Water
MOF 2 217.4 0.644 0.995
MOF 3 108.9 0.079 0.964
Seawater
MOF 2 188.3 0.092 0.975
MOF3 32.5 0.063 0.960
Langmuir parameters qmax (mg/g sorbent) KL (L/mg) R2
MOF 2 179.2 0.058 0.961
Electronic Supplementary Material (ESI) for Chemical ScienceThis journal is © The Royal Society of Chemistry 2013
S13
0 20 40 60 80 100 120 140 160 180 2000
20
40
60
80
100
120
140
160
180q
e (
mg
/g)
Ce (mg/L)
MOF 2
MOF 3
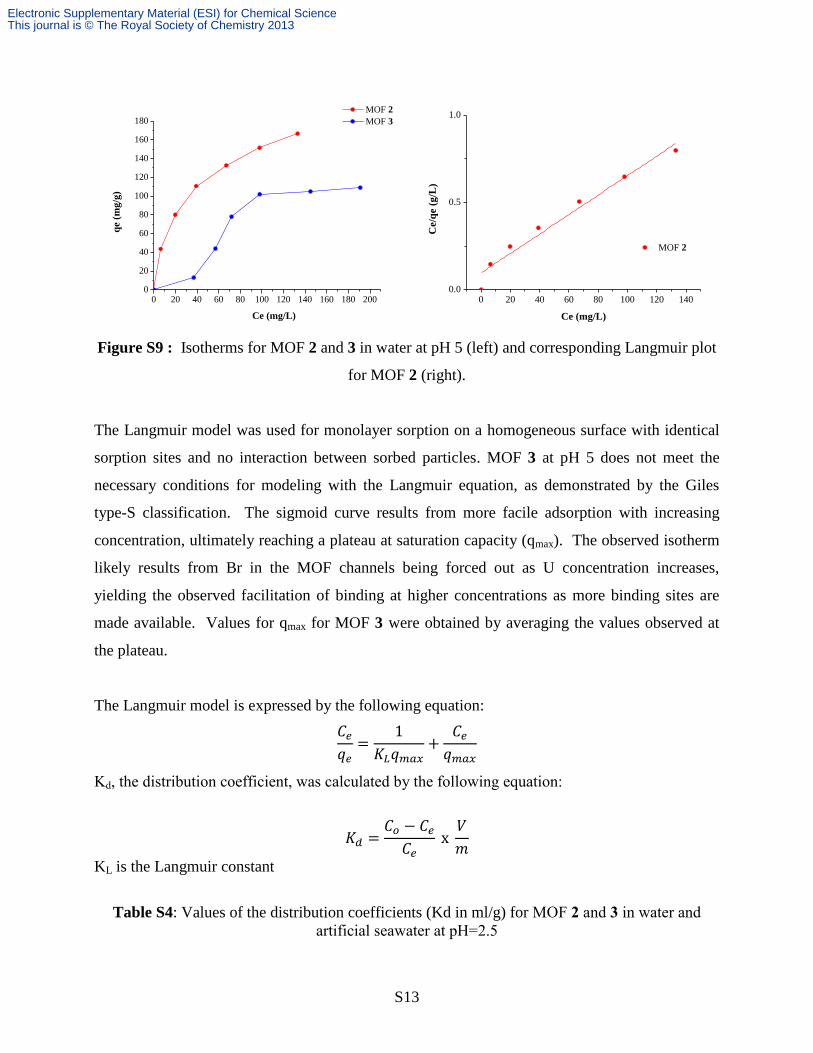
Figure S9 : Isotherms for MOF 2 and 3 in water at pH 5 (left) and corresponding Langmuir plot
for MOF 2 (right).
The Langmuir model was used for monolayer sorption on a homogeneous surface with identical
sorption sites and no interaction between sorbed particles. MOF 3 at pH 5 does not meet the
necessary conditions for modeling with the Langmuir equation, as demonstrated by the Giles
type-S classification. The sigmoid curve results from more facile adsorption with increasing
concentration, ultimately reaching a plateau at saturation capacity (qmax). The observed isotherm
likely results from Br in the MOF channels being forced out as U concentration increases,
yielding the observed facilitation of binding at higher concentrations as more binding sites are
made available. Values for qmax for MOF 3 were obtained by averaging the values observed at
the plateau.
The Langmuir model is expressed by the following equation:
Kd, the distribution coefficient, was calculated by the following equation:
KL is the Langmuir constant
Table S4: Values of the distribution coefficients (Kd in ml/g) for MOF 2 and 3 in water and
artificial seawater at pH=2.5
0 20 40 60 80 100 120 1400.0
0.5
1.0
MOF 2
Ce/q
e (
g/L
)
Ce (mg/L)
Electronic Supplementary Material (ESI) for Chemical ScienceThis journal is © The Royal Society of Chemistry 2013

S14
MOF 2 MOF 3
Absorption 0.01 M HCl 0.1 M HCl 1 M HCl Absorption 0.01 M HCl 0.1 M HCl 1 M HCl
Water 499000 8803 650 196 130560 24000 1808 560
Seawater 32300 26800 880 380 24000 19000 1350 540
6 –Computational Data Table S5: Gas Phase Stability Data for [UO22+(L)x(OH2)y)]z Complexes as Determined by DFT Calculations
Motif Charge per L ΔH (kcal mol-1
)
I --- -34.62
II --- -35.83
III --- -20.99
I-I --- -58.13
II-II --- -64.52
III-III --- -34.94
I-II --- -59.48
I-III --- -46.92
II-III --- -50.13
I* -1 -188.89
II* -1 -205.97
III* -1 -186.96
I-I* -1 -293.66
II-II* -1 -312.18
III-III* -1 -291.37
I-III* -1 -289.59
II-III* -1 -307.78
Table S6: Geometrically Optimized Average Bond Lengths (Å) for [UO22+(H2O)]2+ in Gas Phase and Solvated
U=O U-OH2
Calculated 1.748 / 1.758 2.492 / 2.459
EXAFS1 1.76 2.41
Electronic Supplementary Material (ESI) for Chemical ScienceThis journal is © The Royal Society of Chemistry 2013

S15
Literature2 1.753 2.484
…/… refers to the results obtained by calculations in the gas phase and solvated with a
polarizable conductor calculation model
Table S7: Geometrically Optimized Bond Lengths (Å) for Gas Phase UO22+ Complexes
Motif U=O U-OH2 (Avg) C(O)1 – U P(O)1 – U C(O)2 – U P(O)2 – U
I 1.755 2.496 2.357 --- --- ---
II 1.754 2.495 --- 2.373 --- ---
III 1.755 2.504 2.384 2.403 --- ---
I-I 1.762 2.498 2.391 --- 2.386 ---
II-II 1.762 2.476 --- 2.366 --- 2.445
III-III 1.758 2.492 2.437 2.409 2.429 2.441
I-II 1.760 2.499 2.389 --- --- 2.401
I-III 1.761 2.474 2.386 --- 2.444 2.430
II-III 1.759 2.479 --- 2.371 2.467 2.417
I* 1.771 2.482 2.375 --- --- ---
II* 1.765 2.516 --- 2.239 --- ---
III* 1.767 2.561 2.359 2.236 --- ---
I-I* 1.775 2.492 2.354 --- 2.308 ---
II-II* 1.770 2.508 --- 2.395 --- 2.316
III-III* 1.779 2.560 2.461 2.282 2.398 2.384
I-III* 1.783 2.488 2.344 --- 2.500 2.268
II-III* 1.781 2.518 --- 2.305 2.453 2.298
Table S8: Geometrically Optimized Bond Lengths (Å) for Solvated UO22+ Complexes
Motif U=O U-OH2 (Avg) C(O)1 – U P(O)1 – U C(O)2 – U P(O)2 – U
I 1.763 2.473 2.350 --- --- ---
II 1.763 2.473 --- 2.351 --- ---
Electronic Supplementary Material (ESI) for Chemical ScienceThis journal is © The Royal Society of Chemistry 2013

S16
III 1.764 2.471 2.390 2.374 --- ---
I-I 1.767 2.490 2.369 --- 2.371 ---
II-II 1.772 2.465 --- 2.378 --- 2.366
III-III 1.768 2.465 2.407 2.405 2.405 2.423
I-II 1.768 2.484 2.368 --- --- 2.369
I-III 1.768 2.494 2.373 --- 2.386 2.403
II-III 1.768 2.466 --- 2.371 2.413 2.403
I* 1.767 2.475 2.317 --- --- ---
II* 1.771 2.494 --- 2.252 --- ---
III* 1.772 2.497 2.381 2.284 --- ---
I-I* 1.778 2.483 2.326 --- 2.337 ---
II-II* 1.778 2.499 --- 2.327 --- 2.347
III-III* 1.781 2.529 2.423 2.327 2.390 2.359
I-III* 1.782 2.503 2.353 --- 2.409 2.309
II-III* 1.786 2.510 --- 2.305 2.399 2.322
Complete citation for reference #58: Gaussian 09, Revision A.2, Frisch, M. J.; Trucks, G. W.;
Schlegel, H. B.; Scuseria, G. E.; Robb, M. A.; Cheeseman, J. R.; Scalmani, G.; Barone, V.;
Mennucci, B.; Petersson, G. A.; Nakatsuji, H.; Caricato, M.; Li, X.; Hratchian, H. P.; Izmaylov,
A. F.; Bloino, J.; Zheng, G.; Sonnenberg, J. L.; Hada, M.; Ehara, M.; Toyota, K.; Fukuda, R.;
Hasegawa, J.; Ishida, M.; Nakajima, T.; Honda, Y.; Kitao, O.; Nakai, H.; Vreven, T.;
Montgomery, Jr., J. A.; Peralta, J. E.; Ogliaro, F.; Bearpark, M.; Heyd, J. J.; Brothers, E.; Kudin,
K. N.; Staroverov, V. N.; Kobayashi, R.; Normand, J.; Raghavachari, K.; Rendell, A.; Burant, J.
C.; Iyengar, S. S.; Tomasi, J.; Cossi, M.; Rega, N.; Millam, J. M.; Klene, M.; Knox, J. E.; Cross,
J. B.; Bakken, V.; Adamo, C.; Jaramillo, J.; Gomperts, R.; Stratmann, R. E.; Yazyev, O.; Austin,
A. J.; Cammi, R.; Pomelli, C.; Ochterski, J. W.; Martin, R. L.; Morokuma, K.; Zakrzewski, V. G.;
Voth, G. A.; Salvador, P.; Dannenberg, J. J.; Dapprich, S.; Daniels, A. D.; Farkas, Ö.; Foresman,
J. B.; Ortiz, J. V.; Cioslowski, J.; Fox, D. J. Gaussian, Inc., Wallingford CT, 2009.
References
1. P. G. Allen, J. J. Bucher, D. K. Shuh, N. M. Edelstein and T. Reich, Inorg. Chem., 1997, 36, 4676.
2. C. Z. Wang, J. H. Lan, Y. L. Zhao, Z. F. Chai, Y. Z. Wei and W. Q. Shi, Inorg Chem, 2013, 52, 196.
Electronic Supplementary Material (ESI) for Chemical ScienceThis journal is © The Royal Society of Chemistry 2013


![Water-resistant porous coordination polymers for gas separation · 2018. 1. 2. · Porous coordination polymers (PCPs) [1-3], also called metal-organic frameworks (MOFs) [4-6], are](https://img.pdfslide.us/doc/110x75/611cd0eb98ab880b2806476c/water-resistant-porous-coordination-polymers-for-gas-separation-2018-1-2-porous.jpg)