Embed Size (px)
Citation preview

Highly dispersed PdS preferably anchored on In2S3 of
MnS/In2S3 composite for effective and stable hydrogen
production from H2S
Yi Lia,b, Shan Yua,b,*, Dmitry E. Doronkinc, Shiqian Weia,b, Meng Dana,b, Fan Wua,b,
Liqun Yed, Jan-Dierk Grunwaldtc, Ying Zhoua,b,*
aState Key Laboratory of Oil and Gas Reservoir Geology and Exploitation,
Southwest Petroleum University,
Chengdu 610500, China.
Email: [email protected] (Ying Zhou)
Email: [email protected] (Shan Yu)
bThe Center of New Energy Materials and Technology,
School of Materials Science and Engineering,
Southwest Petroleum University,
Chengdu 610500, China.
cInstitute for Chemical Technology and Polymer Chemistry and Institute of Catalysis
Research and Technology,
Karlsruhe Institute of Technology,
76131 Karlsruhe, Germany.
dEngineering Technology Research Center of Henan Province for Solar Catalysis,
Collaborative Innovation Center of Water Security for Water Source Region of
Mid-line of South-to-North Diversion Project of Henan Province,
Nanyang Normal University,
Nanyang 473061, China.

Abstract
As an important byproduct during natural gas exploitation, green utilization of
hydrogen sulfide (H2S) by photocatalysis has offered us the possibility for production
of clean hydrogen (H2) from H2S with low energy consumption. In this work, we have
successfully introduced well-dispersed palladium sulfide (PdS) which is preferably
loaded on In2S3 of MnS/In2S3 composite for improved photocatalytic hydrogen
evolution from H2S aqueous solution. In contrast to binary MnS/In2S3, ternary
MnS/In2S3/PdS has exhibited a remarkable and stable hydrogen production rate of
22.7 mmol g-1 h-1 with an apparent quantum yield of 34 % at around 395 nm. A
comprehensive structure characterization of the ternary composite including scanning
transmission electron microscopy (STEM) and X-ray absorption spectroscopy (XAS)
in combination with theoretical calculations confirm the good dispersion of PdS in the
composite. Moreover, we discovered that PdS preferably interact with In2S3 rather
than MnS in the composite through Pd-S-In bond on the interface of the two.
Photoluminescence (PL) spectra, surface photovoltage (SPV) spectra together with
transient photocurrent and electrochemical impedance spectra (EIS) demonstrate the
advantage of PdS for promoting the charge separation. This work sheds light on the
positive effect on the enhanced activity of the corresponding system resulting from
the preferable anchoring of highly dispersed PdS on In2S3 in the composite by
chemical Pd-S-In bond. Not only the high dispersion but also the preferable anchoring
of the co-catalyst in the composite could hence inspire people for more rational
designs of ternary composite in future.
Keywords:photocatalysis; hydrogen production; metal sulfide; preferable deposition;
high dispersity;
1. Introduction
Hydrogen sulfide (H2S), largely produced in oil and gas exploitation, has
attracted great attention focused on its efficient removal because of its corrosive
properties and high toxicity (LC50 approximately 500 ppm) [1-3]. H2S is largely
produced in the hydrodesulfurization process of heavy oil during exploitation,
in which hydrogen (H2) is consumed [4]. On the other hand, from the
standpoint of sustainable energy production, H2S is regarded as a good resource
resulting from its special elemental composition. In terms of H2S conversion,
various techniques have been proposed. Traditionally, H2S is handled in
industry with the Claus process [5], in which H2S is converted to sulfur and
H2O. But one should be aware of the potential of hydrogen contained in H2S as
well. Accordingly, other methods that focus on collection of H2 from H2S have
been developed [6-11]. Among them, photocatalysis is regarded as a promising
technique due to its potential for direct conversion of solar energy into clean
fuels [12-20]. Using photocatalysis one can recover the consumed H2 and
recycle it back in the hydrodesulfurization. Notably, photocatalytic hydrogen
evolution from H2S is thermodynamically more favorable compared to
traditional photocatalytic H2O splitting: G for H2S splitting (39.4 kJ mol−1) is
far less than that for water splitting (284.7 kJ mol−1) [21]. Hence, there is a
broader choice for the photocatalysts which could promote H2S decomposition.
Among various kinds of photocatalysts, metal sulfides exhibit many
advantages due to their suitable band structure and strong visible-light
absorption. Many research works focused on sulfides such as CdS [22-25], ZnS
[26], CuInS2 [27] have been reported; meanwhile, the development of other
metal sulfides is necessary [28]. In our previous work [29], we discovered that
MnS/In2S3 composite is an effective photocatalyst for hydrogen evolution from
H2S in the visible light region. Nevertheless, the catalytic activity of MnS/In2S3
is insufficient for practical application and further optimization is required.
Introduction of noble metal co-catalyst such as Pt [30] and Pd [31, 32] for
promotion of charge separation efficiency as well as surface reaction kinetics is

a widely recognized method for improving the photocatalytic efficiency.
However, the poisoning effect of H2S, which can inhibit the activity of noble
metals [33-35], makes it difficult to directly utilize Pt or Pd in H2S related
research. Hence, noble metal sulfides [36] were used instead due to their more
resistant properties to the harsh sulfidizing environment compared to pure noble
metals.
In order to boost the photocatalytic efficiency of MnS/In2S3 for decomposition of
H2S, palladium sulfide (PdS) could be selected as the cocatalyst for improved
charge separation accordingly. In previous report, the role of PdS in
photocatalysis has been revealed to facilitate transfer of photogenerated holes
on metal sulfides [37], and PdS has been reported to be a good co-catalyst when
combined with CdS [38], Zn0.5Cd0.5S [39] and ZnS-CuInS2 [40]. However,
traditional co-catalysts are prone to agglomeration during the activation and
photocatalysis [41, 42] decreasing the atomic efficiency of earth-scarce
palladium. To better exploit palladium, the size of co-catalyst particles should
be decreased to clusters or even to single atoms [43, 44], so that the fraction of
accessible active sites during photocatalysis could be maximized. More
importantly, when the size of the co-catalyst particles is small enough,
additional interaction between the co-catalyst and the substrate has been
reported in a series of works [45]. For example, it was also found that single Pd
atom strongly interacts with TiO2 and such interaction plays a crucial role in
preventing the sintering of Pd atoms [46]. Hence, it is of great importance to
prepare ultrasmall and well-dispersed PdS co-catalyst on MnS/In2S3 for
photosplitting of H2S.
In this work, we report on highly dispersed PdS anchored as a co-catalyst on
In2S3 of the MnS/In2S3 composite. Introduction of PdS improved the efficiency of
photocatalytic hydrogen evolution from H2S aqueous solution by approximately 6
times, reaching hydrogen evolution rate of 22.7 mmol g-1 h-1 and an apparent quantum
yield (AQY) of 34% at around 395 nm. Comprehensive in-depth characterization
including scanning transmission electron microscopy (STEM), X-ray photoelectron
spectroscopy (XPS) and X-ray absorption spectroscopy (XAS) were presented for
uncovering the structure of Pd species and their interaction with MnS/In2S3. Pd-In-S
interaction was detected in the system and theoretical calculations were furthermore
employed to analyze the formation mechanism of the bonds. Finally,
photoluminescence (PL) spectroscopy, surface photovoltage (SPV) spectroscopy,
photoelectrochemical tests in addition to density functional theory (DFT) calculations
revealed that PdS sites in the composite also facilitate the photogenerated charge
separation and the removal of oxidation product, which indicates the potential of
noble metal sulfides in sustainable utilization of H2S.
2. Experiments
2.1 Materials:
Manganese acetate (Mn(CH3COO)2·4H2O), indium chloride (InCl3·4H2O),
palladium chlorid (PdCl2) are purchased from Aladdin (Shanghai, China).
Thioacetamide (TAA) was supplied by Alfa Aesar. Sodium sulphide
(Na2S·9H2O), hydrochloric acid (HCl) and pyridine (C5H5N) were purchased
from Chron Chemicals (Chengdu, China). All of the materials were used as
received without further purification.
2.2 Synthesis of MnS/In2S3 composite:
MnS/In2S3 was prepared using the method reported previously [29].
Typically, 1.4 mmol manganese acetate, 0.6 mmol indium chloride and 9.0
mmol thioacetamide were dissolved in 25 mL pyridine to obtain a
homogeneous solution with continuous stirring. Then the transparent solution
was transferred into a 25 mL Teflon-lined stainless steel autoclave, which was
maintained at 180 oC for 30 h. The product was then collected and washed with
ethanol under ultrasound. After centrifugation and drying under vacuum at 60
oC overnight, a dark yellow powder was obtained. α-MnS and β-In2S3 were
synthesized using the same technique with only manganese acetate or indium
chloride added, respectively.

2.3 Preparation of PdS/MnS/In2S3 composite:
200 mg MnS/In2S3 composite powder was dispersed in 50 mL deionized
water with ultrasonic treatment for 0.5 h. Then 3 mL isopropanol and 0.375 mL
palladium chloride solution (with a concentration of 8 mg Pd/mL, prepared in
0.57 M HCl solution) were added dropwise to the suspension. After that, the
suspension was transferred to a 50 mL glass flask. With continuous stirring and
Ar gas flow, the flask was irradiated by a 300 W Xe lamp for 2 h. Ultimately,
the 1.5 wt.% Pd-MnS/In2S3 composite was collected, washed with ethanol for
several times and dried at 60 oC overnight. Here 1.5 wt.% means the weight
ratio of introduced Pd to MnS/In2S3 composite. In this way, MnS/In2S3
composites loaded with various amounts of Pd precursor were obtained. For
convenience, MI-Pd X% (X = 0.2 ~ 2) were used to represent the MnS/In2S3
composites with different amount of noble metal precursors added during the
preparation. As a reference, MI stands for MnS/In2S3 composite treated in the
same way but without addition of the Pd precursor. Fig. S1 shows the photos of
MI and MI-Pd 1.5%, noting that the color of sample turned dark yellow from
light yellow after introduction of Pd species. Additionally, α-MnS and β-In2S3
loaded with 1.5 wt.%% Pd were obtained by the same procedure.
2.4 Photocatalytic tests:
The photocatalytic performance tests were conducted using a home-built
setup [29]. At first, the system was flushed with Ar. Then 150.0 mL of HCl
solution (2.0 mol/L) was added dropwise into 150.0 mL Na2S solution
(1.0mol/L) to produce H2S gas in 3 - 4 h. The H2S gas was directly bubbled into
a 50 mL flask which contains 50 mL Na2S (0.1 mol/L) and Na2SO3 (0.6 mol/L)
solution as well as 2.5 mg photocatalyst. Subsequently, the flask was sealed and
then irradiated by a 300 W Xe lamp with a cutoff filter ( > 420 nm). The
hydrogen production rate was monitored using a Shimadzu GC-2010 Plus gas
chromatograph (GC) (Ar carrier gas, molecular sieve 5 Å columns, TCD
detector).
The apparent quantum yield (AQY) of sample was calculated using Eq. 1.
The number of incident photon was defined by using monochromatic LED
lamps (cf. Table S1).
AQY (%) =number of reacted electrons
number of incident photons× 100%
=number of hydrogen molecules ×2
number of incident photons× 100%
Eq.1
2.5 Photoelectrochemical tests:
Photoelectrochemical tests were carried out on a CHI660E electrochemical
workstation (Chenhua Instrument, Shanghai, China) equipped with a standard
three-electrode system. The working electrode was prepared by doctor-blade
coating method on fluorine doped tin oxide (FTO) with a film thickness of
about 50 μm and area of 4 cm2, which was further treated at 200 oC for 3 h in
Ar. Pt wire was used as the counter electrode and a saturated calomel electrode
(SCE) was the reference electrode. Na2SO3 solution in water (1.2 mol/L) was
used as the electrolyte.
2.6 Characterization:
The crystal structure and crystallinity of the samples were studied by
X-ray diffraction (XRD) with Cu Kα radiation using Philips X'Pert
diffractometer operated at 40 kV and 40 mA. The optical properties were
investigated by ultra-violet and visible light (UV-vis) diffuse reflectance
spectroscopy (DRS) and photoluminescence (PL) spectroscopy. UV-vis DRS
was carried out on a Shimadzu UV-2600 spectrophotometer equipped with an
integrating sphere and BaSO4 was used as a reflectance standard. PL spectra
were obtained on a Hitachi F-7000 fluorescence spectrophotometer.
Transmission electron microscopy (TEM, Tecnai G2 F30) was used to
investigate the morphology and nanostructure. High-angle annular dark field
(HAADF) images and energy dispersive X-ray spectra (EDS) were recorded on
a JEOL ARM200CF with a dual-type EDS detector (JED-2300T) and a FEI
Titan spherical aberration corrected scanning transmission electron microscope
(STEM). X-ray photoelectron spectroscopy (XPS) measurements were
performed using a Thermo ESCALAB 250Xi X-ray photoelectron spectrometer
using Al Kα radiation and all binding energies were referenced to the C 1s peak
at 284.8 eV. The pass energy for survey spectra and fine spectra are 150 eV and
30 eV, respectively. The N2 adsorption isotherms and Brunauer-Emmett-Teller
(BET) surface areas were determined by the nitrogen adsorption method with
Quadrasorb SI. The samples were degassed at 110 oC for 8 h under vacuum
before measurements. Surface photovoltage (SPV) measurements were
recorded using an Omni - λ 3007 monochromatic-light, including a lock-in
amplifier (SR830, Stanford research systems, Inc.), a light chopper and a
chamber.
X-ray absorption spectra (XAS) in terms of X-ray absorption near edge
structure (XANES) and extended X-ray absorption fine structure (EXAFS)
were measured at the CAT end station of the CAT-ACT beamline at the
Synchrotron Radiation Source at KIT, Karlsruhe [47]. The samples were
measured ex situ at the Pd K absorption edge in transmission mode in form of
pellets (53 mg of sample, diameter 5 mm). The beam size was 0.9 mm (vertical)
× 1 mm (horizontal). The spectra were normalized and the EXAFS background
subtracted and Fourier-transformed (in the k-range 3 – 13.5 Å-1) using the
ATHENA program from the IFFEFIT software package [48]. XANES spectra
were modeled using multiple scattering FEFF 9.6.4. ab initio code [49]. For the
PdS spectrum three calculations were performed by using PdS model structure
(ICSD collection code 61063) and calculating spectra for all three inequivalent
Pd sites. The spectra were then averaged taking into account the corresponding
multiplicities. For Pd-doped In2S3 model, the calculations were conducted only
for a tetrahedral site (according to the EXAFS suggesting 4 neighbouring S
atoms) in a β-In2S3 framework (ICSD collection code 202353). For Pd-doped
MnS sphalerite, literature-reported model structure (ICSD collection code
76205) doped with nuclear Pd was chosen based on the first shell coordination
number 4 and the matching XRD pattern. For the PdS anchored on the surface
of In2S3 and MnS model structures optimized by DFT calculations were used.
Radii of the clusters for self-consistent potential calculations (SCF) and for full
multiple scattering calculations (FMS) were set as 5 Å. The position of the
white line maximum in the theoretical spectra was aligned to the experimental
spectra. First shell EXAFS analysis was performed using ARTEMIS (IFFEFIT)
[48] and a least square method in R-space (using k, k2, k3-weighted data)
between 1.0 and 2.5 Å. DFT optimized Pd-doped In2S3 and PdS anchored on
In2S3 were used as model structures and the coordination numbers, interatomic
distances, energy shift (δE0) and mean square deviation of interatomic distances
(σ2) were refined. The absolute misfit between theory and experiment was
expressed as ρ.
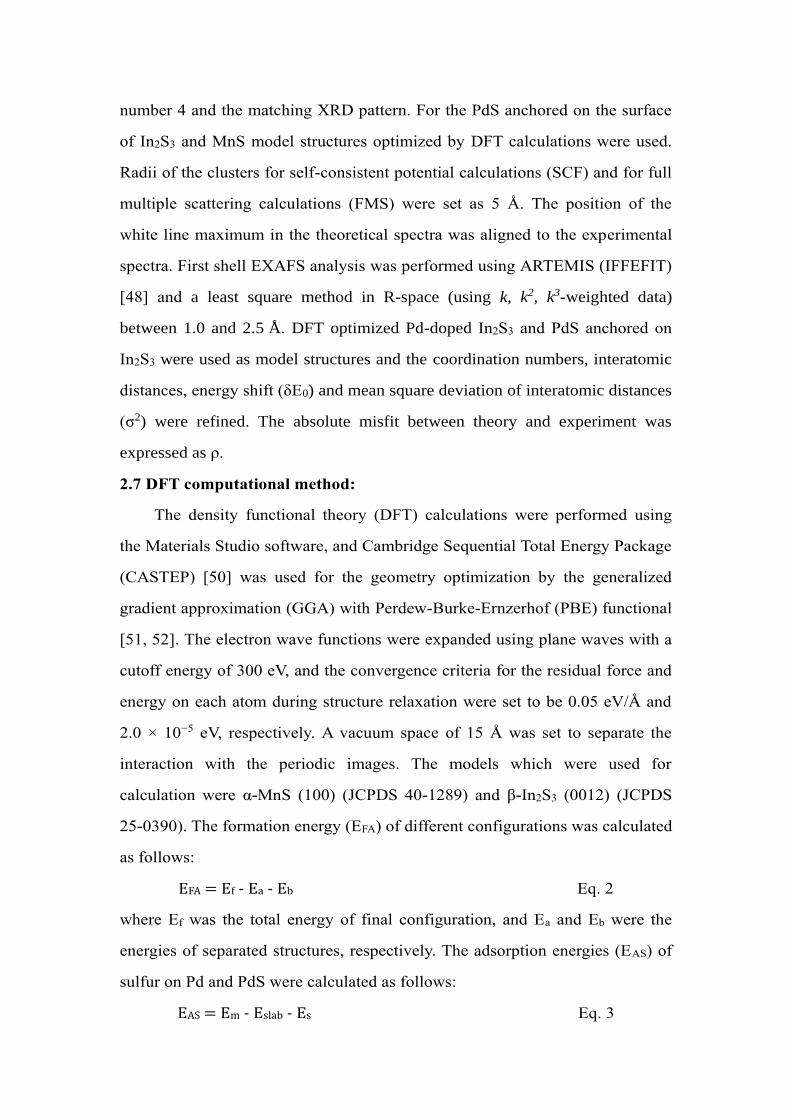
2.7 DFT computational method:
The density functional theory (DFT) calculations were performed using
the Materials Studio software, and Cambridge Sequential Total Energy Package
(CASTEP) [50] was used for the geometry optimization by the generalized
gradient approximation (GGA) with Perdew-Burke-Ernzerhof (PBE) functional
[51, 52]. The electron wave functions were expanded using plane waves with a
cutoff energy of 300 eV, and the convergence criteria for the residual force and
energy on each atom during structure relaxation were set to be 0.05 eV/Å and
2.0 × 10⁻⁵ eV, respectively. A vacuum space of 15 Å was set to separate the
interaction with the periodic images. The models which were used for
calculation were α-MnS (100) (JCPDS 40-1289) and β-In2S3 (0012) (JCPDS
25-0390). The formation energy (EFA) of different configurations was calculated
as follows:
EFA = Ef - Ea - Eb Eq. 2
where Ef was the total energy of final configuration, and Ea and Eb were the
energies of separated structures, respectively. The adsorption energies (EAS) of
sulfur on Pd and PdS were calculated as follows:
EAS = Em - Eslab - Es Eq. 3
where Em was the total energy of ultimate adsorption configuration, and Eslab
was the total energy of the clean slab and Es was the energy of S atom.
3. Results and discussion
3.1 Photocatalytic H2 evolution efficiency from H2S saturated solution
Pd species were introduced on MnS/In2S3 (abbreviated as MI) composite
by photodeposition method. Photocatalytic hydrogen evolution from saturated
H2S aqueous solution was then carried out with the as-obtained MI-Pd
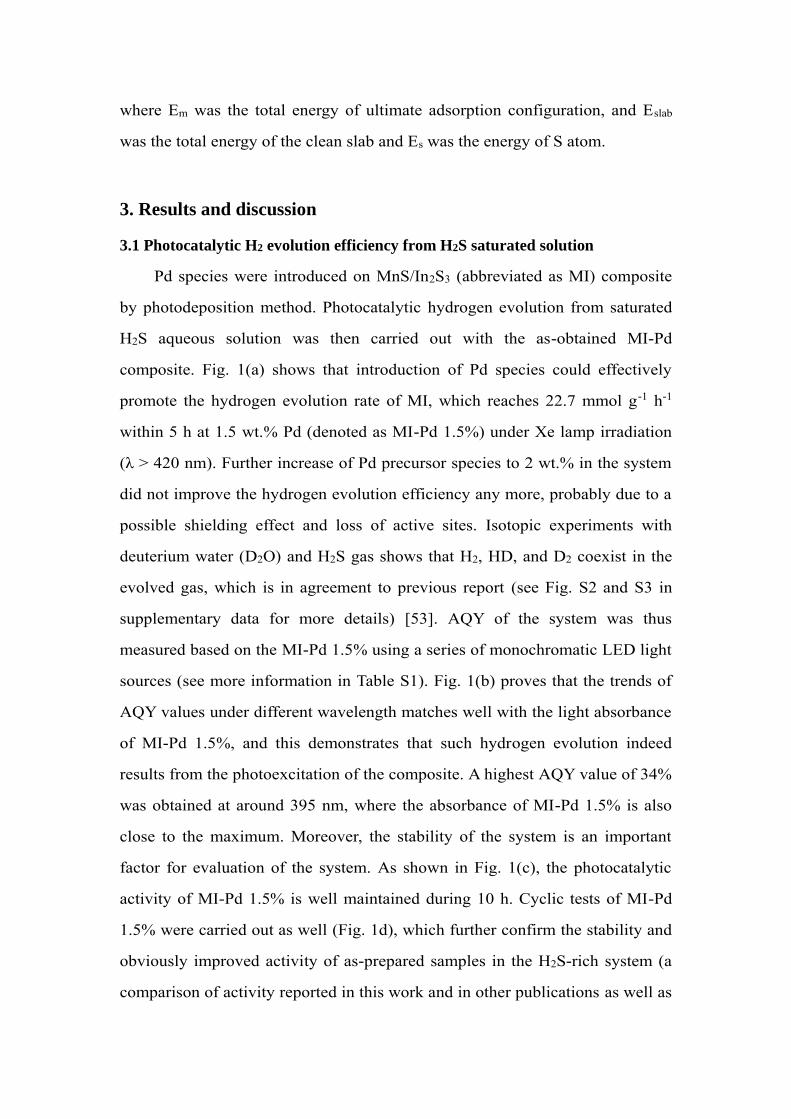
composite. Fig. 1(a) shows that introduction of Pd species could effectively
promote the hydrogen evolution rate of MI, which reaches 22.7 mmol g-1 h-1
within 5 h at 1.5 wt.% Pd (denoted as MI-Pd 1.5%) under Xe lamp irradiation
(λ > 420 nm). Further increase of Pd precursor species to 2 wt.% in the system
did not improve the hydrogen evolution efficiency any more, probably due to a
possible shielding effect and loss of active sites. Isotopic experiments with
deuterium water (D2O) and H2S gas shows that H2, HD, and D2 coexist in the
evolved gas, which is in agreement to previous report (see Fig. S2 and S3 in
supplementary data for more details) [53]. AQY of the system was thus
measured based on the MI-Pd 1.5% using a series of monochromatic LED light
sources (see more information in Table S1). Fig. 1(b) proves that the trends of
AQY values under different wavelength matches well with the light absorbance
of MI-Pd 1.5%, and this demonstrates that such hydrogen evolution indeed
results from the photoexcitation of the composite. A highest AQY value of 34%
was obtained at around 395 nm, where the absorbance of MI-Pd 1.5% is also
close to the maximum. Moreover, the stability of the system is an important
factor for evaluation of the system. As shown in Fig. 1(c), the photocatalytic
activity of MI-Pd 1.5% is well maintained during 10 h. Cyclic tests of MI-Pd
1.5% were carried out as well (Fig. 1d), which further confirm the stability and
obviously improved activity of as-prepared samples in the H2S-rich system (a
comparison of activity reported in this work and in other publications as well as
the AQY and hydrogen evolution rate of reference sample CdS-Pt are given in
Table S2 and S3).
Fig. 1 Photocatalytic hydrogen production rate of MI, and MI-Pd X % (X = 0.2 ~ 2)
(a); ultra-violet and visible light diffuse reflectance spectra and apparent quantum
yield at different wavelength of MI-Pd 1.5 % (b); 10 h long period photocatalytic
hydrogen production rate of MI-Pd 1.5 % (c); three rounds cyclic photocatalytic
hydrogen production rate of MI-Pd 1.5 % (d)
3.2 Structural characterization of MI-Pd
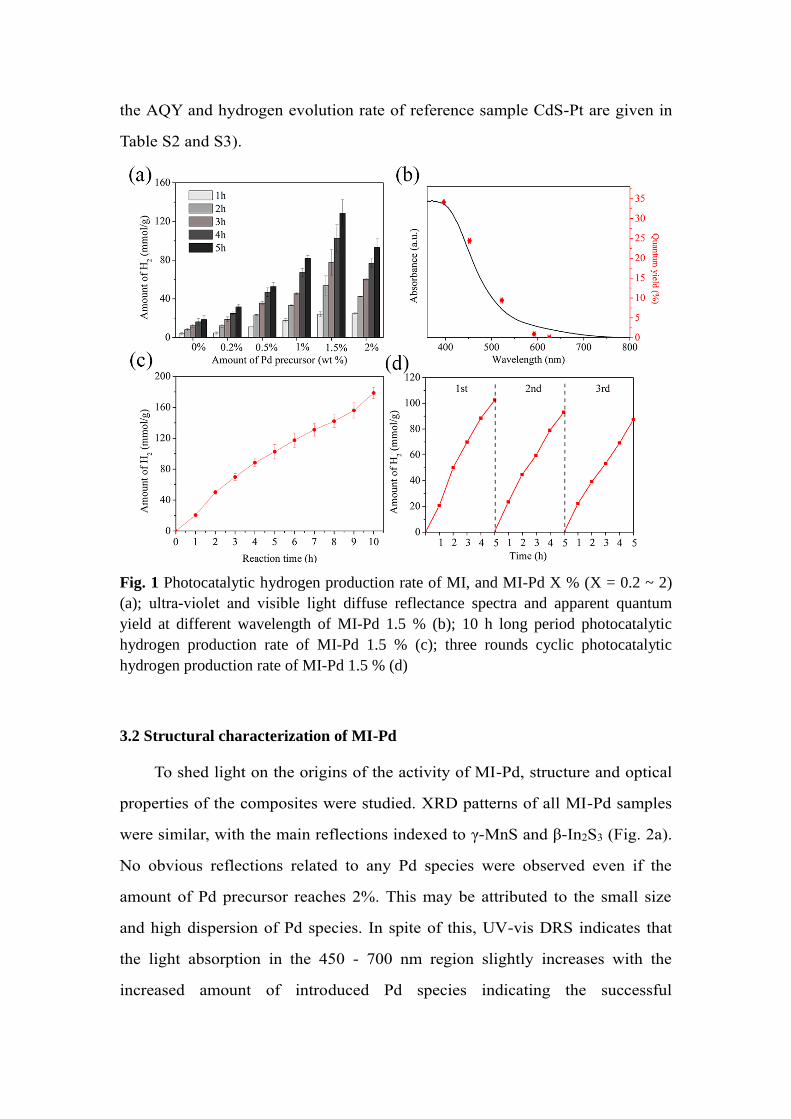
To shed light on the origins of the activity of MI-Pd, structure and optical
properties of the composites were studied. XRD patterns of all MI-Pd samples
were similar, with the main reflections indexed to γ-MnS and β-In2S3 (Fig. 2a).
No obvious reflections related to any Pd species were observed even if the
amount of Pd precursor reaches 2%. This may be attributed to the small size
and high dispersion of Pd species. In spite of this, UV-vis DRS indicates that
the light absorption in the 450 - 700 nm region slightly increases with the
increased amount of introduced Pd species indicating the successful
incorporation of Pd species into MI composite. Nevertheless, the exact structure
of the Pd species in the system could be barely recognized with the UV-vis
DRS data.
Fig. 2 X-ray diffraction pattern (a) and ultra-violet and visible light diffuse reflectance
spectra (b) of MI, and MI-Pd X% (X = 0.2 ~ 2)
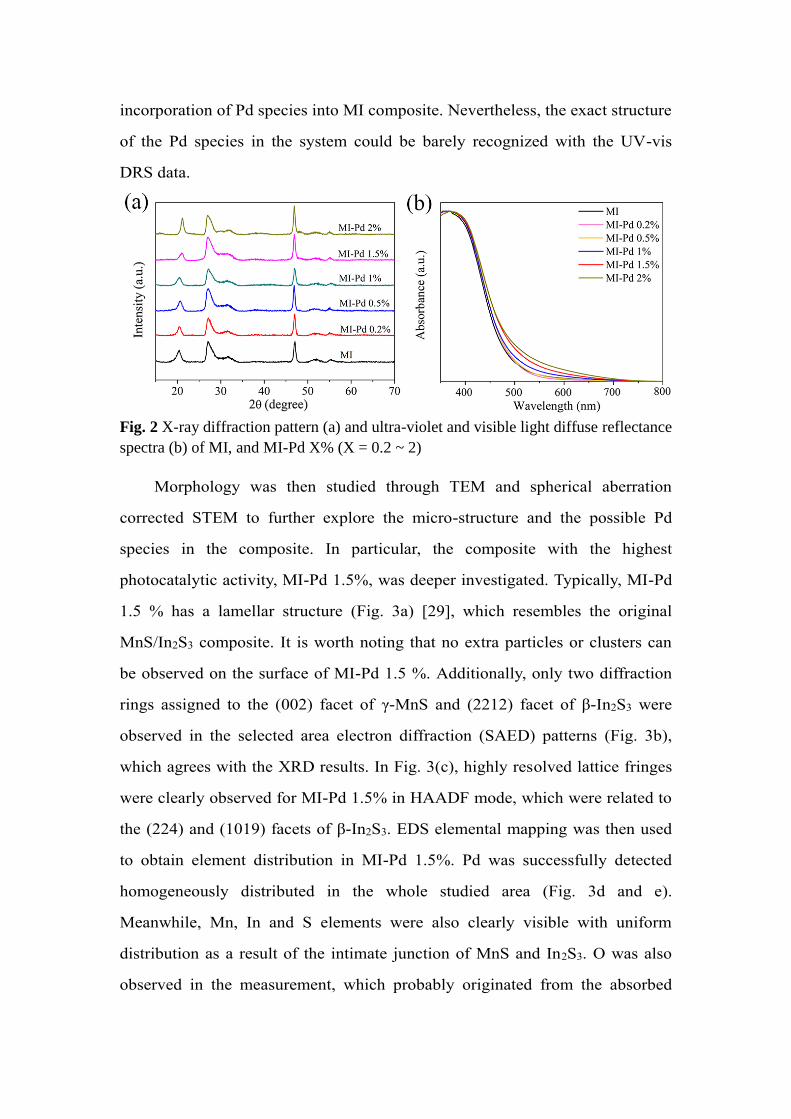
Morphology was then studied through TEM and spherical aberration
corrected STEM to further explore the micro-structure and the possible Pd
species in the composite. In particular, the composite with the highest
photocatalytic activity, MI-Pd 1.5%, was deeper investigated. Typically, MI-Pd
1.5 % has a lamellar structure (Fig. 3a) [29], which resembles the original
MnS/In2S3 composite. It is worth noting that no extra particles or clusters can
be observed on the surface of MI-Pd 1.5 %. Additionally, only two diffraction
rings assigned to the (002) facet of γ-MnS and (2212) facet of β-In2S3 were
observed in the selected area electron diffraction (SAED) patterns (Fig. 3b),
which agrees with the XRD results. In Fig. 3(c), highly resolved lattice fringes
were clearly observed for MI-Pd 1.5% in HAADF mode, which were related to
the (224) and (1019) facets of β-In2S3. EDS elemental mapping was then used
to obtain element distribution in MI-Pd 1.5%. Pd was successfully detected
homogeneously distributed in the whole studied area (Fig. 3d and e).
Meanwhile, Mn, In and S elements were also clearly visible with uniform
distribution as a result of the intimate junction of MnS and In2S3. O was also
observed in the measurement, which probably originated from the absorbed
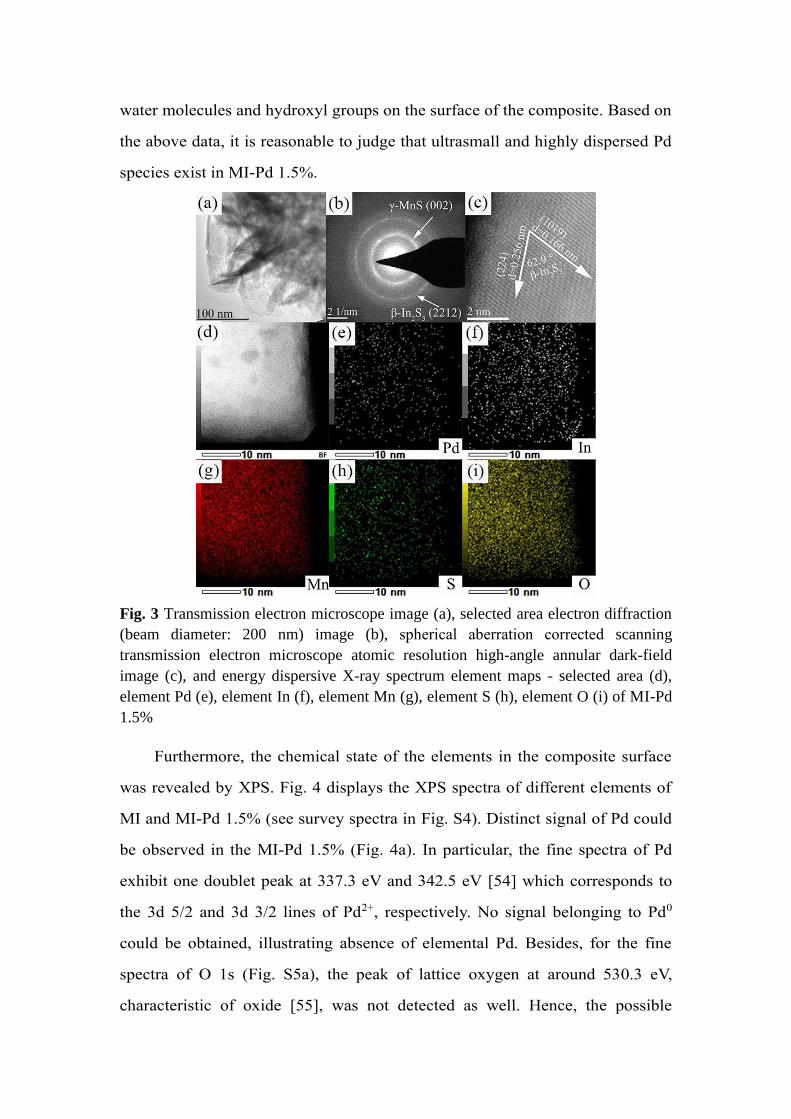
water molecules and hydroxyl groups on the surface of the composite. Based on
the above data, it is reasonable to judge that ultrasmall and highly dispersed Pd
species exist in MI-Pd 1.5%.
Fig. 3 Transmission electron microscope image (a), selected area electron diffraction
(beam diameter: 200 nm) image (b), spherical aberration corrected scanning
transmission electron microscope atomic resolution high-angle annular dark-field
image (c), and energy dispersive X-ray spectrum element maps - selected area (d),
element Pd (e), element In (f), element Mn (g), element S (h), element O (i) of MI-Pd
1.5%
Furthermore, the chemical state of the elements in the composite surface
was revealed by XPS. Fig. 4 displays the XPS spectra of different elements of
MI and MI-Pd 1.5% (see survey spectra in Fig. S4). Distinct signal of Pd could
be observed in the MI-Pd 1.5% (Fig. 4a). In particular, the fine spectra of Pd
exhibit one doublet peak at 337.3 eV and 342.5 eV [54] which corresponds to
the 3d 5/2 and 3d 3/2 lines of Pd2+, respectively. No signal belonging to Pd0
could be obtained, illustrating absence of elemental Pd. Besides, for the fine
spectra of O 1s (Fig. S5a), the peak of lattice oxygen at around 530.3 eV,
characteristic of oxide [55], was not detected as well. Hence, the possible
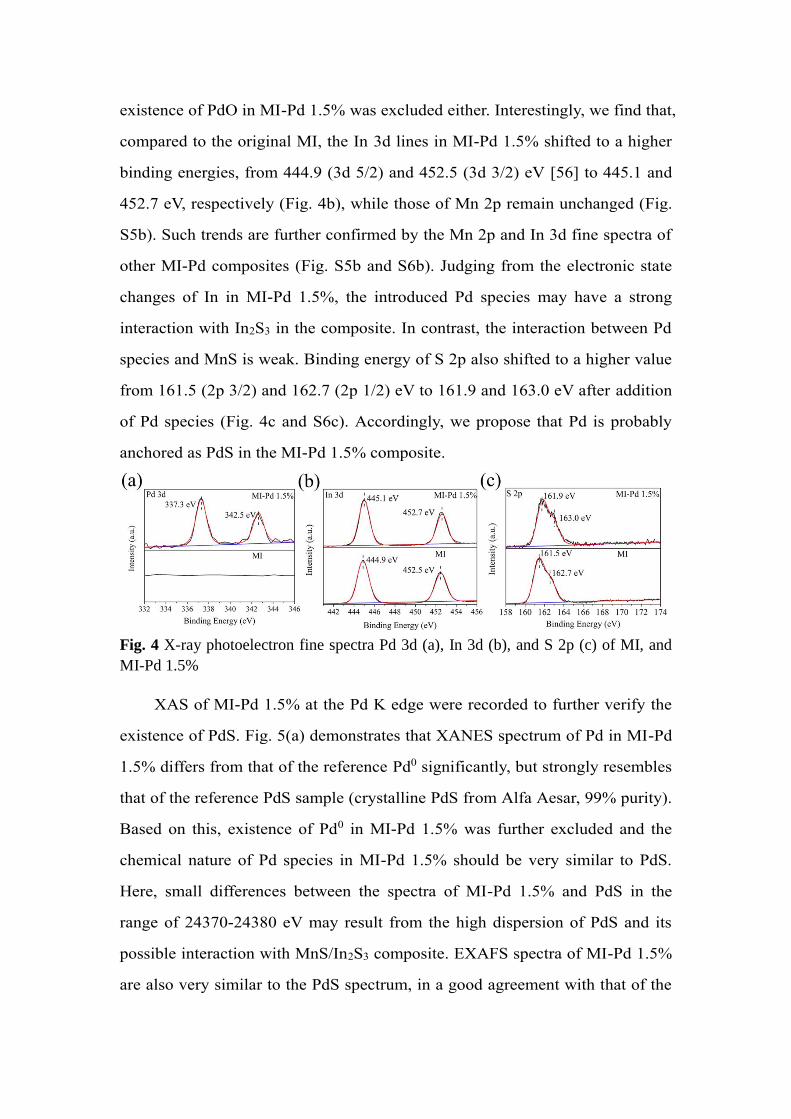
existence of PdO in MI-Pd 1.5% was excluded either. Interestingly, we find that,
compared to the original MI, the In 3d lines in MI-Pd 1.5% shifted to a higher
binding energies, from 444.9 (3d 5/2) and 452.5 (3d 3/2) eV [56] to 445.1 and
452.7 eV, respectively (Fig. 4b), while those of Mn 2p remain unchanged (Fig.
S5b). Such trends are further confirmed by the Mn 2p and In 3d fine spectra of
other MI-Pd composites (Fig. S5b and S6b). Judging from the electronic state
changes of In in MI-Pd 1.5%, the introduced Pd species may have a strong
interaction with In2S3 in the composite. In contrast, the interaction between Pd
species and MnS is weak. Binding energy of S 2p also shifted to a higher value
from 161.5 (2p 3/2) and 162.7 (2p 1/2) eV to 161.9 and 163.0 eV after addition
of Pd species (Fig. 4c and S6c). Accordingly, we propose that Pd is probably
anchored as PdS in the MI-Pd 1.5% composite.
Fig. 4 X-ray photoelectron fine spectra Pd 3d (a), In 3d (b), and S 2p (c) of MI, and
MI-Pd 1.5%
XAS of MI-Pd 1.5% at the Pd K edge were recorded to further verify the
existence of PdS. Fig. 5(a) demonstrates that XANES spectrum of Pd in MI-Pd
1.5% differs from that of the reference Pd0 significantly, but strongly resembles
that of the reference PdS sample (crystalline PdS from Alfa Aesar, 99% purity).
Based on this, existence of Pd0 in MI-Pd 1.5% was further excluded and the
chemical nature of Pd species in MI-Pd 1.5% should be very similar to PdS.
Here, small differences between the spectra of MI-Pd 1.5% and PdS in the
range of 24370-24380 eV may result from the high dispersion of PdS and its
possible interaction with MnS/In2S3 composite. EXAFS spectra of MI-Pd 1.5%
are also very similar to the PdS spectrum, in a good agreement with that of the
XANES data (Fig. 5b). The amplitude of oscillations is almost same, and this
means that number of S atoms around Pd in the composite is the same as in PdS
(4 nearest neighbors). Furthermore, Fourier-transformed (FT) EXAFS (Fig. 5c)
reveals that the first coordination shell of Pd (S neighbors, approx. 1.9 Å
uncorrected distance) in MI-Pd 1.5% is identical to that of PdS, which again
demonstrates that the number of S atoms around Pd and the distance between
Pd and S in MI-Pd 1.5% are identical to PdS (Table S4). However, an in-depth
examination of the further shells (most notably, the region between 3 - 4 Å,
uncorrected for the phase shift) reveals differences between MI-Pd 1.5% and
the reference PdS. Therefore, PdS species in MI-Pd possibly have chemical
interactions with In2S3 or MnS in the composite.
Due to very complex geometry of the In2S3 and MnS models (several
overlapping shells at 3 - 4 Å) and the limited number of independent data points
in the given range, full EXAFS analysis is unlikely to clearly distinguish the
possible interaction between PdS and In2S3 or MnS. Hence, XANES modeling
was employed to identify the structure and location of PdS species in the
composites. Here, we used bulk Pd-doped In2S3 (only tetrahedral site in β-In2S3
was taken into account), Pd-doped MnS, as well as DFT optimized isolated PdS
anchored on the surface of In2S3 and MnS (in all of which Pd-S bond existed)
for the modeling, and the calculated XANES spectra are compared against the
experimental ones (Fig. 5a and d, Fig. S7). Typically, XANES modeling does
not reproduce absolute energies reliably; however, relative positions of the
spectral features are well reproduced. The results show that the relative peak
positions and the shape of the experimental spectrum of MI-Pd 1.5% are closer
to the theoretical spectra of the Pd-doped In2S3 model or PdS anchored on In2S3
surface, rather than that of Pd-doped MnS. Consequently, PdS species in MI-Pd
1.5% should mainly interact with In2S3 instead of MnS. This conclusion is
supported by the XPS data.

Fig. 5 Normalized X-ray absorption near edge spectra (a), k2-weighted extended
X-ray absorption fine spectra (b), and Fourier-transformed k2-weighted extended
X-ray absorption fine spectra (c) of MI-Pd 1.5% (fresh), Pd foil reference and PdS
reference; theoretical X-ray absorption near edge spectra (d) of In2S3 & PdS interface,
MnS & PdS interface and PdS reference
XPS and EXAFS data bring forward that the model of PdS anchored on
In2S3 surface results in a good fit to the experimental spectrum (Fig. S8 and
Table S4). Such a result was further supported by DFT calculations (Fig. S9 and
Table S5). The formation energy of Pd-S-In bond at the interface between PdS and
In2S3 is much more negative (-4.9 eV for on octahedral site and -4.5 eV for tetrahedral
site) than that of the Pd-doped In2S3 (1.1 eV). Accordingly, PdS loaded on In2S3
with bridged S atoms is more stable, and it should be the most likely structure
in MI-Pd composites.
To figure out why the interaction between PdS and In2S3 is dominant in the
composite, DFT calculations were further utilized to analyze the structure
stability of PdS bonded with In2S3 or MnS. We find that the formation energy
of the PdS-In2S3 composite is more negative (-4.9 eV, Fig. 6a and Table S5)
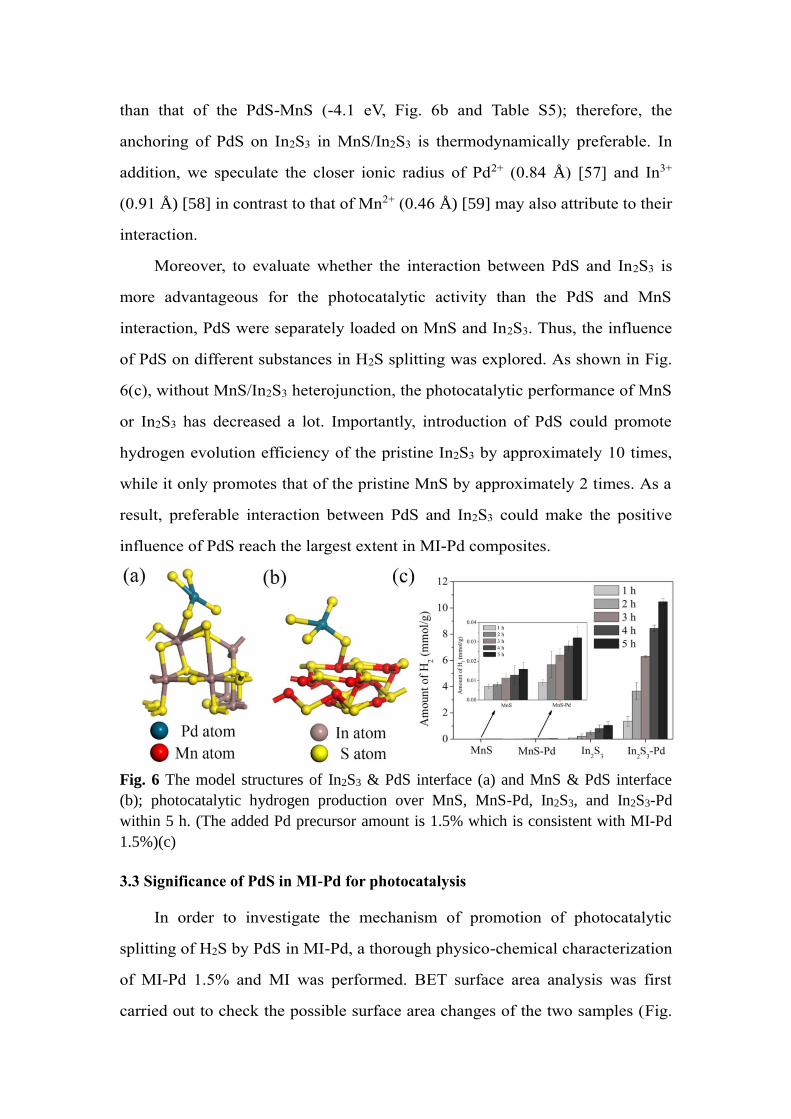
than that of the PdS-MnS (-4.1 eV, Fig. 6b and Table S5); therefore, the
anchoring of PdS on In2S3 in MnS/In2S3 is thermodynamically preferable. In
addition, we speculate the closer ionic radius of Pd2+ (0.84 Å) [57] and In3+
(0.91 Å) [58] in contrast to that of Mn2+ (0.46 Å) [59] may also attribute to their
interaction.
Moreover, to evaluate whether the interaction between PdS and In2S3 is
more advantageous for the photocatalytic activity than the PdS and MnS
interaction, PdS were separately loaded on MnS and In2S3. Thus, the influence
of PdS on different substances in H2S splitting was explored. As shown in Fig.
6(c), without MnS/In2S3 heterojunction, the photocatalytic performance of MnS
or In2S3 has decreased a lot. Importantly, introduction of PdS could promote
hydrogen evolution efficiency of the pristine In2S3 by approximately 10 times,
while it only promotes that of the pristine MnS by approximately 2 times. As a
result, preferable interaction between PdS and In2S3 could make the positive
influence of PdS reach the largest extent in MI-Pd composites.
Fig. 6 The model structures of In2S3 & PdS interface (a) and MnS & PdS interface
(b); photocatalytic hydrogen production over MnS, MnS-Pd, In2S3, and In2S3-Pd
within 5 h. (The added Pd precursor amount is 1.5% which is consistent with MI-Pd
1.5%)(c)
3.3 Significance of PdS in MI-Pd for photocatalysis
In order to investigate the mechanism of promotion of photocatalytic
splitting of H2S by PdS in MI-Pd, a thorough physico-chemical characterization
of MI-Pd 1.5% and MI was performed. BET surface area analysis was first
carried out to check the possible surface area changes of the two samples (Fig.
S10 and Table S6). It turns out that the surface area of MI-Pd 1.5% (32 m2 g-1)
is a little smaller than that of MI (39 m2 g-1); therefore, the surface area change
with PdS is not the main factor contributing to the improvement activity in
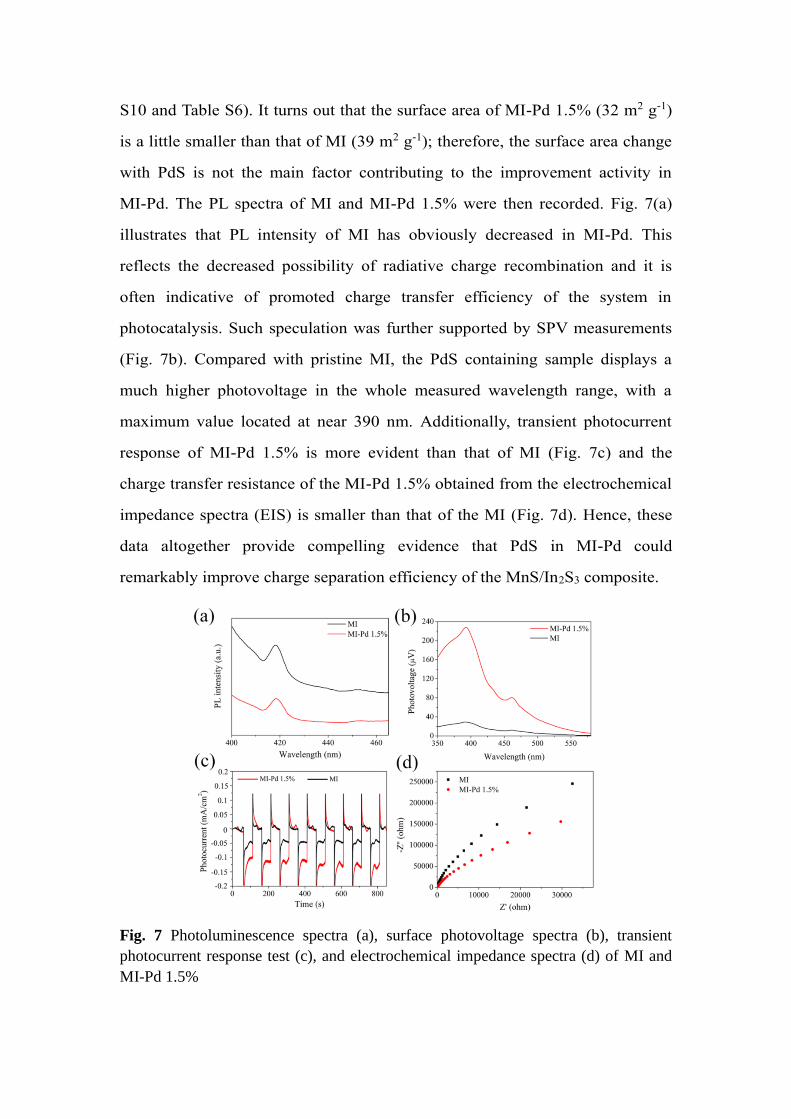
MI-Pd. The PL spectra of MI and MI-Pd 1.5% were then recorded. Fig. 7(a)
illustrates that PL intensity of MI has obviously decreased in MI-Pd. This
reflects the decreased possibility of radiative charge recombination and it is
often indicative of promoted charge transfer efficiency of the system in
photocatalysis. Such speculation was further supported by SPV measurements
(Fig. 7b). Compared with pristine MI, the PdS containing sample displays a
much higher photovoltage in the whole measured wavelength range, with a
maximum value located at near 390 nm. Additionally, transient photocurrent
response of MI-Pd 1.5% is more evident than that of MI (Fig. 7c) and the
charge transfer resistance of the MI-Pd 1.5% obtained from the electrochemical
impedance spectra (EIS) is smaller than that of the MI (Fig. 7d). Hence, these
data altogether provide compelling evidence that PdS in MI-Pd could
remarkably improve charge separation efficiency of the MnS/In2S3 composite.
Fig. 7 Photoluminescence spectra (a), surface photovoltage spectra (b), transient
photocurrent response test (c), and electrochemical impedance spectra (d) of MI and
MI-Pd 1.5%

As surface reaction dynamics is also an important factor influencing the
photocatalytic efficiency, the rate of desorption of the initial oxidation product,
in particular elemental sulfur, in our system, would also affect the
photocatalytic activity of the composite [60]. Accordingly, calculations based
on DFT with CASTEP were performed to compare the adsorption energy (AE)
of sulfur on PdS with that on the traditional metal co-catalyst Pd (Fig. S11). The
results (Table S7) revealed that AE of S on PdS (-3.7 eV) is smaller than that on
Pd (-5.5 eV); conversely, desorption of oxidation product sulfur from PdS
should be easier than that from Pd. Consequently, introduction of PdS could
facilitate the desorption of sulfur to some extent, which ultimately promotes the
photocatalytic efficiency of the system as well.
Based on the above analysis, the photocatalytic mechanism could be
explained. As shown in Fig. 8, MnS/In2S3 is Z-Scheme heterojunction and
photogenerated holes are collected on the In2S3 side [29]. The photogenerated
holes in the composite then transferred to PdS due to the close interaction
between PdS and In2S3. PdS is widely reported to facilitate hole transfer from
metal sulfides to the environment [37], hence, with the preferable anchoring of
PdS on In2S3, holes could be effectively transferred by PdS during the reaction.
Moreover, the special chemical interaction between PdS and In2S3 also endow
high PdS dispersion on MI, which increases the number of active sites available
for catalysis [61-64]. Finally, PdS could also promote the detachment of sulfur from
the photocatalyst to some extent.

Fig. 8 The band structure and photocatalytic mechanism of MI-Pd under visible
light irradiation
3.4 Structure stability of MI-Pd after photocatalysis
As mentioned before, stability is an essential criterion for evaluation of
photocatalysts, especially in H2S rich systems. For this reason, the structure of
MI-Pd was characterized after photocatalysis. XRD data manifests that the
major diffraction peaks of the original MI-Pd (Fig. S12) remain unchanged.
Moreover, TEM results of MI-Pd 1.5% after photocatalysis show that the
lamellar structure of MI-Pd is well preserved, and the diffraction rings (Fig.
S13b) as well as the exposed lattice planes (Fig. S13c and d) from MnS and
In2S3 are still discernable. Therefore, the basic structure of MI was maintained
during the reaction. Notably, in the XRD pattern, other than original diffraction
peaks from MI-Pd, weak peaks related to elemental sulfur emerges. This
suggests that sulfur is one of the final oxidation products in our system.
Furthermore, XPS shows a very similar result: all the fine spectra of Mn, In and
Pd in the MI-Pd 1.5% after photocatalysis remain (Fig. S14) the same, while
that of S 2p displays a new signal assigned to S0. A decline in signal-noise ratio
for the fine spectra of Pd 3d can be observed after light irradiation of 5 h,
indicating the partial detachment of of PdS in MI-PdS. In combination with the
fact that the performance of MI-Pd 1.5% in cyclic experiment is not obviously
influenced after illumination of 15 h, it is conjectured that a part of PdS tightly
interacted with In2S3 is more crucial for the promotion of efficiency and there is
still space for the full utilization of Pd atoms in our system, which is under
study now. As for Pd species in the composite after irradiation, the shape of
XANES and k2-weighted EXAFS spectra of Pd from MI-Pd 1.5% before and
after photocatalysis (Fig. S15) are identical, suggesting the same coordination
environment of Pd in our sample, but still we can see the decreased signal-noise
ratio from the sample after photocatalysis, which urges us to further optimize
the utilization rate of Pd atom during photocatalysis in the future.
4. Conclusion
In summary, for green conversion of highly toxic H2S into H2, MnS/In2S3
composite loaded with ultrasmall and highly dispersed PdS was proven to be an
effective photocatalyst capable of generating hydrogen. Introduction of PdS in
the MnS/In2S3 composite significantly increases the hydrogen production rate
of the system to 22.7 mmol g-1 h-1, with a maximum AQE of 34% at around 395
nm. PdS is well dispersed as XRD and TEM do not present any crystalline PdS
in MI-Pd, and detailed analysis of STEM and XPS together with XAS show the
existence of well-dispersed PdS. Additionally, the latter analysis indicate the
special interaction between PdS and In2S3 probably through Pd-S-In bonds at
the interface of PdS and In2S3. These phenomena are well in line with the recent
single-atom related works which revealed chemical interaction of noble metal
and substrate [46, 65]. Moreover, the preferable decoration of PdS on In2S3 in
MnS/In2S3 could lead to the remarkably increased activity. Charge separation
efficiency and surface reaction kinetics was promoted in the presence of PdS.
This work has shown innovative introduction of ultrasmall and highly dispersed
PdS on In2S3 of MnS/In2S3 for photocatalytic splitting of H2S, and moreover it
has demonstrated the importance of the preferable anchoring of PdS on the
binary MnS/In2S3 composite for efficiency enhancement, which could be
further extended to a series of other photocatalysts in the future.
Acknowledgements
This research was financially supported by National Natural Science
Foundation of China (U1862111 and U1232119), Sichuan Provincial
International Cooperation Project (2017HH0030), the Innovative Research
Team of Sichuan Province (2016TD0011). We thank the Synchrotron Radiation
Source at KIT, Karlsruhe, for providing beam time, KIT for supporting the
catalysis infrastructure at the CAT part of the CAT-ACT beamline, and
beamline scientists Dr. Anna Zimina and Dr. Tim Pruessmann at CAT-ACT for
the support during measurements.
Appendix A. Supplementary data
Supplementary data associated with this article can be found in the online version.
Conflicts of interest
There are no conflicts to declare.
References
[1] R.O. Beauchamp, J.S. Bus, J.A. Popp, C.J. Boreiko, D.A. Andjelkovich, P.
Leber, CRC Crit. Rev. Toxicol. 13 (1984) 25-97.
[2] N.P. Dasgupta, J.F. Mack, M.C. Langston, A. Bousetta, F.B. Prinz, Rev.
Sci. Instrum. 81 (2010) 044102.
[3] I.A. Gargurevich, Ind. Eng. Chem. Res. 44 (2005) 7706-7729.
[4] M. Lashgari, M. Ghanimati, Chem. Eng. J. 358 (2019) 153-159.
[5] A. PiÉPlu, O. Saur, J.-C. Lavalley, O. Legendre, C. NÉDez, Catal. Rev. 40
(1998) 409-450.
[6] X. Zong, J. Han, B. Seger, H. Chen, G. Lu, C. Li, L. Wang, Angewandte
Chemie International Edition 53 (2014) 4399-4403.
[7] W. Ma, J. Han, W. Yu, D. Yang, H. Wang, X. Zong, C. Li, ACS Catal. 6
(2016) 6198-6206.
[8] K. Polychronopoulou, F. Cabello Galisteo, M. López Granados, J.L.G.
Fierro, T. Bakas, A.M. Efstathiou, J. Catal. 236 (2005) 205-220.
[9] C.A. Linkous, C. Huang, J.R. Fowler, J. Photochem. Photobiol., A 168
(2004) 153-160.
[10] L. Zhang, P. De Schryver, B. De Gusseme, W. De Muynck, N. Boon, W.
Verstraete, Water Res. 42 (2008) 1-12.
[11] T. Luo, J. Bai, J. Li, Q. Zeng, Y. Ji, L. Qiao, X. Li, B. Zhou, Environ. Sci.
Technol. 51 (2017) 12965-12971.
[12] M. Lashgari, M. Ghanimati, J. Hazard. Mater. 345 (2018) 10-17.
[13] G. Ma, H. Yan, J. Shi, X. Zong, Z. Lei, C. Li, J. Catal. 260 (2008)
134-140.
[14] A. Prakash, M. Dan, S. Yu, S. Wei, Y. Li, F. Wang, Y. Zhou, Sol. Energy
Mater. Sol. Cells 180 (2018) 205-212.
[15] J. Zhu, S. Wang, Z. Bian, S. Xie, C. Cai, J. Wang, H. Yang, H. Li,
CrystEngComm 12 (2010) 2219-2224.
[16] W. He, Y. Sun, G. Jiang, Y. Li, X. Zhang, Y. Zhang, Y. Zhou, F. Dong,
Appl. Catal. B 239 (2018) 619-627.
[17] W. Cui, J. Li, Y. Sun, H. Wang, G. Jiang, S.C. Lee, F. Dong, Appl. Catal.
B 237 (2018) 938-946.
[18] W. Cui, J. Li, F. Dong, Y. Sun, G. Jiang, W. Cen, S.C. Lee, Z. Wu,
Environ. Sci. Technol. 51 (2017) 10682-10690.
[19] H. Yoshida, L. Zhang, M. Sato, T. Morikawa, T. Kajino, T. Sekito, S.
Matsumoto, H. Hirata, Catal. Today 251 (2015) 132-139.
[20] M. Yamamoto, T. Yoshida, N. Yamamoto, T. Nomoto, Y. Yamamoto, S.
Yagi, H. Yoshida, J. Mater. Chem. A 3 (2015) 16810-16816.
[21] U.V. Kawade, R.P. Panmand, Y.A. Sethi, M.V. Kulkarni, S.K. Apte, S.D.
Naik, B.B. Kale, RSC Adv. 4 (2014) 49295-49302.
[22] Y. Fang, Z. Li, Y. Jiang, X. Wang, H.-Y. Chen, N. Tao, W. Wang, Proc.
Natl. Acad. Sci. U. S. A. 114 (2017) 10566-10571.
[23] M. Dan, A. Prakash, Q. Cai, J. Xiang, Y. Ye, Y. Li, S. Yu, Y. Lin, Y.
Zhou, Sol. RRL 3 (2019) 1800237.
[24] X.-B. Fan, S. Yu, H.-L. Wu, Z.-J. Li, Y.-J. Gao, X.-B. Li, L.-P. Zhang,
C.-H. Tung, L.-Z. Wu, J. Mater. Chem. A 6 (2018) 16328-16332.
[25] L. Cheng, Q. Xiang, Y. Liao, H. Zhang, Energy Environ. Sci. 11 (2018)
1362-1391.
[26] S. Yu, X.-B. Fan, X. Wang, J. Li, Q. Zhang, A. Xia, S. Wei, L.-Z. Wu, Y.
Zhou, G.R. Patzke, Nat. Commun. 9 (2018) 4009.
[27] X.-B. Fan, S. Yu, F. Zhan, Z.-J. Li, Y.-J. Gao, X.-B. Li, L.-P. Zhang, Y.
Tao, C.-H. Tung, L.-Z. Wu, ChemSusChem 10 (2017) 4833-4838.
[28] M. Dan, Q. Zhang, Y. Zhong, Y. Zhou, J. Inorg. Mater. 32 (2017)
1308-1314.
[29] M. Dan, Q. Zhang, S. Yu, A. Prakash, Y. Lin, Y. Zhou, Appl. Catal. B 217
(2017) 530-539.
[30] Z.H.N. Al-Azri, W.-T. Chen, A. Chan, V. Jovic, T. Ina, H. Idriss, G.I.N.
Waterhouse, J. Catal. 329 (2015) 355-367.
[31] B. Li, L. Shao, R. Wang, X. Dong, F. Zhao, P. Gao, Z. Li, J. Mater. Chem.
A 6 (2018) 6344-6355.
[32] X. Pan, Y.-J. Xu, J. Phys. Chem. C 117 (2013) 17996-18005.
[33] A.B. Ijzermans, Recl. Trav. Chim. Pays-Bas 88 (1969) 334-343.
[34] A.B. Ijzermans, Recl. Trav. Chim. Pays-Bas 88 (1969) 344-352.
[35] T. Kako, H. Irie, K. Hashimoto, J. Photochem. Photobiol., A 171 (2005)
131-135.
[36] M. Barawi, I.J. Ferrer, J.R. Ares, C. Sánchez, ACS Appl. Mater. Interfaces
6 (2014) 20544-20549.
[37] H. Yan, J. Yang, G. Ma, G. Wu, X. Zong, Z. Lei, J. Shi, C. Li, Journal of
Catalysis 266 (2009) 165-168.
[38] J. Yang, H. Yan, X. Wang, F. Wen, Z. Wang, D. Fan, J. Shi, C. Li, J.
Catal. 290 (2012) 151-157.
[39] J. Song, H. Zhao, R. Sun, X. Li, D. Sun, Energy Environ. Sci. 10 (2017)
225-235.
[40] C. Ye, M.D. Regulacio , S.H. Lim, S. Li, Q.-H. Xu, M.-Y. Han, Chem. -
Eur. J. 21 (2015) 9514-9519.
[41] A. Uzun, B.C. Gates, J. Am. Chem. Soc. 131 (2009) 15887-15894.
[42] J.O. Ehresmann, P.W. Kletnieks, A. Liang, V.A. Bhirud, O.P.
Bagatchenko, E.J. Lee, M. Klaric, B.C. Gates, J.F. Haw, Angew. Chem.
Int. Ed. 45 (2006) 574-576.
[43] A. Wang, J. Li, T. Zhang, Nat. Rev. Chem. 2 (2018) 65-81.
[44] B. Qiao, A. Wang, X. Yang, L.F. Allard, Z. Jiang, Y. Cui, J. Liu, J. Li, T.
Zhang, Nat. Chem. 3 (2011) 634-641.
[45] H. Zhang, G. Liu, L. Shi, J. Ye, Adv. Energy Mater. 8 (2017) 1701343.
[46] P. Liu, Y. Zhao, R. Qin, S. Mo, G. Chen, L. Gu, D.M. Chevrier, P. Zhang,
Q. Guo, D. Zang, B. Wu, G. Fu, N. Zheng, Science 352 (2016) 797-801.
[47] A. Zimina, K. Dardenne, M.A. Denecke, D.E. Doronkin, E. Huttel, H.
Lichtenberg, S. Mangold, T. Pruessmann, J. Rothe, T. Spangenberg, R.
Steininger, T. Vitova, H. Geckeis, J.D. Grunwaldt, Rev. Sci. Instrum. 88
(2017) 113113-113129.
[48] B. Ravel, M. Newville, J. Synchrotron Radiat. 12 (2005) 537-541.
[49] J.J. Rehr, J.J. Kas, F.D. Vila, M.P. Prange, K. Jorissen, Phys. Chem.
Chem. Phys. 12 (2010) 5503-5513.
[50] S. Wei, F. Wang, M. Dan, K. Zeng, Y. Zhou, Appl. Surf. Sci. 422 (2017)
990-996.
[51] S. Sinthika, E.M. Kumar, R. Thapa, J. Mater. Chem. A 2 (2014)
12812-12820.
[52] P. Li, F. Wang, S. Wei, X. Li, Y. Zhou, Phys. Chem. Chem. Phys. 19
(2017) 4405-4410.
[53] J.S. Jang, H. Gyu Kim, P.H. Borse, J.S. Lee, Int. J. Hydrogen Energy 32
(2007) 4786-4791.
[54] R. Bhatt, S. Bhattacharya, R. Basu, A. Singh, U. Deshpande, C. Surger, S.
Basu, D.K. Aswal, S.K. Gupta, Thin Solid Films 539 (2013) 41-46.
[55] L. Ouyang, P.-f. Tian, G.-j. Da, X.-C. Xu, C. Ao, T.-y. Chen, R. Si, J. Xu,
Y.-F. Han, J. Catal. 321 (2015) 70-80.
[56] Y. Li, G. Chen, Q. Wang, X. Wang, A. Zhou, Z. Shen, Adv. Funct. Mater.
20 (2010) 3390-3398.
[57] S.-Y. Wang, N. Li, R.-M. Zhou, L.-Y. Jin, G.-S. Hu, J.-Q. Lu, M.-F. Luo,
J. Mol. Catal. A: Chem. 374-375 (2013) 53-58.
[58] S.E. Shirsath, B.G. Toksha, K.M. Jadhav, Mater. Chem. Phys. 117 (2009)
163-168.
[59] M. Liu, L. Zhang, X. He, B. Zhang, H. Song, S. Li, W. You, J. Mater.
Chem. A 2 (2014).
[60] M. Dan, S. Wei, D.E. Doronkin, Y. Li, Z. Zhao, S. Yu, J.-D. Grunwaldt,
Y. Lin, Y. Zhou, Appl. Catal. B 243 (2019) 790-800.
[61] X. Zhang, J. Guo, P. Guan, C. Liu, H. Huang, F. Xue, X. Dong, S.J.
Pennycook, M.F. Chisholm, Nat. Commun. 4 (2013) 1924.
[62] P. Yin, T. Yao, Y. Wu, L. Zheng, Y. Lin, W. Liu, H. Ju, J. Zhu, X. Hong,
Z. Deng, G. Zhou, S. Wei, Y. Li, Angew. Chem. Int. Ed. 55 (2016)
10800-10805.
[63] H. Yan, H. Cheng, H. Yi, Y. Lin, T. Yao, C. Wang, J. Li, S. Wei, J. Lu, J.
Am. Chem. Soc. 137 (2015) 10484-10487.
[64] J. Xing, J.F. Chen, Y.H. Li, W.T. Yuan, Y. Zhou, L.R. Zheng, H.F. Wang,
P. Hu, Y. Wang, H.J. Zhao, Y. Wang, H.G. Yang, Chem. - Eur. J. 20
(2014) 2138-2144.
[65] X. Wu, H. Zhang, J. Dong, M. Qiu, J. Kong, Y. Zhang, Y. Li, G. Xu, J.
Zhang, J. Ye, Nano Energy 45 (2018) 109-117.