Embed Size (px)
Citation preview

Highline Rescue Boat Systems: A study of the load created by tethered rescue boats with respect to stream
velocity, trim and hull size.
Chris Onions
A thesis submitted in partial fulfilment for the requirements for the degree of MSc by Research at the University of Central Lancashire
April 2013

Student Declaration
Concurrent registration for two or more academic awards I declare that while registered as a candidate for the research degree, I have not been a
registered candidate or enrolled student for another award of the University or other academic or professional institution
Material submitted for another award I declare that no material contained in the thesis has been used in any other submission for
an academic award and is solely my own work Collaboration Where a candidate’s research programme is part of a collaborative project, the thesis must
indicate in addition clearly the candidate’s individual contribution and the extent of the collaboration. Please state below:
Signature of Candidate ______________________________________________________ Type of Award ______________________________________________________ School _______________________________________________________
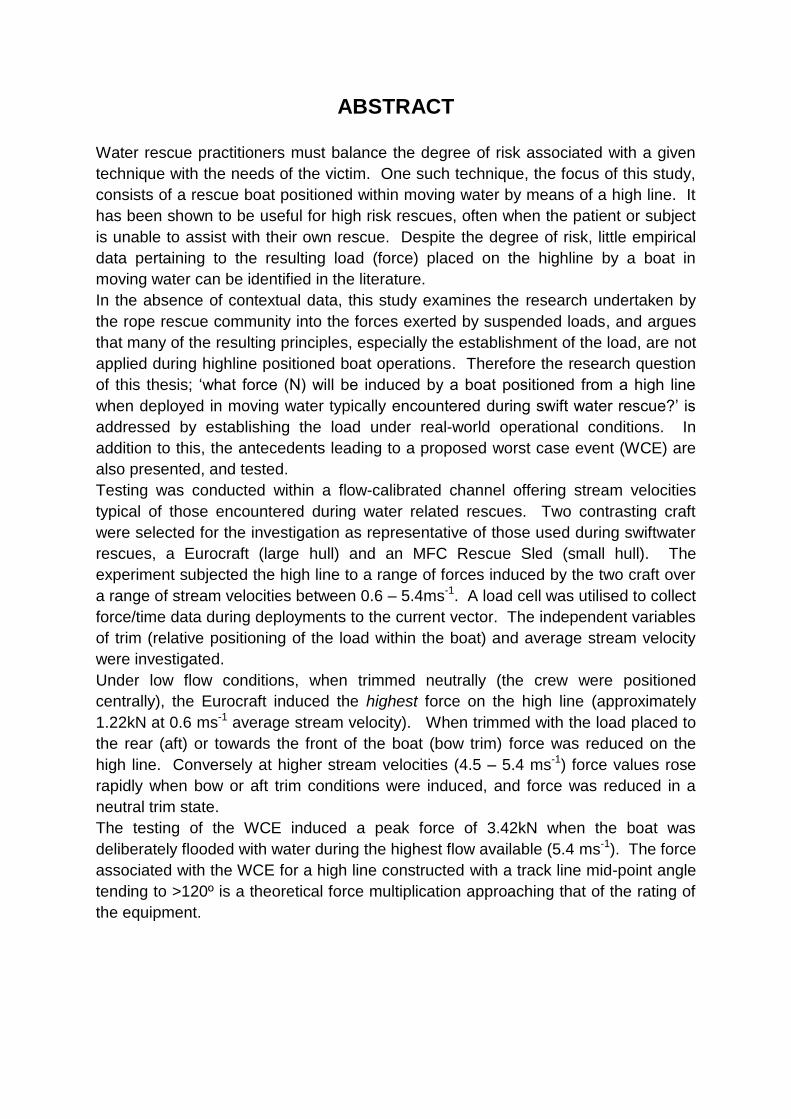
ABSTRACT
Water rescue practitioners must balance the degree of risk associated with a given
technique with the needs of the victim. One such technique, the focus of this study,
consists of a rescue boat positioned within moving water by means of a high line. It
has been shown to be useful for high risk rescues, often when the patient or subject
is unable to assist with their own rescue. Despite the degree of risk, little empirical
data pertaining to the resulting load (force) placed on the highline by a boat in
moving water can be identified in the literature.
In the absence of contextual data, this study examines the research undertaken by
the rope rescue community into the forces exerted by suspended loads, and argues
that many of the resulting principles, especially the establishment of the load, are not
applied during highline positioned boat operations. Therefore the research question
of this thesis; ‘what force (N) will be induced by a boat positioned from a high line
when deployed in moving water typically encountered during swift water rescue?’ is
addressed by establishing the load under real-world operational conditions. In
addition to this, the antecedents leading to a proposed worst case event (WCE) are
also presented, and tested.
Testing was conducted within a flow-calibrated channel offering stream velocities
typical of those encountered during water related rescues. Two contrasting craft
were selected for the investigation as representative of those used during swiftwater
rescues, a Eurocraft (large hull) and an MFC Rescue Sled (small hull). The
experiment subjected the high line to a range of forces induced by the two craft over
a range of stream velocities between 0.6 – 5.4ms-1. A load cell was utilised to collect
force/time data during deployments to the current vector. The independent variables
of trim (relative positioning of the load within the boat) and average stream velocity
were investigated.
Under low flow conditions, when trimmed neutrally (the crew were positioned
centrally), the Eurocraft induced the highest force on the high line (approximately
1.22kN at 0.6 ms-1 average stream velocity). When trimmed with the load placed to
the rear (aft) or towards the front of the boat (bow trim) force was reduced on the
high line. Conversely at higher stream velocities (4.5 – 5.4 ms-1) force values rose
rapidly when bow or aft trim conditions were induced, and force was reduced in a
neutral trim state.
The testing of the WCE induced a peak force of 3.42kN when the boat was
deliberately flooded with water during the highest flow available (5.4 ms-1). The force
associated with the WCE for a high line constructed with a track line mid-point angle
tending to >120º is a theoretical force multiplication approaching that of the rating of
the equipment.
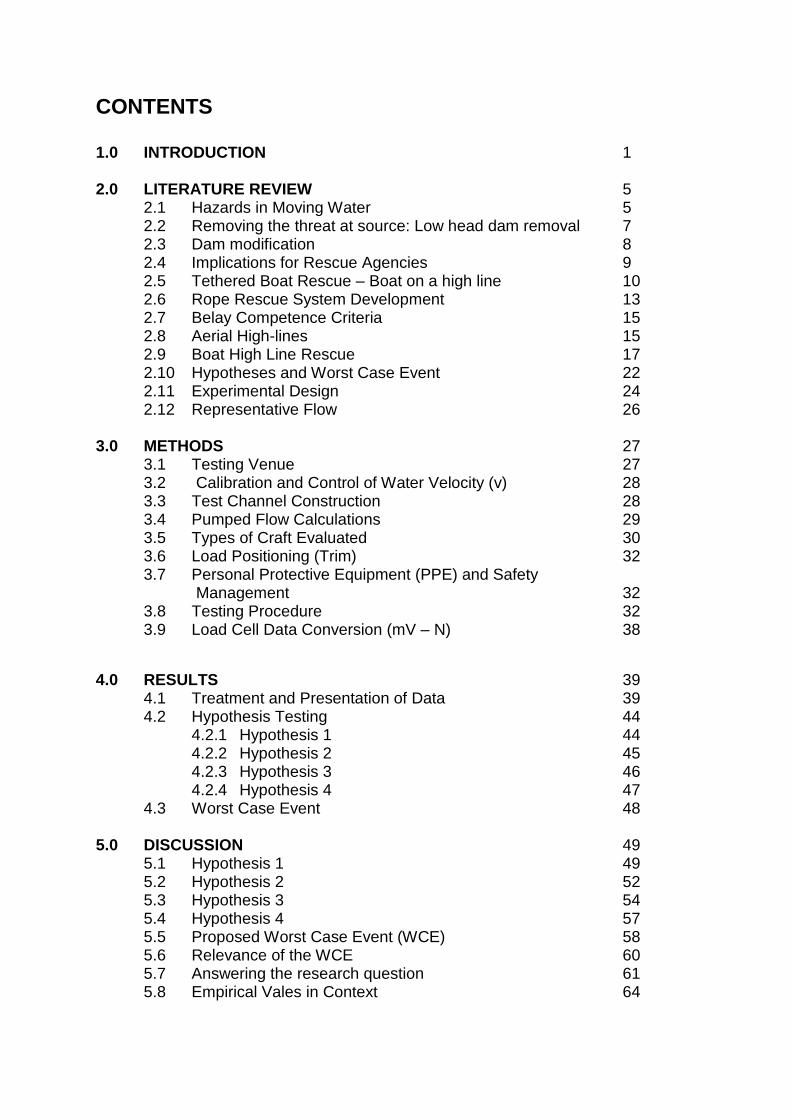
CONTENTS 1.0 INTRODUCTION 1 2.0 LITERATURE REVIEW 5
2.1 Hazards in Moving Water 5 2.2 Removing the threat at source: Low head dam removal 7 2.3 Dam modification 8 2.4 Implications for Rescue Agencies 9 2.5 Tethered Boat Rescue – Boat on a high line 10 2.6 Rope Rescue System Development 13 2.7 Belay Competence Criteria 15 2.8 Aerial High-lines 15 2.9 Boat High Line Rescue 17 2.10 Hypotheses and Worst Case Event 22 2.11 Experimental Design 24 2.12 Representative Flow 26
3.0 METHODS 27
3.1 Testing Venue 27 3.2 Calibration and Control of Water Velocity (v) 28 3.3 Test Channel Construction 28 3.4 Pumped Flow Calculations 29 3.5 Types of Craft Evaluated 30 3.6 Load Positioning (Trim) 32 3.7 Personal Protective Equipment (PPE) and Safety Management 32 3.8 Testing Procedure 32 3.9 Load Cell Data Conversion (mV – N) 38
4.0 RESULTS 39 4.1 Treatment and Presentation of Data 39 4.2 Hypothesis Testing 44
4.2.1 Hypothesis 1 44 4.2.2 Hypothesis 2 45 4.2.3 Hypothesis 3 46 4.2.4 Hypothesis 4 47
4.3 Worst Case Event 48
5.0 DISCUSSION 49 5.1 Hypothesis 1 49 5.2 Hypothesis 2 52 5.3 Hypothesis 3 54 5.4 Hypothesis 4 57 5.5 Proposed Worst Case Event (WCE) 58 5.6 Relevance of the WCE 60 5.7 Answering the research question 61 5.8 Empirical Vales in Context 64

6.0 CONCLUSIONS 66
7.0 RECOMMENDATIONS 68
8.0 LIMITATIONS OF STUDY 68
9.0 REFERENCES 70 APPENDIX 1 74 APPENDIX 2 76
Acknowledgements I would like to show my gratitude to Paul O’Sullivan, General Manger of Rescue 3
(UK) Ltd, my supervisory team at UCLAN; Bryan Jones (Director of Studies), Nigel
Garratt and Iain Adams. To the swiftwater rescue technicians Rob Litherland
(Rescue 3 UK) and Dan Graham (Rescue 3 Europe), Simon White (Manager of
TBIWWC) and his staff Chris Walker, Tom Tindale and Luke Duddles without whom
it would have been impossible to conduct this study.
1
1.0 INTRODUCTION
Water rescue practitioners have defined a range of techniques assembled into a
hierarchy of risk. For field expediency, an easily memorable phrase – talk, reach,
throw, row, go/tow, helo (sic) has been described by Rescue 3 (Edwards et al. 2010)
to assist practitioners to select the appropriate technique from the range of
techniques during incidents when time is often critical. The range of options
commence at the low-risk end of the spectrum with a rescuer offering assistance
from the bank-side by coaching the victim to swim to safety (talk), offering a
extended pole or improvised reaching tool, for example a paddle (reach) and
throwing a specifically designed throw- bag containing floating line (throw). The
remaining three options require the rescue practitioner to either enter the water or to
access the casualty from above the water by means of a load-suspension system.
The rescuer may attempt to offer assistance by accessing via a boat (row), adopting
a specialised tethered swimming technique (go/tow) or via helicopter (helo).
Although the range of rescue solutions has been presented as a hierarchy, Rogers
(2010) has stated that ‘It is the victim that makes the decision for the rescuer.’ This
statement is a reflection of the condition of the casualty, possibly exhausted,
hypothermic and having endured periods of submersion that will determine (with
other environmental and Agency capability considerations) the appropriate rescue
technique that should be deployed. Therefore, following Rogers’ premise, both the
risk and the needs of the patient must be balanced during the decision making
process.
Of the range of options described briefly above, it is the row option that is the subject
of this thesis. Often the flow of water may be so strong that an inflatable raft cannot
be positioned by paddling alone. During the extrication of a casualty located on an
2
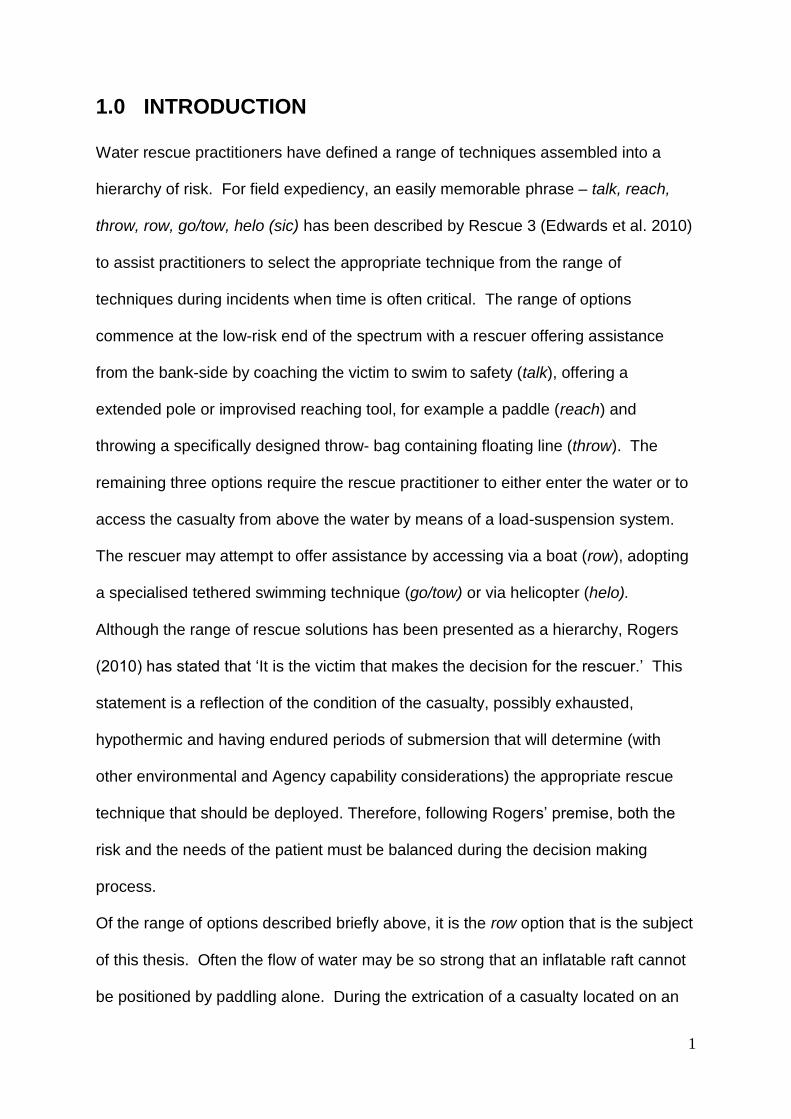
obstruction in mid-stream (for example a rock or vehicle) or from a retentive
hydrological feature (hydraulic jump, page 5) fine positioning of the craft against the
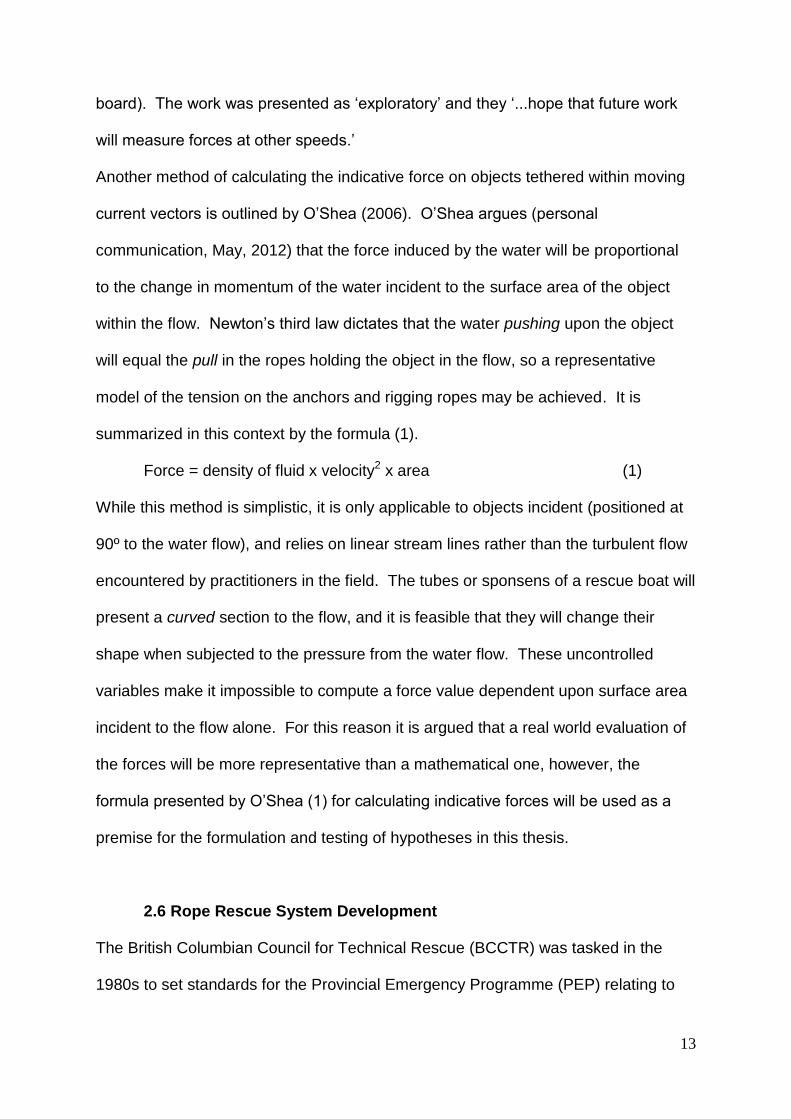
flow of water, referred to as holding station is desirable. Under these circumstances
the craft may be positioned by virtue of a system of tensioned ropes rigged across
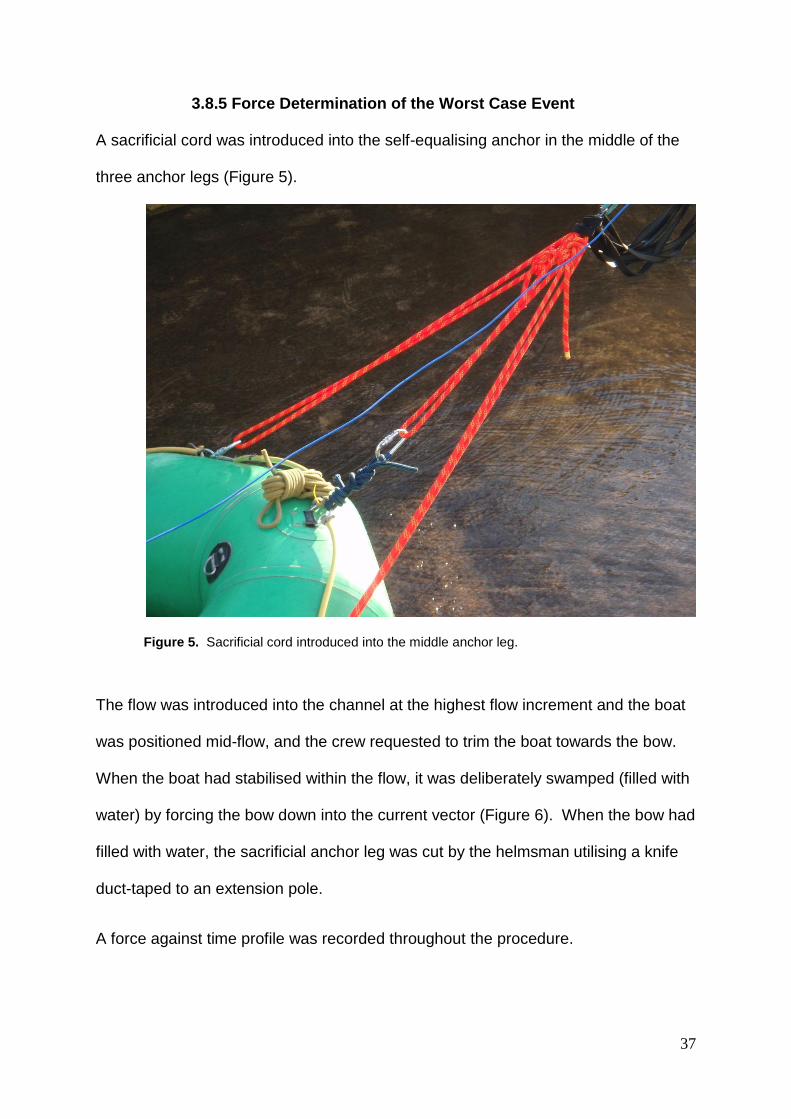
the moving water so that the craft is positioned accurately. A common set up is
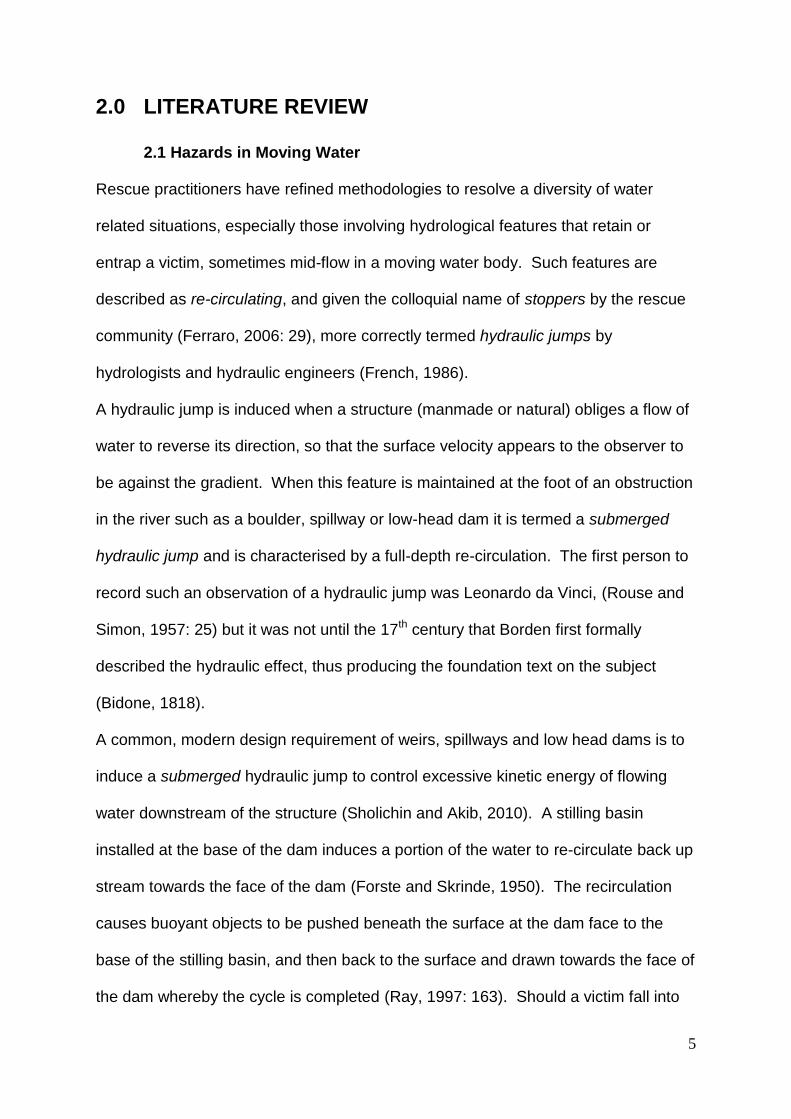
shown in Figure 1, illustrating a technique in common use internationally, hereafter
referred to as a boat on a high line. Specifically this technique employs the use of a
Norwegian reeve facilitating the positioning of the craft up or down stream and a
tensioned line, along which a carriage positions the craft toward the left and right
hand sides of the river.
Figure 1. Boat on a Highline. Image by George Manley, courtesy of Rescue 3 (Europe).
3
The literature reviewed during the preparation of this thesis describes many
instances (often with rescuer fatalities) when such a technique would have been
preferable to either motorised or crew-paddle positioning of the craft. The literature
also describes methods (including case studies) by which the risk posed to both
members of the public and the rescue community may be reduced by the removal or
modification of hazardous water features at source.
Analogy is drawn from the developers of mountain rescue techniques utilising a high
line to position a rescuer above a span, often above water. To draw distinction with
the boat on a high line technique, the mountain rescue high line is hereafter referred
to as an aerial high line. The developers of the aerial high line realised that they
needed to establish the static load on a tensioned line, and propose a worst case
event (WCE) which systems may feasibly be subjected to. By reproducing the WCE
under real world testing conditions and therefore identifying the resultant peak force,
operational guidance including a recommendation of the system rating (force) could
be established. While the work of mountain rescuers and swiftwater rescuers is
often aligned (for example the Mountain Rescue community in the UK has both a
mountain rescue capability and an emerging swiftwater rescue capability) (Thomas,
2012) little material could be found in the literature of a similar line of enquiry to
establish the force subjected to a boat on a high line by moving water. Therefore it is
conjectured that water rescue agencies and water rescue training providers alike are
unable to rate their systems and provide appropriate safety factors accordingly.
Therefore, this thesis presents the research question;
“What force (N) will a boat typically encounter when placed upon a high line
and deployed in moving water during swift water rescue?”
4
By testing 4 hypotheses and by re-creating the conditions associated with a
proposed worst case event, force has been recorded when boats of two contrasting
sizes are positioned by a high line in representative, but controlled, real-world
conditions. The hypotheses formulated include the influence of trim (positioning of
the load within the boat), the size of the hull selected and the stream velocity of the
water in which the boat is operating. Comparisons have been made with other
related fields from within the literature to contextualise the derived data.
This thesis is presented as an initial step to understanding the load on (and
consequences of overloading) a high line system when utilised to position a rescue
boat within moving water. The method by which the results were obtained, and the
results themselves are presented for scrutiny and peer review. Further testing and
validation must take place before rescue agencies embed the findings within their
own training and operational guidance.
While this research is concerned with the specific details of the high line rescue boat,
it is set within the context of the development of the national flooding enhancement
project in the UK, facilitated by DEFRA (Department for Environment, Food and
Rural Affairs, 2010). This framework attempts to establish a common understanding
of capability by agencies responding to national water incidents.
It is hoped that the results of this research will be the first step to produce working
guidance associated with empirical data in this field. Steve Glassey (personal
communication, February 2013) considers that ‘there is an overwhelming
requirement to incorporate evidence - based practice into our teaching rather than
recite someone else’s gospel.’ Such an evidence base (albeit embryonic) may prove
useful to Incident Commanders faced with making a professional judgement during a
rescue to which a tethered boat could be an option.
5
2.0 LITERATURE REVIEW
2.1 Hazards in Moving Water
Rescue practitioners have refined methodologies to resolve a diversity of water
related situations, especially those involving hydrological features that retain or
entrap a victim, sometimes mid-flow in a moving water body. Such features are
described as re-circulating, and given the colloquial name of stoppers by the rescue
community (Ferraro, 2006: 29), more correctly termed hydraulic jumps by
hydrologists and hydraulic engineers (French, 1986).
A hydraulic jump is induced when a structure (manmade or natural) obliges a flow of
water to reverse its direction, so that the surface velocity appears to the observer to
be against the gradient. When this feature is maintained at the foot of an obstruction
in the river such as a boulder, spillway or low-head dam it is termed a submerged
hydraulic jump and is characterised by a full-depth re-circulation. The first person to
record such an observation of a hydraulic jump was Leonardo da Vinci, (Rouse and
Simon, 1957: 25) but it was not until the 17th century that Borden first formally
described the hydraulic effect, thus producing the foundation text on the subject
(Bidone, 1818).
A common, modern design requirement of weirs, spillways and low head dams is to
induce a submerged hydraulic jump to control excessive kinetic energy of flowing
water downstream of the structure (Sholichin and Akib, 2010). A stilling basin
installed at the base of the dam induces a portion of the water to re-circulate back up
stream towards the face of the dam (Forste and Skrinde, 1950). The recirculation
causes buoyant objects to be pushed beneath the surface at the dam face to the
base of the stilling basin, and then back to the surface and drawn towards the face of
the dam whereby the cycle is completed (Ray, 1997: 163). Should a victim fall into

6
the jump, this re-circulation will occur almost indefinitely or until either a rescue takes
place, the water level drops (weakening the retentive effect) or the feature becomes
drowned out by a rise in the water level upstream of the feature. Not all hydraulic
jumps are deemed to be hazardous however. If the jump re-circulates water at the
surface only, it does not demonstrate full depth recirculation and can offer
recreational kayakers a play or surfing wave (Matt, 2002: 286). The features of a
non-hazardous hydraulic jump are a shallow ramp angle, short tow back and aerated
water. Conversely, many man-made features are hazardous due to their retentive
nature, their remoteness from shore, leading to the helpless condition of the Subject.
Rescuers are often obliged to implement a tethered boat technique to execute the
rescue under these circumstances.
Tethered boat techniques have been devised by rescue training agencies and
rescue organisations to prevent a rescue boat from being drawn into a hydraulic
jump. As described below, the literature details numerous historical events where
self powered rescue craft, in an attempt to manoeuvre close to the victim, hold a
stationary position relative to the land close to the boil line (the demarcation of the
hydraulic jump and the outflow). Any error or miscalculation by the helmsman will
result in the boat being moved into the reverse current and swamped by the outfall at
the dam face.
In September 1975 an incident at Binghamton, New York on the river Susquehanna
resulted in the death of three rescuers and a further four injured casualties (Elverum
and Smalley, 2008). The river level was unusually high for the time of year when a
raft containing two people floated over the dam and became trapped in the re-
circulating current at the base of the dam. Three fire-fighters attempted to assist in a
self powered rescue boat (not tethered) which also capsized resulting in the death of
7
one of the fire fighters. The remaining two fire-fighters and the two original victims
from the raft survived. The following day, an attempt was made to recover the body
of the fire-fighter (still retained in the re-circulating water of the low head dam) using
a self powered rescue boat (again without tethers). This boat also capsized at the
base of the dam, resulting in the three fire fighters being thrown into the hydraulic
jump. Yet another self powered rescue boat was launched, but already two of the fire
fighters had drowned. Observation of historical news footage (Wenck, 2012) of
some of the rescue attempts at Binghamton show that the face of the dam was
relatively low due to the unseasonably high water levels, and so the submerged
hydraulic jump may have looked to the untrained observer to be innocuous. It was
also clear from the observations how quickly and inexorably an un-tethered boat is
drawn towards the dam face once it crosses the boil line. This event is the first
recording of the term drowning machine, now in common use amongst rescue
professionals and public safety campaigners, for example (Wright, Earles and Kelly,
2004) and (Elverum and Smalley, 2008) that the author can identify in the literature.
The hazard that such features present to the public and rescue community is
significant (Horst, 2010). Observations made by rescue training providers suggest
that a tethered boat methodology at Binghamton would have been difficult to
implement as long lengths of rope (300 – 600m) would have been required (Bills, et
al. 2011: 63).
2.2 Removing the threat at source: Low head dam removal
Reduction of the degree of hazard posed by low head dams at source would reduce
exposure of risk to the public and rescue personnel. The removal of redundant low
head dams to reduce the risk to the community is however often contentions
8
(AASHTO, 2005). The detrimental effects of sediment release on downstream flora
are discussed by Chang (1998: 432), decreasing the amount of water impounded
upstream (Morris and Fan, 1998) and increased flood risk (Shafroth et al, 2002).
Therefore it is not always possible or practical to remove low head dams, so In the
UK weir modification is often prioritised on a basis of risk, for example weir X on the
River Tryweryn, North Wales (Davies, 2010) and numerous weirs on the river
Thames (Arcadis, 2010).
The basis of weir removal is a consideration of both public risk and risk to the
rescuer who has been called to assist at a weir related incident (Paul O’Sullivan,
personal communication, July 2011). From a public risk perspective, factors to be
investigated should include; signing, railings and any protection offered by a boom
on the up-stream side of the weir. In the weir specifically, the flowing are
considered; presence of vertical retaining walls at the sides of the re-circulating
hydraulic that pre-empt escape from the feature, the size of the hydraulic jump
(called the tow-back) and if there are any weaknesses in the re-circulating hydraulic
that would ‘flush’ a swimmer to the downstream side of the retentive feature. The
rescuer – risk evaluation considers if access is available to personnel and vehicles, if
anchors are available from which to construct a boat high line system and the
presence or absence of over head wires for a helicopter based rescue (O’Sullivan, P.
and McKay, C. 2009).
2.3 Dam modification
Observations made in the pioneering work to educate hydraulic engineers to the
hazards posed by re-circulating hydraulic features to the wider public and
recreational boating community include Leutheusser and Birk (1991) who refer to the
re-circulating water (hydraulic jump) as a ‘vortex’;

9
‘The vortex is commonly called the hydraulic by canoeists and water safety experts who fear and respect its potential to maim and kill, yet the phenomenon is virtually unknown in the hydraulic engineering literature.’
The authors advocate the incorporation of a cascading baffle to eliminate the
conditions required to form the submerged hydraulic jump. Other forms of
modification to low head dams have been identified (Wright, Earles and Kelly, 2004)
including horizontal deflectors, slope grading with rock fill and the construction of
downstream ledges.
Modification of existing structures, or the complete removal of low head dams,
combined with public education programmes represent a proactive approach to
public safety. In the interim, rescue agencies continue to train to effect rescues as
required. Although not an exclusive solution, currently common practice by rescue
agencies suggest that tethered boat rescue systems will be implemented for river
rescues involving submerged hydraulic jumps.
2.4 Implications for Rescue Agencies
From a national strategic perspective, the framework for water rescue first
responders is laid out in the National Flood Enhancement Project; Concept of
Operations (Department for Environment, Food and Rural Affairs, 2012). Water
Rescue Technicians are required to have a working knowledge of hydrology (for
example hydraulic jumps) and to be able to implement tensioned rope rescue
systems (boat on a high line).
At a tactical level, in the UK, a weir risk evaluation procedure has been published
(O’Sullivan and McKay, 2009) which assists both weir operators and responding
rescue agencies to score the level of hazard for a given weir within their jurisdiction.
This assessment considers the practical implications of conducting a boat on a high
10
line rescue from a weir, including span distance, height above the feature, vehicular
access and the provision of anchors (necessary for constructing the high line).
Rescue 3 training courses (Bills, et al. 2010) describe a range of rescue operations
culminating in a helicopter rescue as the highest risk option. Many rescue agencies
(for example Nottinghamshire Fire and Rescue Service) include the request of a
search and rescue capable helicopter to attend low head dam incidents as standard
operational procedure (M. Bills, personal communication, February, 2012).
Helicopter rescues from low head dams should not be undertaken lightly however.
For example, A. Lee (personal communication, May, 2012) reported significant
debris present in the re-circulating hydraulic jump in the Elwis street weir on the river
Don at Doncaster during the recovery of a victim. The debris (consisting of railway
sleepers, gas cylinders and timbers presented a significant risk to the Winchman of
an RAF Sea King deployed to recover the victim from the weir. (Taylor, R, personal
communication, May, 2012).
Helicopters may also be subject to mechanical failures and may not be operable
during periods of poor weather and limited visibility (Sq. Ldr S. Wright, personal
communication, May, 2011). Therefore, winch capable aircraft do not present a
default-option for recue agencies, and so, in the absence of a helicopter, a tethered
boat may be the only option for a rescue or recovery from a low head dam or similar
feature.
2.5 Tethered Boat Rescue – Boat on a high line
The boat is tethered such that the bow faces up-steam to a pulley connected to the
highline (Figure 1, page 2). The boat may be positioned across the width of the river
(x axis) via the tag lines, and up or down stream (y axis) by a secondary reeve

11
system (Figure 2). Further lines connecting the stern of the boat to each bank
stabilise the craft in turbulent flow.
Figure 2. Norwegian Reeve. Image by George Manley, courtesy of Rescue 3 (Europe).
Positioning of the boat is achieved by careful communication between the helmsman
and the bank based incident commander (Bills, et al., 2010: and Ray, 1997: 128) and
may be fine tuned by the helmsman with a paddle.
A tethered boat represents a high risk to the rescue personnel, but offers a true type
rescue to the casualty. A true type rescue is indicated when the casualty is not able
to help themselves or may be unconscious (Bills, et al., 2011). A conditional type
rescue is effective when the victims are able to behave appropriately and play an

12
active role within their own rescue. Such rescue practitioners employ a progressive
intervention strategy from low to high risk, and the optimum choice is the method that
exposes the rescue team to the least risk while providing an effective rescue of the
casualty (Edwards, et al., 2005:12).
The tethered boat employs a chain of components, each of which is manufactured to
a standard within Europe. Rope selection normally includes low stretch kernmantel
rope (British Standard, 1998), karabiners (generically termed connectors) (British
Standard, 2004) and pulleys (British Standard, 2007).
Although the individual components of the rescue chain are well understood and
documented, little is known about the actual force placed onto the system when
deployed onto moving water (P. O’Sullivan, personal communication, January,
2010). The boat may be subjected to a force produced by the flow of water moving
downstream, and also by re-circulating water upstream. The boat may even
experience a sheer force when it crosses the demarcation between downstream flow
and re-circulating water (Ray, 1997: 165).
Findings presented by rescue practitioners (Smith and Stephen, 2009) detailed their
in-water; real world analysis of the forces placed upon a highline by a diver,
positioned in a river flowing at 6 miles per hour (2.7 m/s) induced a force in the high
line of 3 kN. This value would be at 1/10 of a system constructed to withstand 30kN
(10:1 safety factor) which as we will see is a desirable characteristic to be
considered when constructing high lines (page 14). The authors proposed a model,
based upon their findings which predicted loads for a given water velocity and
demonstrated how the force values increase exponentially with respect to water
speed. The investigation was conducted in a river of flow 1.82 miles per hour (0.81
ms-1) in which they reported low load forces (0.09kN for a boat with 2 people on
13
board). The work was presented as ‘exploratory’ and they ‘...hope that future work
will measure forces at other speeds.’
Another method of calculating the indicative force on objects tethered within moving
current vectors is outlined by O’Shea (2006). O’Shea argues (personal
communication, May, 2012) that the force induced by the water will be proportional
to the change in momentum of the water incident to the surface area of the object
within the flow. Newton’s third law dictates that the water pushing upon the object
will equal the pull in the ropes holding the object in the flow, so a representative
model of the tension on the anchors and rigging ropes may be achieved. It is
summarized in this context by the formula (1).
Force = density of fluid x velocity2 x area (1)
While this method is simplistic, it is only applicable to objects incident (positioned at
90º to the water flow), and relies on linear stream lines rather than the turbulent flow
encountered by practitioners in the field. The tubes or sponsens of a rescue boat will
present a curved section to the flow, and it is feasible that they will change their
shape when subjected to the pressure from the water flow. These uncontrolled
variables make it impossible to compute a force value dependent upon surface area
incident to the flow alone. For this reason it is argued that a real world evaluation of
the forces will be more representative than a mathematical one, however, the
formula presented by O’Shea (1) for calculating indicative forces will be used as a
premise for the formulation and testing of hypotheses in this thesis.
2.6 Rope Rescue System Development
The British Columbian Council for Technical Rescue (BCCTR) was tasked in the
1980s to set standards for the Provincial Emergency Programme (PEP) relating to

14
the performance of devices used to catch rescue loads (Dill, 1990 and Mauthner,
2005). One of the key outcomes was the proposal for the WCE that may occur
during mountain rescue operations with suspended loads. The BCCTR proposed
that the most complex phase of the operation when a failure is likely to occur
corresponds to the situation in which there is the least amount of rope in service to
absorb the energy generated by the failure. It was suggested that that the most
critical phase of a rope rescue sequence is when the attendant moves the stretcher
with patient from the horizontal ground - over the edge to the vertical terrain during a
lower. This phase is known as the edge transition.
The BCCTR identified that there was a higher likelihood of failure during the edge
transition due to the attendant struggling to manoeuvre the stretcher over the ledge.
Proposed mechanisms of failure at this juncture include; edge lip failure, the initial
loading of the system revealing an alignment error, equipment or anchor failure and
a stumble by the attendant close to the lip of the edge (Gibbs, 2007).
These contributory factors of failure during the edge transition are especially
important because there is very little rope between the load and the anchors. The
BCCTR proposed that the attendant and stretcher could fall 1m, due to an Attendant
stumble, or equipment failure with as little as 3m of rope in service to absorb the
energy of the fall. This equates to a fall factor 0.33 (fall distance/rope in service) and
would correspond to a theoretically high impulse force to which the patient, attendant
and equipment would be subjected (Schubert, 1991:169).
The development of water-based rope rescue systems, especially the boat on a high
line have evolved from rope rescue systems designed to accommodate a suspended
load. The premise for incorporating a 10:1 static system safety factor (SSSF) in
suspended load rope rescue systems is examined, and will influence the line of
15
enquiry leading to the proposal of a safety factor for high lines designed to control
tethered boats. The BCCTR achieved this within the field of rope recue during their
examination and establishment of belay competence criteria.
2.7 Belay Competence Criteria
The BCCTR were in a position to formulate a standard by which belay capture
devices could be evaluated within the context of the occurrence of a worst case
event. The standard (ASTM, 2011) details the Belay Competence Drop Test
Methodology which states that,
A rescue belay should be capable of catching a 200kg mass, representing two people, plus equipment falling 1m on 3m of 11mm rope, with no more than 1m additional travel distance (pre-rebound) and with no more than 12kN of peak force.
The worst case event and corresponding set of belay competence criteria
established by the BCCTR demonstrate a thorough and critical examination of the
vulnerability of rescue systems. This is a fundamental model of enquiry to this study,
as little evidence of a similar logical line of enquiry to tethered boat methodologies is
evident. The proposal of a worst case event - specifically for tethered boat highline
systems is made and tested.
2.8 Aerial High-lines
The principles behind the construction of a competent highline have been described
by the British Columbia Council for Technical Rescue (BCCTR) (Mauthner and
Mauthner, 1996). The BCCTR reviewed historical maritime shipping manuals,
illustrations and even wood-cut images and concluded that there are some common
generic principles that should be included within a modern aerial high line; These
principles suggest that the tag ropes should be connected to the carriage (not the
load, and a static safety factor should be included. The safety factor should be
16
established so that should a dynamic event occur, then the integrity of the highline is
not compromised. (General engineering philosophy describes a static safety factor
such that the mean loading always falls at a value less than the mean strength by a
known factor (O’Connor, 1985: 102). The system should include an element of
redundancy should a primary component fail, then it is backed up by a secondary
system and the system should incorporate a force limiting device to prevent over
loading. This latter feature is analogous to a safety valve within a pressurised
system or a slipping clutch within an automotive transmission system.
To manage the force in the high line, field techniques have been presented to control
the track line tension. Frank (2010: 271) describes a rule of 12 where the number of
pullers multiplied by the mechanical advantage velocity ratio yields an indicative
resultant force.
If 2 people pull on a mechanical advantage of 6:1; Then track line tension ≤ 3kN.
By limiting the track line tension to ≤ 3kN, using trigonometry, the angle at the
carriage will resolve to 160 degrees for a 1kN load. In the field this practice has
been reported to work well (A. Read personal communication, March 2011).
The premise for maintaining track line tension at ≤ 3kN for a 1 kN load is that an
acceptable 10:1 static system safety factor (SSSF) may be maintained (James,
2010: 272). This assumes that the un-knotted strength of the track line is in the
order of 30 kN.
Further to the rule of 12 and the 10:1 SSSF described above, Mauthner (personal
communication, May, 2012) advocates the inclusion of force limiting devices within
the high line that prevent excessive loads being generated by introducing more rope
(slipping) at a pre- determined value of approximately 7kN. Mauthner has developed
a device (CMC Multi Purpose Device ™) specifically for this purpose (Frank, 2010:
17
131). There is also limited evidence that prusik hitches will tend to exhibit a
tendency to slip within a range of 7 – 11 kN. For examples of the performance of
prusik hitches see Kharns (2008) and for an evaluation of prusik compatibility testing
see Onions (2011) and with Sterling 11mm rope (Jones, Read and Onions, 2012).
The force in a tensioned rope track line with a force exerted at 90 degrees (the
hanging load) is determined by the angle at the intersection (O'Shea, 2007). As it is
impossible to observe this angle during application, the solution presented in the
Kootenay system is to limit the input force, so the track line tension with a hanging
load cannot exceed a given value (3kN). Regardless of the load placed on the
highline at mid-span, the angle at the carriage will resolve according to a value
predicted by trigonometry. It is worth looking within the literature for similar
considerations when constructing tethered boat high lines.
2.9 Boat High Line Rescue
Slim Ray (Ray, 1997: 126-128) has described a continuum of tethered boat
techniques, from a single point tether (managed with a single line), a two point
tether, and a four point tether. All of these methods are suitable for river current
velocities that allow the tethers to be hand held by the operators. The progression of
the continuum ends with the high line system that offers fine control (and specifically)
the greatest degree of security when operating near hydraulic jumps.
‘To ensure that the rescue boat does not get caught in the backwash, it has a couple of tag lines attached at the stern, tended from downstream of the boil line.’
This system utilising a tensioned track line and mechanical advantage, has been
adapted from the high line principles used to extricate victims from narrow, linear
features like river gorges where access is particularly difficult or for transporting
18
personnel across rivers when bridges have become unsafe or collapsed during
major flooding events. There are two variants;
A Dipping Highline used when there is adequate height above the base of the
feature to accommodate the associated stretch in the track rope
A reeve highline (English or Norwegian) that allows the load to be lowered
and raised from the highline.
Water rescue practitioners have effectively borrowed the technique from rope rescue
specialists (P. O’Sullivan, personal communication, February, 2011). By changing
from an aerial application to a water based one, many of the sound underpinning
principles of the high line may no longer be valid, and it is conjectured that many
assumptions have been made concerning the safety of the application.
It has been shown that operational field guidance has been established by the
BCCTR to manage track line tension to an acceptable level within aerial high lines.
This is based upon many system constants, namely the load which is proportional to
the mass (kg) and the acceleration due to gravity (m/s/s). However these constants
do not exist within the application of a high line to position a boat within a channel of
moving water. In this context the load is proportional to many variables including the
stream velocity and the shape and cross sectional area of the boat. The application
of an aerial high line is based upon sound principles, and it is conjectured that such a
basis is not evident in the case for a high line used to position a boat. A summary
comparison of factors influencing the load is presented below.
19
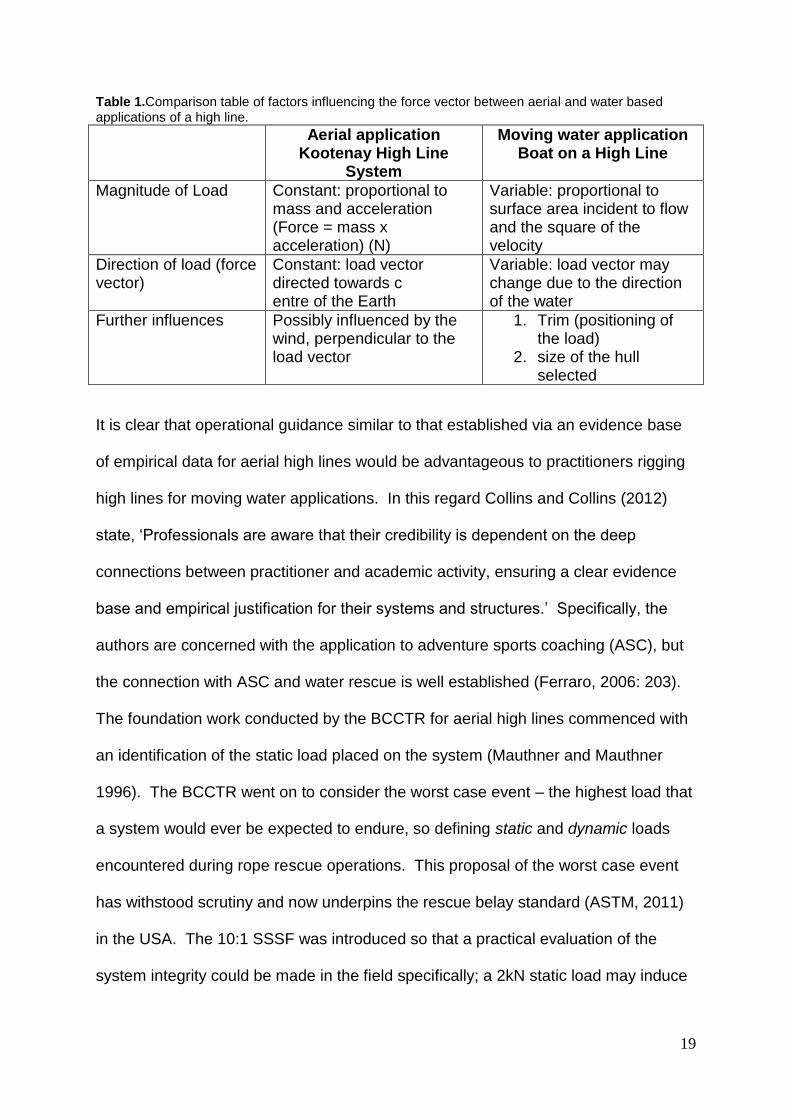
Table 1.Comparison table of factors influencing the force vector between aerial and water based applications of a high line.
Aerial application Kootenay High Line
System
Moving water application Boat on a High Line
Magnitude of Load Constant: proportional to mass and acceleration (Force = mass x acceleration) (N)
Variable: proportional to surface area incident to flow and the square of the velocity
Direction of load (force vector)
Constant: load vector directed towards c entre of the Earth
Variable: load vector may change due to the direction of the water
Further influences Possibly influenced by the wind, perpendicular to the load vector
1. Trim (positioning of the load)
2. size of the hull selected
It is clear that operational guidance similar to that established via an evidence base
of empirical data for aerial high lines would be advantageous to practitioners rigging
high lines for moving water applications. In this regard Collins and Collins (2012)
state, ‘Professionals are aware that their credibility is dependent on the deep
connections between practitioner and academic activity, ensuring a clear evidence
base and empirical justification for their systems and structures.’ Specifically, the
authors are concerned with the application to adventure sports coaching (ASC), but
the connection with ASC and water rescue is well established (Ferraro, 2006: 203).
The foundation work conducted by the BCCTR for aerial high lines commenced with
an identification of the static load placed on the system (Mauthner and Mauthner
1996). The BCCTR went on to consider the worst case event – the highest load that
a system would ever be expected to endure, so defining static and dynamic loads
encountered during rope rescue operations. This proposal of the worst case event
has withstood scrutiny and now underpins the rescue belay standard (ASTM, 2011)
in the USA. The 10:1 SSSF was introduced so that a practical evaluation of the
system integrity could be made in the field specifically; a 2kN static load may induce
20
a dynamic force (impulse) of 12 - 15kN if the worst case event occurred, so by
building to a strength of 20kN (10 x the static load) the system would not fail.
Moreover, if components with a known slip force are introduced into a system, it
follows that a catastrophic system failure is less likely to occur. Such components
within high lines include the application of a prusik knot utilized to grip a host rope.
An examination of the literature reveals that prusik knots made from 8mm cord are
vital components within the system when applied to a more substantial parent rigging
ropes, typically of 10.5 – 11mm thickness (Gorman et al., 2011:33). There is some
evidence to suggest that they exhibit a reliable gripping ability of the parent rope
which is utilized by the rescuer to apply tension to the parent rope via means of a
mechanical advantage system (for example see Ray, 1997:67). While it is
advantageous to the rescuer to employ a gripping prusik knot to apply tension, it is
equally advantageous to construct the prusik in such a way that it should slip when
over tensioned. This may prevent over loading of the system and is analogous to a
safety valve within a hydraulic pressure system (Mauthner, personal communication,
May, 2012). Anecdotally, practitioners refer to a prusik as a slipping clutch for the
same reason. There has been some evaluations of prusik slip performance, for
example see Bavarescoi (2012) who tested 6mm prusik knots applied to 11mm
parent rope and PMI (2012) both authors using a slow-pull test machine. Mauthner
however opinions (personal communication, May, 2012) that the slow pull test
methodology used in these examples does not satisfactorily represent the activity
during a rescue. Mauthner’s observations are based upon how a rescue haul team
behaves, as typically a vigilant haul team will stop applying tension immediately that
a prusik fails to grip the parent rope. Mauthner’s stance provides valuable guidance;
in so much that the test methods utilizing machines under laboratory controlled
21
conditions do not necessarily represent the true picture of the real world.
Anecdotally, the author has witnessed a prusik slip on a rope during a recovery from
water when the line was over tensioned by an over-enthusiastic haul team, the line
was glazed, and there was some evidence of the prusik melting. However the
system was not tensioned to destruction. A slow pull test machine on the other hand,
receives no feed-back from the prusik’s gripping ability and will continue to pull until
the point of destruction unless the machine operator intervenes to terminate the test
procedure. For this reason Mauthner is critical of the work of many researchers, and
advocates a continuously applied tension test. This test methodology progressively
applies tension until a slip event occurs, at which a continuous tension is maintained
and can be recorded. Using this methodology, Mauthner is explicit that, ‘an 8mm
triple-wrap prusik when applied to an 11mm rope tends to demonstrate a slip value
of between 7 – 11 kN’ (personal communication, May, 2012).
For this reason, it is intended during this study that a real world evaluation of a boat
on a high line will incorporate the principles behind the continuously applied tension
test. By subjecting the rig to an incrementally controlled flow of water, observations
can be made of all of the components. Should a slip event occur, continuous tension
will be maintained at that tension, unlike slow pull test methods as described
elsewhere.
The development of this method will determine the load, and will be utilised to
address the research question on which this thesis is based.
“What force (N) will a boat typically encounter when placed upon a high line and deployed in moving water during swift water rescue?”
Although this thesis must stand alone, it is anticipated that by establishing the load
placed upon a high line and presenting the methods for peer review, that the
22
foundation for rescue operational guidance based upon the load may be developed.
A suggested process to that end point would include;
1. Establishment of the load, (the research question), 2. A proposed worst case event (WCE), 3. The identification of a load rating that can accommodate the worst case event. This rating will include a safety factor.
To answer this research question, the following 4 hypotheses are presented and
reflect an approach to solve a multi-dimensional question. It is conjectured that the
load will be determined by three independent variables, trim (the positioning of the
load within the boat), the size of hull selected and the stream velocity in which the
boat is positioned.
2.10 Hypotheses and Worst Case Event Description
Hypothesis 1
The force in the highline will increase exponentially as the stream velocity rises.
This hypothesis is based up the work of O’Shea which identifies the force induced
by water flowing incident to an object positioned in a flow is proportional to the
square of the velocity. Because force is proportional to the square of the velocity (v2)
an exponential increase in force is anticipated
Force = density of fluid x velocity2 x area (1)
Hypothesis 2
A small hull size will result in a smaller force induced on the highline for a given
stream velocity.
Similar to hypothesis 1, this is based on the force induced by water flowing incident
to an object positioned in a flow is proportional to the area.
Force = density of fluid x velocity2 x area (1)
23
Hypothesis 3
By locating the load to the rear of the craft (aft trim), the force for a given stream
velocity will be less than neutral trim.
Because by placing the load to the rear of the boat, the bow will be lifted, so reducing
the surface area incident to the current flow vector.
Hypothesis 4
By locating the load to the front (bow trim), the force for a given stream velocity will
be greater than a neutral trim.
Because the bow will be pushed deeper into the water so presenting a larger surface
area incident to the current flow vector.
Worst Case Event – a proposal
A worst case event that a boat on a highline may experience includes a scenario
during which;
1. The boat is positioned in a high flow,
2. The boat is trimmed with the load towards the bow such that water pours into
the boat (swamping).
3. A D ring anchor fails at the front of the boat subjecting the remaining D rings
to a “shock load.”
Number 2 (above) is presented as a likely occurrence in the event of the Rescuer
reaching forward of the bow to make contact with the Victim, so trimming the boat
adversely, and allowing water into the craft. The water feature created on the
upstream side of obstructions is known as a cushion wave, or upstream V (Berry,
2002:284) which has a water level elevated above the baseline, and so water is
more likely to enter the front of the boat under these circumstances. This occurrence
24
has previously been predicted (but not tested) by Smith and Stephen (2009) who
state,
‘...the highline in the river application could experience a large increase in load (relative to the direction of the flow of the river) such as would occur if an attached boat were to become swamped, or floating debris were to entangle the boat.’ Number 3 (above) is based upon the premise that dynamic events lead to a greater
impulse force than created by the static load alone. By analogy, the BCCTR showed
that the WCE would occur during rope rescue operations should the load fall during
the edge transition. In this instance a 2kN static load was shown to generate a
dynamic peak load of up to 15kN. The boat man’s anchor (Ray, 1997: 91) used as
a focal point of attachment during a boat on a highline utilises a load distribution
concept which accommodates a change in the direction of the resultant force. The
implication of such a construction is that in the event of an anchor failure, the slack
rope induced by the released anchor leg must become tight before the anchor
becomes operable. It is conjectured that this may lead to a higher force (shock load)
as a consequence of the dynamic event.
2.11 Experimental Design
The author has previously made a case for the testing of equipment intended for
swift water rescue to be made under real world conditions (Onions and Collins,
2012). While the test methods for individual components have been well established
within Europe (for example see British Standard, 1998), an approach that evaluates
all of the components constructed as a system is desirable. By examining the
system holistically, variables such as force multiplication due to mechanical
advantage may be incorporated into the overall evaluation.
To achieve the real world context, this thesis examines the forces exerted upon a
tethered rescue boat, and the connected rigging (high line) due to current vector

25
associated with the moving water. The speed of the current vector, and the nature of
the stream flow must be representative of real operational conditions, and the rope
rescue system employed to position the craft must be a common and appropriate
method utilized by rescue personnel under these circumstances. Force imparted
upon the rope rescue system will be recorded by a load cell (and ancillary
equipment) placed in series with the focal point of the raft at the intersection with the
tethering system (high line). Certainly this approach of placing load cells in series
with components of rope rescue systems is not novel. Analogue strain gauges are
used in series between an aerial high line and the anchors, used for educational
purposes during Rigging for Rescue™ classes (Mauthner, 2002). Frank (2010: 169)
also demonstrates this approach of gathering indicative force data for contextual
educational purposes. In summary, the literature suggests that there is much
performance related data associated with system components collected under test-
house controlled conditions, and some evidence of indicative use of load cells placed
in series with aerial rope rescue systems. There is however, little evidence found by
the author of collecting data from rope systems used within a water rescue context
using load cells incorporated within in the system. This approach underpins the
methodology of this thesis, the success and validity of which will be discussed within
the Discussion.
The independent variables to be controlled within this real-world analysis are
average stream velocity (ms-1), the positioning of the rescuer within the craft (trim)
and the type of craft (and hence hull size) that rescue practitioners may select.
The dependent variable, force (N) is to be recorded via a load cell positioned in
series with the reeve line (Figure 3, page 31).

26
2.12 Representative Flow
The boat on a highline must be deployed into a current vector with a range of
average stream velocities encountered during real-world deployments.
The NFPA (2009) state that threshold velocity for swiftwater starts at 1 knot (0.51
ms-1), and in the UK, the DEFRA Concept of operations states 10 mph (4.47 ms-1) as
the maximum water velocity that a rescue boat should be capable of operating in.
(Department for Environment, Food and Rural Affairs, 2011). Therefore the testing
procedures should include a water velocity range in increments to accommodate the
range 0.5 – 4.5 ms-1 to reflect accurately the full range that rescue practitioners may
expect to find in the field.
27
3.0 METHODS
3.1 Testing Venue
The field work was conducted at the Tees Barrage International White Water Centre
(TBIWWC) near Stockton on Tees in the UK during December 2011 and January
2012. The facility is a purpose built white water course utilising a Palm Rapid Block
™ system to construct features within the channel. The blocks are used to construct
features in the channel bed (bed morphology) which create surface features
including waves, eddies and hydraulic jumps.
The water flow around the course is maintained by a combination of water fed under
gravity from the River Tees and by four Archimedean screws which may be
controlled to augment the flow within the channel. The course is managed to
maximise the use of gravity-fed water from the River Tees which is dependent upon
the height difference (head of water) either side of the Tees Barrage due to the state
of the tide. When the tide has ebbed, the operators maximise the use of gravity fed
water and the Archimedean screws are switched off. Conversely when the tide has
flooded, there is no height difference at the barrage, and full use of the screws is
made. The site is managed to achieve usable flows within the channels by the
combined use of gravity and pumped flow, bringing any number of the four screws
on-line at any state of the tide.
Use of the site was negotiated, during which the Rapid Blocks™ were removed from
the channel so producing an unrestricted jet of water. A suitable test location was
chosen within the channel that had a gradient to achieve an elevated water velocity.
The Rapid Blocks were re-arranged to produce a parallel-sided channel.
28
3.2 Calibration and Control of Water Velocity (v)
The TBIWWC was able to provide nominal pumped volumes (m3 s-1), however the
stream velocity was observed to change at different locations in the course, so a
method was sought to calculate the average stream velocity at the specific location
where the force determination was planned to take place. The method identified
from the literature, and in frequent use by Hydrologists in the field (Gierke, 2002), is
the Manning formula as described by many classical hydrological texts (for example
see Akan (2006). The Manning formula is an empirical tool for determining
discharge with respect to the potential energy of the flow, the nature and composition
(roughness) of the channel bed.
The test channel was selected as exhibiting a constant cross sectional area resulting
in steady flow. Further, the test site was selected with a fixed, constant and known
gradient with consistent use of concrete during the channel construction.
3.3 Test Channel Construction
A parallel sided channel, 4.5m in width was constructed in the steepest gradient
available at the TBIWWC. The channel was constructed with Palm Rapid Blocks™
to allow a potential 1.5 m depth of water in the testing location. The blocks are
positioned by means of an inverted “T” section steel channel cast into the concrete
bed of the main channel. Location is achieved by long threaded bars that align with
the “T” section. Channel block walls are constructed so that the adjoining blocks are
off-set with the joins on the preceding “course” as per good brick laying practice.
29
3.4 Pumped Flow Calculations
Measurements were taken from the test site to enable the relationship between
pumped volume and average stream velocity to be established. A steel tape
measure was used to collect the dimensions of the channel width (m) and the
channel length (m). The slope of the channel was calculated by referencing the
engineering drawings of the site. The levels were obtained from the top and bottom
of the gradient and subtracted (height lost) and divided by the channel length.
Slope = (top datum – bottom datum) / channel length.
The facility operators were requested to introduce flow into the channel via the
Archimedean screws in staged increments, so the average depth could be
established at each setting. It was found by observation that the minimum pump
setting of 55% capacity introduced just enough flow into the test channel to allow the
raft to float. This was established as the lowest minimum flow during the test series.
The Facility Operators were requested to set 55, 65, 75, 85 and 100% flows into the
channel. At each stage the average depth of the water in the centre line of the
channel was recorded (m). The procedure was coordinated via VHF two way radios,
and a settling time of approximately 5 minutes was allowed for the flow to settle so
that a constant value for depth could be established.
The table APPENDIX 1 shows the recorded values from the channel, and Manning’s
formula with a Manning’s constant (n) selected of 0.015 for concrete. This procedure
established a calibration curve for the unique channel (constructed with Palm Rapid
Blocks™) for pump capacity (%) and average stream velocity (m s-1).
The data collected during this procedure were utilised to calculate average stream
velocity at each increment and is tabulated in Appendix 1. A graph (Appendix 1)

30
shows the relationship between the nominal pumped volume and the derived
average stream velocity. The range of stream velocities available at the site; 0.6,
1.5, 2.5, 4.2 and 5.4 ms-1 reflect real-world operable conditions as required by the
National Flood Enhancement Project Concept of Operations (DEFRA, 2012).
This method of average stream velocity determination is presented as being
preferable to taking live snap shot velocity readings via a hand held ultra
sonic/Doppler shift device. It was conjectured that by adjusting the position of the
load in the craft during the testing (trim), the hull would be exposed to a varying
depth of water. Because the stream velocity changes with respect to depth, it is
important to calculate the average stream velocity where as live Doppler shift
devices record a value from a fixed location just under the surface. Further to, it was
anticipated that the craft would change its position with respect to flow and trim, so
an average (both in terms of surface position and depth) value would be appropriate.
3.5 Types of Craft Evaluated
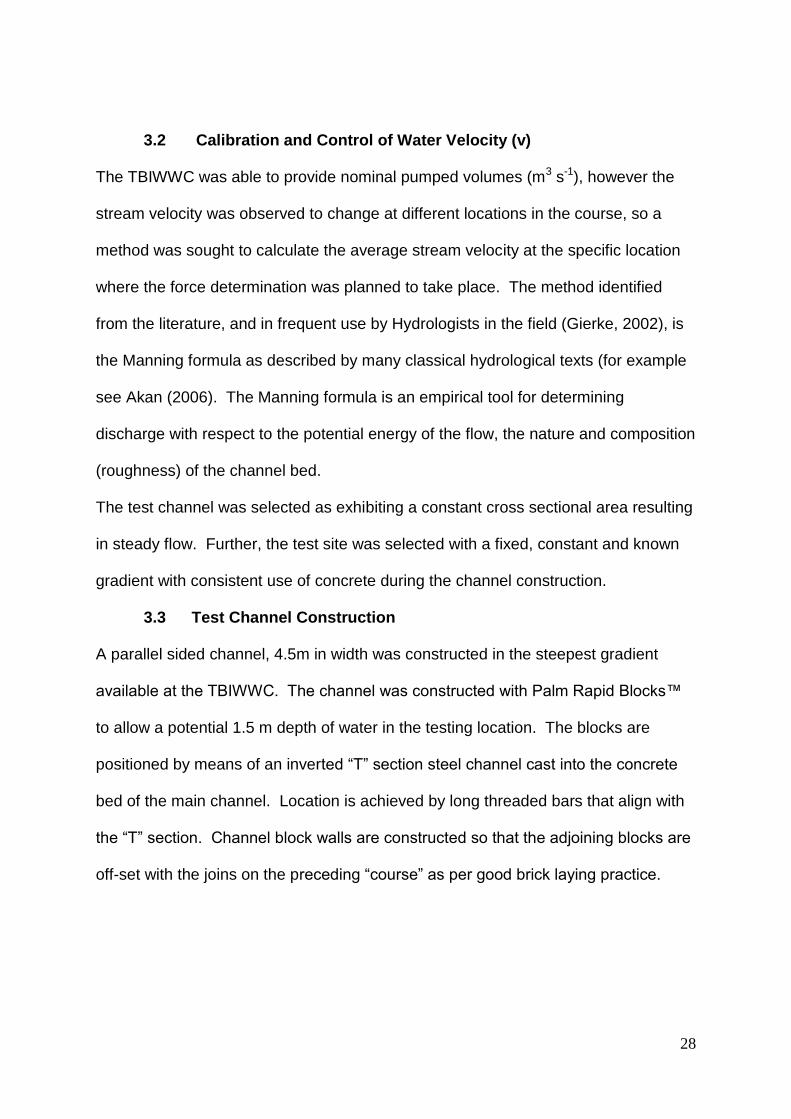
Two types of contrasting craft were selected for testing purposes; a Eurocraft
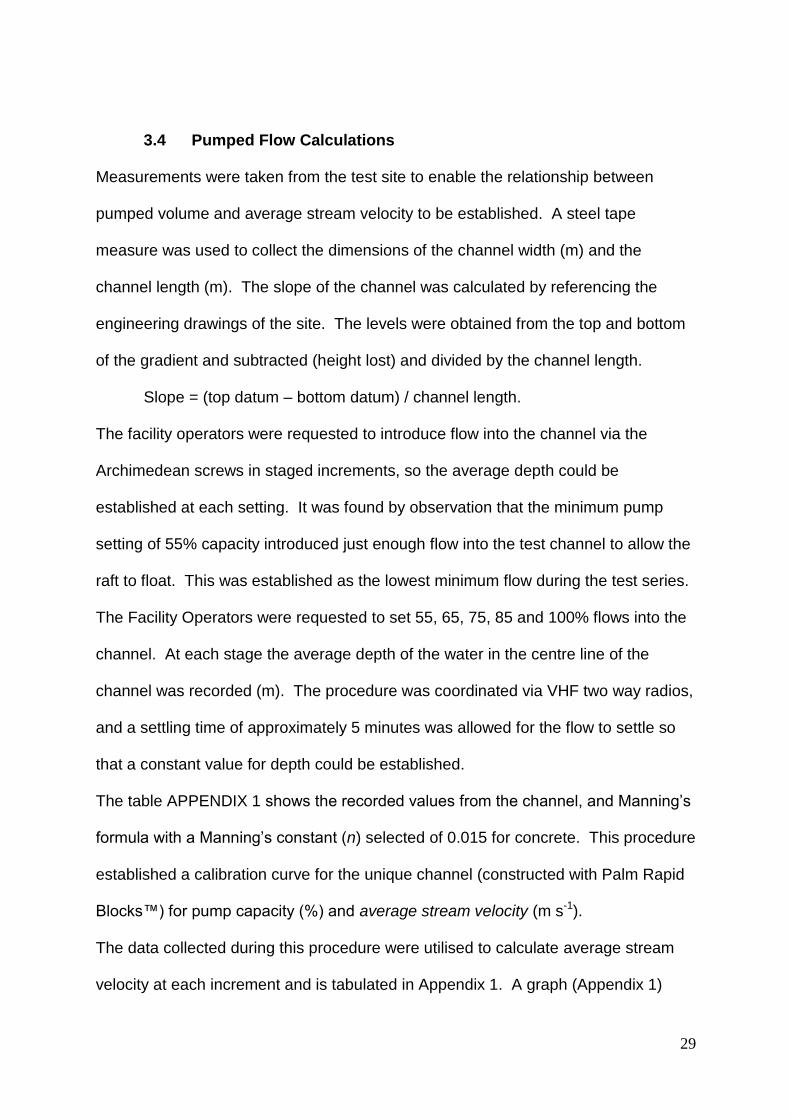
measuring 4.5 m in length (Figure 3), and an MFC Rescue Sled™ measuring 2.6 m
in length (Figure 4). The Eurocraft offers a large stable platform for the rescue team
to work in, and has capacity for carrying multiple casualties. It is however relatively
large and therefore impractical to use in some areas of swiftwater. By contrast the
MFC Rescue Sled™ is much smaller so may offer better access under some
circumstances, but is less stable and has a reduced capacity. Both craft are
representative of those in common use by water rescue teams in the UK.
31
Figure 3. A Eurocraft raft positioned in the testing channel. Note the construction with large tubes (sponsens) contributing to the enhanced stability of the craft and the potential for carrying multiple passengers.
Figure 4. An MFC Rescue Sled™ shown during a rescue from vehicles in water training class. The car is aligned with the direction of the current (bonnet facing up-stream) and the rescuer is using hand signals to indicate that the sled should be moved rearwards. Note the smaller tubes (sponsens) and reduced carrying capacity of the sled.
32
3.6 Load Positioning (Trim)
The three person load (representing the rescuer, helmsman and patient) were
positioned centrally within the Eurocraft (deemed to be neutrally trimmed), positioned
towards the rear (aft trim) and towards the front bow trim). To ensure consistency of
trim between each time the condition was set, the crew were briefed and given the
opportunity to practice on dry land exactly where to position themselves. Pre-
existing features on the raft tubes (sponsens) were used as reference.
The MFC Rescue Sled, being a much smaller craft was tested with a smaller load
consisting of a single helm and victim (n=2).
3.7 Personal Protective Equipment (PPE) and Safety and Management
Clearly, evaluating the forces on a tethered boat attached to a high line within
context exposes the participants to a degree of risk. Consequently, the Technicians
were selected on the basis of their qualification which was mapped against the
Concept of Operations module 3 training syllabus (DEFRA, 2012). The Technicians
were equipped with appropriate personal protective equipment (PPE) including water
rescue boots, dry suit, thermal under-suit, knife, helmet and a personal floatation
device (PFD).
3.8 Testing Procedure
3.8.1 Hypothesis 1
The force induced upon the highline will increase rapidly as the stream velocity rises.
The boat (Eurocraft hull) and associated rigging was set up as per Figure 1 with the
addition of a Force Logic universal column load™ cell connected in series between
the focal point of the anchor on the raft and the attachment point to the high-line
(Figure 3). A 30m length of data cable was connected to an in-line signal amplifier
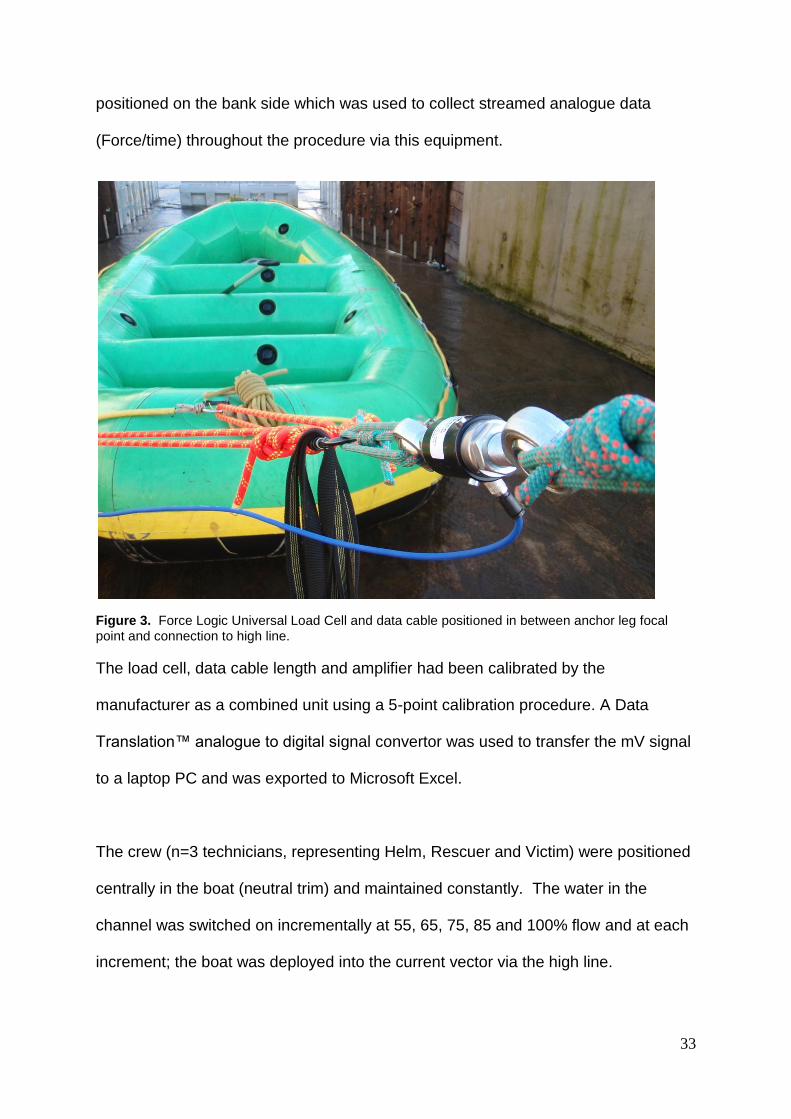
33
positioned on the bank side which was used to collect streamed analogue data
(Force/time) throughout the procedure via this equipment.
Figure 3. Force Logic Universal Load Cell and data cable positioned in between anchor leg focal point and connection to high line.
The load cell, data cable length and amplifier had been calibrated by the
manufacturer as a combined unit using a 5-point calibration procedure. A Data
Translation™ analogue to digital signal convertor was used to transfer the mV signal
to a laptop PC and was exported to Microsoft Excel.
The crew (n=3 technicians, representing Helm, Rescuer and Victim) were positioned
centrally in the boat (neutral trim) and maintained constantly. The water in the
channel was switched on incrementally at 55, 65, 75, 85 and 100% flow and at each
increment; the boat was deployed into the current vector via the high line.
34
The raft was positioned consistently mid-stream in the flow by the reeved high line as
illustrated in Figure 1. Two Water Rescue Technicians controlled the tag lines
(moved the craft across the flow) and the reeve line (moved the craft up or down
stream). The leading edge of the bow of the craft was aligned with a marker placed
on the side of the channel to ensure that the craft was positioned in the same place
in the channel on each deployment. The craft was positioned mid-stream, which
was determined by the helmsman using a length of timber cut specifically to be equal
distant from each of the channel walls.
VHF communication was used to coordinate the requested pumped flow increment,
and a five minute pause allowed for the flow rate to become constant. The raft was
positioned into the flow, with the data recording equipment set to record every 0.1
seconds.
The Manufacturer’s calibration curve was used to convert the mV signal to force (N)
and the data were manipulated using MS Excel™ and is detailed in the Results
section.
The nominal pumped volumes described in (4) were converted into average stream
velocity (ms-1) via the Manning calculations and calibration curve (APPENDIX 1).
A field notebook and digital camera were used to record a chronology of the events
during each deployment. The notes and images were used after the fieldwork had
been completed to provide annotations of the force profiles.

35
3.8.2 Hypothesis 2
A small hull size will result in a smaller force induced on the highline for a given
stream velocity.
The testing procedure for Hypothesis 1 was repeated for consistency. The following
changes were made to the independent variables to test the hypothesis;
a. The smaller MFC Rescue Sled was adopted. It was rigged with a load
distribution anchor identical to the Eurocraft hull.
b. The MFC Rescue Sled had a crew of n=2 (Helm and Victim) and
therefore a smaller load than that of the Eurocraft (n=3).
The Sled was deployed into an identical set of flow increments so that a like-for-like
data set was recorded (Results).
3.8.3 Hypothesis 3
By locating the load to the rear of the craft (aft trim), the force for a given stream
velocity will be less than neutral trim.
The testing procedure for Hypothesis 1 was repeated for consistency with the load
(n=3) positioned on the rear tube of the Eurocraft boat and maintained constantly
throughout the test.
Force data were tabulated (Results) and compared with the data from Hypothesis 1,
using the neutral trimmed data as reference for the data recorded during this
hypothesis testing.
3.8.4 Hypothesis 4
By locating the load to the front (bow trim), the force for a given stream velocity will
be greater than a neutral trim.
36
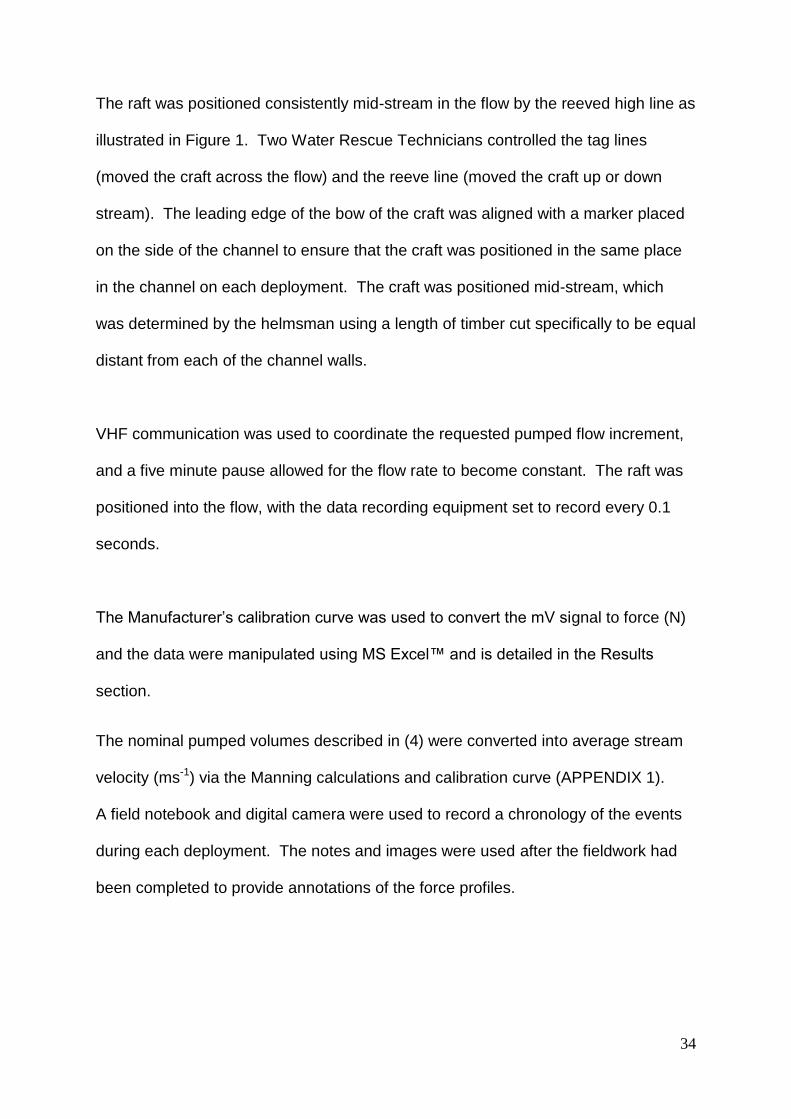
The testing procedure for Hypothesis 1 was repeated for with the load (n=3)
positioned on the bow tube of the Eurocraft boat and maintained constantly
(figure 4).
Figure 4. Boat set up for Bow Trim. Note three technicians placed towards the bow.
Force data were tabulated (Results) and compared with the data from Hypothesis 1,
using the neutral trimmed data as reference for the data recorded from this
hypothesis testing.
37
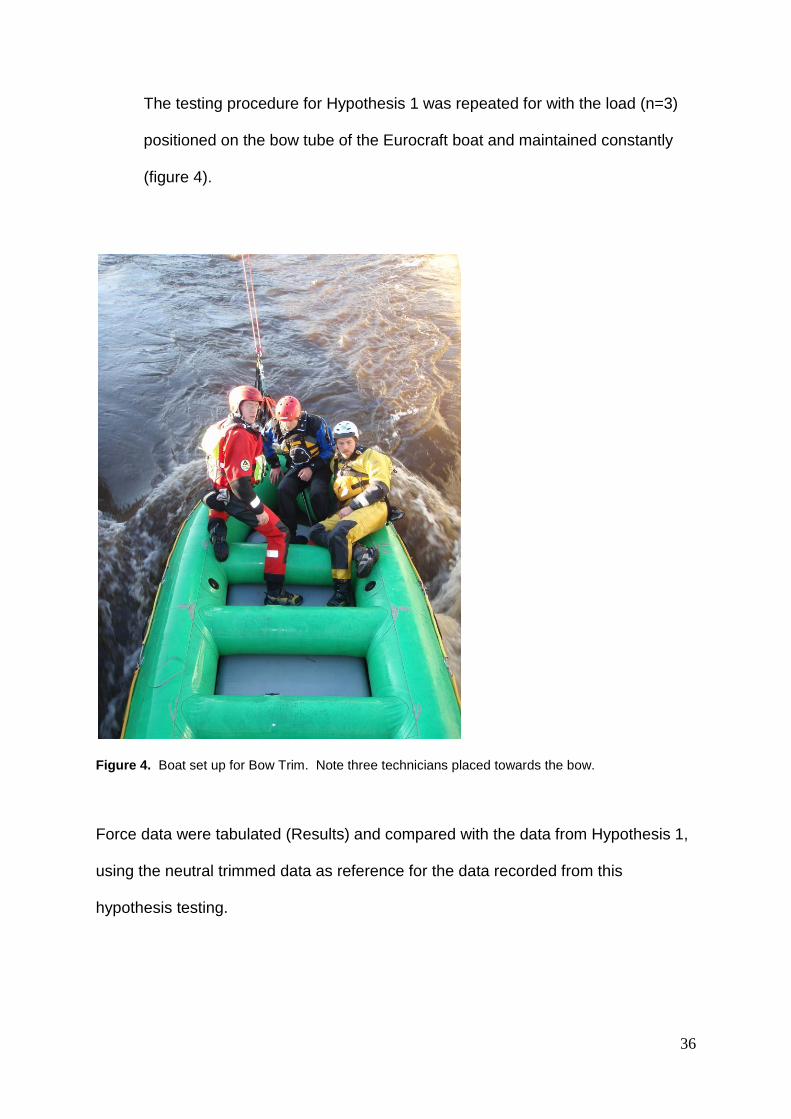
3.8.5 Force Determination of the Worst Case Event
A sacrificial cord was introduced into the self-equalising anchor in the middle of the
three anchor legs (Figure 5).
Figure 5. Sacrificial cord introduced into the middle anchor leg.
The flow was introduced into the channel at the highest flow increment and the boat
was positioned mid-flow, and the crew requested to trim the boat towards the bow.
When the boat had stabilised within the flow, it was deliberately swamped (filled with
water) by forcing the bow down into the current vector (Figure 6). When the bow had
filled with water, the sacrificial anchor leg was cut by the helmsman utilising a knife
duct-taped to an extension pole.
A force against time profile was recorded throughout the procedure.
38
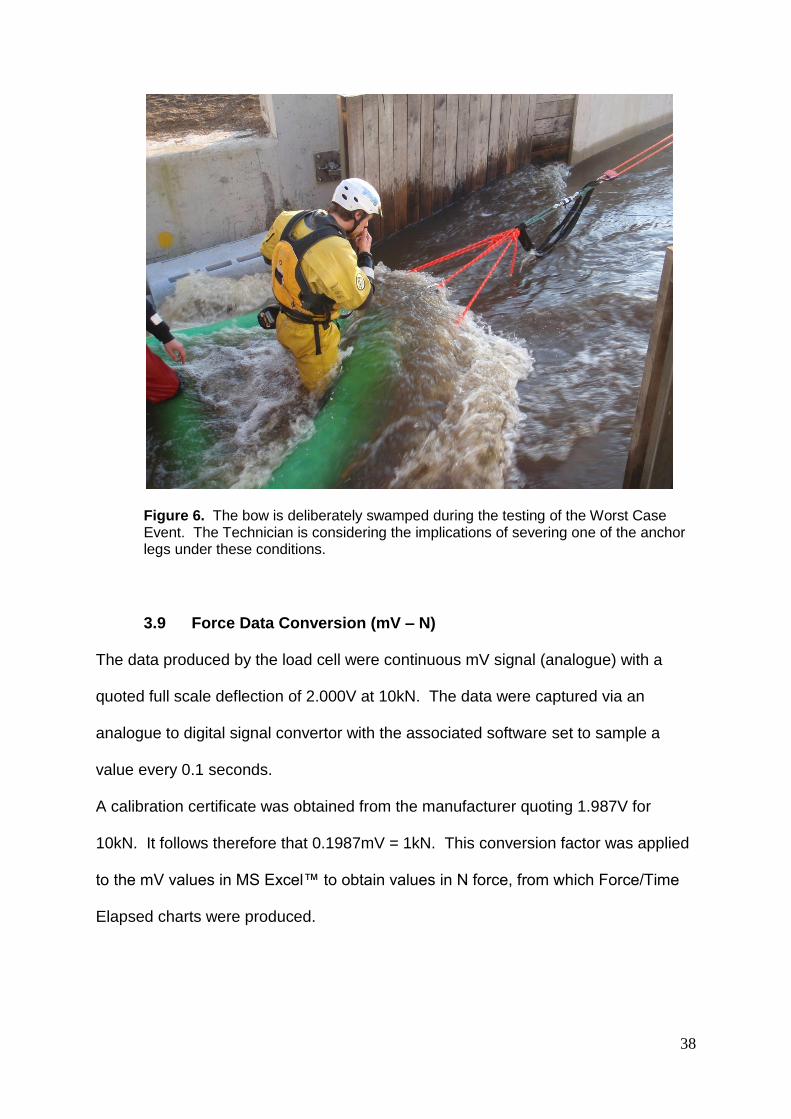
Figure 6. The bow is deliberately swamped during the testing of the Worst Case Event. The Technician is considering the implications of severing one of the anchor legs under these conditions.
3.9 Force Data Conversion (mV – N)
The data produced by the load cell were continuous mV signal (analogue) with a
quoted full scale deflection of 2.000V at 10kN. The data were captured via an
analogue to digital signal convertor with the associated software set to sample a
value every 0.1 seconds.
A calibration certificate was obtained from the manufacturer quoting 1.987V for
10kN. It follows therefore that 0.1987mV = 1kN. This conversion factor was applied
to the mV values in MS Excel™ to obtain values in N force, from which Force/Time
Elapsed charts were produced.
39
4.0 RESULTS 4.1 Treatment and Presentation of Data
A comma separated variable (csv) file consisting of volts (V) and time (tenths of a
second) was derived from the load cell for each deployment of the boats into the
flow. A new csv file was created for each of the five increments of flow (0.6, 1.5, 2.5,
4.2 and 5.4 ms-1). The Voltage values were converted into force (N) by the
application of the manufacturer’s stated calibration factor and force (y axis) against
time (x axis) were produced using Microsoft Excel™. Each condition (aft/neutral/bow
trim) was identified on the force graphs by cross-referencing field journal entries of
the time elapsed since the start of data recording with the time on the x axis of the
graph.
The force (N) against time (s) profiles are presented (4.2 – 4.6) and summary tables
(including peak force and mean force are included and aligned with the testing of the
four hypotheses and the worst case event (WCE).
4.1.1 Eurocraft Hull at 0.6 ms-1
Graph 1 illustrates the three conditions relating to trim (neutral/aft/bow) for the
Eurocraft boat deployed into the lowest stream velocity (0.6ms-1). The value of
approximately 400N for the first 100 seconds on the graph resulted from the
positioning of the craft on the dry concrete channel bed with some initial pre-loading
of the high line rope. Water was then introduced into the channel, after which a
sharp rise in force is observed at circa 150 seconds. Thereafter the three conditions
of neural, aft and bow trim have been identified, the neutral condition inducing the
highest load (approximately 1.4 kN) and the bow trim condition the least load
(approximately 1kN).

40
Graph 1 Eurocraft in 0.6 ms-1 average stream velocity
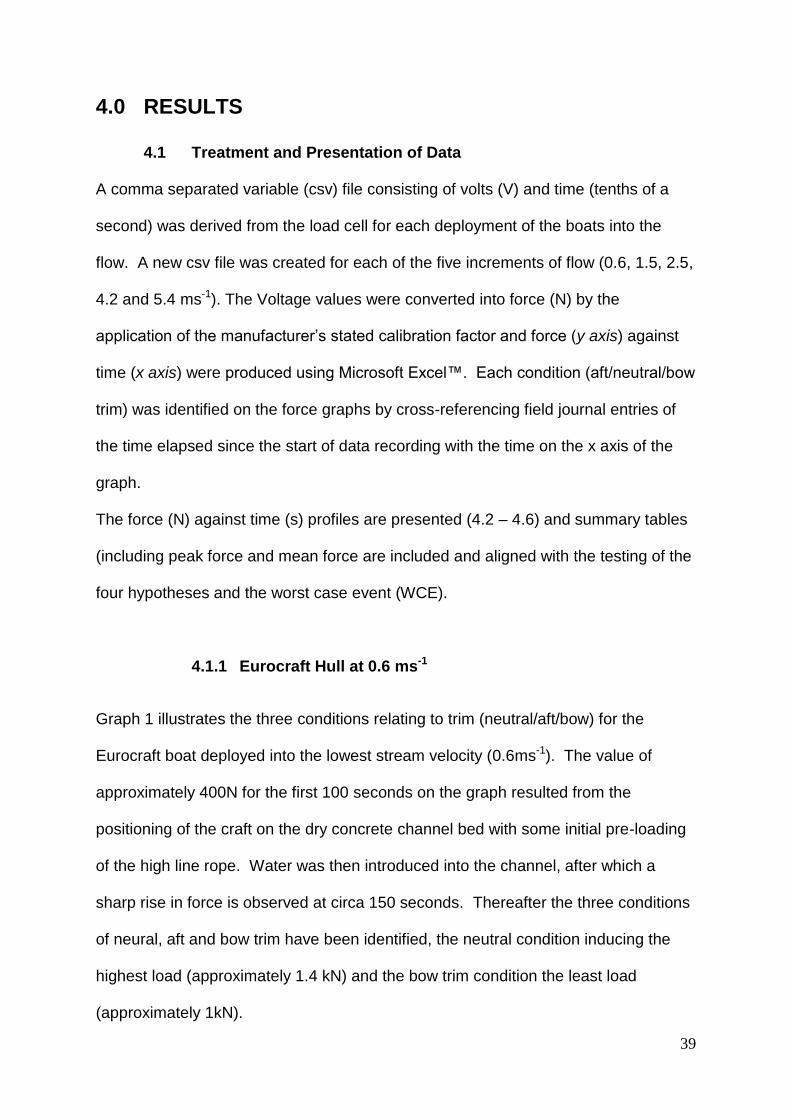
4.1.2 Eurocraft Hull at 1.5ms-1
The channel flow was increased to the next increment as shown in Graph 2 which
illustrates the three conditions relating to trim (neutral/aft/bow) for the Eurocraft boat
deployed into a current vector of stream velocity 1.5ms-1. At this velocity, the neutral
trim condition has produced the highest load, and the aft trim the least load. It is of
noteworthy to contrast the results in Graph 1, in which case the bow trim condition
induces the lowest load. Generally however the overall force values are in the same
order as those of the lower stream velocity of 0.6 ms-1 (Graph 1).
0
200
400
600
800
1000
1200
1400
1600
0.0 100.0 200.0 300.0 400.0 500.0 600.0 700.0 800.0 900.0
Forc
e (
N)
Time (s)
Eurocraft Hull Average stream velocity 0.6 ms-1
N
Neutral
Aft Bow
41
Graph 2 Eurocraft in 1.5 ms-1 average stream velocity
4.1.3 Eurocraft Hull at 2.5 ms-1
The flow was increased further to 2.5 ms-1. Graph 3 illustrates the three phases
relating to trim (neutral/aft/bow) for the Eurocraft boat. At this stream velocity there
is a considerable rise in force if the two conditions aft and bow trim are induced when
compared with the neutral trim state. The aft trim condition has induced the largest
load at this stream velocity which is in the order of 2kN. Most interestingly, the
neutral trim state force has reduced when compared to the lesser stream velocities
(0.6 and 1.5 ms-1) in Graphs 1 and 2 respectively.
0
200
400
600
800
1000
1200
1400
0.0 100.0 200.0 300.0 400.0 500.0 600.0 700.0 800.0 900.0
Forc
e (
N)
Time (s)
Eurocraft Hull Average stream velocity 1.5 ms-1
N
Neutral Trim
Aft Trim
Bow Trim
Water switched off

42
Graph 3 Eurocraft in 2.5 ms-1 average stream velocity
4.1.4 Eurocraft Hull at 4.2 ms-1
Graph 4 illustrates the three conditions of trim (neutral/aft/bow) for the Eurocraft boat
in a current of average stream velocity 4.2ms-1. At this stream velocity the neutral
trim state induces the least force of the conditions investigated (approximately
0.6kN) which is a similar value to that shown in Graph 3 (2.5 ms-1) for neutral trim.
Indeed the overall profile of Graphs 3 and 4 are very similar, although the force value
for aft and bow trim at 4.2 ms-1 are slightly higher (by approximately 200N) than at
2.5 ms-1.
0
500
1000
1500
2000
2500
0.0 500.0 1000.0 1500.0 2000.0
Forc
e (
N)
Time (s)
Eurocraft Hull Average stream velocity 2.5 ms-1
N
Neutral Trim
Aft Trim Bow Trim

43
Graph 4 Eurocraft in 4.2 ms-1 average stream velocity
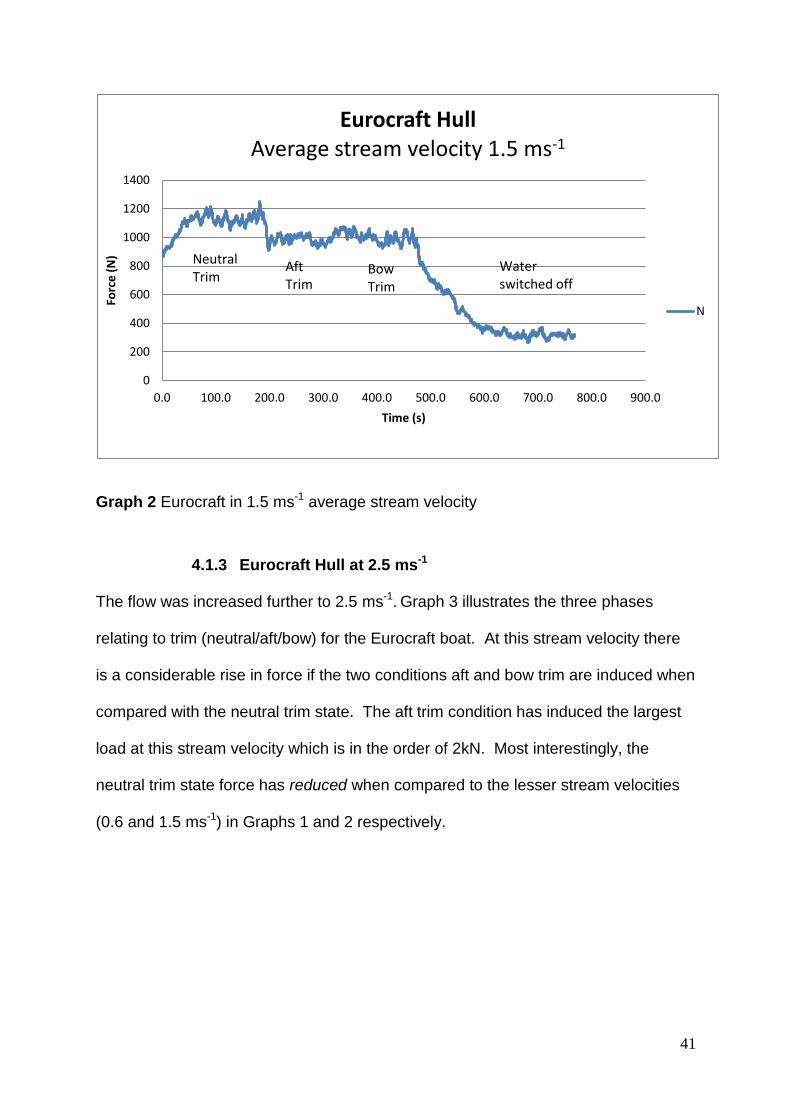
4.1.5 Eurocraft Hull at 5.4 ms-1
Graph 5 illustrates the three conditions relating to trim (neutral/bow/aft) for the
Eurocraft boat deployed into a current vector of average stream velocity 5.4 ms-1).
Please note that the order in which the Eurocraft was trimmed differs at this stream
velocity, so the reader should take care when making direct comparisons between
the shape of this graph with the preceding four graphs (Graphs 1 – 4). In this
instance, the boat was trimmed towards the bow before the aft trim condition was
induced. In this instance there is a remarkable contrast between the force induced in
neutral trim state (circa 1kN) with the force when the craft is trimmed towards the
bow (greater than 2.5kN). By trimming to the rear (aft) a force of approximately 2 kN
is recorded which is comparable with the values shown in Graphs 3 and 4 (stream
velocities of 2.5 and 4.2 ms-1 respectively).
0
500
1000
1500
2000
2500
0.0 200.0 400.0 600.0 800.0 1000.0 1200.0 1400.0 1600.0
Forc
e (
N)
Time Elapsed (s)
Eurocraft Hull Average stream velocity 4.2 ms-1
N
Aft Bow
Neutral Trim
44
Graph 5 Eurocraft in 5.4 ms-1 average stream velocity
4.2 Hypothesis Testing
For comparative purposes, summary tables presenting data pertaining to the
conditions set during each test have been arranged. The tabulated data was derived
from the raw csv files (opened in MS Excel) the functions of which were used to
derive mean force, peak force and standard deviation.
4.2.1 Hypothesis 1
The force induced upon the highline will increase rapidly as the stream
velocity rises.
The Eurocraft boat was used exclusively for the testing of Hypothesis 1. MS Excel
was used to identify the mean force (N), peak force (N) and the standard deviation.
The data for the neutral trim state at each flow increment is tabulated (Table 2).
0
500
1000
1500
2000
2500
3000
0.0 200.0 400.0 600.0 800.0 1000.0 1200.0
Forc
e (
N)
Time Elapsed (s)
Eurocraft Hull Average stream velocity 5.4 ms-1
N
Neutral Trim
Bow Trim
Aft
Load repositioned
during this phase
45
Hypothesis 1
Trim - Neutral
Average Stream Velocity (m/s)
Mean Force (N) Peak Force (N) Standard Deviation (N)
0.6 1220 1410 89
1.5 1130 1250 36
2.5 640 730 34
4.2 610 790 38
5.4 1130 2570 34
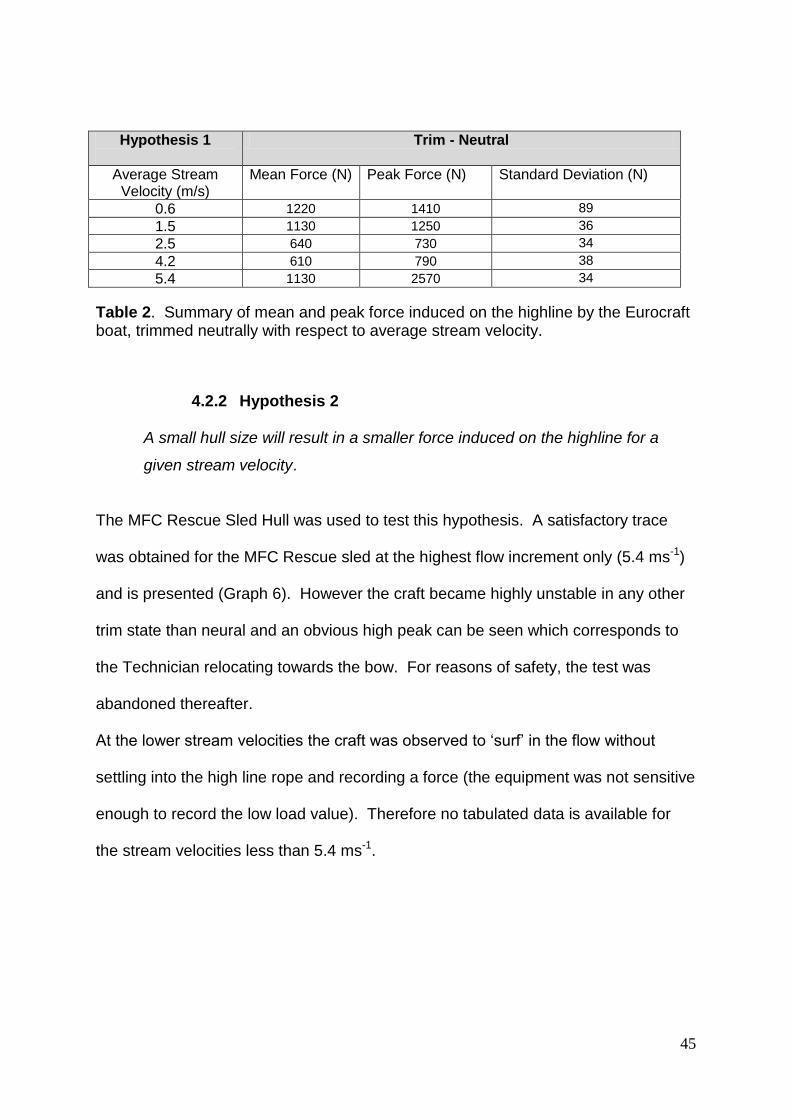
Table 2. Summary of mean and peak force induced on the highline by the Eurocraft boat, trimmed neutrally with respect to average stream velocity.
4.2.2 Hypothesis 2
A small hull size will result in a smaller force induced on the highline for a
given stream velocity.
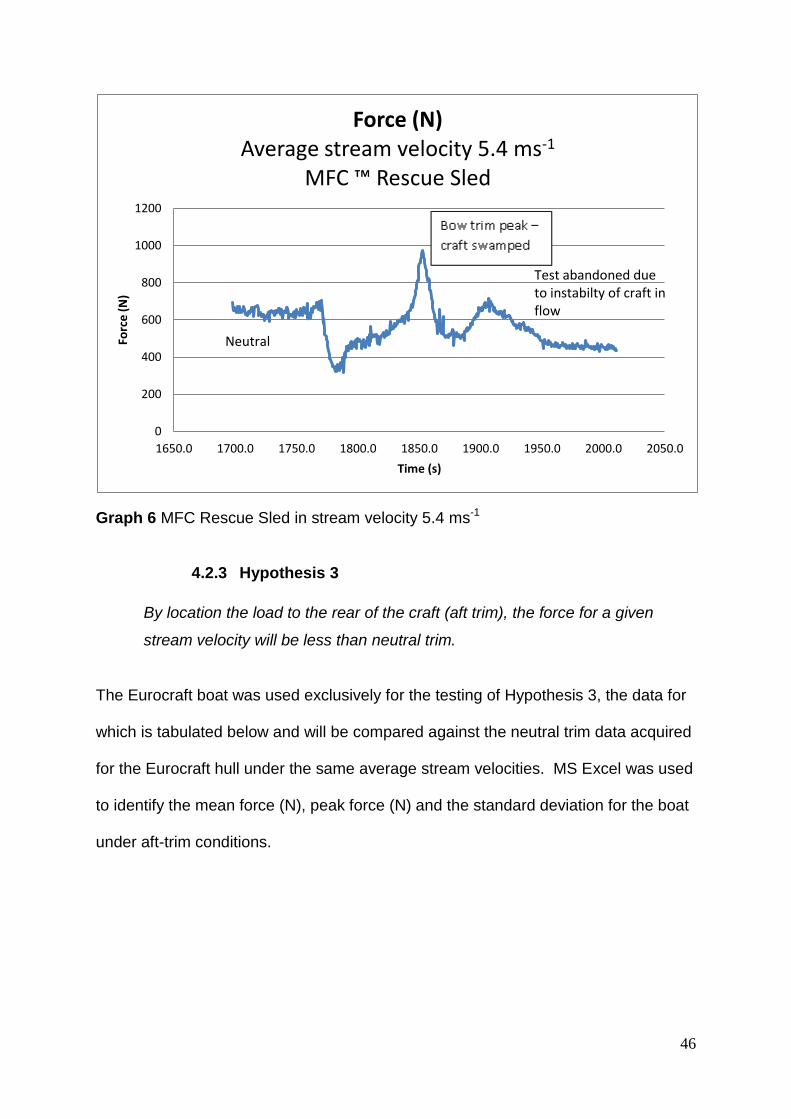
The MFC Rescue Sled Hull was used to test this hypothesis. A satisfactory trace
was obtained for the MFC Rescue sled at the highest flow increment only (5.4 ms-1)
and is presented (Graph 6). However the craft became highly unstable in any other
trim state than neural and an obvious high peak can be seen which corresponds to
the Technician relocating towards the bow. For reasons of safety, the test was
abandoned thereafter.
At the lower stream velocities the craft was observed to ‘surf’ in the flow without
settling into the high line rope and recording a force (the equipment was not sensitive
enough to record the low load value). Therefore no tabulated data is available for
the stream velocities less than 5.4 ms-1.
46
Graph 6 MFC Rescue Sled in stream velocity 5.4 ms-1 4.2.3 Hypothesis 3
By location the load to the rear of the craft (aft trim), the force for a given
stream velocity will be less than neutral trim.
The Eurocraft boat was used exclusively for the testing of Hypothesis 3, the data for
which is tabulated below and will be compared against the neutral trim data acquired
for the Eurocraft hull under the same average stream velocities. MS Excel was used
to identify the mean force (N), peak force (N) and the standard deviation for the boat
under aft-trim conditions.
0
200
400
600
800
1000
1200
1650.0 1700.0 1750.0 1800.0 1850.0 1900.0 1950.0 2000.0 2050.0
Forc
e (
N)
Time (s)
Force (N) Average stream velocity 5.4 ms-1
MFC ™ Rescue Sled
Neutral
Test abandoned due to instabilty of craft in flow

47
Hypothesis 3
Trim - Aft
Average Stream Velocity (m/s)
Mean Force (N)
Peak Force (N) Standard Deviation (N)
0.6 1120 1230 52
1.5 990 1160 38
2.5 1910 2080 56
4.2 2120 2260 47
5.4 1940 2070 33
Table 3. Summary of mean and peak force induced on the highline by the Eurocraft boat, trimmed to the rear (aft) with respect to average stream velocity.
4.2.4 Hypothesis 4
By locating the load to the front (bow trim), the force for a given stream velocity will
be greater than a neutral trim.
The Eurocraft boat was used exclusively for the testing of Hypothesis 4, the data for
which is tabulated below and will be compared against the neutral trim data acquired
for the Eurocraft hull under the same average stream velocities. MS Excel was used
to identify the mean force (N), peak force (N) and the standard deviation for the boat
under bow-trim conditions.
Hypothesis 4 Trim - Bow
Average Stream Velocity (m/s)
Mean Force (N)
Peak Force (N) Standard Deviation (N)
0.6 1050 1160 34
1.5 1000 1080 36
2.5 1770 1890 49
4.2 2030 2140 44
5.4 2530 2670 60
Table 4. Summary of mean and peak force induced on the highline by the Eurocraft boat, trimmed forward (bow trim) with respect to average stream velocity.
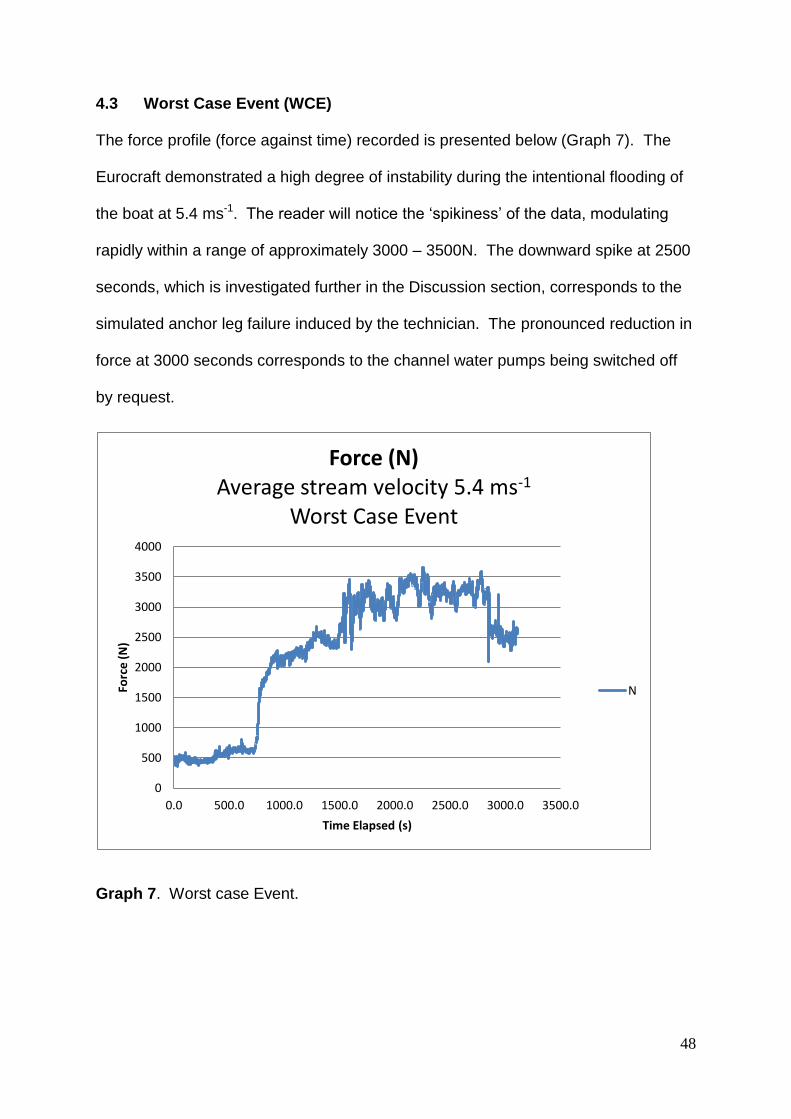
48
4.3 Worst Case Event (WCE)
The force profile (force against time) recorded is presented below (Graph 7). The
Eurocraft demonstrated a high degree of instability during the intentional flooding of
the boat at 5.4 ms-1. The reader will notice the ‘spikiness’ of the data, modulating
rapidly within a range of approximately 3000 – 3500N. The downward spike at 2500
seconds, which is investigated further in the Discussion section, corresponds to the
simulated anchor leg failure induced by the technician. The pronounced reduction in
force at 3000 seconds corresponds to the channel water pumps being switched off
by request.
Graph 7. Worst case Event.
0
500
1000
1500
2000
2500
3000
3500
4000
0.0 500.0 1000.0 1500.0 2000.0 2500.0 3000.0 3500.0
Forc
e (
N)
Time Elapsed (s)
Force (N) Average stream velocity 5.4 ms-1
Worst Case Event
N
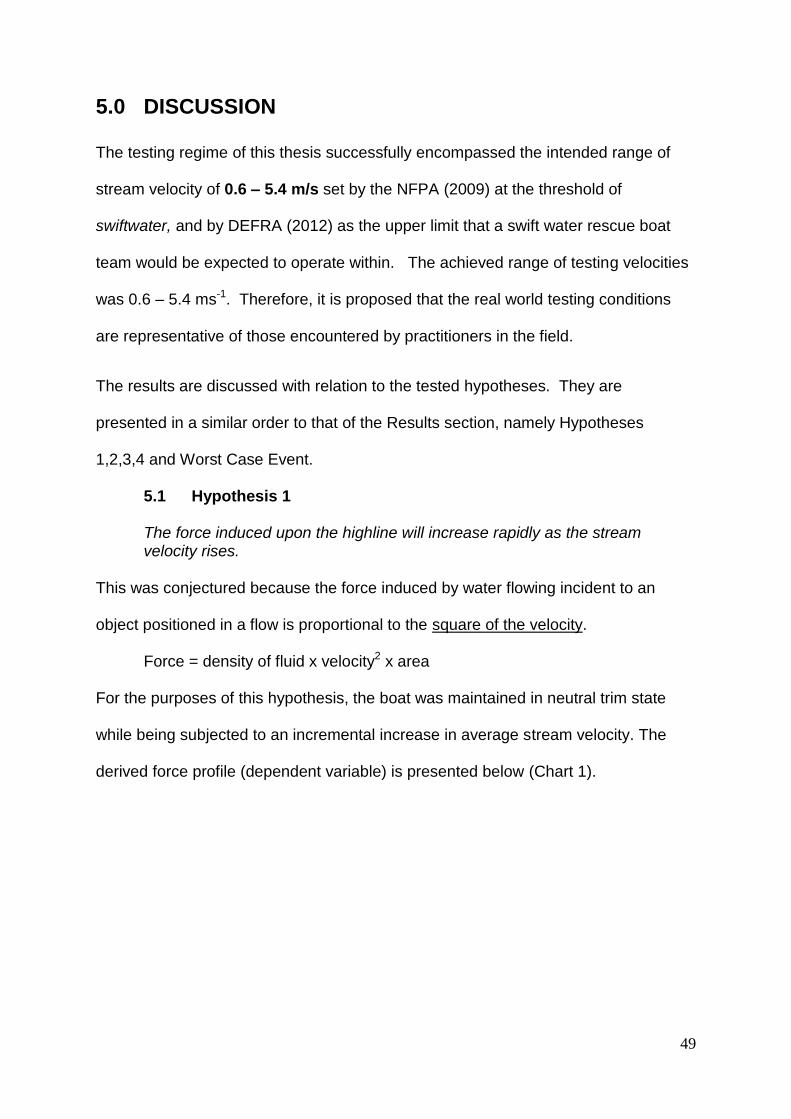
49
5.0 DISCUSSION The testing regime of this thesis successfully encompassed the intended range of
stream velocity of 0.6 – 5.4 m/s set by the NFPA (2009) at the threshold of
swiftwater, and by DEFRA (2012) as the upper limit that a swift water rescue boat
team would be expected to operate within. The achieved range of testing velocities
was 0.6 – 5.4 ms-1. Therefore, it is proposed that the real world testing conditions
are representative of those encountered by practitioners in the field.
The results are discussed with relation to the tested hypotheses. They are
presented in a similar order to that of the Results section, namely Hypotheses
1,2,3,4 and Worst Case Event.
5.1 Hypothesis 1 The force induced upon the highline will increase rapidly as the stream velocity rises.
This was conjectured because the force induced by water flowing incident to an
object positioned in a flow is proportional to the square of the velocity.
Force = density of fluid x velocity2 x area
For the purposes of this hypothesis, the boat was maintained in neutral trim state
while being subjected to an incremental increase in average stream velocity. The
derived force profile (dependent variable) is presented below (Chart 1).
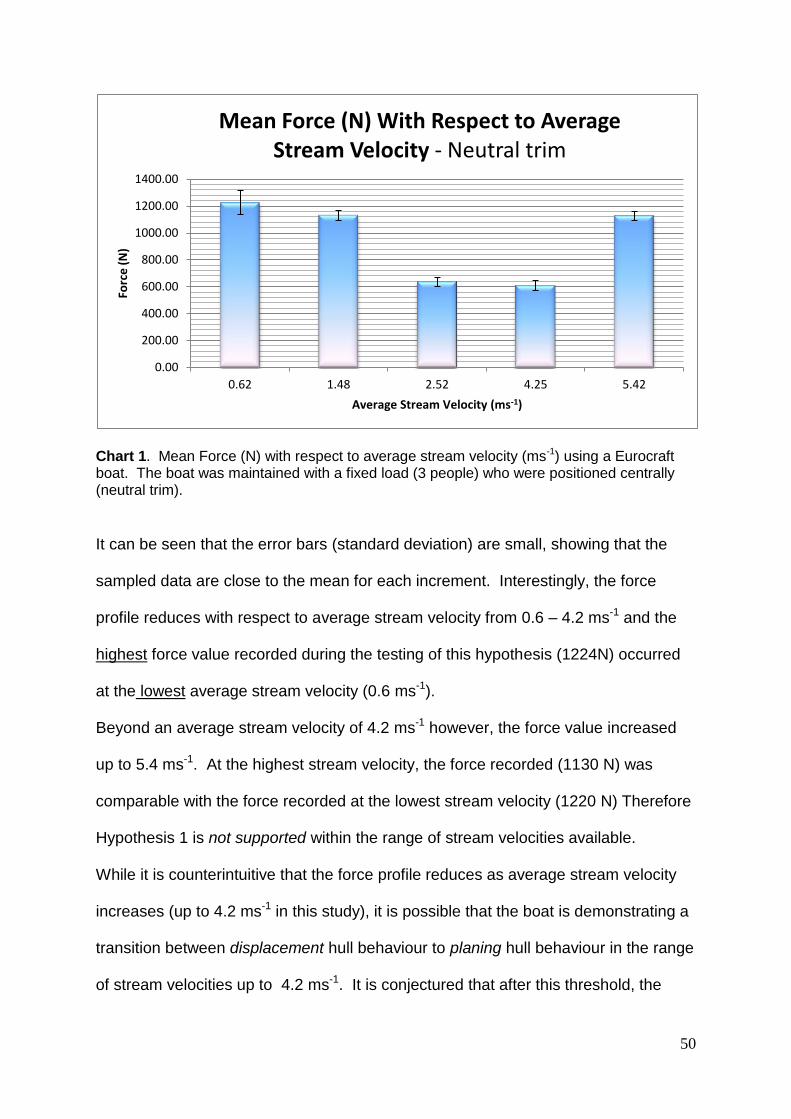
50
Chart 1. Mean Force (N) with respect to average stream velocity (ms-1) using a Eurocraft boat. The boat was maintained with a fixed load (3 people) who were positioned centrally (neutral trim).
It can be seen that the error bars (standard deviation) are small, showing that the
sampled data are close to the mean for each increment. Interestingly, the force
profile reduces with respect to average stream velocity from 0.6 – 4.2 ms-1 and the
highest force value recorded during the testing of this hypothesis (1224N) occurred
at the lowest average stream velocity (0.6 ms-1).
Beyond an average stream velocity of 4.2 ms-1 however, the force value increased
up to 5.4 ms-1. At the highest stream velocity, the force recorded (1130 N) was
comparable with the force recorded at the lowest stream velocity (1220 N) Therefore
Hypothesis 1 is not supported within the range of stream velocities available.
While it is counterintuitive that the force profile reduces as average stream velocity
increases (up to 4.2 ms-1 in this study), it is possible that the boat is demonstrating a
transition between displacement hull behaviour to planing hull behaviour in the range
of stream velocities up to 4.2 ms-1. It is conjectured that after this threshold, the
0.00
200.00
400.00
600.00
800.00
1000.00
1200.00
1400.00
0.62 1.48 2.52 4.25 5.42
Forc
e (
N)
Average Stream Velocity (ms-1)
Mean Force (N) With Respect to Average Stream Velocity - Neutral trim
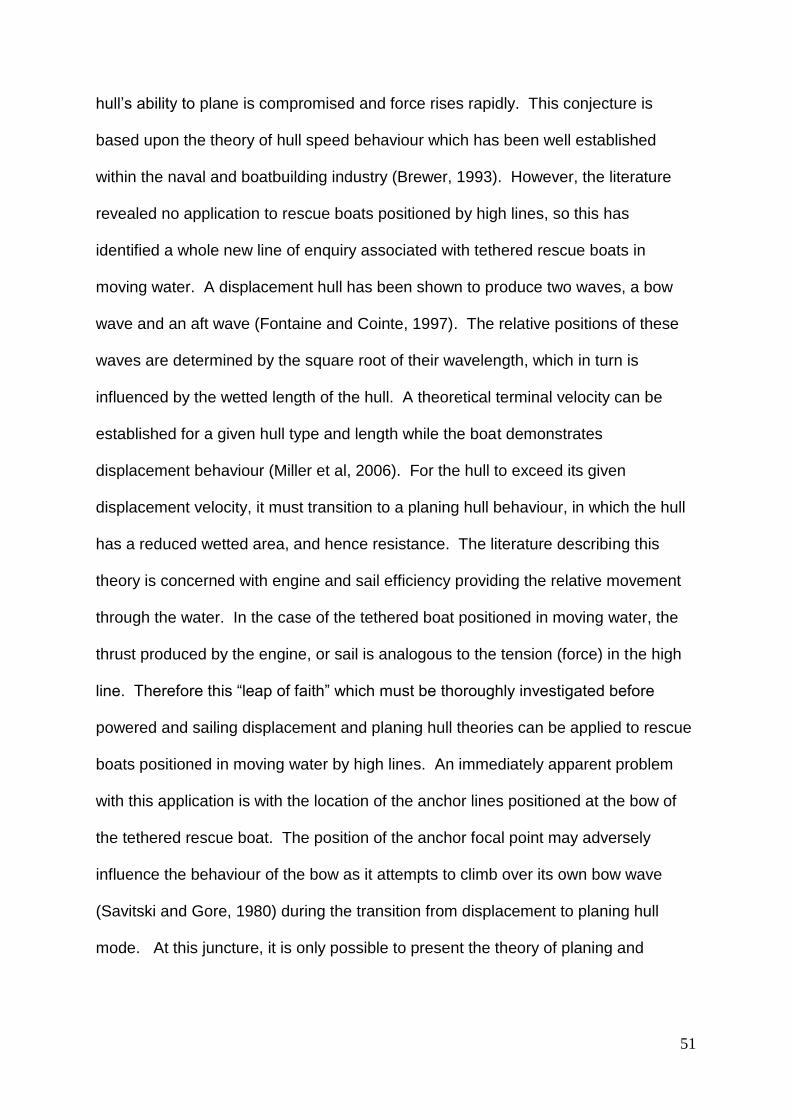
51
hull’s ability to plane is compromised and force rises rapidly. This conjecture is
based upon the theory of hull speed behaviour which has been well established
within the naval and boatbuilding industry (Brewer, 1993). However, the literature
revealed no application to rescue boats positioned by high lines, so this has
identified a whole new line of enquiry associated with tethered rescue boats in
moving water. A displacement hull has been shown to produce two waves, a bow
wave and an aft wave (Fontaine and Cointe, 1997). The relative positions of these
waves are determined by the square root of their wavelength, which in turn is
influenced by the wetted length of the hull. A theoretical terminal velocity can be
established for a given hull type and length while the boat demonstrates
displacement behaviour (Miller et al, 2006). For the hull to exceed its given
displacement velocity, it must transition to a planing hull behaviour, in which the hull
has a reduced wetted area, and hence resistance. The literature describing this
theory is concerned with engine and sail efficiency providing the relative movement
through the water. In the case of the tethered boat positioned in moving water, the
thrust produced by the engine, or sail is analogous to the tension (force) in the high
line. Therefore this “leap of faith” which must be thoroughly investigated before
powered and sailing displacement and planing hull theories can be applied to rescue
boats positioned in moving water by high lines. An immediately apparent problem
with this application is with the location of the anchor lines positioned at the bow of
the tethered rescue boat. The position of the anchor focal point may adversely
influence the behaviour of the bow as it attempts to climb over its own bow wave
(Savitski and Gore, 1980) during the transition from displacement to planing hull
mode. At this juncture, it is only possible to present the theory of planing and
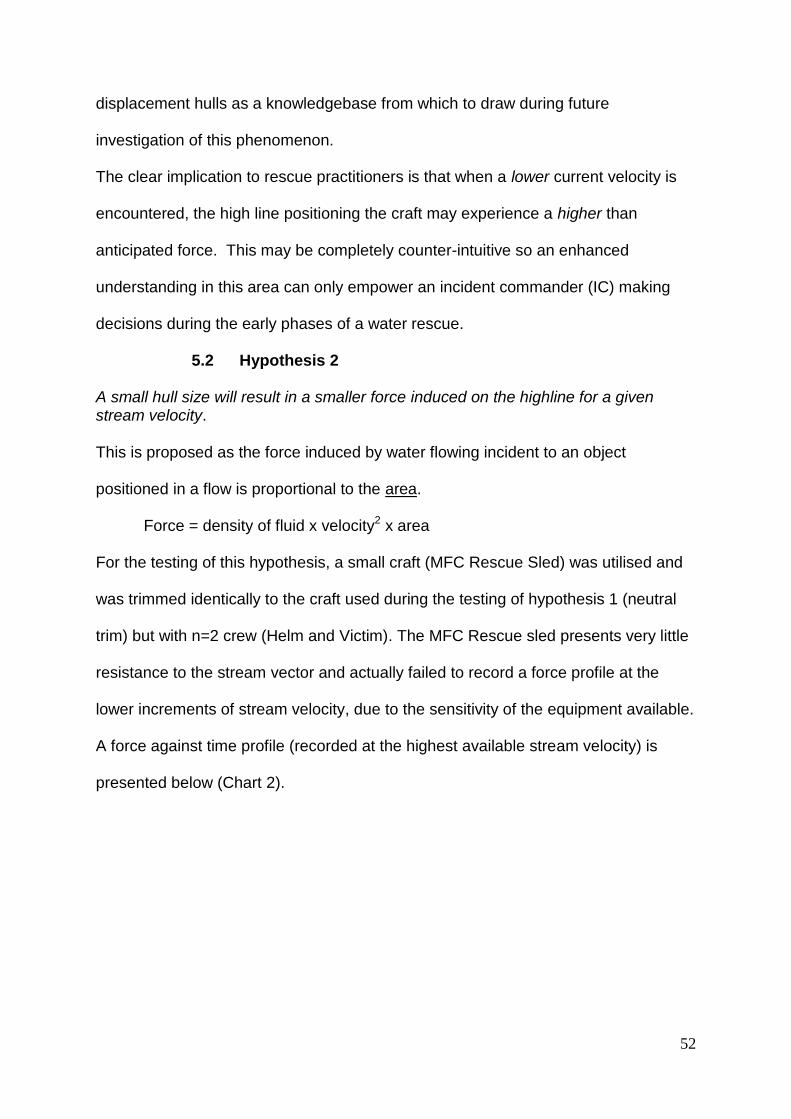
52
displacement hulls as a knowledgebase from which to draw during future
investigation of this phenomenon.
The clear implication to rescue practitioners is that when a lower current velocity is
encountered, the high line positioning the craft may experience a higher than
anticipated force. This may be completely counter-intuitive so an enhanced
understanding in this area can only empower an incident commander (IC) making
decisions during the early phases of a water rescue.
5.2 Hypothesis 2
A small hull size will result in a smaller force induced on the highline for a given stream velocity. This is proposed as the force induced by water flowing incident to an object
positioned in a flow is proportional to the area.
Force = density of fluid x velocity2 x area
For the testing of this hypothesis, a small craft (MFC Rescue Sled) was utilised and
was trimmed identically to the craft used during the testing of hypothesis 1 (neutral
trim) but with n=2 crew (Helm and Victim). The MFC Rescue sled presents very little
resistance to the stream vector and actually failed to record a force profile at the
lower increments of stream velocity, due to the sensitivity of the equipment available.
A force against time profile (recorded at the highest available stream velocity) is
presented below (Chart 2).
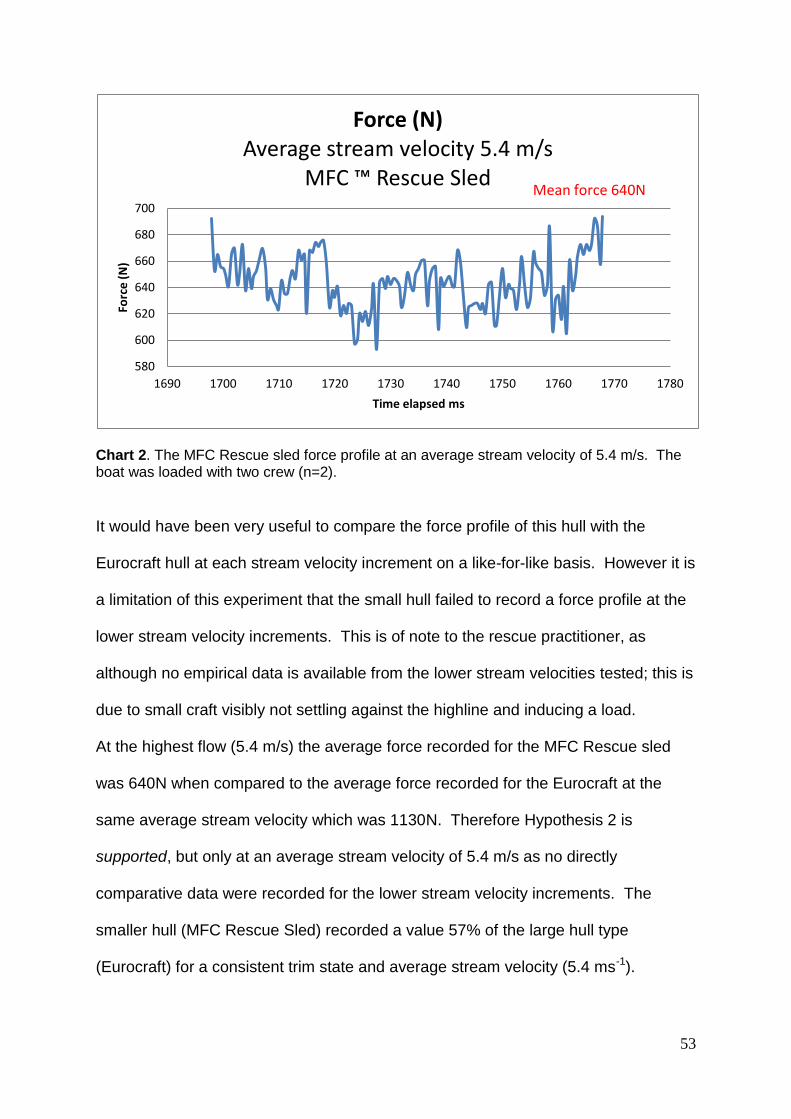
53
Chart 2. The MFC Rescue sled force profile at an average stream velocity of 5.4 m/s. The boat was loaded with two crew (n=2).
It would have been very useful to compare the force profile of this hull with the
Eurocraft hull at each stream velocity increment on a like-for-like basis. However it is
a limitation of this experiment that the small hull failed to record a force profile at the
lower stream velocity increments. This is of note to the rescue practitioner, as
although no empirical data is available from the lower stream velocities tested; this is
due to small craft visibly not settling against the highline and inducing a load.
At the highest flow (5.4 m/s) the average force recorded for the MFC Rescue sled
was 640N when compared to the average force recorded for the Eurocraft at the
same average stream velocity which was 1130N. Therefore Hypothesis 2 is
supported, but only at an average stream velocity of 5.4 m/s as no directly
comparative data were recorded for the lower stream velocity increments. The
smaller hull (MFC Rescue Sled) recorded a value 57% of the large hull type
(Eurocraft) for a consistent trim state and average stream velocity (5.4 ms-1).
580
600
620
640
660
680
700
1690 1700 1710 1720 1730 1740 1750 1760 1770 1780
Forc
e (
N)
Time elapsed ms
Force (N) Average stream velocity 5.4 m/s
MFC ™ Rescue Sled Mean force 640N
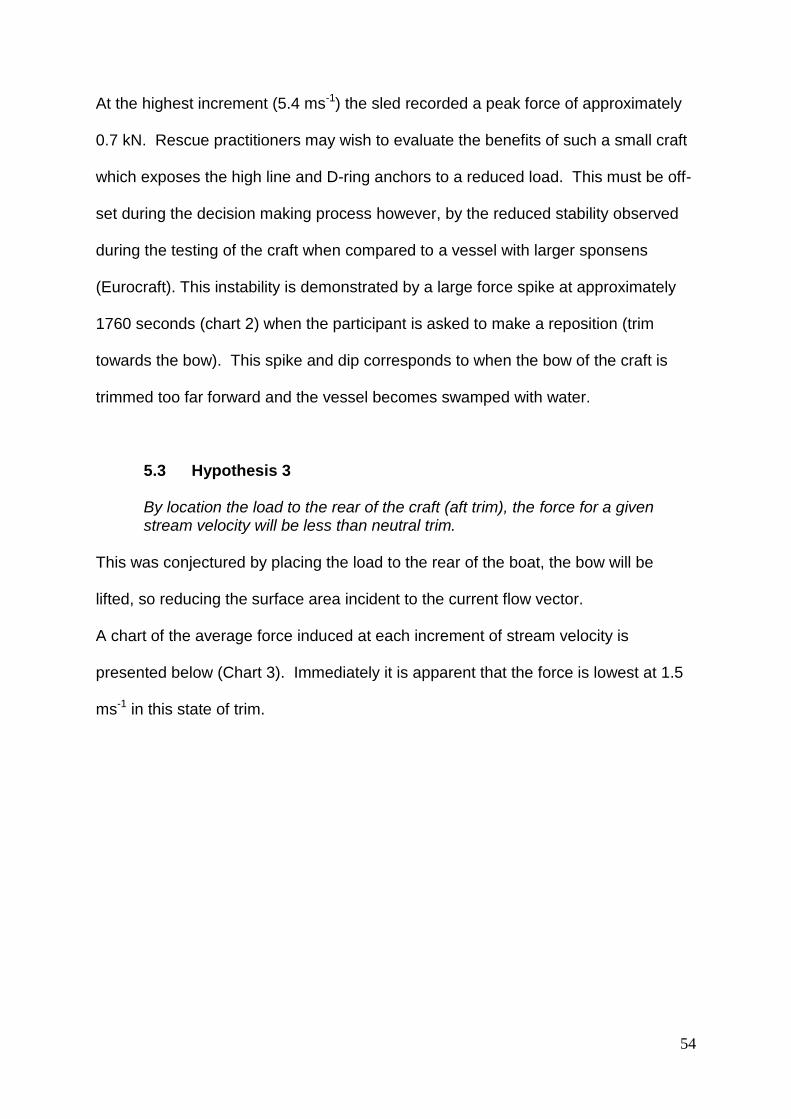
54
At the highest increment (5.4 ms-1) the sled recorded a peak force of approximately
0.7 kN. Rescue practitioners may wish to evaluate the benefits of such a small craft
which exposes the high line and D-ring anchors to a reduced load. This must be off-
set during the decision making process however, by the reduced stability observed
during the testing of the craft when compared to a vessel with larger sponsens
(Eurocraft). This instability is demonstrated by a large force spike at approximately
1760 seconds (chart 2) when the participant is asked to make a reposition (trim
towards the bow). This spike and dip corresponds to when the bow of the craft is
trimmed too far forward and the vessel becomes swamped with water.
5.3 Hypothesis 3 By location the load to the rear of the craft (aft trim), the force for a given stream velocity will be less than neutral trim.
This was conjectured by placing the load to the rear of the boat, the bow will be
lifted, so reducing the surface area incident to the current flow vector.
A chart of the average force induced at each increment of stream velocity is
presented below (Chart 3). Immediately it is apparent that the force is lowest at 1.5
ms-1 in this state of trim.

55
Chart 3. Force (N) with respect to average stream velocity (ms-1) using a Eurocraft boat. The boat was maintained with a fixed load (3 people) who were positioned at the rear (aft trim).
For the analysis of the hypothesis, these values (aft trim) above are compared with
the force values as achieved with the same craft in a neutral state of trim (Chart 4
below) set as a reference dataset.
0.00
500.00
1000.00
1500.00
2000.00
2500.00
0.62 1.48 2.52 4.25 5.42
Forc
e (
N)
Average Stream Velocity (ms-1)
Force (N) With Respect to Average Stream Velocity - Aft Trim
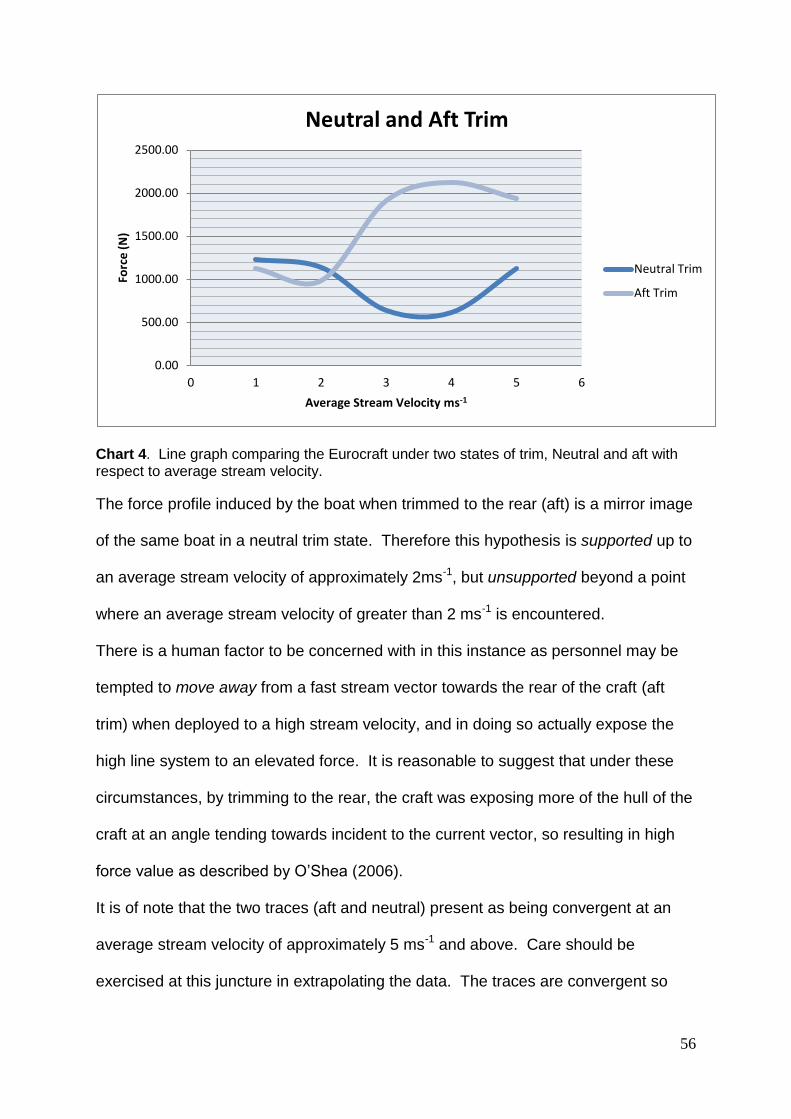
56
Chart 4. Line graph comparing the Eurocraft under two states of trim, Neutral and aft with respect to average stream velocity.
The force profile induced by the boat when trimmed to the rear (aft) is a mirror image
of the same boat in a neutral trim state. Therefore this hypothesis is supported up to
an average stream velocity of approximately 2ms-1, but unsupported beyond a point
where an average stream velocity of greater than 2 ms-1 is encountered.
There is a human factor to be concerned with in this instance as personnel may be
tempted to move away from a fast stream vector towards the rear of the craft (aft
trim) when deployed to a high stream velocity, and in doing so actually expose the
high line system to an elevated force. It is reasonable to suggest that under these
circumstances, by trimming to the rear, the craft was exposing more of the hull of the
craft at an angle tending towards incident to the current vector, so resulting in high
force value as described by O’Shea (2006).
It is of note that the two traces (aft and neutral) present as being convergent at an
average stream velocity of approximately 5 ms-1 and above. Care should be
exercised at this juncture in extrapolating the data. The traces are convergent so
0.00
500.00
1000.00
1500.00
2000.00
2500.00
0 1 2 3 4 5 6
Forc
e (
N)
Average Stream Velocity ms-1
Neutral and Aft Trim
Neutral Trim
Aft Trim
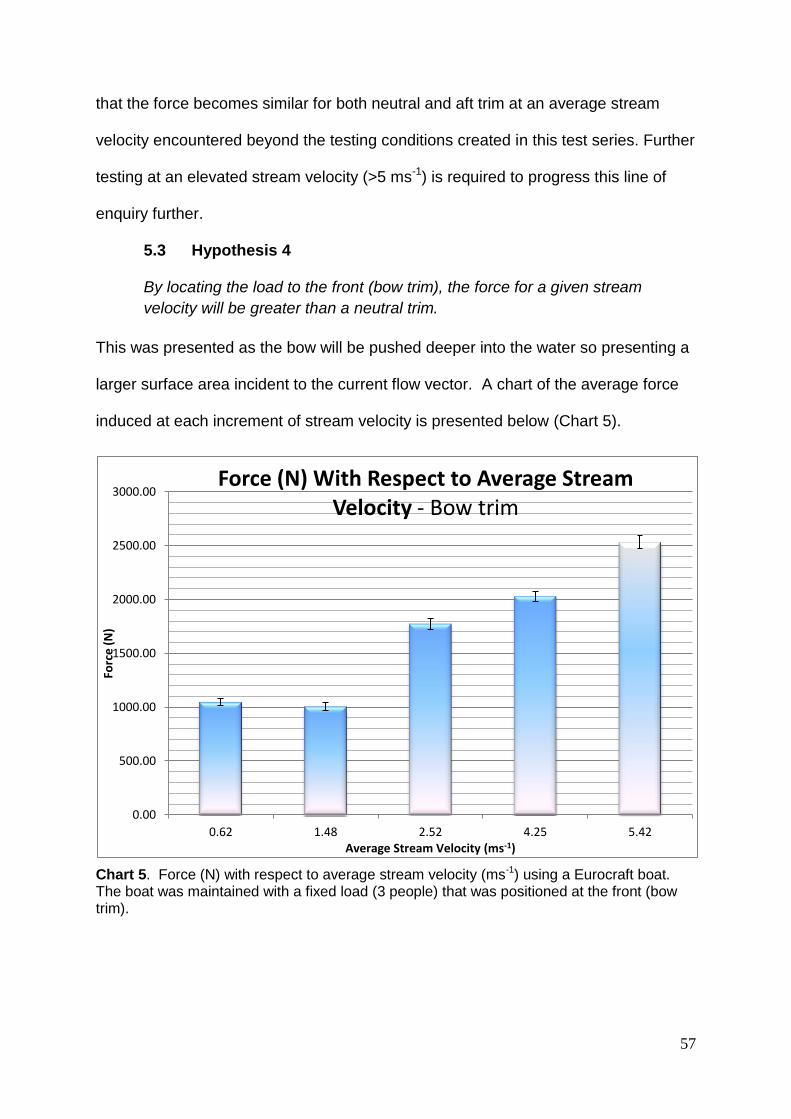
57
that the force becomes similar for both neutral and aft trim at an average stream
velocity encountered beyond the testing conditions created in this test series. Further
testing at an elevated stream velocity (>5 ms-1) is required to progress this line of
enquiry further.
5.3 Hypothesis 4 By locating the load to the front (bow trim), the force for a given stream
velocity will be greater than a neutral trim.
This was presented as the bow will be pushed deeper into the water so presenting a
larger surface area incident to the current flow vector. A chart of the average force
induced at each increment of stream velocity is presented below (Chart 5).
Chart 5. Force (N) with respect to average stream velocity (ms-1) using a Eurocraft boat. The boat was maintained with a fixed load (3 people) that was positioned at the front (bow trim).
0.00
500.00
1000.00
1500.00
2000.00
2500.00
3000.00
0.62 1.48 2.52 4.25 5.42
Forc
e (
N)
Average Stream Velocity (ms-1)
Force (N) With Respect to Average Stream Velocity - Bow trim
58
For the testing of the hypothesis, these values above (Bow trim) are compared with
the force values achieved with the same craft in a neutral state of trim (Chart 6).
Chart 6. Line graph comparing the Eurocraft under two states of trim, Neutral and aft with respect to average stream velocity.
At a low average stream velocity (up to 1.5 ms-1) the hypothesis is unsupported as
the trace for the bow trim state is lower than the neutral trim state under these
conditions. Above 1.5 ms-1 the hypothesis is supported as the trace is higher than
the corresponding values for neutral trim. Above an average stream velocity of
approximately 4 ms-1 the trace climbs with respect to force. It is conjectured that at
this point (4ms-1) the hull is no longer demonstrating planing behaviour and the
subsequent rapid elevation in force is in line with the exponential increase
associated with the velocity squared function of the formula;
Force = density of fluid x velocity2 x area
5.5 Proposed Worst Case Event (WCE)
A worst case event that a boat on a highline may experience consists of a scenario
during which The boat is positioned in a high flow, trimmed with the load towards the
0.00
500.00
1000.00
1500.00
2000.00
2500.00
3000.00
0 1 2 3 4 5 6
Forc
e (
N)
Average Stream Velocity ms-1
Neutral and Bow Trim
Neutral Trim
Bow Trim
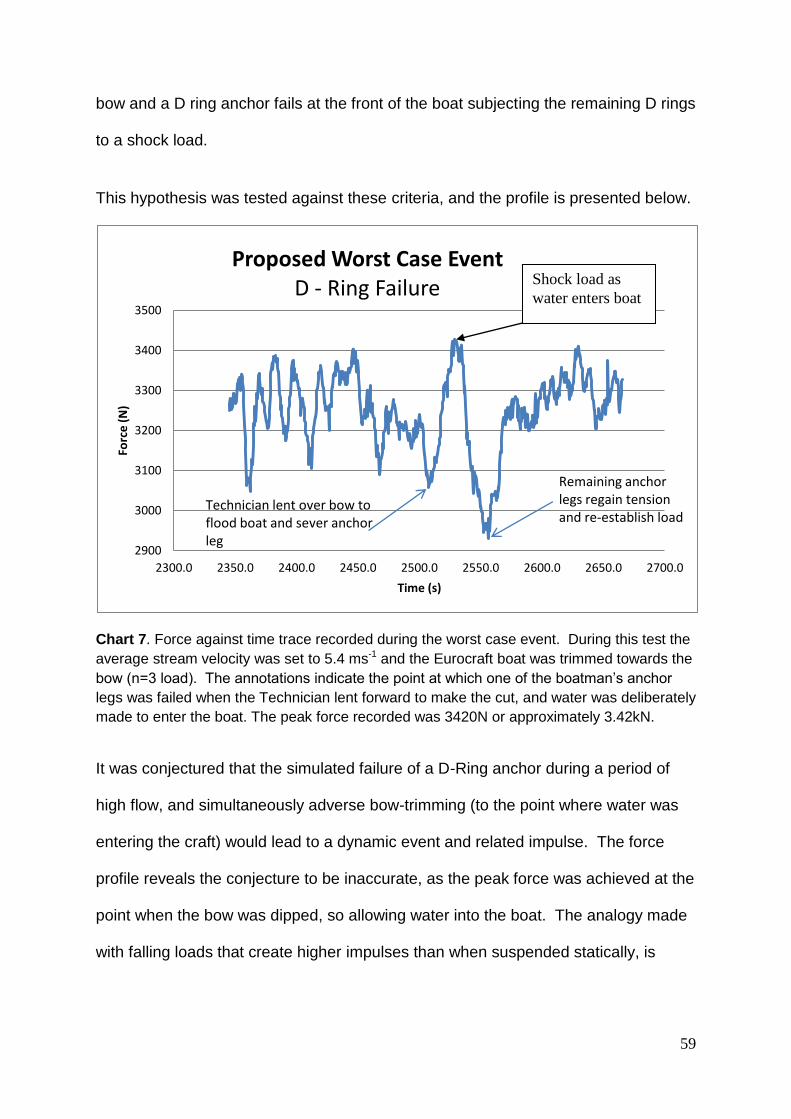
59
bow and a D ring anchor fails at the front of the boat subjecting the remaining D rings
to a shock load.
This hypothesis was tested against these criteria, and the profile is presented below.
Chart 7. Force against time trace recorded during the worst case event. During this test the
average stream velocity was set to 5.4 ms-1 and the Eurocraft boat was trimmed towards the
bow (n=3 load). The annotations indicate the point at which one of the boatman’s anchor
legs was failed when the Technician lent forward to make the cut, and water was deliberately
made to enter the boat. The peak force recorded was 3420N or approximately 3.42kN.
It was conjectured that the simulated failure of a D-Ring anchor during a period of
high flow, and simultaneously adverse bow-trimming (to the point where water was
entering the craft) would lead to a dynamic event and related impulse. The force
profile reveals the conjecture to be inaccurate, as the peak force was achieved at the
point when the bow was dipped, so allowing water into the boat. The analogy made
with falling loads that create higher impulses than when suspended statically, is
2900
3000
3100
3200
3300
3400
3500
2300.0 2350.0 2400.0 2450.0 2500.0 2550.0 2600.0 2650.0 2700.0
Forc
e (
N)
Time (s)
Proposed Worst Case Event D - Ring Failure
Technician lent over bow to flood boat and sever anchor leg
Remaining anchor legs regain tension and re-establish load
Shock load as
water enters boat
60
unrepresentative of this proposed WCE. The force profile illustrates how after the
force reduction (anchor failure) the profile climbs gradually back to its original value.
5.6 Relevance of the WCE
Having established the maximum load, via a proposal and evaluation of a worst case
event (WCE) to be in the order of 3.42 kN, care must be exercised if the assumption
is made that this will be the largest load that the high line will experience.
Trigonometric analysis of force vectors reveal that that each end station will
experience a force of greater than 3.42 kN when the angle of the highline tends to an
angle of greater than 120 degrees. For example if the angle of the high line tends to
160 degrees, then the force is increased at the end stations to approximately three
times the load perpendicular to the tensioned high line. In this example each end
station and the high line itself will be subjected to a force of approximately 10.26 kN.
Conversely, by managing the high line so that the angle is smaller (for example 90
degrees, then in this instance analysis of vectors results in a high line tension of 0.7
times the load (each end station would therefore experience 0.7 x 3.42 = 2.39kN).
If at 160 degrees, a force of 10.26 kN was experienced by the high line, this would
exceed the gripping ability of some of the components, especially the prusik hitches
which have been shown to demonstrate slipping behaviour between 7 – 11 kN.
Practitioners often select canyon line, floating low stretch kernmantel (British
Standard, 1998) which is strength rated in the order of 20kN. By tying hitches into
the rope, testing has shown that the rating of the rope is reduced by approximately a
factor of one third (see Frank, 2010:72) so the load would be approaching the
ultimate tensile strength of the system under these circumstances.
61
Further analysis of the force profile recorded during the WCE reveals that the trace
dips and spikes radically, so suggesting that the craft has become unstable within
this stream velocity. The craft could be seen to be dipping and lifting as the bow
filled with water on the up-stream side, so resulting in the craft bouncing against the
high line resulting in short but significant impulses.
By further compounding the difficulties experienced during the worst case event, a
simulated failure of a D-ring anchor was undertaken, so exposing the craft and high
line to a dynamic event analogous to a load under free fall conditions in an aerial
high line context. The force profile shows that under these circumstances, an
impulse was not recorded. The mean force post the D-ring failure event is lower
than before the event which may be explained by the craft settling into a different
position within the channel beyond that of the test zone.
Of the four hypotheses proposed during this thesis, the results have shown that one
has been unsupported entirely (hypothesis 1), two have been partially supported
(Hypotheses 3 and 4) and one hypothesis has been supported (Hypothesis 2). The
hypothesis that
A small hull size will result in a smaller force induced on the highline for a
given stream velocity (Hypothesis 2).
is supported, although it was not possible to collect data for the lower stream
velocities using an MFC Rescue sled. The proposal of the worst case event (WCE)
and associated criteria will require greater scrutiny (via testing) from practitioners
and peer review.
5.7 Answering the research question
This thesis sets out to answer the research question;
62
“What force (N) will a boat typically encounter when placed upon a high line
and deployed in moving water during swift water rescue?”
Certainly the results have shown that the answer to this question is far more complex
than a single empirical value. For the results of the thesis to be of value to the
rescue community as a reference base and via evidence based coaching, distinction
must be made between conclusions made that may be helpful in the field during the
decision making process, and those conclusions that are of academic interest and
suggest further lines of enquiry. To assist with the holistic consideration of this
complex multi dimensional subject, a 3D surface plot is presented below. This plot
illustrates the relationship between trim, average current velocity and the force
induced by the Euro craft hull. The two surface plots (Chart 8a and Chart 8b) are
derived from the same data, but (for clarity) show the surface plane from two
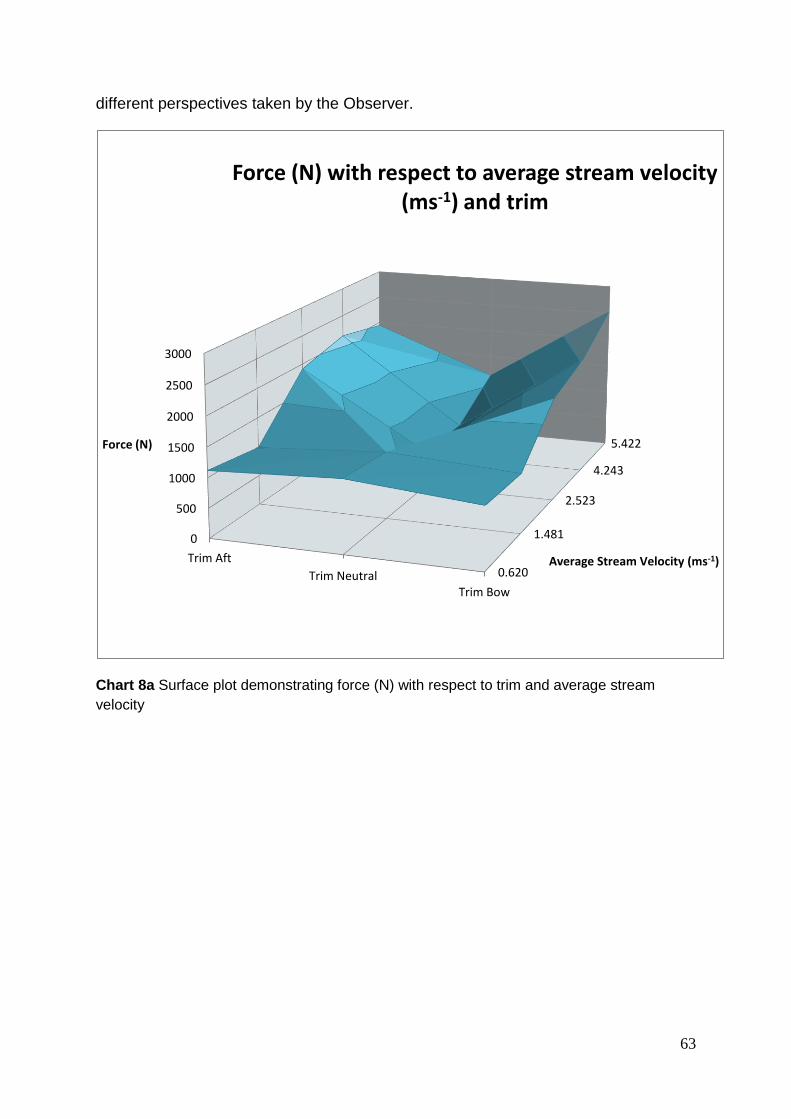
63
different perspectives taken by the Observer.
Chart 8a Surface plot demonstrating force (N) with respect to trim and average stream
velocity
0.620
1.481
2.523
4.243
5.422
0
500
1000
1500
2000
2500
3000
Trim Aft
Trim Neutral Trim Bow
Force (N)
Average Stream Velocity (ms-1)
Force (N) with respect to average stream velocity (ms-1) and trim

64
Chart 8b Surface plot demonstrating force (N) with respect to trim and average stream
velocity
These images indicate that force can be managed to a consistent level by
maintaining a state of neutral trim, regardless of the stream velocity to which the boat
has been deployed. Under low stream velocity conditions, force values would not be
unduly significant should the crew wish to relocate towards the bow or stern due to
an operational requirement. Actually they are reduced at stream velocities up to 1.5
ms-1. However, should the crew position themselves fore and aft while encountering
stream velocities greater than 1.5 ms-1 significant force values should be anticipated.
Trim Aft
Trim Neutral
Trim Bow
0
500
1000
1500
2000
2500
3000
1 2
3 4
5
Force (N)
Average Stream Velocity (m/s)
Force (N) with respect to average stream velocity (ms-1) and trim
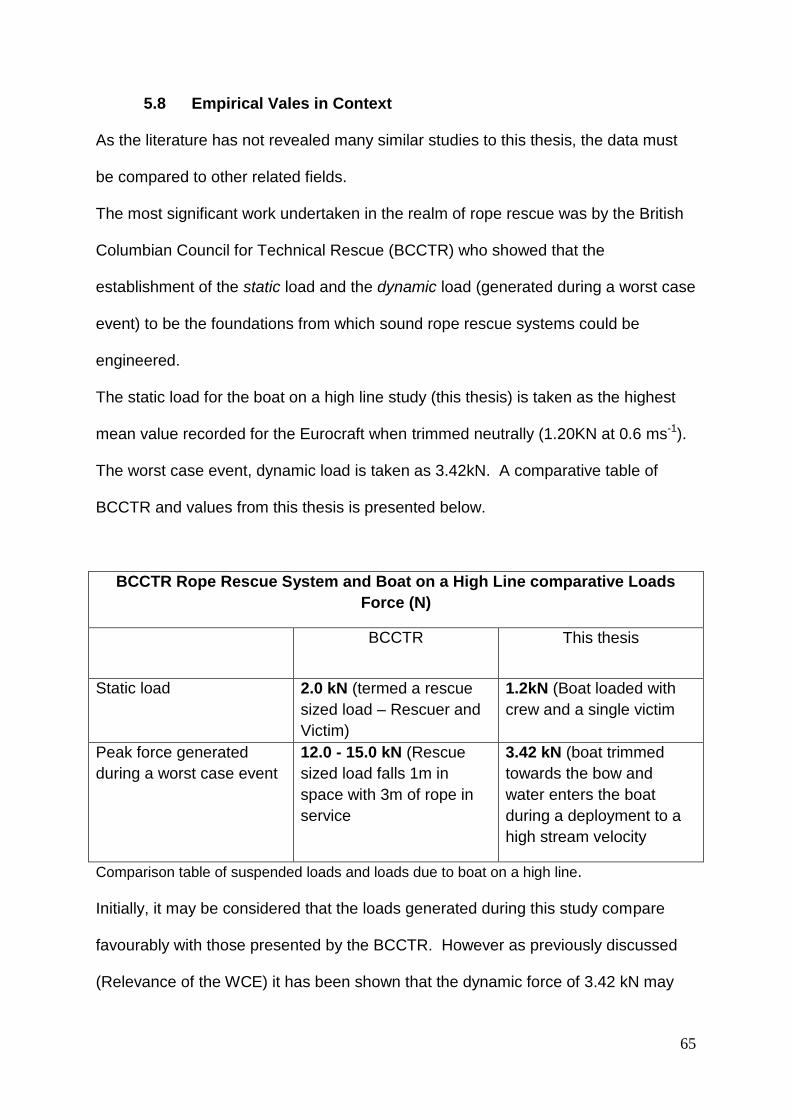
65
5.8 Empirical Vales in Context As the literature has not revealed many similar studies to this thesis, the data must
be compared to other related fields.
The most significant work undertaken in the realm of rope rescue was by the British
Columbian Council for Technical Rescue (BCCTR) who showed that the
establishment of the static load and the dynamic load (generated during a worst case
event) to be the foundations from which sound rope rescue systems could be
engineered.
The static load for the boat on a high line study (this thesis) is taken as the highest
mean value recorded for the Eurocraft when trimmed neutrally (1.20KN at 0.6 ms-1).
The worst case event, dynamic load is taken as 3.42kN. A comparative table of
BCCTR and values from this thesis is presented below.
BCCTR Rope Rescue System and Boat on a High Line comparative Loads
Force (N)
BCCTR This thesis
Static load 2.0 kN (termed a rescue
sized load – Rescuer and
Victim)
1.2kN (Boat loaded with
crew and a single victim
Peak force generated
during a worst case event
12.0 - 15.0 kN (Rescue
sized load falls 1m in
space with 3m of rope in
service
3.42 kN (boat trimmed
towards the bow and
water enters the boat
during a deployment to a
high stream velocity
Comparison table of suspended loads and loads due to boat on a high line.
Initially, it may be considered that the loads generated during this study compare
favourably with those presented by the BCCTR. However as previously discussed
(Relevance of the WCE) it has been shown that the dynamic force of 3.42 kN may

66
be magnified as a function of the high line vector angles. At 160º the theoretical
force multiplication of the worst case event impulse results in a force of circa 10kN, a
value approaching that of the BCCTR WCE (12 – 15 kN). To reduce the
manifestation of force multiplication, practitioners in the field should be mindful of
managing high line angles <120º. Further development work in this area should
include the formation of empirical operation rules suitable for managing boat on a
high line operation. Such development work is eluded to by Smith and Stephen
(2009) who state that ‘At higher river speeds, it may be possible to limit the tension
on the highline by increasing the deflection angle of the highline, or by reducing the
cross-sectional area of the objects in the water.’
67
6.0 CONCLUSIONS This thesis is concerned with the research question;
“What force (N) will a boat typically encounter when placed upon a high line and deployed in moving water during swift water rescue?” The answer to this question is more complex than a singular figure and is conditional
on the state of trim, stream velocity and the type of hull selected. Indeed for some
conditions the relationship may be quite complex as the experiment suggests that for
the least variation in resultant force, with respect to stream velocity, the boat should
be maintained in a neutral trim state. Even so, when trimmed neutrally, the Eurocraft
induced the largest force on the high line at the lowest incremental flow in the testing
programme (1220N or approximately 1.2 kN). It is postulated that the reduction in
force with respect to stream velocity could be explained by the hull demonstrating
planing behaviour but this must be considered as a line of enquiry to take in
subsequent research, rather than a definitive explanation of the phenomenon.
Should the craft be set up with an alternative trim arrangement, aft or bow, the
Eurocraft demonstrated an elevated force when compared to a neutrally trimmed
boat but only when stream velocity is greater than 2.5ms-1. Conversely at a velocity
less than 2.5ms-1 altering the trim from a neutral state produced a reduction in force.
The MFC Rescue Sled (small hull), induced a relatively small load on the highline
when compared with the Eurocraft at a similar stream velocity of 5.4 ms-1. A mean
force of 644N was recorded for the Rescue sled which is 57% of the force produced
by the Eurocraft at the same stream velocity with both craft neutrally trimmed. This
low force characteristic may be a very attractive to decision makers attending water

68
incidents who are concerned with reducing the load placed on systems. However,
the instability demonstrated by the Rescue Sled in such a stream velocity (5.4 ms-1)
should preclude its deployment within this particular context.
The proposed WCE generated a load of approximately 3.4kN as the Eurocraft
suddenly filled with water. The bow becoming ‘swamped’ by the water entering the
boat under circumstances of bow trim was identified as the cause of the escalation in
force. Another contributory factor which was proposed was that of a D ring anchor
failure, but this did not result in a shock load. Therefore practitioners should be very
mindful of un-intentional swamping of the boat as this is potentially the most
significant contributor to the WCE.
This experiment has suggested that the routine load to be expected by maintaining a
neutral trim state is in the order of 1.2kN and the greatest load expected (WCE) to be
3.4KN. A boat on a high line built to strength of 10 x the static load (as is often the
practice within rope rescue) so incorporating a 10:1 safety factor would result in a
system rated at approximately 12kN (10 x 1.2kN).
A system rated for 10x the static load would accommodate the WCE with a margin
for safety). Taking the WCE as 3.4 KN, the proposed build rating of 12kN
accommodates the WCE by a factor of approximately 3. However, force
multiplication due to a high line constructed with a mid-point angle greater than 120º
may exceed this safety factor, so practitioners should be mindful to manage the track
line angle (and hence tension) all times.
69
7.0 RECOMMENDATIONS
1. The methods and hypotheses presented in this thesis require review to
substantiate the empirical values.
2. The contributory factors leading to the WCE require scrutiny by
practitioners operating in this field.
3. A longer term study, building on the findings of this thesis including a
greater number of replicate determinations would enhance the statistical
reliability of the data.
4. A more comprehensive investigation of the application of planning hull
behaviours to describe boat behaviour is required.
5. Further evaluation of the contrasting effects of trim on the displacement
hull should be undertaken.
8.0 LIMITATIONS OF STUDY
It was not possible to record reliable traces of force against time for the MFC Rescue
Sled™ at stream velocity values of less than 5.42 ms-1. Observation of the
behaviour of the sled during low stream velocities showed that the sled appeared to
surf without providing any tension on the high line (and load call). Therefore no
force/time traces were captured for the sled at stream velocities <5.42 ms-1.
To address this limitation, a smaller more sensitive load cell with an operational
range of 0 – 1kN may record force values at lower stream velocities. This however

70
is not identified as a priority as the benefits of this knowledge to the rescue
community are negligible.
71
9.0 REFERENCES AASHTO, (2005). A Summary of Existing Research on Low-Head Dam Removal Projects. ICF Consulting. MA. Akan, A. O. (2006). Open Channel Hydraulics. Butterworth – Heinemann. Oxford.
Arcadis. (2010). Upgrading Weirs on the Thames. Arcadis UK ltd: http://www.arcadis-uk.com/Projects/Upgrading_Weirs_on_the_Thames.aspx Retrieved April 22, 2011. ASTM, (2011). Standard Test Method for Measuring the Performance of Synthetic Rope Rescue Belay Systems Using a Drop Test. F-2436 05. Bavaresco, P. (2012). Ropes and Friction Hitches Used in Tree Climbing Operations. Available from, http://www.paci.com.au/downloads_public/knots/14_Report_hitches_PBavaresco.pdf Accessed 27, September 2012. Berry, M. (2002). Reading White Water in Canoe and Kayak Handbook. Ferrero, F. (Ed). Pesda Press, Bangor. Bidone, G. (1818). Observations sur la hauteur du ressaut hydraulique en 1818. Royal Academy of Science. Turin.
Bills, M., Edwards, B., Gillespie, K., Gorman, J., Graham, D., Hogan, M., Jonason, C., Jones, P., Mclay, M., O’Sullivan, P., Rowlands, G., Segerstrom, J., Soderstrom, M., Turnbull, J. M., Turnbull, P. (2011). Swiftwater & Flood Rescue Technician. Rescue 3 International. CA. Brewer, T. (1993). Understanding Boat Design. International Marine.
British Standards Institute. (1998). Personal Protective Equipment for the Prevention of Falls from Height – Low Stretch Kernmantel. BSEN 1891:1998.
British Standards Institute. (2004). Personal Protective Equipment for the Prevention of Falls from Height – Connectors. BSEN 362:2004.
British Standards Institute. (2007). Mountaineering Equipment – Pulleys -Safety Requirements and Test Methods. BSEN 12278:2007.
Collins, L. and Collins, D. (2012). The Prince, Pauper and Pracademic in Adventure Sports Coach Education. In review. Chang, H. (1998). Fluvial Processes in River Engineering. Kreiger, Malbar. Davies, S. (2010). Work Begins on Dangerous Tryweryn River. Denbighshire Free Press

72
http://www.denbighshirefreepress.co.uk/news/94194/work-begins-on-dangerous-tryweryn-weir.aspx Accessed April 22, 2011. DEFRA. (2012). National Flood Rescue Enhancement Project, Concept of Operations. Available from, http://www.defra.gov.uk/publications/files/pb13676-frco.pdf Accessed, 27 September, 2012. Dill, J. (1990). Are you really on belay? Response Magzine. Edwards, B., Gillespie, K., Hogan, M., Sergestrom, J., Turnbull, P., & Turnbull, M. (2006). Swiftwater Technician Advanced. Wilton: Rescue 3 International inc. CA. Elverum, K., and Smalley, T. (2008). The Drowning Machine. Minnesota Department of Natural Resources. Ferrero, F. (2006). White Water Safety and Rescue. Bangor: Pesda Press. Fontaine, E. and Cointe, R. (1997). A slender body approach to nonlinear bow waves. Philosophical Transactions of the Royal Society. 355. 565 – 574. Forste, W. J., and Skrinde, R. (1950). Control of Hydraulic Jump by Sills. Transactions of the American Society of Civil Engineers, 115. Frank, J. A. (2010). CMC Rope Rescue Manual. CMC Rescue. Calafornia. French, R. (1986). Open Channel Hydraulics. New York: McGraw Hill Book Company. Gibbs, M. (2007) Rescue Belays: Important Considerations for Long Lowers. International Technical Rescue Symposium. November 2- 4. Colorado. Gierke, J. S. (2002). Engineering Applications in Earth Sciences: River Velocity. Available from. www.geo.mtu.edu/~raman/MiTEP-ESS-1/manning.doc. Accessed 28, September, 2012.
Gorman, J., Graham, D., Onions, C., O’Sullivan, P., Rollings, M., Sebregts, R. and Weedon, B. (2011). Technical Field Guide. Rescue 3 (Europe). Llangollen. Horst, R. (2010). Reducing the Risk of the Low Head Dam in Elgin, Illinois. Illinois. Elgin Fire Dept. Jones, D. Onions, C. and Read, A. (2012). The compatibility testing of 8mm Mammut cordage with Sterling High Tenacity Polyester 11mm rope for technical rope rescue operations. Journal of Search and Rescue. In review.
Kharns, B. (2008). Nylon and Polyester Prusik Testing. International Technical Rescue Symposium.

73
Leutheusser, J. and Birk, W. (1991). Drownproofing of Low Overflow Structures. Journal of Hydraulic Engineering , 117 (2), 205-213. Matt, B. (2002). Reading White Water. In F. Ferrero, Canoe and Kayak Handbook. Bangor. Pesda Press. Mauthner, K. (2002). Highlines. Rigging for Rescue Symposium. Invermere. BC. Mauthner, K. and Mauthner, K. (1996) The “What if” of Highline Failure: Is there a back-up if the track rope fails? North American Technical Rescue Symposium. November. NV. Mauthner, K. (2005). Maximising the Effectiveness of Rope Rescue Back-up Systems. http://www.ikar-cisa.org/ikar-cisa/documents/2007/2005-TC-03-Backup-Lines-Mauthner.pdf. Accessed 04/08/11. Miller, R., Gorski, L. Xing, T., Carrica, P. and Stern, F. (2006). Resistance Predictions of High Speed Mono and Multihull Ships with and without Water Jet Propulsors using URANS. Symposium on Naval Hydrodynamics. Rome. 17-22 September, 2006. Morris, G. and Fan, J. (1998). Reservoir Sedimentation Handbook. McGraw Hill. NY. NFPA, (2009). Standard on Operations and Training for Technical Search and Rescue Incidents. NFPA 1670. O’Conner, P. (1985). Practical Reliability Engineering. Heyden and Son. O' Sullivan, P. and Mckay, C. (2009). Weir Assessment System. http://www.rescue3.co.uk/pfd/EA-R3(UK)%20weir%20assessment%20system%20-%20ebook.pdf Retrieved April 22, 2011. O'Shea, M. (2006). Fluid Flow, Newton’s Second Law and River Rescue. Physics Education. 41 (2). O'Shea, M. (2007). Elasticity and Mechanical Advantage in cables and ropes. European Journal of Physics , 715-727. Onions, C. (2011). Prusik Compatibility Testing. Mountain Rescue Magazine, 36. 32-34. Onions, C. and Collins, L. (2012). A review of Quick-Release Harness Performance in Water Rescue. Journal of Emergency Services. in review. PMI, (2012). Slow Pull Prusik Test. International Technical Rescue Symposium. Video footage available from, http://itrsonline.org/Jessica/FieldReport/videos/2012/06/04/slow-pull-prusik-test/ Accessed 27, September 2012.
74
Ray, S. (1997). Swiftwater Rescue: A Manual for the Rescue Professional. Asheville: CFS Press. Rouse, H. And Simon, I. (1957). History of Hydraulics. Dover. NY. Savitsky, D. and Gore, J. L. (1980). Re-Evaluation of the Planning Hull Form. Journal of Hydronautics. 14:2. 34 – 47. Schubert, P. (1991). Modern Alpine Climbing: Equipment and Techniques. Cicerone. Milnthorpe. Shafroth, P. Friedman, J. Auble, G. Scott, M. and Braatne, J. (2002). Potential Responses to Riparian Vegetations to Dam Removal. Bioscience. 52. 703. Sholichin, M., & Akib, S. (2010). Development of drop number performance for estimate hydraulic jump on vertical and sloped drop structure. International Journal of the Physical Sciences , 5 (11), 1678-1687. Smith, G. and Stephen, A. (2009). Forces on a highline caused by river flow. International Technical Rescue Symposium. Presented at the International Technical Rescue Symposium. 6 – 8 November. Thomas, E. (2012). Water Session. Mountain Rescue Magazine. 41. Wenck, J. (2012). Binghamton New York Dam Drowning. Available from http://www.youtube.com/watch?v=mtR-mliLoP4&feature=relmfu Accessed 27 September 2012. Wright, K., Earles, A., and Kelly, J. (2004). Public Safety at Low Head Dams. Wright Waters Engineering inc.
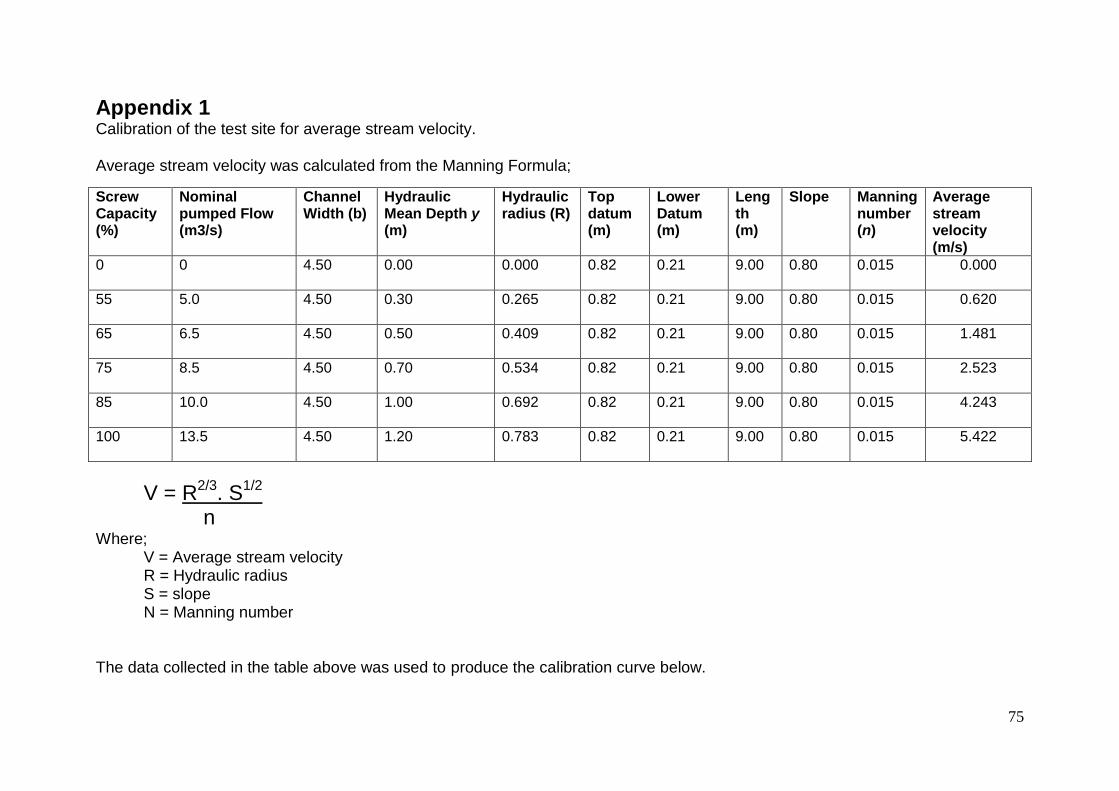
75
Appendix 1 Calibration of the test site for average stream velocity. Average stream velocity was calculated from the Manning Formula;
V = R2/3
. S1/2
n Where;
V = Average stream velocity R = Hydraulic radius S = slope N = Manning number The data collected in the table above was used to produce the calibration curve below.
Screw Capacity (%)
Nominal pumped Flow (m3/s)
Channel Width (b)
Hydraulic Mean Depth y (m)
Hydraulic radius (R)
Top datum (m)
Lower Datum (m)
Length (m)
Slope Manning number (n)
Average stream velocity (m/s)
0
0 4.50 0.00 0.000 0.82 0.21 9.00 0.80 0.015 0.000
55
5.0 4.50 0.30 0.265 0.82 0.21 9.00 0.80 0.015 0.620
65
6.5 4.50 0.50 0.409 0.82 0.21 9.00 0.80 0.015 1.481
75
8.5 4.50 0.70 0.534 0.82 0.21 9.00 0.80 0.015 2.523
85
10.0 4.50 1.00 0.692 0.82 0.21 9.00 0.80 0.015 4.243
100
13.5 4.50 1.20 0.783 0.82 0.21 9.00 0.80 0.015 5.422
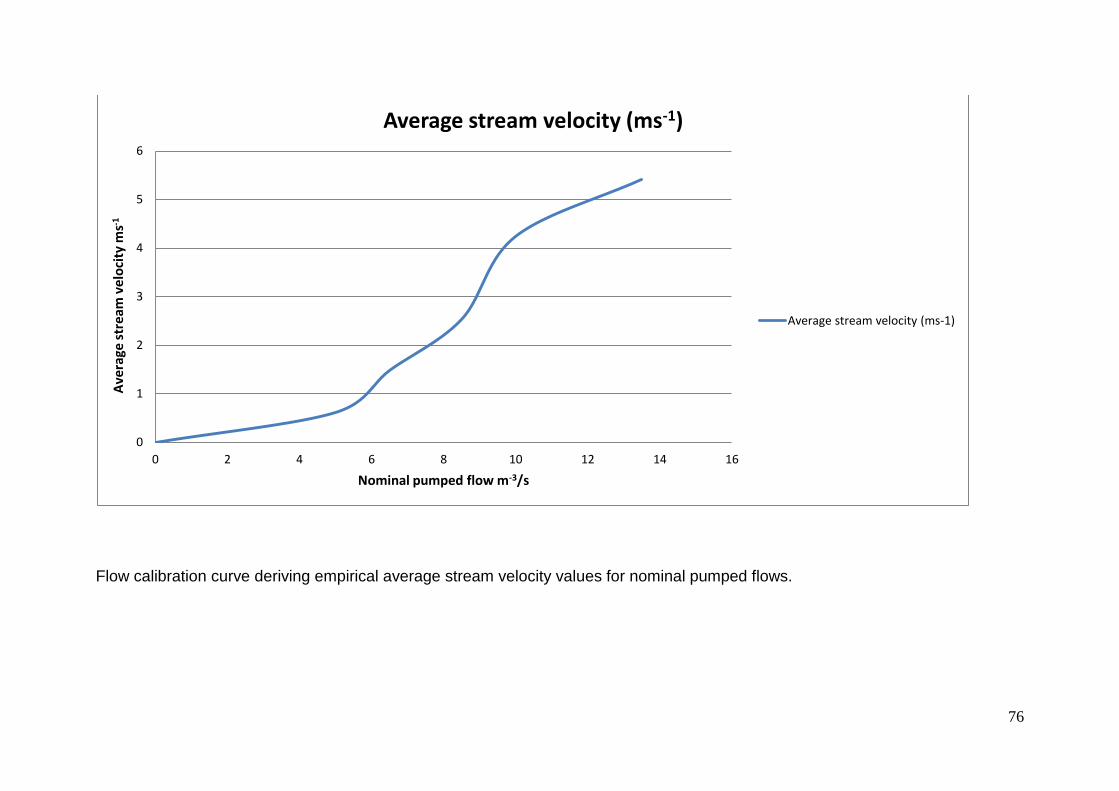
76
Flow calibration curve deriving empirical average stream velocity values for nominal pumped flows.
0
1
2
3
4
5
6
0 2 4 6 8 10 12 14 16
Ave
rage
str
eam
ve
loci
ty m
s-1
Nominal pumped flow m-3/s
Average stream velocity (ms-1)
Average stream velocity (ms-1)
77
Appendix 2
The following practitioners have been cited as ‘personal communication’. A short bio
of each commentator has been included to illustrate the importance and relevance of
their opinions.
Martin Bills
Martin serves with Nottinghamshire Fire and Rescue Service, taking the lead with
water rescue within his Brigade. Martin was seconded from the Fire and Rescue
Service to DEFRA, joining the National Flood Enhancement Project Team. Martin’s
expertise contributed greatly towards the Flood Rescue Concept of Operations – the
UK model for interagency attendance to flooding incidents.
Steve Glassey
Steve is the Editor in Chief of the Journal of Search and Rescue (JSAR) and an
associate lecturer in Technical Rescue Instruction with the School of Sport, Tourism
and the Outdoors, University of Central Lancashire. In New Zealand Steve is the
Deputy Director of the Centre for Risk Resilience and Renewal at the University of
Canterbury.
Alistair Read
At a strategic level, Alistair is the National Training Officer and Subject Matter
Advisor - Flooding for Mountain Rescue England and Wales (MREW). At a tactical
level, Alistair is team leader with the Ogwen Valley Mountain Rescue Organisation
(OVMRO) which has a considerable rope and water rescue capability.
Tim Rogers
Battalion Chief Tim Rogers has served with the Charlotte Fire Department, North
Carolina for 30 years. Tim founded and co-ordinates the NC Emergency
Management Aquatic Helicopter Rescue Programme (NC – HART) and the
swiftwater rescue boat operations programme. He has used his extensive
experience from deployments to hurricanes Frances, Ivan, Isabel and Katrina to
assist the UK Chief Fire Officer’s Association (CFOA) to enhance UK resilience
during flooding incidents.
78
Paul O’Sullivan
Paul O’Sullivan is the Managing Director of Rescue 3 (UK) Ltd. a rescue training
provider delivering classes both in the UK and internationally. Paul is a recipient of
the Higgins and Langley Memorial award for his significant contribution to developing
the UK Fire and Rescue Service capability at water related incidents.
Richard Taylor ‘Rich T’
Master Air Crewman Richard Taylor has served with Search and Rescue Force
(SARF), ‘C’ Flight 22, Squadron, RAF Valley. He is the recipient of the Queens
Gallantry Medal (QGM) in 1999 and Queen’s Commendation for Gallantry in the Air
(QCGA) in 2012, on both occasions for rescuing survivors from boats during high
sea states. Currently Rich is serving with ‘Operational Standards’.
Squadron Leader ‘Spike’ Wright
From 2008 until 2011 Squadron Leader Spike Wright served with the Search and
Rescue Force (SARF) 22 Squadron ‘C’ Flight based at RAF Valley as the Officer in
Commanding. Spike was consulted during this study for his UK perspective of
helicopter rescue operations, specifically the capability of a winch - equipped Sea
king airframe and the suitability for tasking to water related incidents.