Embed Size (px)
Citation preview
**FULL TITLE**ASP Conference Series, Vol. **VOLUME**, **YEAR OF PUBLICATION****NAMES OF EDITORS**
Highlights from Hinode
Eric R. Priest
Mathematics Institute, St Andrews University, ST ANDREWS, KY169SS, UK
Abstract. A personal summary is presented of the main results that havebeen presented at the conference. Particular emphasis is given to the new dis-coveries that have made use of the SOT, XRT and EIS instruments on boardHinode.
1. Introduction
In the past there have been huge advances from the Yohkoh, SoHO and TRACEsatellites, but what about the new baby, Hinode, born on September 23, 2007?My main reaction to this week has been: Wow! What a fantastic mission! Whatan exciting set of discoveries and what a high standard of talks! Certainly, twogreat workers for Hinode’s success (who have sadly passed away), Kosugi-sanand Tom Metcalf, would have been delighted to have heard the presentationsand would have agreed that Hinode is indeed producing the next great advancesin our subject.
We began this week with accounts of the impressive performance of theSolar Optical Telescope (SOT) by Ichimoto-san, of the X-ray Telescope (XRT)by Ed DeLuca and of the EUV Imaging Spectrometer (EIS) by Hara-san. Thenwe heard in turn a series of talks about each of them. So, what are the highlightsof what we have we learnt so far? I shall start by discussing a series of topicscovered by SOT, namely, magnetic fields, spicules, prominences and sunspots.Then, moving up to the corona, the topics on which XRT and EIS are makingsuch an impact are emerging flux, X-ray bright points and jets, coronal holes,solar flares, active regions, coronal heating and nonthermal motions.
2. Solar Optical Telescope Results
2.1. Photospheric Magnetic Field
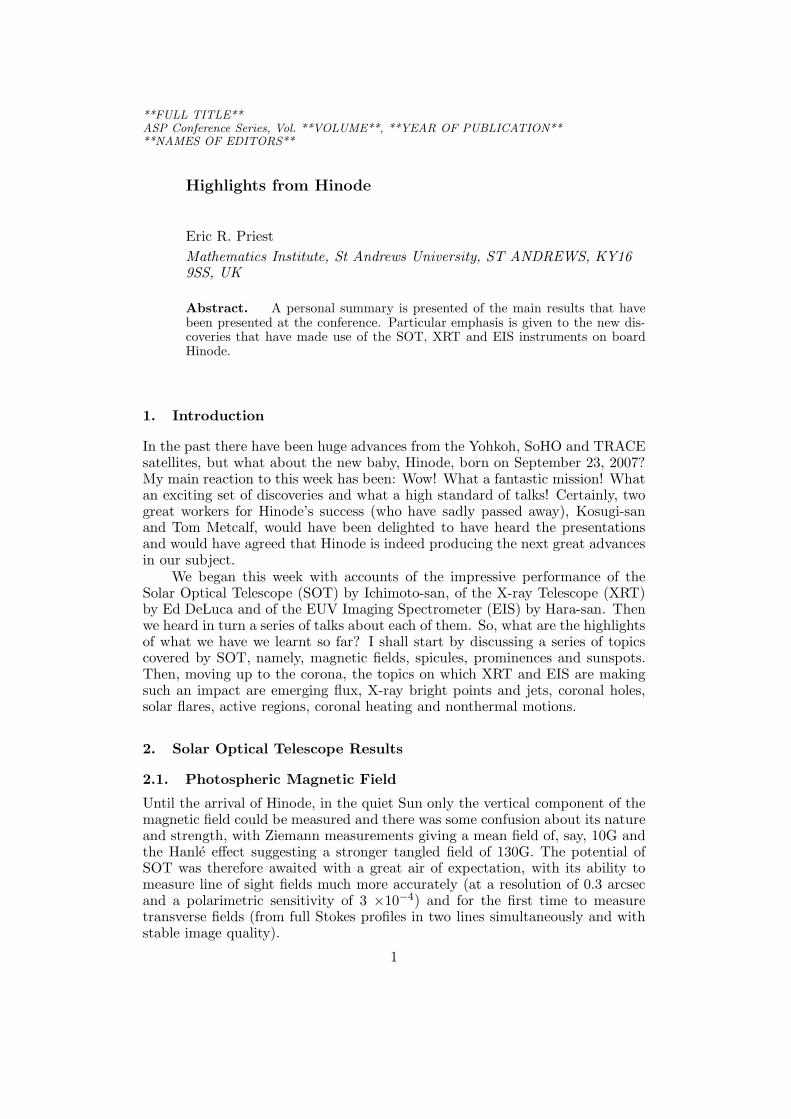
Until the arrival of Hinode, in the quiet Sun only the vertical component of themagnetic field could be measured and there was some confusion about its natureand strength, with Ziemann measurements giving a mean field of, say, 10G andthe Hanle effect suggesting a stronger tangled field of 130G. The potential ofSOT was therefore awaited with a great air of expectation, with its ability tomeasure line of sight fields much more accurately (at a resolution of 0.3 arcsecand a polarimetric sensitivity of 3 ×10⁻⁴) and for the first time to measuretransverse fields (from full Stokes profiles in two lines simultaneously and withstable image quality).
1
2 Priest
Figure 1. An example of the emergence of a transient horizontal field in agranule (Courtesy of R Ishikawa)
The first major discovery (Centeno et al. 2007), reviewed by Bruce Lites,was the presence of ubiquitous horizontal fields in the photosphere. He describedhow internetwork fields are organised on mesogranular scales. Furthermore,the horizontal apparent flux density is much larger than the vertical density,with values of 55 G and 11 G, respectively. This may be because of elongatedhorizontal structures. The vertical flux tends to be located in intergranularlanes, while the horizontal flux lies at the outer edges of bright granules.
Furthermore, Ishikawa-san showed that such small-scale transient horizontalfields also occur in plage regions (Figure 1). She studied 51 events in a plage over40 mins and 45 events in the quiet Sun over 60 mins and found the occurrencerate to be twice as large in the plage. The field strength was the same and wasdistributed around the equipartition value of 400 G. She deduced that 10% ofthe granules have horizontal field at any one time and discovered that it has arandom direction in the quiet Sun but a preferred direction in plages.
Tsuneta-san discussed the magnetic landscape of the polar regions andshowed that it consists of a few 10’s of kG trumpet-like vertical flux tubes(at which the fast solar wind may be accelerated) together with ubiquitoushorizontal fields. Next Ted Tarbell described the progress in constructing chro-mospheric magnetograms and showed examples of intermittent upflows in can-cellation events, presumably driven by reconnection.
Clare Parnell showed observations of quiet-Sun magnetic elements down to1016Mx, an improvement of a factor of 30 over MDI and revealing 50% more flux.She discovered surprisingly that the histogram of fluxes forms a power law ratherthan the exponential that had been thought before (Figure 2). Furthermore, sheshowed examples with SOT of apparent unipolar appearances, which imply thatthe smallest fragments are not yet resolved.
2.2. Spicules and Sunspots
A major surprise at the meeting was the stunning observations of spicules in CaII H with SOT presented by Suematsu-san and Viggo Hansteen. Suematsu-sanfound that tall spicules tend to brighten and then expand as they ascend andmove laterally or spin, before finally descending. Most spicules form double

Highlights from Hinode 3
Figure 2. (a) An example of a line of sight magnetogram from SOT over anarea of 140 × 160 arcsec. (b) a histogram of the fluxes determined by threedifferent methods. (Courtesy of CE Parnell)
threads and may represent the untangling of twisted tubes or of neighbouringfields as they reconnect.
Viggo Hansteen described spicules in movies as looking like swaying straw.He found lateral oscillations by 0.5 Mm with velocities of 10-25 km s−1. Theyare short-lived (10-100 sec) and thin (200 km) and their swaying is likely to bedue to Alfven waves with periods of 150-400 km s−1 that are longer than theirlifetimes, and possibly generated by reconnection. The chromospheric flux is 4× 10⁶ but it is unclear how much of this can escape to the corona to perhapsdrive the solar wind.
SOT has also produced intriguing images of sunspots. The most novel workhere was by Kubo-san on moving magnetic features, in which he showed thatgranular convection seems to detach small flux tubes from a spot.
Figure 3. Examples of spicules (Courtesy of: (left) Y Suematsu; and (right)V Hansteen and M Carlsson)
4 Priest
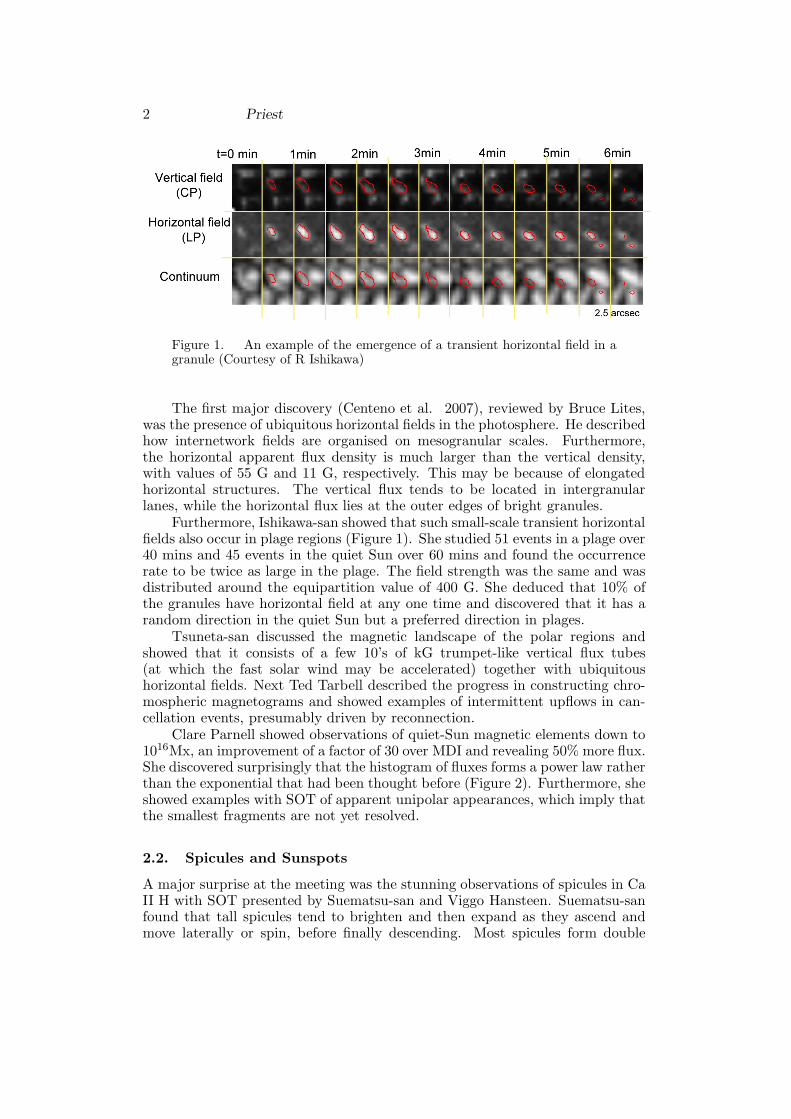
Figure 4. The change in the structure of an active region from (left) beforea flare to (right) after the flare (Courtesy of L Golub and Yingna Su)
3. XRT and EIS
3.1. X-ray Bright Points and Jets
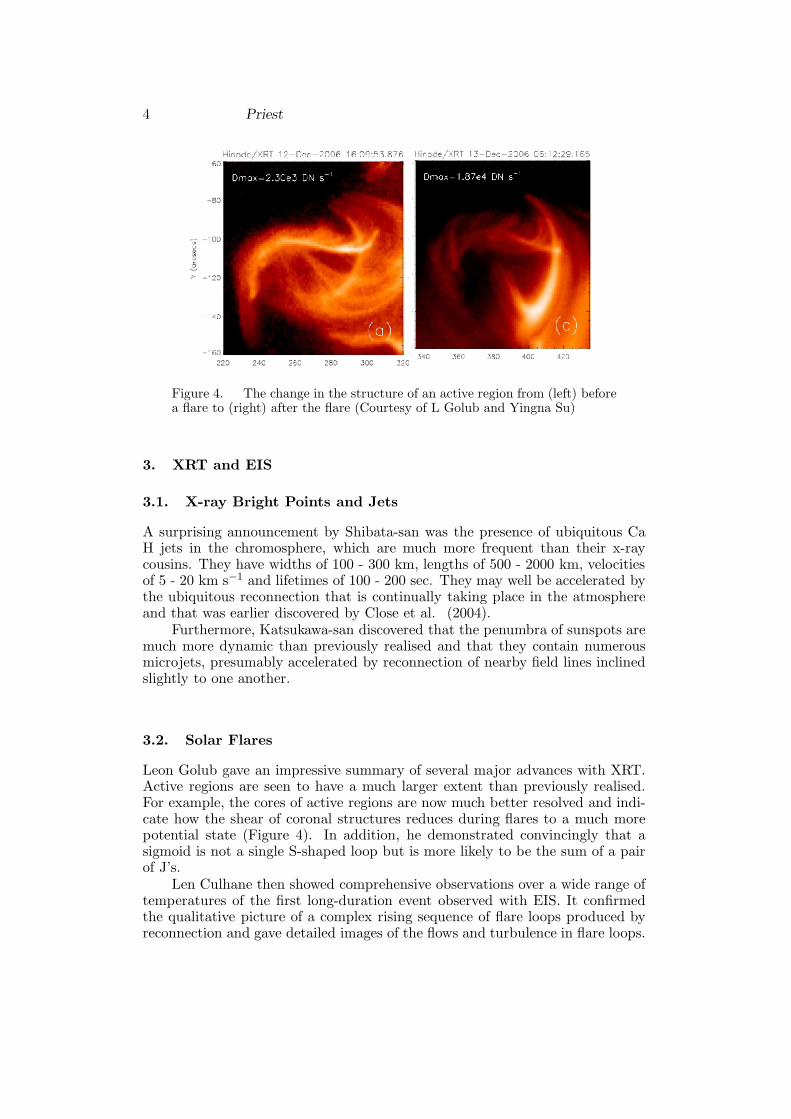
A surprising announcement by Shibata-san was the presence of ubiquitous CaH jets in the chromosphere, which are much more frequent than their x-raycousins. They have widths of 100 - 300 km, lengths of 500 - 2000 km, velocitiesof 5 - 20 km s−1 and lifetimes of 100 - 200 sec. They may well be accelerated bythe ubiquitous reconnection that is continually taking place in the atmosphereand that was earlier discovered by Close et al. (2004).
Furthermore, Katsukawa-san discovered that the penumbra of sunspots aremuch more dynamic than previously realised and that they contain numerousmicrojets, presumably accelerated by reconnection of nearby field lines inclinedslightly to one another.
3.2. Solar Flares
Leon Golub gave an impressive summary of several major advances with XRT.Active regions are seen to have a much larger extent than previously realised.For example, the cores of active regions are now much better resolved and indi-cate how the shear of coronal structures reduces during flares to a much morepotential state (Figure 4). In addition, he demonstrated convincingly that asigmoid is not a single S-shaped loop but is more likely to be the sum of a pairof J’s.
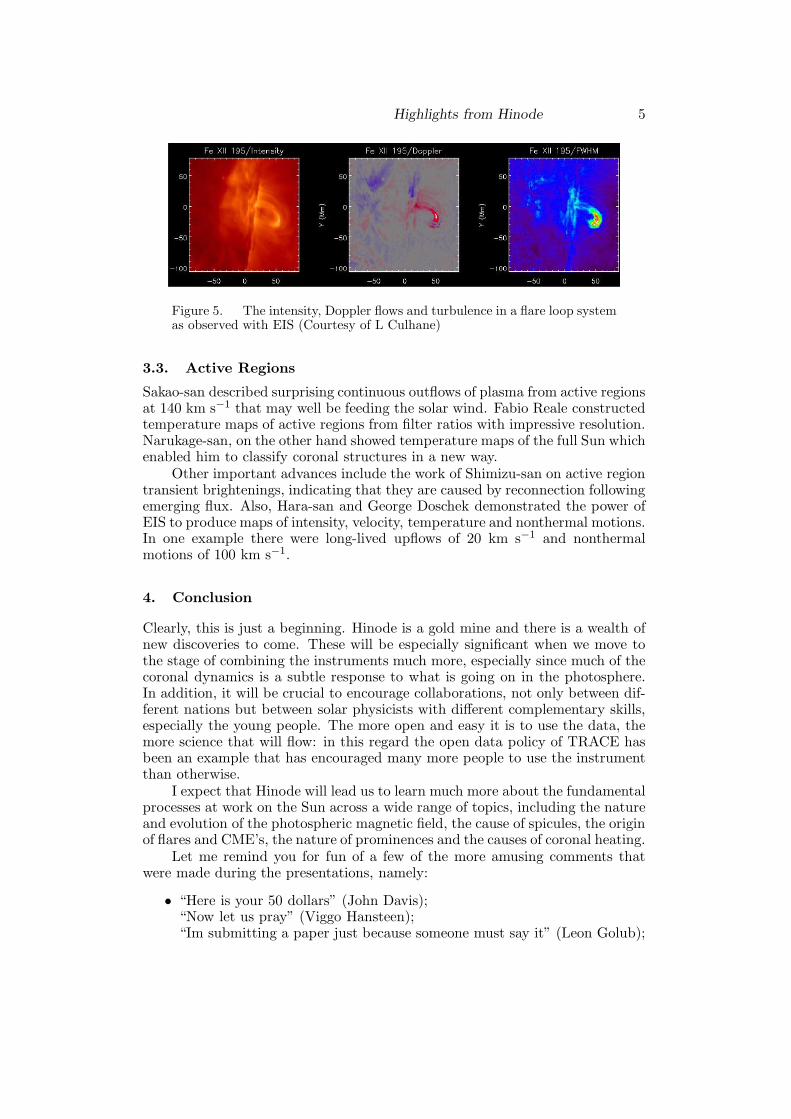
Len Culhane then showed comprehensive observations over a wide range oftemperatures of the first long-duration event observed with EIS. It confirmedthe qualitative picture of a complex rising sequence of flare loops produced byreconnection and gave detailed images of the flows and turbulence in flare loops.
Highlights from Hinode 5
Figure 5. The intensity, Doppler flows and turbulence in a flare loop systemas observed with EIS (Courtesy of L Culhane)
3.3. Active Regions
Sakao-san described surprising continuous outflows of plasma from active regionsat 140 km s−1 that may well be feeding the solar wind. Fabio Reale constructedtemperature maps of active regions from filter ratios with impressive resolution.Narukage-san, on the other hand showed temperature maps of the full Sun whichenabled him to classify coronal structures in a new way.
Other important advances include the work of Shimizu-san on active regiontransient brightenings, indicating that they are caused by reconnection followingemerging flux. Also, Hara-san and George Doschek demonstrated the power ofEIS to produce maps of intensity, velocity, temperature and nonthermal motions.In one example there were long-lived upflows of 20 km s−1 and nonthermalmotions of 100 km s−1.
4. Conclusion
Clearly, this is just a beginning. Hinode is a gold mine and there is a wealth ofnew discoveries to come. These will be especially significant when we move tothe stage of combining the instruments much more, especially since much of thecoronal dynamics is a subtle response to what is going on in the photosphere.In addition, it will be crucial to encourage collaborations, not only between dif-ferent nations but between solar physicists with different complementary skills,especially the young people. The more open and easy it is to use the data, themore science that will flow: in this regard the open data policy of TRACE hasbeen an example that has encouraged many more people to use the instrumentthan otherwise.
I expect that Hinode will lead us to learn much more about the fundamentalprocesses at work on the Sun across a wide range of topics, including the natureand evolution of the photospheric magnetic field, the cause of spicules, the originof flares and CME’s, the nature of prominences and the causes of coronal heating.
Let me remind you for fun of a few of the more amusing comments thatwere made during the presentations, namely:
• “Here is your 50 dollars” (John Davis);“Now let us pray” (Viggo Hansteen);“Im submitting a paper just because someone must say it” (Leon Golub);
6 Priest
Figure 6. King Peter and his leprechaun helpers
“To paraphrase Bill Clinton, it depends on your definition of cross” (EdDeLuca);“Hinode has had two eclipses since lunch” (Kano-san);“It will be a random walk to the Guinness Works” (Peter Gallacher);“I started this work with Dave Alexander in 1959” (Allen Gary);“I know that you are looking at my slide but really thinking of Guinness”(Robert Walsh);“Here are the conclusions, but I cannot understand them” (Shomojo-san);“Good morning, good afternoon – I dont know where I am just now”(David Williams);“I am at the bottom of the sexiness ladder in astrophysics” (Giulio delZanna).
Finally, many congratulations to all those who have laboured for manyyears to bring Hinode to life, including the project managers (Nakatani-sanand Barbara Cobb), the project scientists (John Davis, Shibata-san, Sakurai-san and David Williams) and the principal investigators (on SOT Tsuneta-san,Ichimoto-san, Suematsu-san, Ted Tarbell and Alan Title; on XRT Ed DeLuca,Leon Golub and Shibasaki-san; and on EIS Louise Harra, Watanabe-san andGeorge Doschek), as well as their many colleagues.
And, since this is Ireland, a final final comment is to thank Peter Gallacherand his wee leprechauns (Gerry, Louise, Paul and Claire) for looking after us sothoughtfully and making this such an enjoyable and memorable week.
Acknowledgments. I acknowledge support from the UK Science and Tech-nology Facilities Council and the EU Network Solaire (MTRN-CT-035484).
References
Centeno, R., Socas-Navarro, B., Lites, B., & Kubo, M. 2007, Astrophys. J., 666, L137.Close, R.M., Parnell, C.E., Longcope, D.W., & Priest, E.R. 2004, Astrophys. J. 612,
L81.