Embed Size (px)
Citation preview

Highlights

Oct-0
9
Oct-0
9
Oct-0
9
Nov-0
9
Nov-0
9
Dec-0
9
Dec-0
9
Jan-
10
Jan-
10
Feb-
10
Feb-
10
Mar
-10
Mar
-10
Apr-1
0
Apr-1
0
Apr-1
0
May
-10
May
-10
Jun-
10
Jun-
10
Jul-1
00
200
400
600
800
1,000
1,200
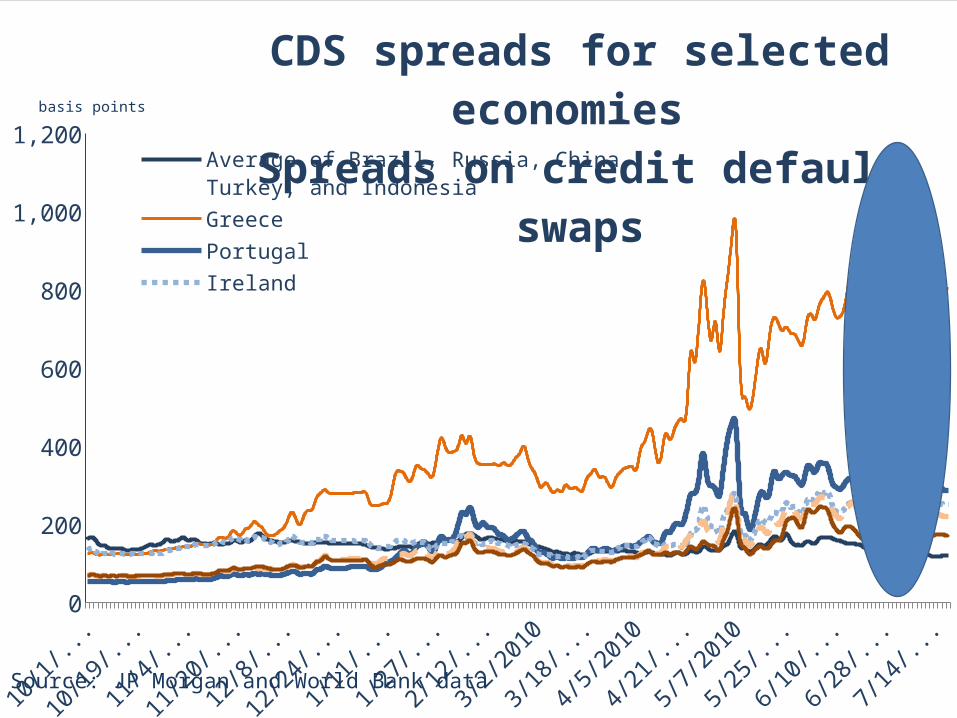
CDS spreads for selected economies
Spreads on credit default swaps
Average of Brazil, Russia, China, Turkey, and IndonesiaGreece Portugal Ireland Spain
Source: JP Morgan and World Bank data
basis points

Developing-country production growth easing
industrial production, ch% (3mma, saar)
Jan-08 May-08 Sep-08 Jan-09 May-09 Sep-09 Jan-10 May-10-35
-25
-15
-5
5
15
25
High-income OECD
Developing ex China
Source: DECPG.
World
Developing countries

OECD developments

WEO Update lowers growth outlook
for Europe in 20112009 2010 2011 Difference from April WEO
2010 2011
World GDP -0.6 4.6 4.3 0.4 0.0
Advanced Econ -3.2 2.6 2.4 0.3 0.0
Euro Area -4.1 1.0 1.3 0.0 -0.2
Germany -4.9 1.4 1.6 0.2 -0.1
Spain -3.6 -0.4 0.6 0.0 -0.3
Japan -5.2 2.4 1.8 0.5 -0.2
United States -2.4 3.3 2.9 0.2 0.3
Source: IMF, WEO Update, July 8, 2010.
G-20 agrees to the principle of
“growth friendly” fiscal consolidation
2007 2008 2009 2010F 2011F-12
-10
-8
-6
-4
-2
0
OECD FiscalU.S. FiscalEuro Area FiscalJapan Fiscal
2007 2008 2009 2010F 2011F0
50
100
150
200
250
OECD Debt U.S. DebtEuro Area Debt Japan Debt
Fiscal balances, %GDP Public sector financial liabilities, %GDP
Source: DECPG staff estimates.
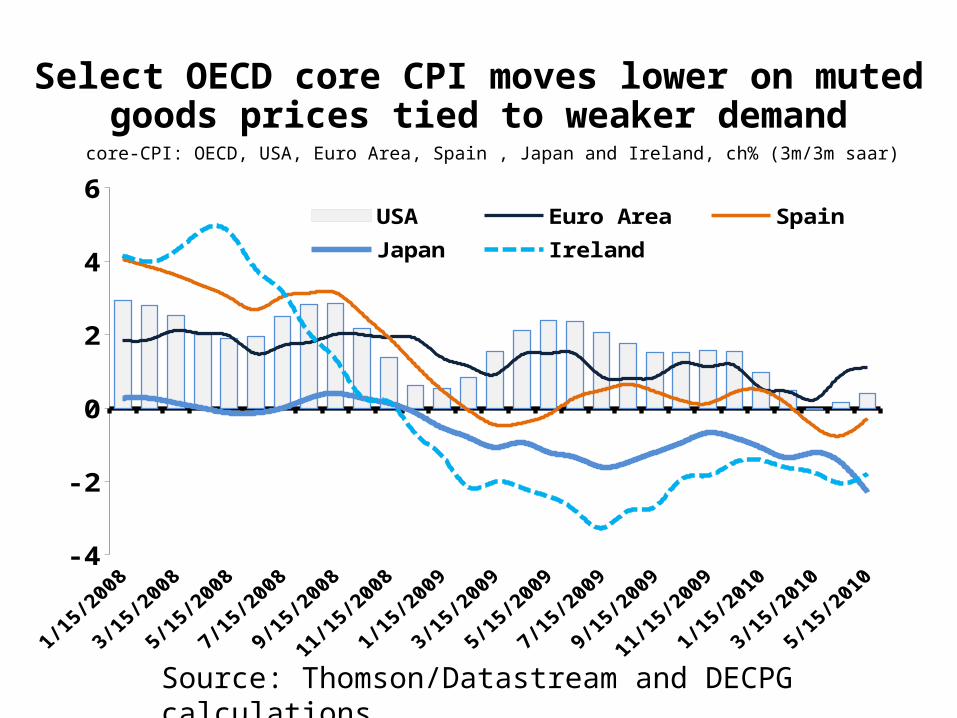
Select OECD core CPI moves lower on mutedgoods prices tied to weaker demand core-CPI: OECD, USA, Euro Area, Spain , Japan and Ireland, ch% (3m/3m saar)
Jan-08 May-08 Sep-08 Jan-09 May-09 Sep-09 Jan-10 May-10-4
-2
0
2
4
6USA Euro Area Spain
Japan Ireland
Source: Thomson/Datastream and DECPG calculations

Progress in reducing U.S. layoffs stallsadding downward pressure on retail sales
Jan-08 Jun-08 Nov-08 Apr-09 Sep-09 Feb-10 Jul-10300
350
400
450
500
550
600
650
-18
-12
-6
0
6
12
retail sales (x-autos) volume [R]
unemployment claims [L]
unemployment claims, 4-wk average ‘000 [L] ; retail sales (x-auto) volume, ch% saar [R]
Source: U.S. Departments of Commerce and Labor.

U.S. investment to pick-up in second quarter with orders, exports and output
highercapacity utilization (%) [L], growth of orders, production and export volumes (saar) [R]
Jan-08 May-08 Sep-08 Jan-09 May-09 Sep-09 Jan-10 May-1067.5
70.0
72.5
75.0
77.5
80.0
82.5
-50
-35
-20
-5
10
25
40
cap-goods orders [R]
capacity util [L]
Source: U.S. Department of Commerce.
production [L]
exports [R]

U.S. bank lending continues declinehitting business without access to bond
markets
Jan-08 Jun-08 Nov-08 Apr-09 Sep-09 Feb-10 Jul-101,200
1,300
1,400
1,500
1,600
1,700
-25
-20
-15
-10
-5
0
5
10
percentage change (y/y) [R]
Source: Federal Reserve of St. Louis.
C&I loans [L]
Commercial & industrial loans ($billions) [L] ; percentage change (y/y) [R]

German exports surge on weaker euro and foreign demand for capital goodsexport orders, export volumes and manufacturing output, ch% (saar)
Jan-08 May-08 Sep-08 Jan-09 May-09 Sep-09 Jan-10 May-10-70
-55
-40
-25
-10
5
20
35
50
65
Source: Eurostat.
exports
manufacturing output
export orders

Euro Zone household spending continues in the doldrums
retail sales volumes: Euro Area, Germany, France (mfg gds), Italy, ch% (y/y)
Jan-08 May-08 Sep-08 Jan-09 May-09 Sep-09 Jan-10 May-10-4.5
-3.0
-1.5
0.0
1.5
3.0
4.5
Source: Eurostat.
Germany
France
Euro Area
Italy

Japan sees sobering slump in machinery orders, exports and manufacturing output
machinery orders, export volumes and manufacturing output, ch% (saar)
Jan-08 May-08 Sep-08 Jan-09 May-09 Sep-09 Jan-10 May-10-75
-60
-45
-30
-15
0
15
30
45
60
Source: Japan Cabinet Office.
exportsmanufacturing
output
machinery orders

Industrial production

-5-3-113579
111315
High-income, ex-cl.USA
Global, excl. USA
Developing coun-tries
Growth in retail sales eases on weak labor markets in high-
income countriesRetail sales proxy, ch% (y/y)
Sources: Thomson Datastream and DEC Prospects Group

Recovery continues through April / May but may
be slowing
Jan-05 Jan-06 Jan-07 Jan-08 Jan-09 Jan-1050
60
70
80
90
100
110
120
130
ChinaOther developing
Industrial production, index August 2008=100
Sources: Thomson Datastream and DEC Prospects Group
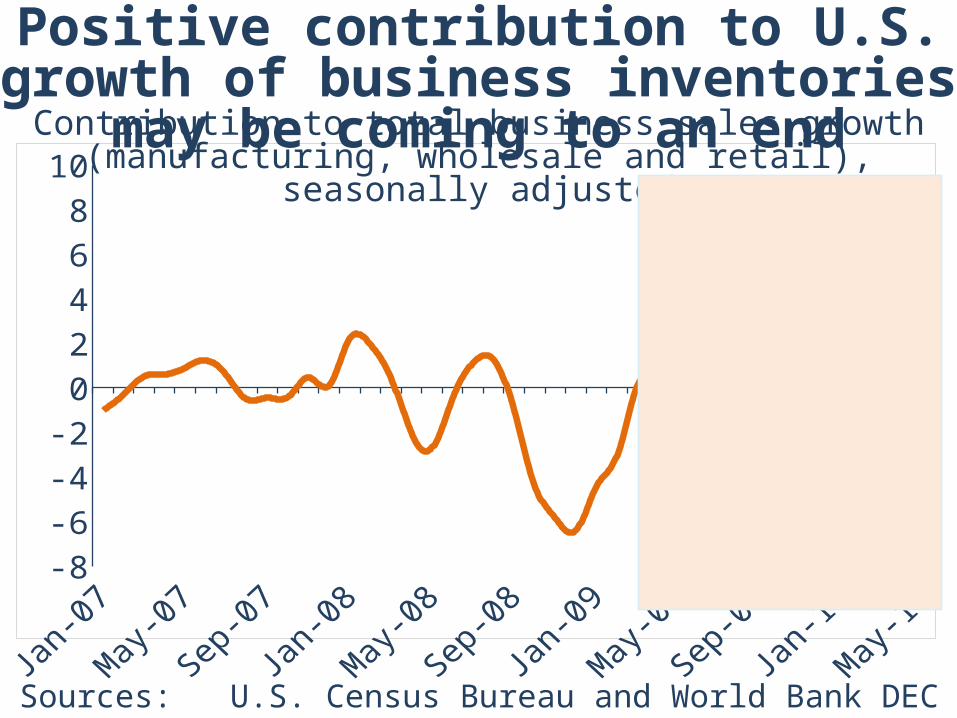
-8-6-4-202468
10
Sources: U.S. Census Bureau and World Bank DEC Prospects Group
Positive contribution to U.S. growth of business inventories
may be coming to an endContribution to total business sales growth (manufacturing, wholesale and retail), seasonally
adjusted

International Trade

Jan-07May-07
Sep-07Jan-08
May-08Sep-08
Jan-09May-09
Sep-09Jan-10
May-1055
60
65
70
75
80
85
90
95
100
105
110
115
120
Export volumes losing momentum across devel-
oping regions
East Asia & Pacific
Europe & Central Asia
Latin America & the Caribbean
Middle East & North Africa
South Asia
Sub-Saharan Africa
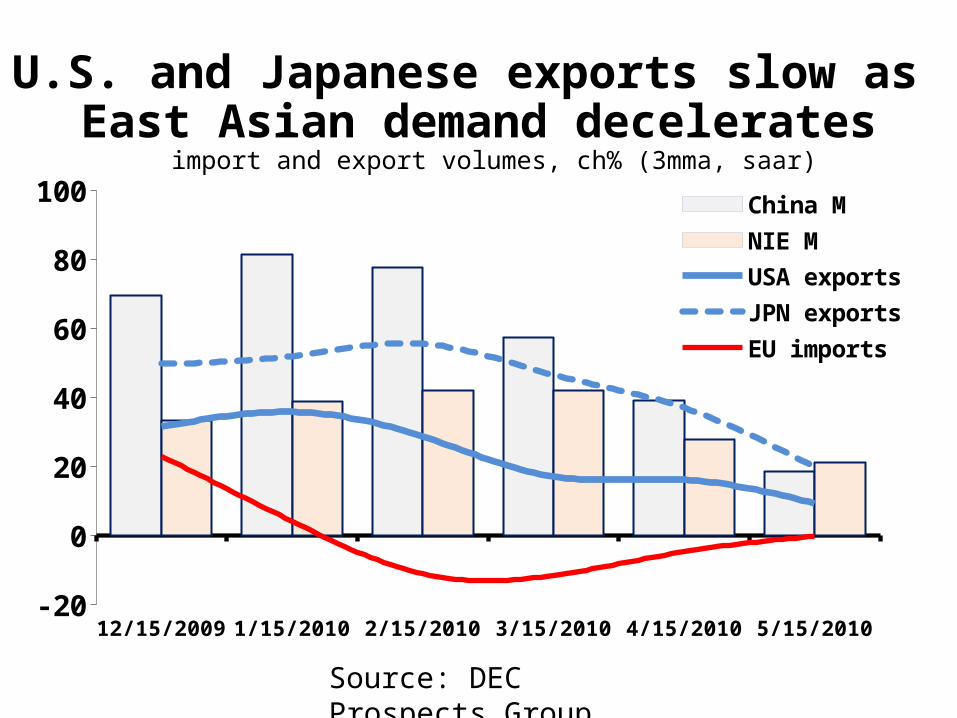
U.S. and Japanese exports slow as East Asian demand decelerates
import and export volumes, ch% (3mma, saar)
Dec-09 Jan-10 Feb-10 Mar-10 Apr-10 May-10-20
0
20
40
60
80
100 China M
NIE M
USA exports
JPN exports
EU imports
Source: DEC Prospects Group.

Source: WTO.

Commodity Prices

0
20
40
60
80
100
120
140
2100
2200
2300
2400
2500
2600
2700
2800
2900
Oil price and OECD stocks$/bbl million bbl
Price Stocks
1Q00
2Q00
3Q00
4Q00
1Q01
2Q01
3Q01
4Q01
1Q02
2Q02
3Q02
4Q02
1Q03
2Q03
3Q03
4Q03
1Q04
2Q04
3Q04
4Q04
1Q05
2Q05
3Q05
4Q05
1Q06
2Q06
3Q06
4Q06
1Q07
2Q07
3Q07
4Q07
1Q08
2Q08
3Q08
4Q08
1Q09
2Q09
3Q09
4Q09
1Q10
2Q10
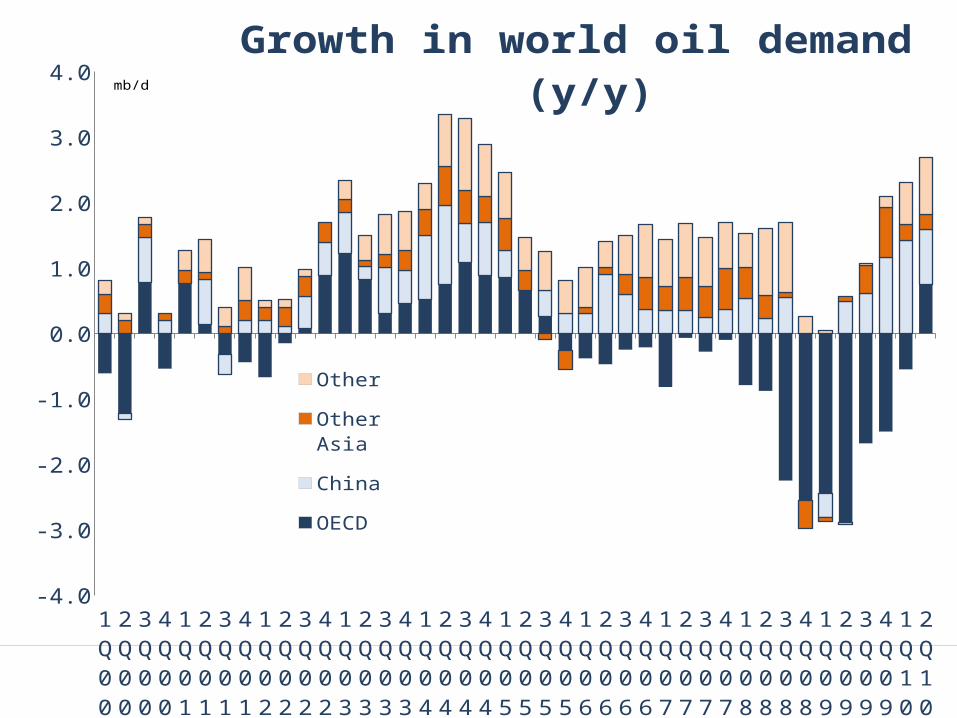
-4.0
-3.0
-2.0
-1.0
0.0
1.0
2.0
3.0
4.0
Growth in world oil demand (y/y)
Other
Other Asia
China
OECD
mb/d

0.0
1.0
2.0
3.0
4.0
5.0
6.0
7.0
8.0
9.0 OPEC spare capacitymb/d

Non-Commodity Prices
0
50
100
150
200
250
300
350
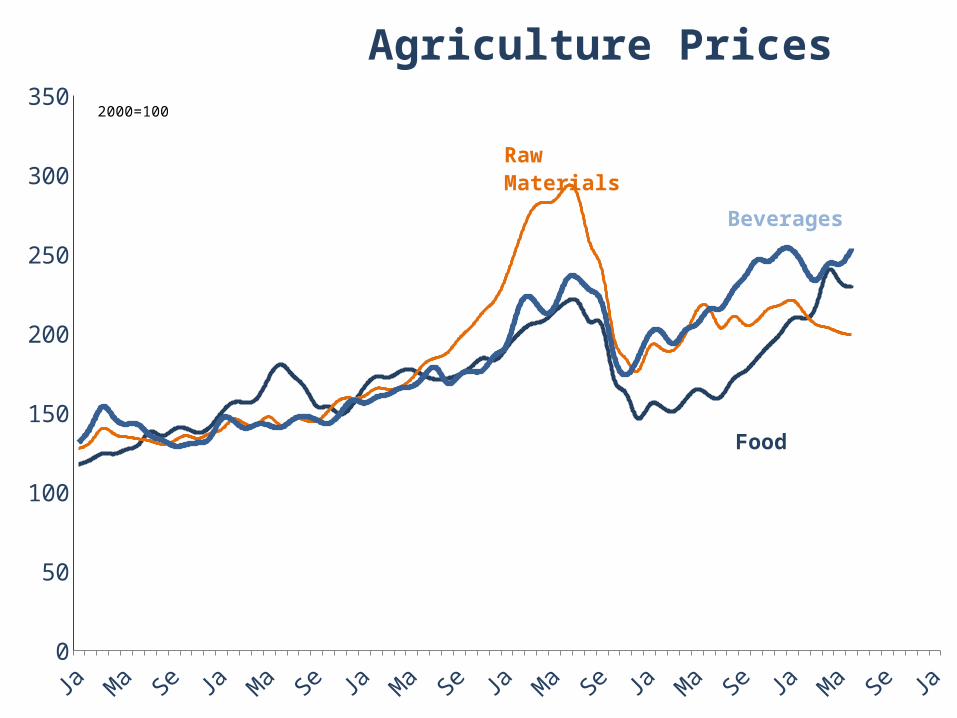
Agriculture Prices
Food
Raw Materials
Beverages
2000=100

0
10,000
20,000
30,000
40,000
50,000
60,000
0
20
40
60
80
100
120
140
160
180
Nickel price and LME stocks$/ton '000 tons
Price Stocks
Jan-
05
Apr-0
5
Jul-0
5
Oct-0
5
Jan-
06
May
-06
Aug-
06
Nov-0
6
Feb-
07
Jun-
07
Sep-
07
Dec-0
7
Mar
-08
Jun-
08
Oct-0
8
Jan-
09
Apr-0
9
Jul-0
9
Nov-0
9
Feb-
10
May
-10
0
2,000
4,000
6,000
8,000
10,000
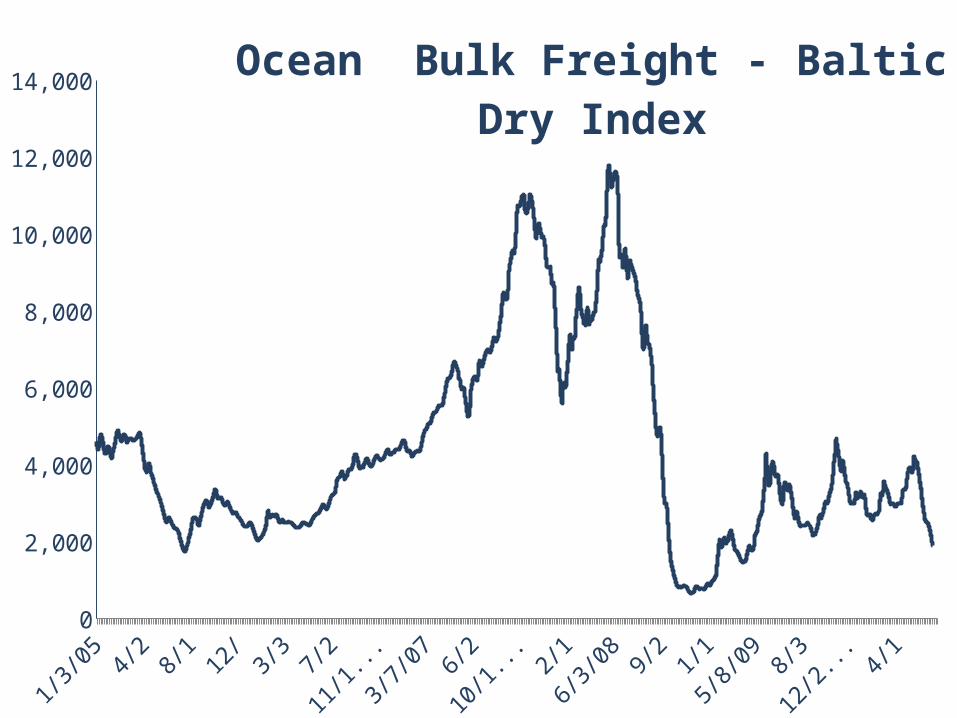
12,000
14,000Ocean Bulk Freight - Baltic
Dry Index

International Finance

Subdued June recovery in cross-border debt flows
$ billion 2008 2009 2010
H1Tota
l H1Tota
l H1 Apr May Jun
Total 180 305 77 253 154 39 12 17
Bonds 51 62 35 124 91 29 3 7
Banks 129 243 42 129 63 11 9 9
Lat. America 38 63 31 109 49 15 1 7
E. Europe 84 145 21 65 48 12 4 5
Asia 27 47 14 45 37 8 4 3
Others 32 51 12 34 21 4 4 1

2008 Q1
2008 Q2
2008 Q3
2008 Q4
2009 Q1
2009 Q2
2009 Q3
2009 Q4
2010 Q1
2010 Q2
0
10
20
30
40
50
60
EM corporates increasingly re-lied on international bond
markets in 2010Corporate (Private and Public)
Sovereign
$ billion

Mar.2006
Jun.2006
Sep.2006
Dec.2006
Mar.2007
Jun.2007
Sep.2007
Dec.2007
Mar.2008
Jun.2008
Sep.2008
Dec.2008
Mar.2009
Jun.2009
Sep.2009
Dec.2009
0
500
1,000
1,500
2,000
2,500
3,000
3,500
International banks' claims in developing countries rose in
2009Local currency claims International claims

Foreign exchange / Inflation
Jan-10 Feb-10 Mar-10 Apr-10 May-10 Jun-10 Jul-101.180
1.220
1.260
1.300
1.340
1.380
1.420
1.46086.25
87.50
88.75
90.00
91.25
92.50
93.75
95.00
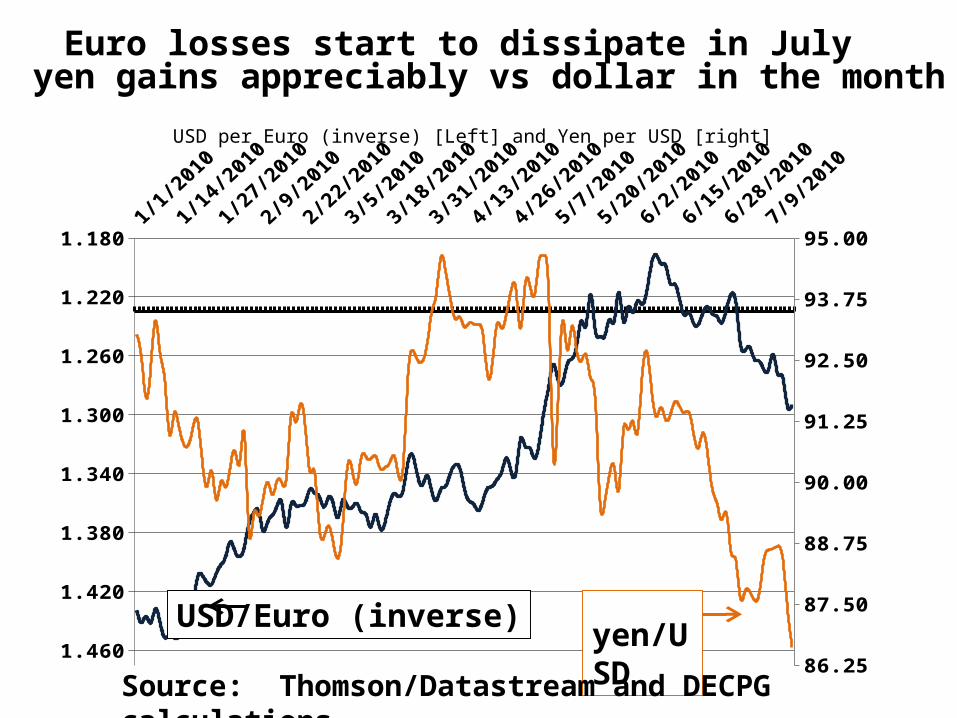
yen/USD
USD/Euro (inverse)
Euro losses start to dissipate in July yen gains appreciably vs dollar in the month
USD per Euro (inverse) [Left] and Yen per USD [right]
Source: Thomson/Datastream and DECPG calculations.

End of dollar-fix for Chinese RMB
yields modest gains vs U.S. unit
3/1/2
010
3/13/2
010
3/25/2
010
4/6/2
010
4/18/2
010
4/30/2
010
5/12/2
010
5/24/2
010
6/5/2
010
6/17/2
010
6/29/2
010
7/11/2
01097.5
100.0
102.5
105.0
107.5
110.0
112.5
115.0
US dollar Euro Yen
3/1/2010
4/1/2010
5/1/2010
6/1/2010
7/1/20100.1460
0.1465
0.1470
0.1475
0.1480
USD per RMB
Index, RMB cross-rates, March 1, 2010=100 USD per RMB, daily: March 1 to July 16
Source: Thomson/Datastream and DECPG calculations.
LCU per RMB

Net U.S. capital flows show dramatic
“flight to quality” in the 6 months to March
Q1-2009 Q2-2009 Q3-2009 Q4-2009 Q1-2010-300-200-100
0100200300400500600700
Net FDI + Equity U.S. TreasuriesNet Other Flows Financing requirement
Source: Department of Commerce.
net annualized flows in billions U.S. dollars

FOCUS

Jan-
10
Jan-
10
Jan-
10
Feb-
10
Feb-
10
Feb-
10
Mar
-10
Mar
-10
Mar
-10
Apr-1
0
Apr-1
0
May
-10
May
-10
May
-10
Jun-
10
Jun-
10
Jun-
10
Jul-1
0
Jul-1
00.50
0.55
0.60
0.65
0.70
0.75
0.80
0.85
0.90
0.15
0.2
0.25
0.3
0.35
0.4
0.45
0.5
Euro Interbank Offer rates continued to rise, while Eu-
ribor/Eonia spread eased slightly
3-month Euribor (left axis)
percent percent
Source: Bloomberg
Euribor/Eonia spread (right axis)
0
50,000
100,000
150,000
200,000
250,000
300,000
350,000
400,000
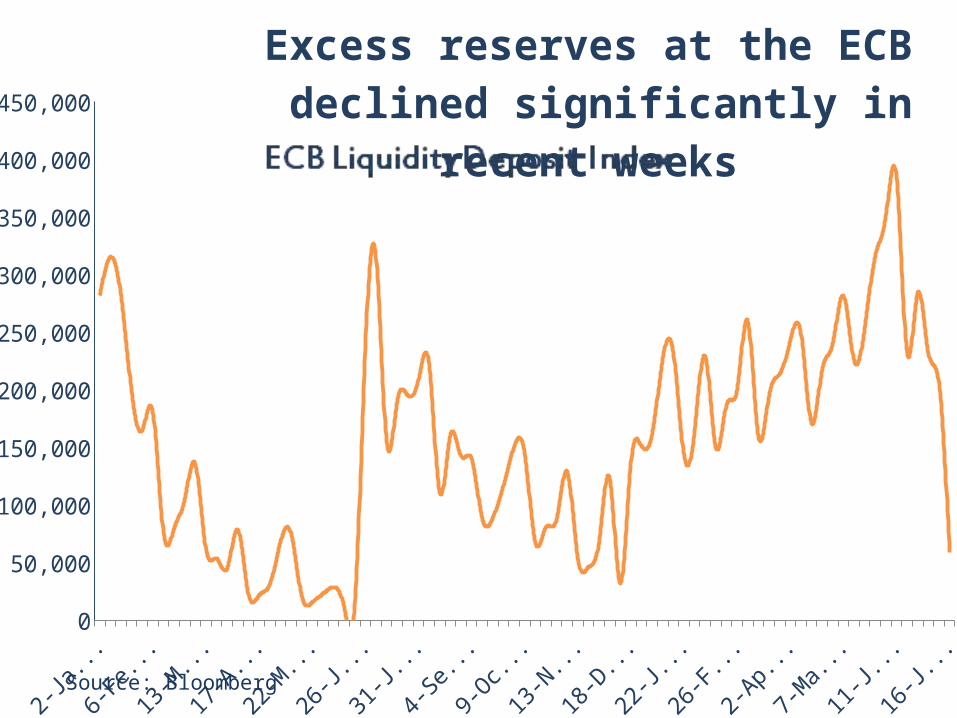
450,000
Excess reserves at the ECB declined significantly in recent
weeks
Source: Bloomberg
Oct-0
9
Oct-0
9
Oct-0
9
Nov-0
9
Nov-0
9
Dec-0
9
Dec-0
9
Jan-
10
Jan-
10
Feb-
10
Feb-
10
Mar
-10
Mar
-10
Apr-1
0
Apr-1
0
Apr-1
0
May
-10
May
-10
Jun-
10
Jun-
10
Jul-1
00
200
400
600
800
1,000
1,200
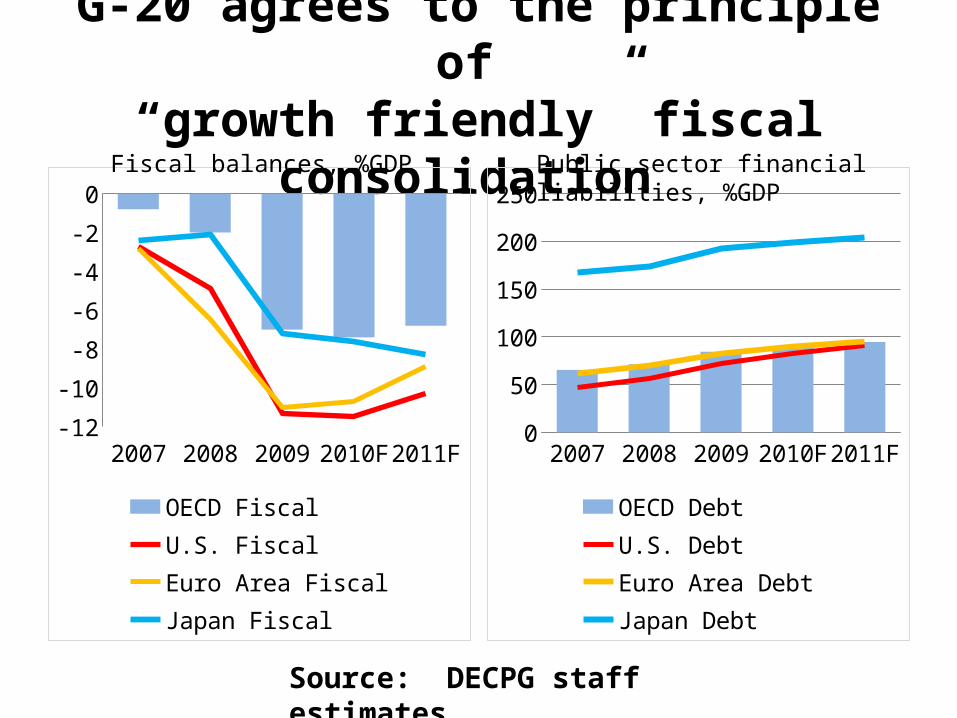
CDS spreads for selected economies
Spreads on credit default swaps
Average of Brazil, Russia, China, Turkey, and IndonesiaGreece Portugal Ireland Spain
Source: JP Morgan and World Bank data
basis points