Embed Size (px)
Citation preview
8/7/2019 Highlight of Economy 2009-10-2
http://slidepdf.com/reader/full/highlight-of-economy-2009-10-2 1/18
EMBASSY OF PAKISTAN
ECONOMIC DIVISION
HIGHLIGHTS OF THE
ECONOMYFiscal Year 2009-10
July 1, 2010
FY2010 saw improvement in global economic beginning the
second quarter of 2009 after free fall in world trade, industrial production,asset prices and global credit availability following financial crisis triggered by events of 2007 including collapse of housing bubble, high default rates onsubprime and adjustable rate mortgages and debt-financed consumption because of low interests rates and large inflows of foreign funds. Global equity markets rebounded and risk premiums on lending fell. International trade andglobal industrial production started recovering noticeably, with an increasingnumber of countries registering positive quarterly growth of gross domesticproduct (GDP). The economic revival has been driven by the effects of themassive policy stimuli injected worldwide since late 2008. However, therecovery was uneven and conditions for sustained growth remained fragile.
Credit conditions continued to be tight in major developed economies, wheremany major financial institutions needed to continue the process of deleveraging and cleansing their balance sheets. The rebound in domesticdemand remained tentative at best in many economies and is far from self-sustaining. High unemployment rates and the large output gap in mostcountries continue to pose challenges for policymakers worldwide. 1
For Pakistan’s economy, FY2010 was yet another challenging anddifficult year. However, a measure of macroeconomic stability achieved overthe past two years has kindled a moderate recovery in the economy. The
economy grew by a provisional 4.1% in the outgoing year, after a modestgrowth of 1.2% in 2008‐09. However, the recovery is still fragile and thedurability of the economic turnaround is far from assured given the significantchallenges the economy faces. A combination of limited fiscal space and risingspending, debt, and inflationary pressures, significantly reduce thegovernment’s ability to spend to stimulate the economy.
1
. World Economic Outlook, April 2010
8/7/2019 Highlight of Economy 2009-10-2
http://slidepdf.com/reader/full/highlight-of-economy-2009-10-2 2/18 2
Current Status of Reform in Pakistan
Cognizant of the limitations of the growth strategy followed in the past,
which has inevitably produced boom‐bust cycles followed by a balance of payments crisis, the government has embarked on a fundamental change of the development paradigm. The new development strategy seeks to fostersustainable and more equitable growth by means of structural improvementsin the productive sectors of Pakistan’s economy, involving broad range of policy actions across sectors. The current status of some of the importantreforms is as under:
Raising the Tax‐to‐GDP ratio is a key pillar of the government’seconomic strategy. To this effect, a proposed law to implement abroad‐based Value Added Tax (VAT) with minimal exemptions has beenpresented to Parliament
In addition, other measures such as improving tax administration andreinstating tax audits have been taken. The cumulative effect of thesepolicy measures is expected to be an increase ofPakistan’s Tax‐to‐GDPratio to 13 percent by 2013 (from 8.9 percent in 2008‐09)
Under Social Protection, the government has launched the BenazirIncome Support Program (BISP). An allocation of Rs 70 billion has beenmade in the Federal Budget 2009‐10, with the aim of targeting 5.5
million poor and vulnerable Households in Pakistan with a cash transferof Rs 1,000 per month to each. The size of BISP makes it the largestsocial protection scheme in the country’s history, and it works inconjunction with other safety nets such as Bait‐ ul‐ Maal, ZakatFund, andprovincial programs such as the Sasti Roti scheme
A Cabinet Committee on Restructuring (CCoR) has been formed torestructure key Public Sector Enterprises (PIA, PEPCO, Railways, TCP,USC, Pakistan Steel Mills, NHA) with a view to stop leakages caused by annual losses amounting to approximately 1.5% of GDP. The eventual
aim is to turnaround these PSEs into profitable, self ‐
sustaining venturesunder Public‐Private Partnership mode
Under reform of the power sector, electricity tariffs have been raisedbetween 65% since March 2008, in an effort to reduce the level of subsidies absorbed in the budget, while simultaneously moving to a fullcost‐recovery tariff for the power utilities. Under a new Act of
8/7/2019 Highlight of Economy 2009-10-2
http://slidepdf.com/reader/full/highlight-of-economy-2009-10-2 3/18 3
parliament, adjustment in tariff for changes in fuel prices for powergeneration has been made automatic
The government successfully concluded the Seventh National FinanceCommission (NFC) Award – only the fourth in Pakistan’s entire history,and the first for the last 19 years. This Award greatly augments the
quantum of resource transfer from the Centre to the Provinces
In conjunction with the higher resource transfer to the provinces, theCentre will also devolve some major functions/expenditure heads to thesub‐national governments in line with the provisions of the 1973Constitution following approval of the eighteenth amendment
SALIENT FEATURES OF THE
ECONOMY FY2010
I. GROWTH
W or ld Ou t look for FY20 10 reflects an expansion in growth ascompared to last year for China (10%), India (8.25%), Russia (4%),Pakistan (4%), MENA (4.5%), South America ($.1%), Central America(2.7%), Emerging Europe (2.9%), Advanced Europe (1%), ASEAN-5(5.4%), Advanced Asia (3.1%), NIAE (5..2%), Commonwealth of Independent States (4%), Sub-Saharan Africa (4.7%), Developing Asia(8.7%), Japan (1.9%), and global growth (4.25%)---Source: WorldEconomic Outlook, April 2010
R e a l GDP grew by 4.1 percent in FY2010 as against revised growth rate
of 1.2 percent last year
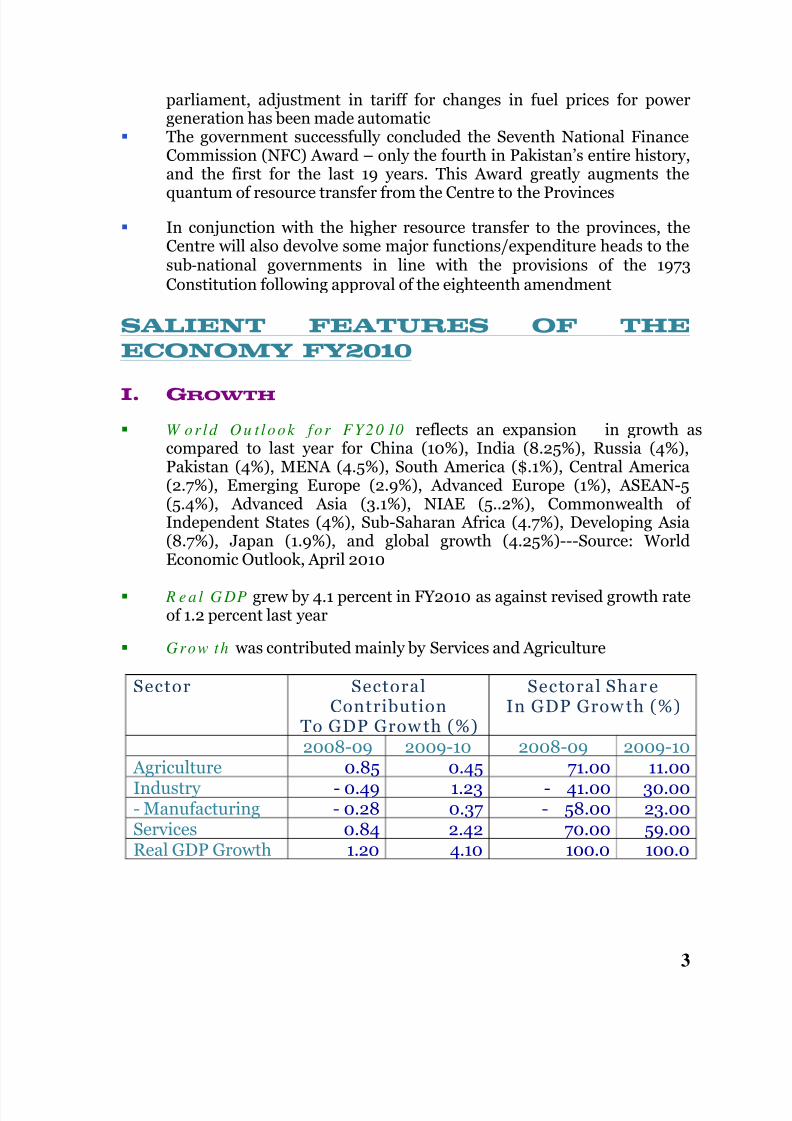
Grow th was contributed mainly by Services and Agriculture
Sector SectoralContribution
To GDP Grow th (%)
Sectoral Shar eIn GDP Grow th (%)
2008-09 2009-10 2008-09 2009-10
Agriculture 0.85 0.45 71.00 11.00Industry - 0.49 1.23 - 41.00 30.00- Manufacturing - 0.28 0.37 - 58.00 23.00Services 0.84 2.42 70.00 59.00Real GDP Growth 1.20 4.10 100.0 100.0
8/7/2019 Highlight of Economy 2009-10-2
http://slidepdf.com/reader/full/highlight-of-economy-2009-10-2 4/18 4
Co n t r i b u t i o n b y e x p e n d i t u re ---consumption expenditureaccounted for 96% of GDP growth in FY2010 with private consumptionexpenditure of 81% and government consumption expenditureaccounting for the balance 15%
S h a r e o f t h e t o t a l i n v e s t m e n t was a nominal 1% inGDP growth. Adjusting for the assumed
contribution of Changes in stocks
category, the contribution of gross fixed
capital formation (GFCF) was ‐1%.
S h a r e o f n e t e x p o r t s was 4%.
II. INVESTMENT To t a l i n v e s t m e n t declined from 19.0 percent of GDP in FY2009 to16.6 percent of GDP in FY2010
Fixed inv es tm en t decreased to 15.0 percent of GDP in FY2010 from17.4 percent last year
P r iv a t e s e c t o r i n v e s t m e n t to GDP has declined to 10.7 percent inFY2010 as compared to 12.7 percent in FY2009
Pub l ic sec tor in ves tm en t to GDP declined to 4.3 percent in FY2010as compared to 4.6 percent last year
III. NATIONAL SAVINGS
N a t i o n a l s a v i n g s rate has increased to 13.8 percent of GDP in FY2010as against 13.3 percent of GDP last year
Do m e s t i c sa v i n g s declined from 10.6 percent of GDP in FY2009 to9.9 percent of GDP in FY2010
F o r e i g n s a v i n g s declined substantially to 2.8 percent of GDP in FY 2010 as compared to 5.7 percent in FY2009
IV. FOREIGN INVESTMENT
Ov e ra l l f o re i g n I n v e s t m e n t during the first eleven months (July-May) of the FY2010 declined by 14.8 percent and stood at $ 1.897 billionas against $ 2.227 billion in the comparable period of last year.
8/7/2019 Highlight of Economy 2009-10-2
http://slidepdf.com/reader/full/highlight-of-economy-2009-10-2 5/18 5
Fo re i g n d i re c t i n v e s t m e n t stood at $ 2.031 billion during the firsteleven months (July-May) of FY2010 as against $ 3.331 billion in thesame period last year thereby showing a decline of 39 percent. USremained the single largest investor with 21.75% of totalinvestment followed by UK (13.75%) and Netherland (13.4%)
P r i v a t e p o r t f o li o i n v e s t m e n t witnessed inflow of $ 539 millionduring July-May of FY 2010 as against an outflow of $ 561 millionduring the comparable period of last year.
A l a rg e p a r t o f t h e d e c l i n e i n F DI for the period was recordedunder Telecommunications (a net decline of US$ 349 million), andFinancial Services (a fall of US$ 535 million).
In ves t m en t l eve l s in som e sec tor s remained healthy, including inOil and Gas exploration (FDI of US$ 654 million), Transport (US$ 115
million), Construction (US$ 95.5 million), and Paper and Pulp (US$ 81million).
V. PER CAPITA INCOME P e r c a p i t a r e a l GDP has risen at a faster pace in real terms during the
2002-03 to 2007-08 (4.5% per annum on average in rupee terms)because of acceleration in real GDP growth and four fold increase inremittances leading to a rise in average income of the people. Suchincreases in real per capita income have led to a sharp increase in
consumer spending during 2005-06 to 2007-08
Per cap i ta in com e in dollar term has grown from $ 586 in 2002-03 to$ 1095 in FY2010
SECTORAL PERFORMANCE
I. AGRICULTURE
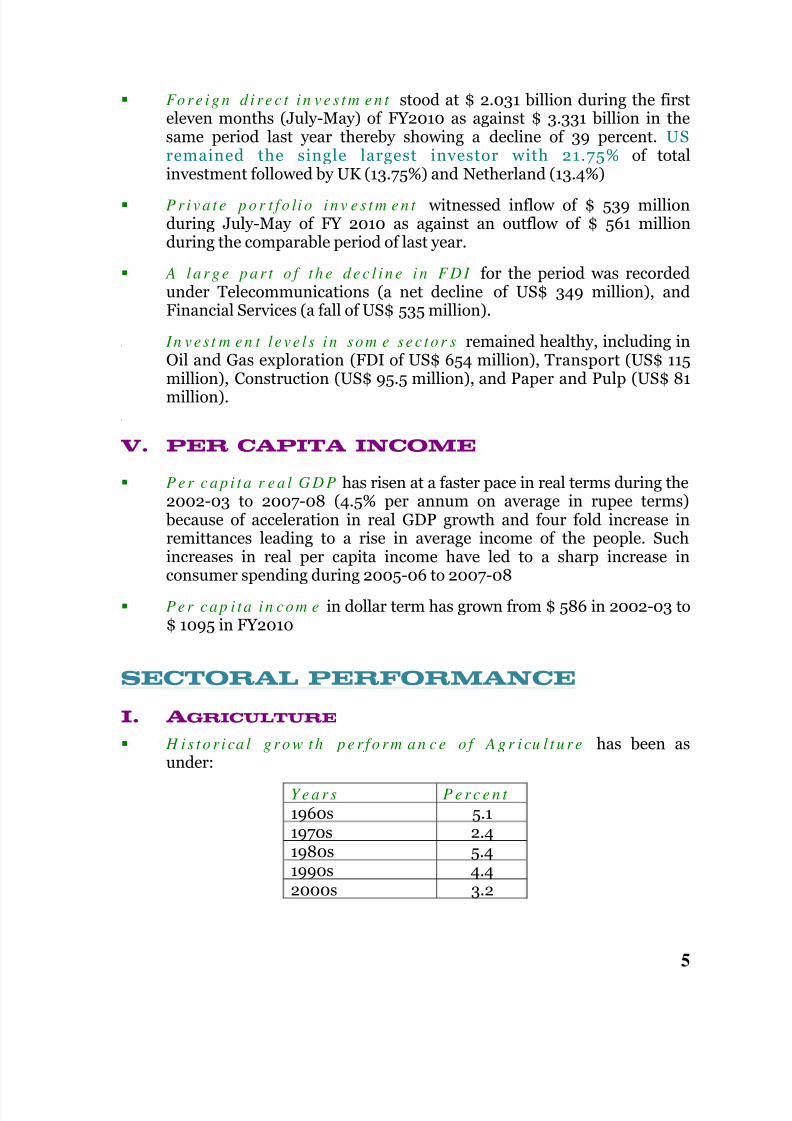
H i s t o r i ca l g ro w t h p e r f o rm a n c e o f A g r i cu l t u re has been as
under:
Y e a r s P e r c e n t
1960s 5.11970s 2.41980s 5.41990s 4.42000s 3.2
8/7/2019 Highlight of Economy 2009-10-2
http://slidepdf.com/reader/full/highlight-of-economy-2009-10-2 6/18 6
A g r i cu l t u re s e c t o r accounts for over 21 percent of GDP, and remainsby far the largest employer, absorbing 45 percent of the country’s totallabor force. Nearly 62 percent of the country’s population resides in
rural areas.
A g r i cu l t u re s e ct o r has depicted a growth of 2.0 percent as comparedto 4.0 percent last year
M a j o r c r o p s accounting for 33.4 percent of agricultural value addedregistered a negative growth of 0.2 percent against a growth of 7.3percent last year
Li v e s t o c k s e c t o r grew by 4.1 percent in FY2010 as against 3.5 percentlast year
A g r i c u l t u re c re d i t during July-March of FY2010 was Rs 166.344billion, 9.5 percent higher than the comparable period last year
II. Manufacturing and Mining
M a n u f a c t u r i n g accounts for 18.5 percent of GDP and 13 percent of total employment. Large Scale Manufacturing (LSM), at 12.2 percent of GDP, dominates the overall sector accounting for 66% of the sectoralshare, followed by Small Scale Manufacturing, which accounts for 4.9percent of total GDP
M a n u f a c t u r i n g s e c t o r expanded by 5.2 percent in FY2010 ascompared to contraction of 3.7 percent in last year
S m a l l a n d m e d i u m m a n u f a c t u r i n g se c t o r maintained its growthof last year at 7.5 percent
La r g e -sc a l e m a n u f a c t u r i n g registered an expansion of 4.4 percentas against contraction of 8.2 percent in the last year
M i n i n g a n d q u a r r y i n g sector has registered a negative growth rate of
1.7 percent as against – 0.2 last year
III. SERVICES SECTOR
S e rv i c e s s e c t o r grew by 4.6 percent as against last year’s actualgrowth of 1.6 percent
8/7/2019 Highlight of Economy 2009-10-2
http://slidepdf.com/reader/full/highlight-of-economy-2009-10-2 7/18 7
Value added in the w h o l esa l e a n d re t a i l t ra d e se c t o r grew at 5.1percent as compared to – 1.4 percent in last year
F i n a n c e a n d i n s u r a n c e s e c t o r registered negative growth of 3.6percent in FY2010 as compared to – 7.0 last year. The performance of
this sector shows that Pakistan’s financial sector is integrated in theworld economy and feeling the heat of the international financial crisis
T r a n s p o r t , S t o r a g e a n d Co m m u n i ca t i o n sub-sector depicted asharp deceleration in growth to 4.5 percent in FY2010 as compared to2.7 percent of last year
MONEY AND CREDIT
I. MONETARY POLICY (July 1, 2009 – June
20, 2010)
Pol icy R at ewas raised to 15 percent in November 2008 which hasbeen gradually adjusted downward to 12.5 percent during FY2010
M o n e y su p p l y ( M 2 )expanded by 9.51 percent against expansion of 6.75 percent in the comparable period of last year
R e se rv e m o n e y grew by 12.43 percent as against expansion of 2.38percent
N e t d o m e s t i c a s se t s ( N DA ) have increased by Rs. 417.484 billion ascompared to increase of Rs. 514.521 billion in last year, thereby showingan increase of 9.04 percent in this period whereas, last year the growthin the comparable period was 12.79 percent
N e t f o re i g n a s se t s ( N F A ) have recorded an expansion of Rs.71.154billion against the contraction of Rs. 198.152 billion in the comparable of last year
G o v e r n m e n t b o r r o w i n g f o r b u d g e t a r y s u p p o r t has recorded anincrease of Rs. 392.622 billion as compared to Rs.353.507 billion in thecomparable period of the last year. The S B P f i n a n c i n g has shown anet increase of Rs.130.339 billion and financing from scheduled bankswitnessed a net increase of Rs. 240.131 billion
C re d i t t o p r i v a t e s e c t o r witnessed a net disbursement of Rs.85.301billion as compared to Rs. – 7.996 billion in the comparable period of last year
8/7/2019 Highlight of Economy 2009-10-2
http://slidepdf.com/reader/full/highlight-of-economy-2009-10-2 8/18 8
W e ig h t e d a v e r a g e l e n d i n g r a t e have witnessed decline from 15.5percent in October 2008 to 13.25 percent in May 2010
W e ig h t e d a v e r a g e d e p o s i t r a t e on the other hand has decreasedfrom 9.5 percent in October 2008 to 7.37 percent in May 2010
II. INFLATION
Con su m er Pr ice Ind ex (CPI) stood at 11.6 percent during July-May of FY2010 as against 21.6 percent in the comparable period of last year
Y e a r - o n - Y e a r inflation has decelerated from 25.3 percent in August2008 to 13.1 percent in May 2010
Food in f la t ion is estimated at 12.1 percent and n o n - f o o d 11.4 percentagainst 25.6 percent and 18.4 percent in the corresponding period of lastyear
Core in f la t ion which represents the rate of increase in cost of goodsand services excluding food and energy prices declined from 17.4 percentto 11.4 percent
On current trends and barring any adverse shocks, it is expected that theaverage inflation for FY2010 as measured by CPI will be close to 11.5 (12)percent
W ho lesa le Pr ice In dex (W PI ) increased by 11.5 percent
S e n s i t i v e P r i c e I n d i c a t o r ( S P I ) has recorded an increase of 13.12percent during July-June (24), FY2010
CAPITAL MAR KETS
650 com pa n ieswere listed on the Karachi Stock Exchange (KSE) as of end‐March 2010, with Paid up capital of Rs. 894.2 billion.
A g g re g a t e m a rk e t c a p i t a l iza t i o n as at end March, stood at Rs.2,890 billion (US$ 35 billion). Market capitalization to GDP is currently just under 20%, which is low by comparison with many countries inPakistan’s peer reference group.
M e a s u r e s t a k e n a t t h e K a r a c h i S t o ck E x ch a n g e ( K S E) d u r i n g
2 0 0 9 i n c lu d e
Introduction of corporate Bonds Automated Trading System
8/7/2019 Highlight of Economy 2009-10-2
http://slidepdf.com/reader/full/highlight-of-economy-2009-10-2 9/18 9
Data Vending and Launch of Mobile KSE Automated TradingSystem (mKats)
Implementation of internationally accepted industry classificationBenchmark a jointly developed
Classification system launched by FTSE Group and Dow JonesIndex
Risk Management
Introduction of Client Level Margining Regime.
Restructuring of Net Capital Balance requirement
Pre‐settlement mechanism in Ready & Deliverable FutureContract Market
Introduction of Exposure Dropout Facility during Trading Hours
Introduction of Client wise cash deposits allocation againstexposure margin and losses
Change in Penalty requirement on Net Capital Balance Certificate.
K S E saw a growth of 36% (29% in dollar terms)during FY2010
KS E-10 0 In d ex closed at 9721.91 on June 30, 2010 compared to7162.18 points on June 30, 2009
A g g r e g a t e M a r k e t C a p i t a l i z a t i o n expanded to Rs 2,739.664billion from Rs 2,120 billion on June 30, 2009
Fo re i g n p o r t f o li o i n v e s t m e n t showed a net outflow of US$ 556million during FY2010
EXTERNAL SECTOR
E x t e rn a l s e c t o r , amid still‐difficult global economic conditions, large
costs to exports imposed by the campaign against terrorism, and asevere energy crisis faced by Pakistan’s economy, witnessed an overall improvement during 2009‐10. This recovery was mainly contributed by a sharp narrowing of the current account deficit which more than offsetthe declining financial account surplus during the period
E x p o r t s witnessed recovery from $ 17.313 billion last year to $ 17.855billion in July-May FY2010
8/7/2019 Highlight of Economy 2009-10-2
http://slidepdf.com/reader/full/highlight-of-economy-2009-10-2 10/18 10
Im po r t s registered a negative growth of 3.51 percent in July-May 2010.The imports stood at $ 27.937 billion as against $ 28.954 billion in thecomparable period of last year
T r a d e B a l a n c e-The merchandise trade deficit improved by 13.4
percent and declined from $11.642 billion in July-May 2008-09 to $10.082 billion in July-May FY2010.
W o rk e r s R e m i t t a n c es Workers’ remittances totaled $ 8.064 billionin July-May 2009-10 as against $ 7.076 billion in the comparable periodof last year, depicting an increase of 19.87 percent
C u r r e n t A c c o u n t B a l a n c e (including official transfer) Pakistan’scurrent account deficit shrank by 65.65 percent during July-May 2009-10. Current account deficit shrank to $ 2.981 billion as against $ 8.679billion last year. The FY2010 is likely to end with 2.8 percent of GDP in
2008-09
Fo r e ig n E x ch a n g e R e s er v e s on June 18, 2010 amounted to over $15.777 billion. Of which, reserves held by State Bank of Pakistan stood atover $ 12 billion and by banks stood at $ 3.768 billion
E x ch a n g e r a t e is around at Rs.85.80 per dollar (FY-end)
Fo re i g n d i re c t i n v e s t m e n t ( p r i v a t e ) stood at $2030.7 millionduring the first eleven months (July-May) of FY2010 as against $3331.2million in the same period last year thereby showing a decline of 39percent
Te rm s o f Tra d e aggregated to 54.9 during July ‐March 2009‐10 ascompared to 56.3 of July ‐March 2008‐09 thereby witnessed adeterioration of 2.5 percent during the period under review
Ba lan ce o f Pay m en t s (overall balance) moved from a negative $3,871 million during July-May 2008-09 to a positive $ 781 million by end May-2010
FISCAL OPERATION
I. FISCAL DEVELOPMENT
Fisca l d e f ic it is likely to be around 5.1 percent of GDP
II. REVENUE COLLECTION ---(END-APRIL
2010)
8/7/2019 Highlight of Economy 2009-10-2
http://slidepdf.com/reader/full/highlight-of-economy-2009-10-2 11/18 11
Over a l l FBR ta x co l lec t ion deteriorate to around 9.8 percent of GDP
T a x R e v e n u e collected by the FBR amounted to Rs.1,026 billionduring July-April 2009-10, net of refunds, 14% higher than thecorresponding period of last year
N e t D i re c t t a x collection was estimated at Rs. 389.5 billion registeringan increase of 17 percent over the last year
N e t i n d i re c t t a x e s grew by 12 percent and stood at Rs 636.1 billion
N e t S a l e s t a x c o l l e c t i o n s grew by 16 percent and stood at Rs.416billion as against Rs.359.2 billion in comparable period last year
Net cus t om s du ty col lec t ionincreased from Rs.117.2 billion in2008-09 to Rs.125.7 billion in 2009-10, thereby showing a growth of 7.3percent
Net co l l ec t ion o f f edera l exc i se stood at Rs 94.3 billion as againstRs. 91.6 billion in the corresponding period of last year, thereby,showing an increase of 2.9 percent
D ir e ct t a x r e v e n u e has risen from 18% in 1990-91 to 38% of total taxrevenue in FY2010
I n d i r e ct t a x -t o -t o t a l t a x r e v e n u e is 62% in FY2010 down from 82%in 1990-91
II. PUBLIC DEBT---(End-March 2010)
Tota l Publ i c Debt stood at Rs 8,160 billion as of end-March 2010registering a growth rate of 12.2%, less than 22% of last year growth
Publ ic Debt is equivalent to 56% of GDP and 379% of budgetedrevenue for the year
Tota l do m es t i c d eb t is positioned at Rs 4,491 billion which impliesnet addition of Rs.631 billion in the nine months of the current fiscal
year
Dom es t i c Debt h as r i sen from Rs 1,578.8 billion in 1999-2000 to Rs4,491 billion
E x t e rn a l De b t moved from US $ 32.254 billion in 1999-2000 to53,013 billion
8/7/2019 Highlight of Economy 2009-10-2
http://slidepdf.com/reader/full/highlight-of-economy-2009-10-2 12/18 12
E x t e rn a l De b t a n d L i a b i l it i e s rose from US $ 37,918 billion in 1999-2000 to $ 54.235 billion
E x t e rn a l De b t is 25 percent of GDP and EDL is 31.1 percent of GDP
Dom est ic Debt is 31 percent of GDP
E x t e rn a l De b t a n d L i a b i l i t i e s as percentage of foreign exchangeearnings increased to 150 percent
D e b t s e r v i ci n g o n p u b l ic d e b t aggregated Rs. 814.5 billion
P u b l i c d e b t s e rv i ci n g n o w s t a n d s a t 5.4 percent of GDP
De b t s e rv i c in g consumed 46% of government revenues
I n t e re s t p a y m e n t s of Rs. 428.5 billion have been incurred ondomestic debt, whereas Rs. 45 billion of the payment was on account of foreign debt
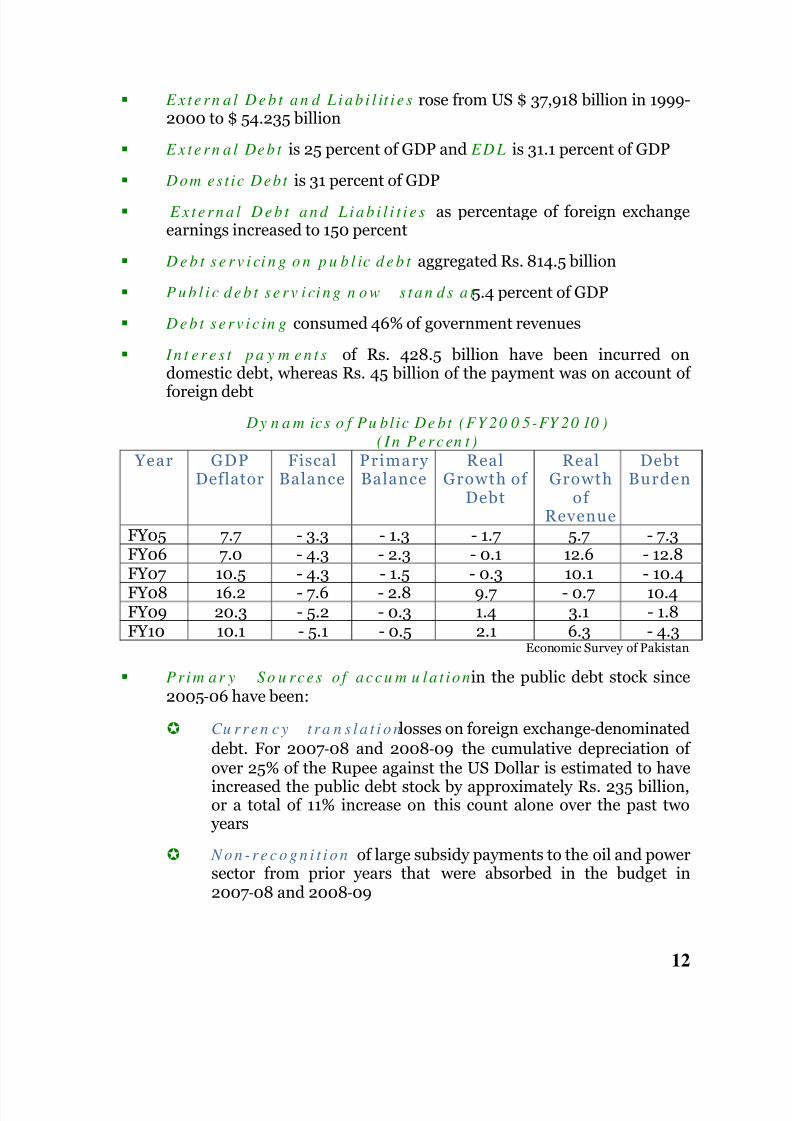
Dy n a m ics o f Pu blic De bt (FY 20 0 5-FY 20 10 )
( I n P e rc en t )
Year GDPDeflator
FiscalBalance
Primary Balance
RealGrowth of
Debt
RealGrowth
of Revenue
DebtBurden
FY05 7.7 - 3.3 - 1.3 - 1.7 5.7 - 7.3FY06 7.0 - 4.3 - 2.3 - 0.1 12.6 - 12.8
FY07 10.5 - 4.3 - 1.5 - 0.3 10.1 - 10.4FY08 16.2 - 7.6 - 2.8 9.7 - 0.7 10.4FY09 20.3 - 5.2 - 0.3 1.4 3.1 - 1.8FY10 10.1 - 5.1 - 0.5 2.1 6.3 - 4.3
Economic Survey of Pakistan
Prim ar y So u rces o f accu m u la t ionin the public debt stock since2005‐06 have been:
Cu rre n c y t ra n s l a t i o n losses on foreign exchange‐denominateddebt. For 2007‐08 and 2008‐09 the cumulative depreciation of
over 25% of the Rupee against the US Dollar is estimated to have increased the public debt stock by approximately Rs. 235 billion,or a total of 11% increase on this count alone over the past twoyears
N o n - re c o g n i t i o n of large subsidy payments to the oil and powersector from prior years that were absorbed in the budget in2007‐08 and 2008‐09
8/7/2019 Highlight of Economy 2009-10-2
http://slidepdf.com/reader/full/highlight-of-economy-2009-10-2 13/18 13
S h a r p r e d u c t io n in non‐debt creating inflows, such as FDI, inthe wake of the global financial crisis
A u g m e n t e d a c c es s to IMF resources provided to Pakistan inthe form of the Stand By Arrangement (SBA) signed in November
2008, amounting to a total of US$ 11.3 billion, of which approximately US$ 7.3 billion has been disbursed
Low er in f low of external assistance, which forced thegovernment to higher‐cost domestic borrowing
Lu m p y r ep a y m en t of maturing Defence Savings Certificates(DSCs) since 2007, that had not been budgeted for
I n a b i l i t y of the government to take advantage of the historically low interest rate environment in the 2003 to 2007 period, by
locking into longer tenure debt such as the five‐
and ten‐
yearPakistan Investment Bonds (PIBs)
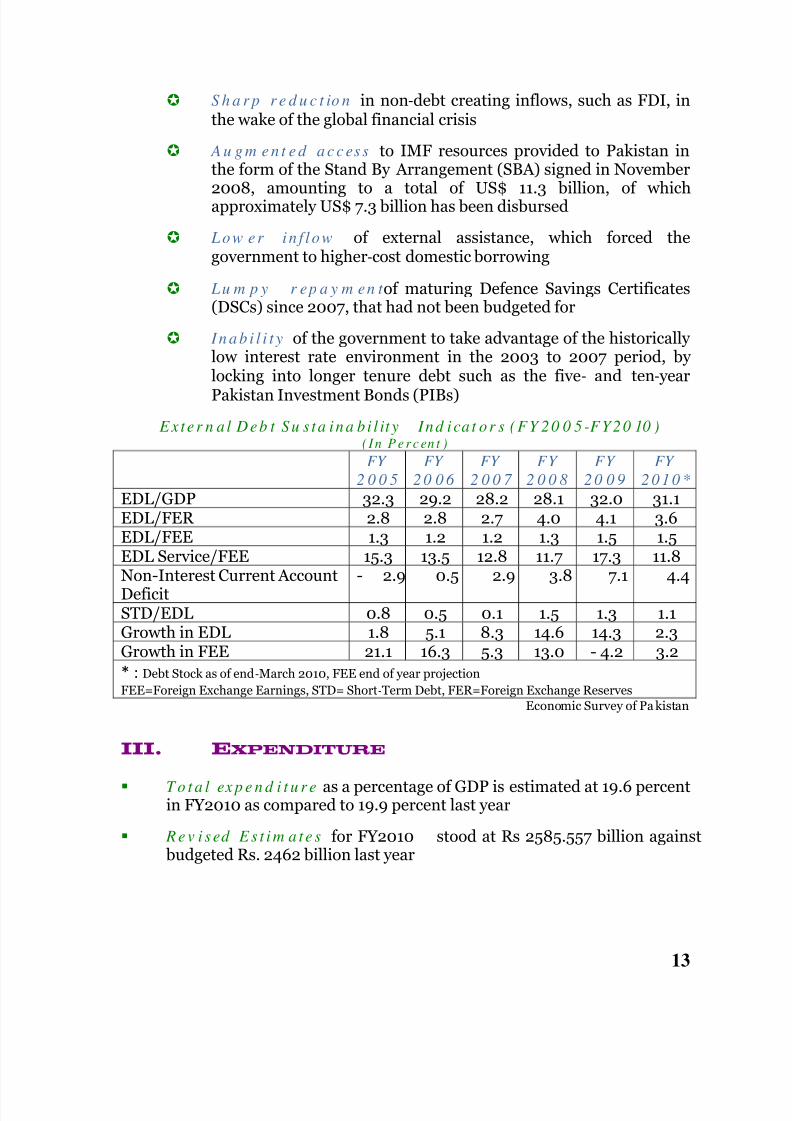
Exter n a l Deb t Su s ta ina b i l it y Ind ica t or s (FY 20 0 5 -FY20 10 )( In P er cen t )
FY
2 0 0 5
FY
2 0 0 6
FY
2 0 0 7
FY
2 0 0 8
FY
2 0 0 9
FY
2 0 1 0 *
EDL/GDP 32.3 29.2 28.2 28.1 32.0 31.1EDL/FER 2.8 2.8 2.7 4.0 4.1 3.6EDL/FEE 1.3 1.2 1.2 1.3 1.5 1.5EDL Service/FEE 15.3 13.5 12.8 11.7 17.3 11.8
Non-Interest Current AccountDeficit
- 2.9 0.5 2.9 3.8 7.1 4.4
STD/EDL 0.8 0.5 0.1 1.5 1.3 1.1Growth in EDL 1.8 5.1 8.3 14.6 14.3 2.3Growth in FEE 21.1 16.3 5.3 13.0 - 4.2 3.2
* : Debt Stock as of end‐March 2010, FEE end of year projection
FEE=Foreign Exchange Earnings, STD= Short‐Term Debt, FER=Foreign Exchange Reserves Economic Survey of Pa kistan
III. EXPENDITURE
T o t a l ex p e n d i t u r e as a percentage of GDP is estimated at 19.6 percentin FY2010 as compared to 19.9 percent last year
R e v i sed E s t i m a t e s for FY2010 stood at Rs 2585.557 billion againstbudgeted Rs. 2462 billion last year
8/7/2019 Highlight of Economy 2009-10-2
http://slidepdf.com/reader/full/highlight-of-economy-2009-10-2 14/18 14
C u r r e n t e x p e n d i t u r e stood at Rs 2017.255 billion in FY2010compared to Rs 2041.6 billion in FY2009
S h a r e o f c u r r e n t e x p e n d i t u r e declined from 88 percent in 1999-2000 to 79 percent in FY2010
De v e lo p m e n t e x p e n d i t u re s stood at 21 percent of the budget or4.1% of GDP
D e fe n s e e x p e n d i t u r e stood at Rs 378.135 billion or 2.3% of GDP inFY2010 compared to Rs 330 billion in FY2009 0r 2.6 percent of GDP,declining from a peak level of 6.9 percent of GDP in 1989-90
I n t e r e s t e x p e n d i t u r e is budgeted at Rs 814.5 billion in FY2010compared to Rs 656.3 billion in FY2009
SOCIAL SECTORS
I. EDUCATION
P u b l ic s p e n d i n g o n e d u c a t i o n is 2.05 percent of GDP
Overa l l l i t e racy ra te(10 years & above) is 57 percent in FY2009compared to 45 percent in 2001
M ale l i t e ra cy ra te (10 years & above) increased from 58 percent in2001 to 69 percent in FY2009
Fem a le Li ter a cy rate increased from 32 to 45 percent during the sameperiod.
Li t e ra c y remains higher in urban areas (74%) than in rural areas(48%) during FY2009
Gener a l Par i t y In dex (GPI)is 0.65
Net Pr im ar y En ro lm en t increased from 56 percent in 2005-06 to 57percent in FY2009
H i g h e r e d u c a t i o n estimated enrollment is 948,364 in 2009-10, anincrease of 191 percent over 2001-02 with 132 universities and 56,839teachers in both private and public sectors
P u b l ic s p e n d i n g o n h i g h e r e d u c a t io n increased from Rs. 7723.402million during 2002-03 to Rs. 44,000 million during 2008-09 showingan increase of 470 percent
8/7/2019 Highlight of Economy 2009-10-2
http://slidepdf.com/reader/full/highlight-of-economy-2009-10-2 15/18 15
S i n c e 2 0 0 8 , international development partners have extended foreignassistance for the development of education sector in Pakistan as givenbelow:
Funded by DFID at a cost of £3.5 million, Gender in Education
Policy Support Project (GEPSP) is being implemented by Government of Pakistan with the technical assistance of UNICEF.Its objective is to strengthen MoE to accelerate progress towardsgender parity and equality at all levels of education by 2015
USAID has assisted a project “Strengthening Teacher Education inPakistan” (STEP), costing US$ 2.14 million to enhanceGovernment’s capacity to improve policy framework, coordinationand National Standards for Teacher Certification andAccreditation
USAID assisted Ed‐Links program (focusing on TeachersProfessional Development; Student Learning & Achievement;Governance) in Sindh, Balochistan, Islamabad & FATA) costingUS$ 90 million
USAID has funded “Pre‐Service Teachers Education Program(Pre‐STEP)” launched at a cost of US$ 75 million
Under Strategic Objective Grant Agreement (SOGA), USAIDallocated additional $ 121 million for basic education during 2009
Department for International Development (DFID), UK enteredinto agreement with Government of Pakistan for joint task Forceon Education and allocated £ 250 million
Under One‐UN Joint Program, Technical Working Group onEducation comprising officers of MoE prioritized JP Areas,Outcomes, Outputs, Activities, Costs etc. before it is formal launchin association with UN agencies
GTZ is assisting Ministry of Education in the areas of Educationpolicy review, curriculum reform and Textbook development,
through its € 2.5 million project titled “National Basic Education Policy program”
III. HEALTH AND NUTRITION
P u b l i c sp e n d i n g on health sector during FY2010 is 0.54 percent
8/7/2019 Highlight of Economy 2009-10-2
http://slidepdf.com/reader/full/highlight-of-economy-2009-10-2 16/18 16
9 6 8 h o s p i t a l s , 4813 dispensaries, 5345 basic health units & subhealth centers and 906 maternity and child health centers, 572 ruralhealth centers with 103, 708 beds in 2010 provide health care
139 ,555 doc tors , 9822 dentists ,69,313 nurses, 26,225 mid-wives,
10,731 Lady Health Workers man these health care facilities
P o p u l a t i o n a n d h e a l t h f a c i li t ie s ra t i o i n 2 0 10 turnout to be 1183persons per doctor, 16,914 person per dentist, 2501 persons per nurseand 1592 persons per bed
V a r i o u s h e a l t h p r o g r a m s with a special focus on major publichealth problems include the national programs for the prevention andcontrol of tuberculosis, malaria, HIV/AIDS, hepatitis, blindness andprogram on maternal, neonatal and child health etc.
P r im e M i n i s t e r P ro g ra m f o r P re v e n t i o n a n d Co n t ro l o f
H e p a t i t i s i n P a k i s t a n with a total cost of Rs 2.59 billion aims atreduction in hepatitis prevalence by 2010 through establishment of Hepatitis Surveillance System
III. POPULATION, LABOUR FORCE AND
EMPLOYMENT
P o p u l a t io n a v e r a g e growth rate is 2.1 percent per annum
Cr u d e B ir t h R a t e is 28/1000 which was 31.7 a decade ago
Cr u d e D ea t h R a t e is 7.4/1000 which was 9 1o years back
Li fe e x p e c t a n c y is 64.5 years, up from 62.3 10 years ago
I n f a n t M o r t a l it y r a t eis 65.1, down from 81.1 in 1980s
M o r t a l it y r a t e u n d e r 5per 1000 is 95.2
Tota l Fer t i l it y R at eis 3.6 in 2010, down from 6 in 1984
Cu rre n t e s t im a t e d p o p u l a t i o n i s 175.5 million
U r b a n p o p u la t i on is 63.05 million, up from 44.47 million in 1999and 110.46 million rural population
De p e n d e n c y ra t i ois 0.75
M e d i a n a g e 21.3 years
E m i g ra t i o n ra t e i s 2 .2 p e rc e n t
8/7/2019 Highlight of Economy 2009-10-2
http://slidepdf.com/reader/full/highlight-of-economy-2009-10-2 17/18 17
IV. Labor Force---(Survey 2008-09)
To t a l l a b o r f o rc e i s 53.72 million people with female labor force of 11.81 million
Tot a l n u m ber o f peo p le em p loy ed was 50.79 million
2 .93 m i ll ion o f th e labo r for ce is estimated as un-employed in andunemployment rate is 5.5 percent with urban unemployment rate of 7.1percent and Rural rate of 4.7
Cru d e a c t iv i t y ( p a r t i ci p a t i o n ) ra t estands at 32.8 percent
R e f i n e d a c t iv i t y ( p a r t i ci p a t i o n ) ra t eis 45.7 percent
S h a r e o f a g r i c u l t u r e in employment is 45.1 percent declining from48.4 percent in 1999-2000, with manufacturing (13%), trade(13%) &
services (11.1%) absorbing a growing share of the work force
2 6 . 6 p e rc e n t o f n o n -a g r i cu l t u re w o rk e r s are in the formal sectorand 73.4 percent are in the informal sector
Pol icy focus o f th e g ov ern m en t is creation of decent employmentand human resource development through (i) People’s Works Program(ii) National Internship Program (ii) People’s Rozgar Program (iv) Tenpercent quota for women across the board in all government jobs hasbeen earmarked (v) Minimum wages has been increased from Rs. 4600to Rs. 7000 per month
TRANSPORT A ND COMMUNICATION To t a l ro a d n e t w o rk is about 260,000 km of which around 60 percent
is paved.
R o a d d e n s i ty is 0.32 km/km2 which is low and compares unfavorably with other South Asian countries (Bangladesh-1.7 km/km2, Sri Lanka-1.5 km/km2 and India-1.0 km/km2)
Te le -d e n s i t y i n t h e c o u n t ryhas jumped from a mere 11.9 percent in2004-05 to 62.4 percent (Feb- 10)
C e l l u l a r sh a re i n t o t a l d e n s i t y is 94 percent followed by FLL (3.5percent) WLL (2.5%)
To t a l c e l l u l a r su b sc r i b e r b a se s t a n d s at 96.2 million (Feb 2010)whereas it was 5 million in 2003-04, 3.4 million FLL and 2.69 millionWLL subscribers
8/7/2019 Highlight of Economy 2009-10-2
http://slidepdf.com/reader/full/highlight-of-economy-2009-10-2 18/18
B r o a d b a n d s u b s c r i b e r s has risen to 688,373 subscribers in Jan-2010, up from 32,282 in March 2007
B r o a d b a n d p e n e t r a t i o n has increased from 0.04 percent inDecember 2007 to 0.42 percent in Jan-2010
ENERGY I. Oil and Gas
En erg y Con su m p t ion m i x is changing sharply from 1996-97 to2009; gas from 29.0% to 43.7%, oil from 48% to 29.0%, electricity from15% to 15.3%, coal from 6% to 10.4% and LPG from 1% to 1.5%
S e c t o ra l e n e rg y c o n su m p t i o n p a t t e rnreflects gradual shift from2002-03 to 2009-10; domestic from 23% to 20%, commercial from 3%
to 4%, industrial 36% to 43%, Agriculture from 3% to 2%, Transportfrom 33% to 29% and other government remained at 2%
A n n u a l E n e r g y Co n s u m p t i o n in 2008-09 registered a growth of 8.1% in petroleum products than last year, 3.0% in gas, 10% in coal anddecrease of 1.7% in electricity
C r u d e o i l p r o d u c t i o n p e r d a y declined to 65,245 barrels from66,531 barrels per day last year, showing a negative growth of 1.9%
N a t u r a l g a s a v e r a g e p r o d u c tio n p e r d a y stood at 4,049 million
cubic feet during 2009-10 as compared to 3,986 million cubic feet lastyear, showing an increase of 1.56 percent
II. Electricity
I n s t a l l e d g e n e r a t i o n c a p a c i t y has increased to 19,754 MW with33.7% hydel and 66.3% thermal
Vil lages e lec tr i f ied increased from 67,183 in 1998 to 147,038 by March 2010
Consumers share includes 16.416 million domestic, 2.342 millioncommercial, 0.260 million industrial, 0.269 agriculture, and 13,000others with a total of 19.300 million