Embed Size (px)
Citation preview

Matthew Elliott , Lisa Elliott, Tong Wang, Doug Malo
South Dakota State University
© 2014 Board of Regents, South Dakota State University
iGrow.org
Highest and Best Ag Land Use

iGrow.org
Background
The current SD Ag land productivity assessment formula
Income Approach: Net Income/Capitalization Rate=Expected Land Value
USDA-NASS yields
crop prices to determine the average acre value of cropland
pastureland rents to determine the average value of grassland.
Current HBU (cropland or grassland)
NRCS Land Capability Classification (class 1-3 soils are cropland 5-8 soils are grassland).
The purpose of the research is to provide objective data that will allow greater transparency in quantifying the probability of highest and best use determinations for each soil type in a county, using tests that incorporate what is physically possible, financially feasible, and provides for maximum profitability.
© 2014 Board of Regents, South Dakota State University iGrow.org

iGrow.org
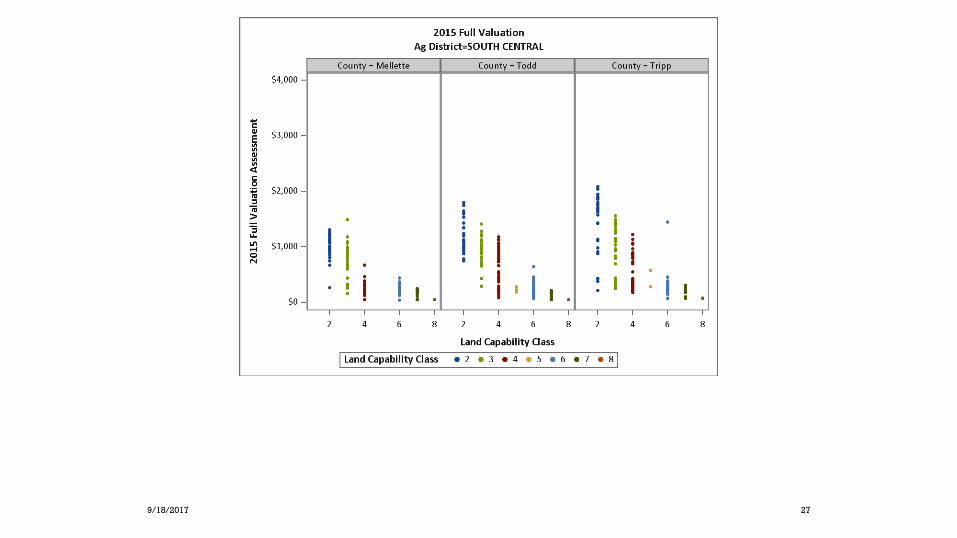
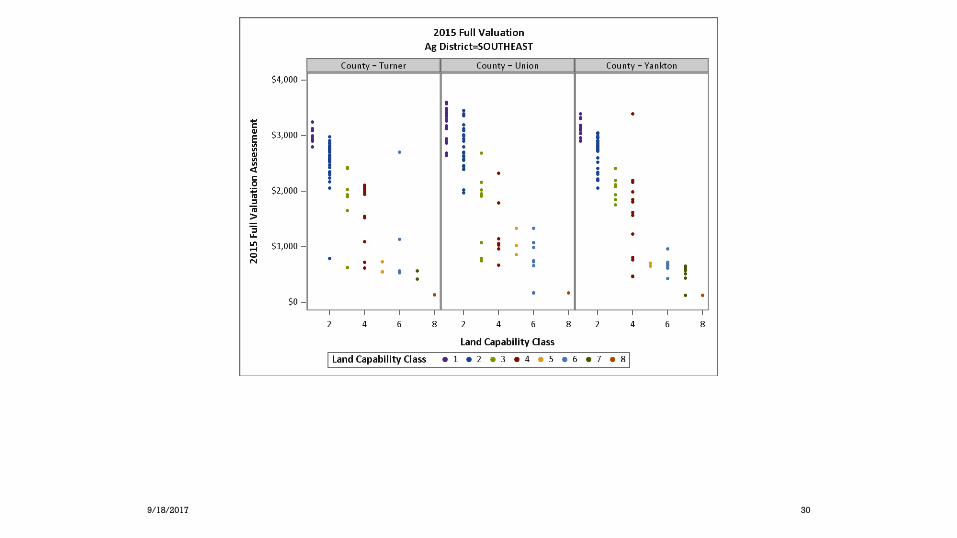
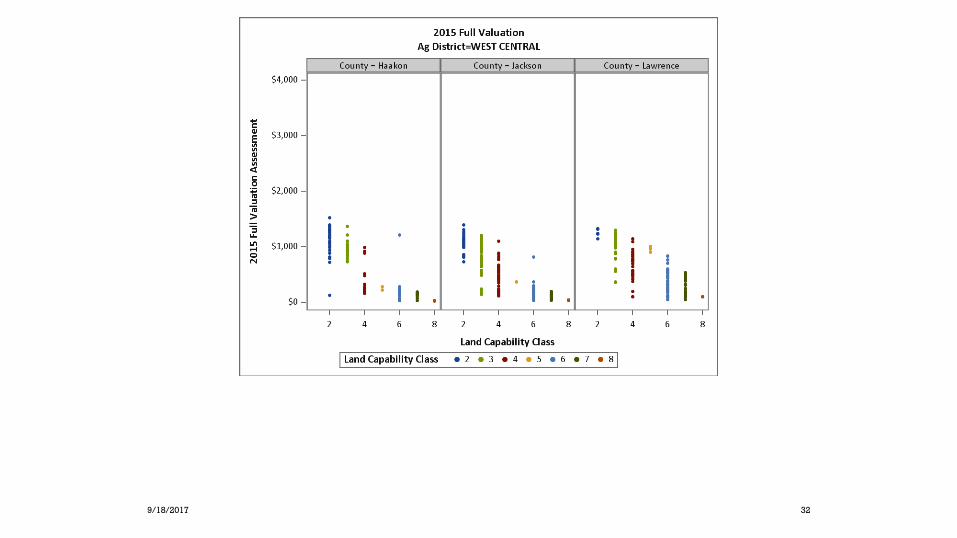
2015 Assessment Differences by Land
Capability Classification
© 2014 Board of Regents, South Dakota State University iGrow.org

iGrow.org
Progress on Research Deliverables
Updated Table 1s and 2s for each county;
preliminary data completed in process of verification
Highest and Best Use values for each soil type;
preliminary data completed
verifying results and refining method
additional data considerations
Assess the potential impact of changes and shifts from current methods to an improved approach that incorporates new Highest and Best Use values;
preliminary data on soil acre shifts
Provide Table ls and 2s on iGrow.org and a detailed description of methodology; and
Current method is being submitted for academic peer review. We will disseminate methodology following successful peer review and publication.
Provide information on potential incremental implementation to manage shifts if a phase-in period is necessary.
No discussion of policy implementation of research method has occurred– need to finalize research method, determine criteria, and estimate impact
© 2014 Board of Regents, South Dakota State University iGrow.org

iGrow.org
Soil and Economic Data Analyzed to
Determine Highest and Best Use
Current use of soil (2011 National Land Cover Database)
NASS Crop Reported Yields- Ag District
NRCS Crop productivity index
NRCS Frequency of flooding
Topography
Digital Elevation Models
Percent slope and 95 percentile slope for soil map unit
Simulated Expected Net Returns for Crop, Grazing, and Hay management for each soil
Apex Model
FAPRI Forecasted Prices
© 2014 Board of Regents, South Dakota State University iGrow.org
iGrow.org
Two Methods for Classifying
Cropland HBU
Factor Analysis for Scoring Propensity HBU=Cropland
Score soils based on commonality
Transparent scoring
Qualitative data issues (e.g. flooding: rare, occasionally)
Machine Learning (Random Forest Classification)
Ensemble of Computer Generated Decision Trees
500 different computer generated decision trees and sub samples
Each develop best rules to classify soil as cropland or grassland given data
Black box (qualitative data is easily incorporated)
Probability is the mode classification of all 500 classifications (i.e. if 250 trees classified a soil as cropland and 250 classified same soil as grassland then probability of cropland is 50%)
© 2014 Board of Regents, South Dakota State University iGrow.org

iGrow.org
HBU DeterminationCurrent Method Machine Learning
Random Forest
Classification
Factor Analysis
Data AnalyzedNRCS Land
Capability Class
Net Returns
Probability of loss
Net Returns
Probability of loss
Current Use
(Intensity)
Current Use
(Intensity)
NRCS Crop
Productivity Index
NRCS Crop
Productivity Index
Flooding Frequency
Topography Topography
Geography (ag
district)© 2014 Board of Regents, South Dakota State University iGrow.org
iGrow.org
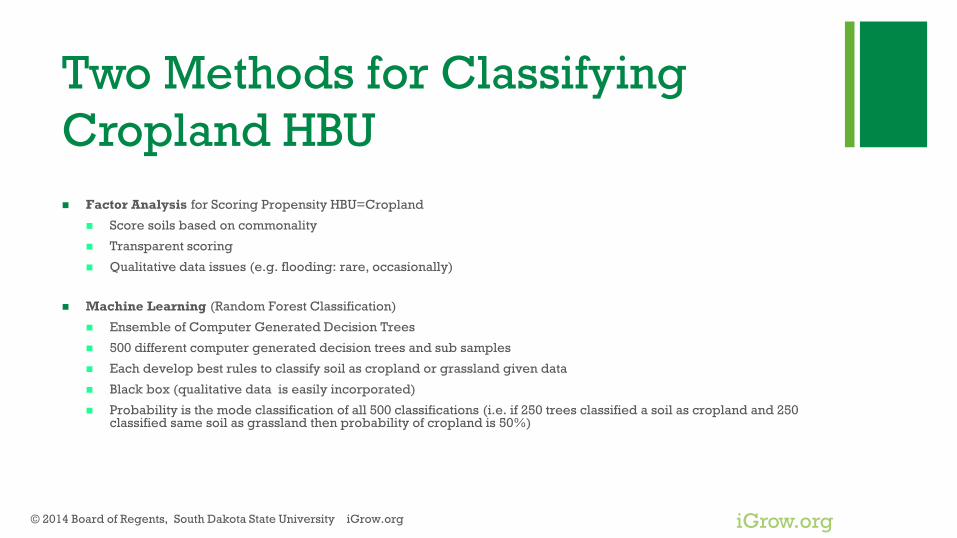
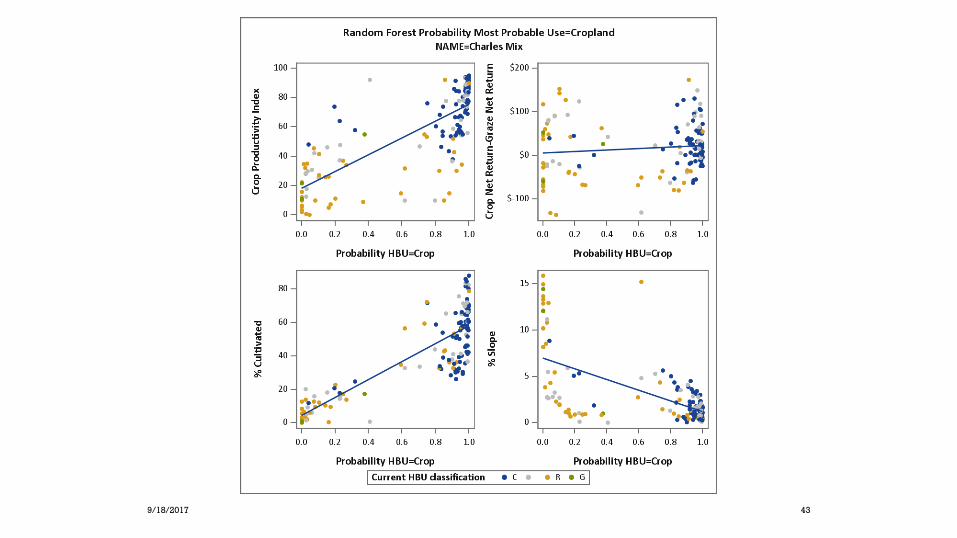
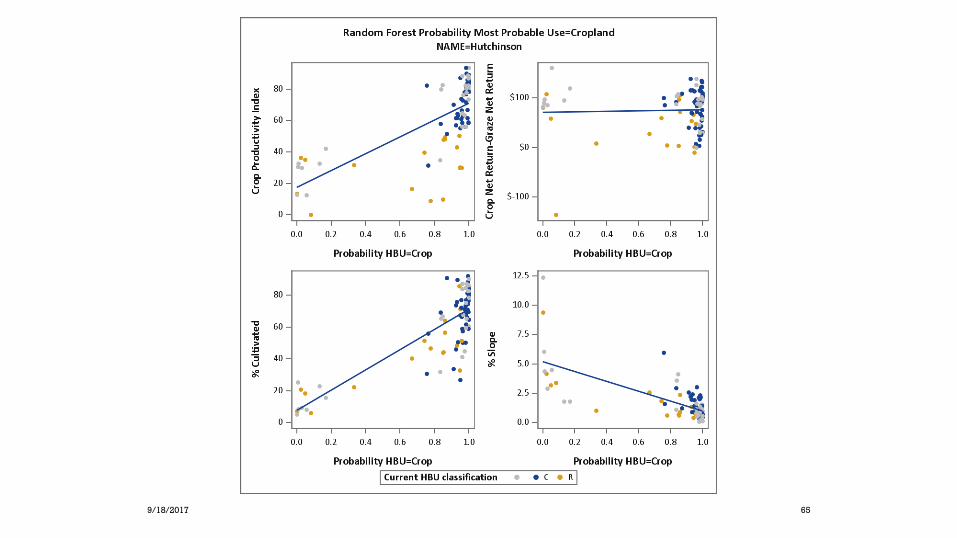
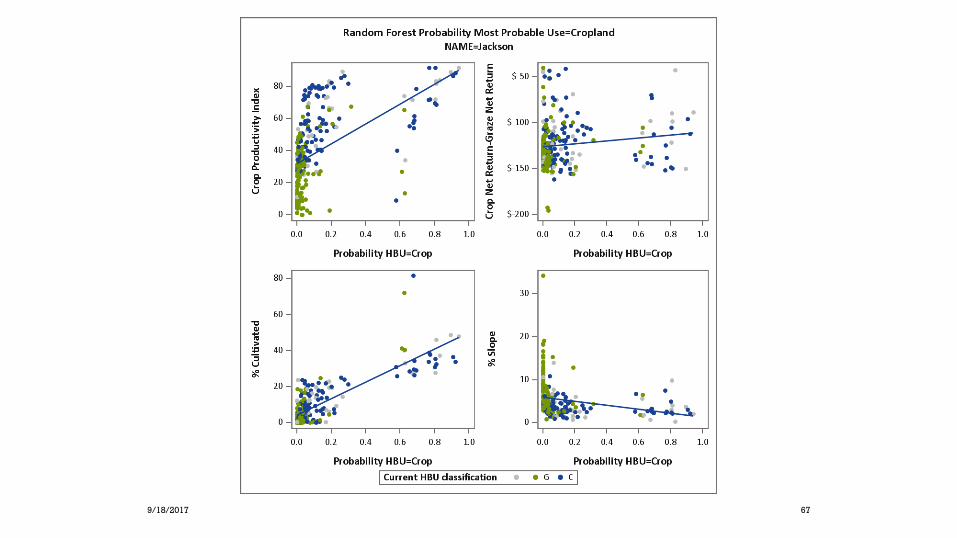
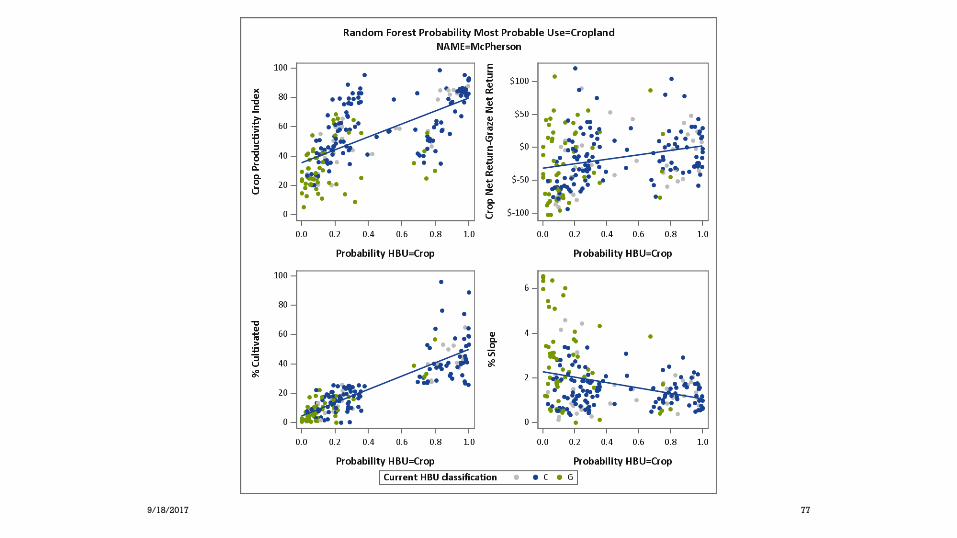
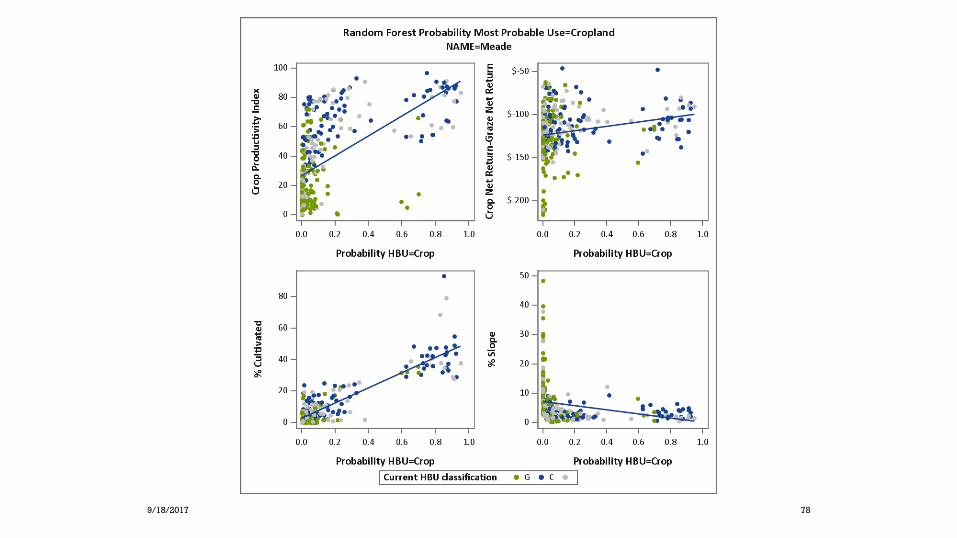
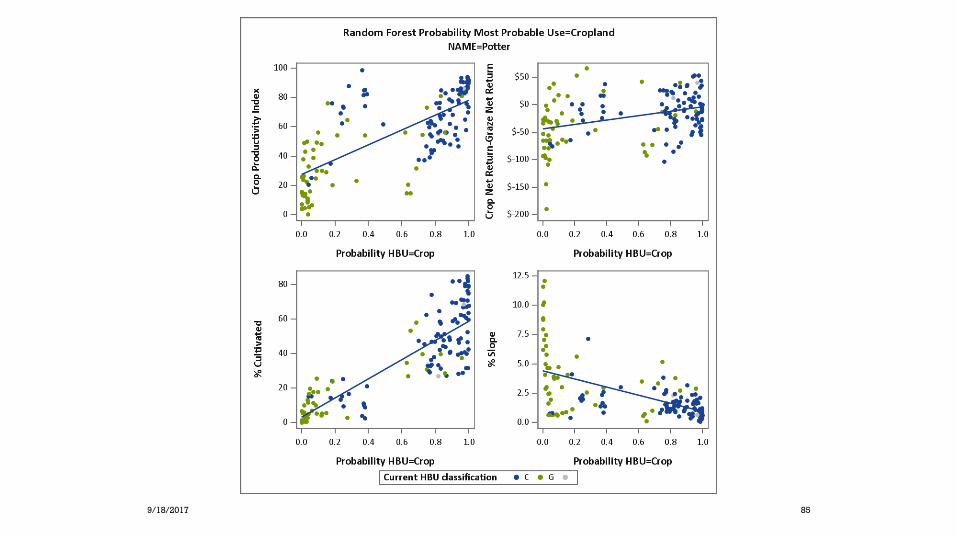
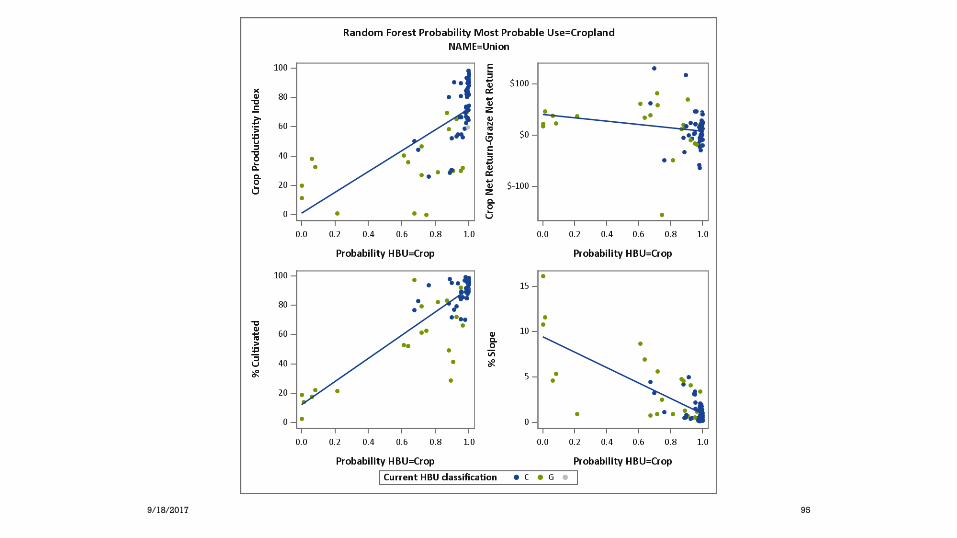
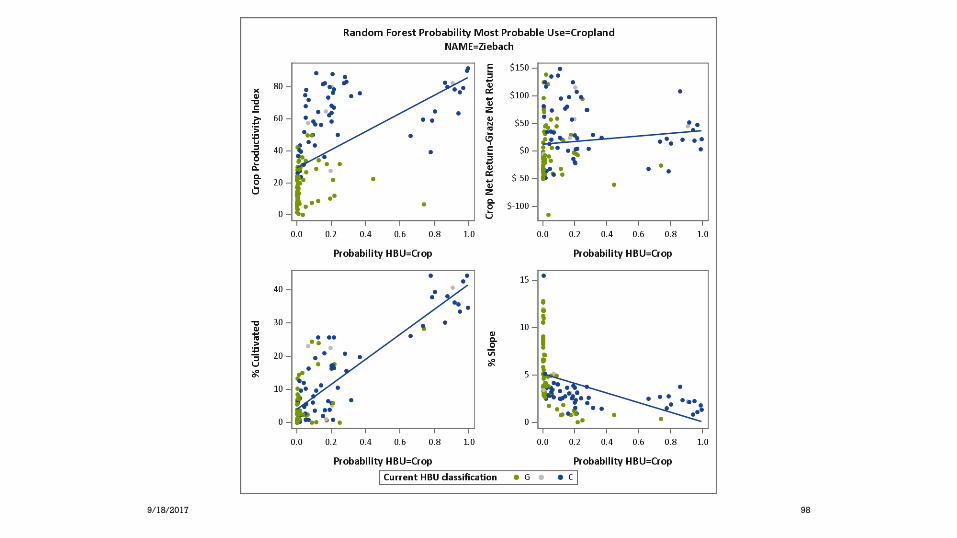
3 Dimensions to Determine HBU
1. Legal Feasibility – Percentage Cultivated, flooding, and slope
2. Maximum Productivity –Crop Productivity Index NRCS and SPR rating
3. Financial Feasibility – Crop and Net Return Simulation (APEX model and Multivariate Empirical Distributions of Net Returns)
© 2014 Board of Regents, South Dakota State University iGrow.org
iGrow.org
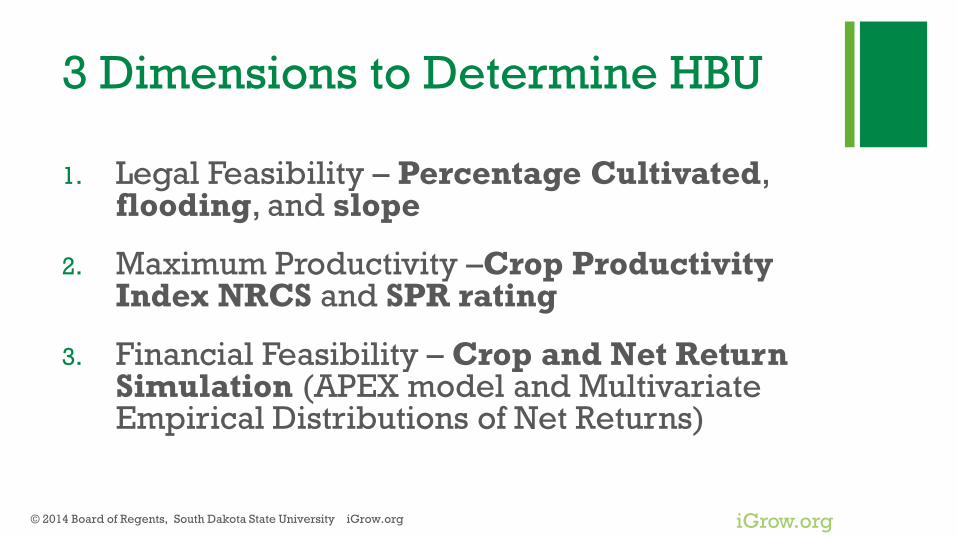
Results of Machine Learning Classification
on Dimensions Analyzed
© 2014 Board of Regents, South Dakota State University iGrow.org
iGrow.org
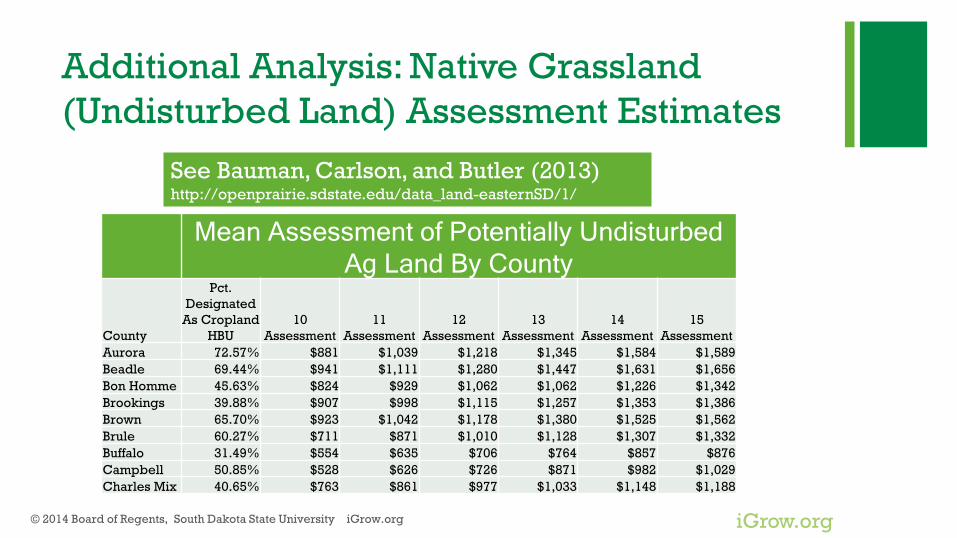
Additional Analysis: Native Grassland
(Undisturbed Land) Assessment Estimates
© 2014 Board of Regents, South Dakota State University iGrow.org
Mean Assessment of Potentially Undisturbed
Ag Land By County
County
Pct.
Designated
As Cropland
HBU
10
Assessment
11
Assessment
12
Assessment
13
Assessment
14
Assessment
15
Assessment
Aurora 72.57% $881 $1,039 $1,218 $1,345 $1,584 $1,589
Beadle 69.44% $941 $1,111 $1,280 $1,447 $1,631 $1,656
Bon Homme 45.63% $824 $929 $1,062 $1,062 $1,226 $1,342
Brookings 39.88% $907 $998 $1,115 $1,257 $1,353 $1,386
Brown 65.70% $923 $1,042 $1,178 $1,380 $1,525 $1,562
Brule 60.27% $711 $871 $1,010 $1,128 $1,307 $1,332
Buffalo 31.49% $554 $635 $706 $764 $857 $876
Campbell 50.85% $528 $626 $726 $871 $982 $1,029
Charles Mix 40.65% $763 $861 $977 $1,033 $1,148 $1,188
See Bauman, Carlson, and Butler (2013) http://openprairie.sdstate.edu/data_land-easternSD/1/
iGrow.org
Summary
Acreage shifts would likely occur
More grassland acres statewide (approx. 2-3 million soil acres)
Meade, Fall River, Harding, Haakon, Corson, Jackson, Custer, Todd, and Brown would likely see net acre changes from cropland to grassland assessment.
Lyman, Gregory, Dewey, Minnehaha, and Brookings would likely see net acre changes from grassland to cropland assessment.
© 2014 Board of Regents, South Dakota State University iGrow.org

9/18/2017 12

9/18/2017 13

9/18/2017 14

9/18/2017 15

9/18/2017 16
9/18/2017 17

9/18/2017 18

9/18/2017 19

9/18/2017 20

9/18/2017 21

9/18/2017 22

9/18/2017 23

9/18/2017 24
9/18/2017 25

9/18/2017 26
9/18/2017 27

9/18/2017 28

9/18/2017 29
9/18/2017 30

9/18/2017 31
9/18/2017 32

9/18/2017 33

9/18/2017 34

9/18/2017 35

9/18/2017 36

9/18/2017 37

9/18/2017 38

9/18/2017 39

9/18/2017 40

9/18/2017 41

9/18/2017 42
9/18/2017 43

9/18/2017 44

9/18/2017 45

9/18/2017 46

9/18/2017 47

9/18/2017 48

9/18/2017 49

9/18/2017 50

9/18/2017 51

9/18/2017 52

9/18/2017 53

9/18/2017 54

9/18/2017 55

9/18/2017 56

9/18/2017 57

9/18/2017 58

9/18/2017 59

9/18/2017 60

9/18/2017 61

9/18/2017 62

9/18/2017 63

9/18/2017 64
9/18/2017 65

9/18/2017 66
9/18/2017 67

9/18/2017 68

9/18/2017 69

9/18/2017 70

9/18/2017 71

9/18/2017 72

9/18/2017 73

9/18/2017 74

9/18/2017 75

9/18/2017 76
9/18/2017 77
9/18/2017 78

9/18/2017 79

9/18/2017 80

9/18/2017 81

9/18/2017 82

9/18/2017 83

9/18/2017 84
9/18/2017 85

9/18/2017 86

9/18/2017 87

9/18/2017 88

9/18/2017 89

9/18/2017 90

9/18/2017 91

9/18/2017 92

9/18/2017 93

9/18/2017 94
9/18/2017 95

9/18/2017 96

9/18/2017 97
9/18/2017 98

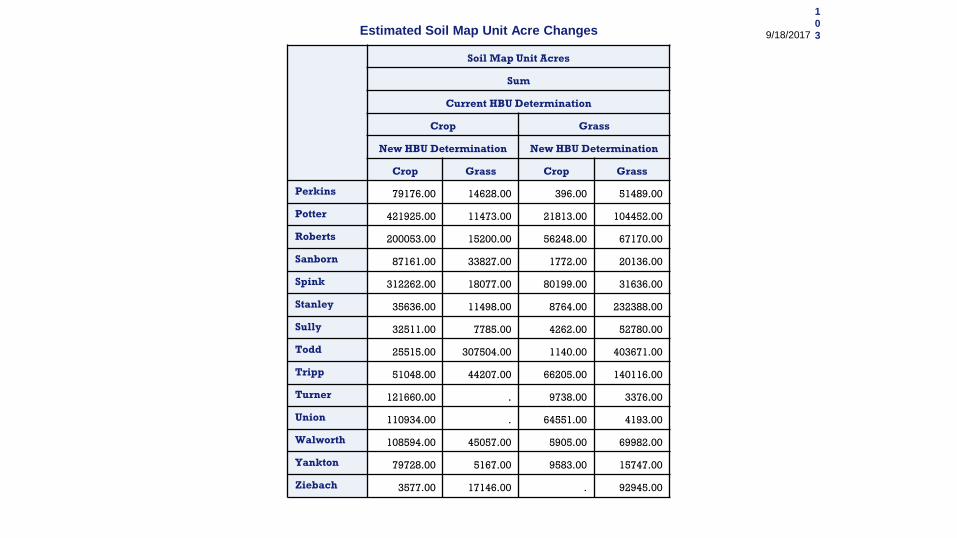
Estimated Soil Map Unit Acre Changes
Soil Map Unit Acres
Sum
Current HBU Determination
Crop Grass
New HBU Determination New HBU Determination
Crop Grass Crop Grass
NAME
833298.00 33805.00 31755.00 48793.00Aurora
Beadle 904736.00 13584.00 63182.00 98121.00
Bennett 271614.00 200763.00 16064.00 973637.00
Bon Homme
780083.00 3285.00 26556.00 111355.00
Brookings 673024.00 6165.00 113573.00 45683.00
Brown 1192468.00 525528.00 82612.00 127220.00
Brule 99551.00 23212.00 4584.00 321184.00
Buffalo 26976.00 30138.00 . 43956.00
Butte 67591.00 241270.00 3063.00 1135696.00
Campbell 146093.00 158329.00 7075.00 160847.00
Charles Mix
345089.00 8146.00 9556.00 109863.00
Clark 748185.00 38249.00 107025.00 53181.00(Continu
ed)
9/18/2017
9
9

Estimated Soil Map Unit Acre Changes
Soil Map Unit Acres
Sum
Current HBU Determination
Crop Grass
New HBU Determination New HBU Determination
Crop Grass Crop Grass
Clay 455854.00 . 22343.00 13557.00
Codington 593141.00 8656.00 36094.00 71816.00
Corson 614666.00 573092.00 6367.00 1346128.00
Custer 130392.00 566533.00 18186.00 2162411.00
Davison 216654.00 11549.00 8064.00 17809.00
Day 247806.00 18474.00 95503.00 198177.00
Deuel 229558.00 553.00 34590.00 61007.00
Dewey 81686.00 194824.00 2778.00 432347.00
Douglas 18426.00 659.00 3251.00 1840.00
Edmunds 146942.00 97397.00 6625.00 150467.00
Fall River 7801.00 232432.00 . 256197.00
Faulk 481268.00 139616.00 8276.00 122586.00
Grant 465160.00 17896.00 38477.00 35961.00
(Continu
ed)
9/18/2017
1
0
0

Estimated Soil Map Unit Acre Changes
Soil Map Unit Acres
Sum
Current HBU Determination
Crop Grass
New HBU Determination New HBU Determination
Crop Grass Crop Grass
Gregory 172833.00 17222.00 222228.00 554008.00
Haakon 633735.00 227098.00 8991.00 1430084.00
Hamlin 64862.00 19.00 50022.00 4893.00
Hand 248480.00 102954.00 40869.00 87597.00
Hanson 146227.00 982.00 34181.00 4367.00
Harding 71733.00 142427.00 . 544589.00
Hughes 665154.00 47649.00 42184.00 123477.00
Hutchinson 14351.00 . 1322.00 .
Hyde 176067.00 73813.00 2788.00 60324.00
Jackson 18635.00 239118.00 47.00 844047.00
Jerauld 51547.00 36628.00 . 34630.00
Jones 50527.00 28115.00 74678.00 210112.00
Kingsbury 202231.00 5335.00 17661.00 10721.00
(Continu
ed)
9/18/2017
1
0
1

Estimated Soil Map Unit Acre Changes
Soil Map Unit Acres
Sum
Current HBU Determination
Crop Grass
New HBU Determination New HBU Determination
Crop Grass Crop Grass
Lake 326594.00 2598.00 109505.00 14221.00
Lawrence 40618.00 33570.00 13.00 318739.00
Lincoln 245635.00 . 98028.00 10111.00
Lyman 111750.00 33680.00 256769.00 414003.00
Marshall 91897.00 8679.00 35856.00 93034.00
McCook 28674.00 . 42906.00 22782.00
McPherson 75662.00 138508.00 762.00 49596.00
Meade 149478.00 497080.00 13415.00 622016.00
Mellette 63437.00 59217.00 10849.00 336232.00
Miner 82405.00 14465.00 527.00 23905.00
Minnehaha 208020.00 1255.00 125741.00 21273.00
Moody 195845.00 282.00 10657.00 9397.00
Pennington 11849.00 89427.00 260.00 118494.00
(Continu
ed)
9/18/2017
1
0
2
Estimated Soil Map Unit Acre Changes
Soil Map Unit Acres
Sum
Current HBU Determination
Crop Grass
New HBU Determination New HBU Determination
Crop Grass Crop Grass
Perkins 79176.00 14628.00 396.00 51489.00
Potter 421925.00 11473.00 21813.00 104452.00
Roberts 200053.00 15200.00 56248.00 67170.00
Sanborn 87161.00 33827.00 1772.00 20136.00
Spink 312262.00 18077.00 80199.00 31636.00
Stanley 35636.00 11498.00 8764.00 232388.00
Sully 32511.00 7785.00 4262.00 52780.00
Todd 25515.00 307504.00 1140.00 403671.00
Tripp 51048.00 44207.00 66205.00 140116.00
Turner 121660.00 . 9738.00 3376.00
Union 110934.00 . 64551.00 4193.00
Walworth 108594.00 45057.00 5905.00 69982.00
Yankton 79728.00 5167.00 9583.00 15747.00
Ziebach 3577.00 17146.00 . 92945.00
9/18/2017
1
0
3