Embed Size (px)
Citation preview

Higher Level Skills Needs in London
Alison Morris
Rachel Pinto
January 2013
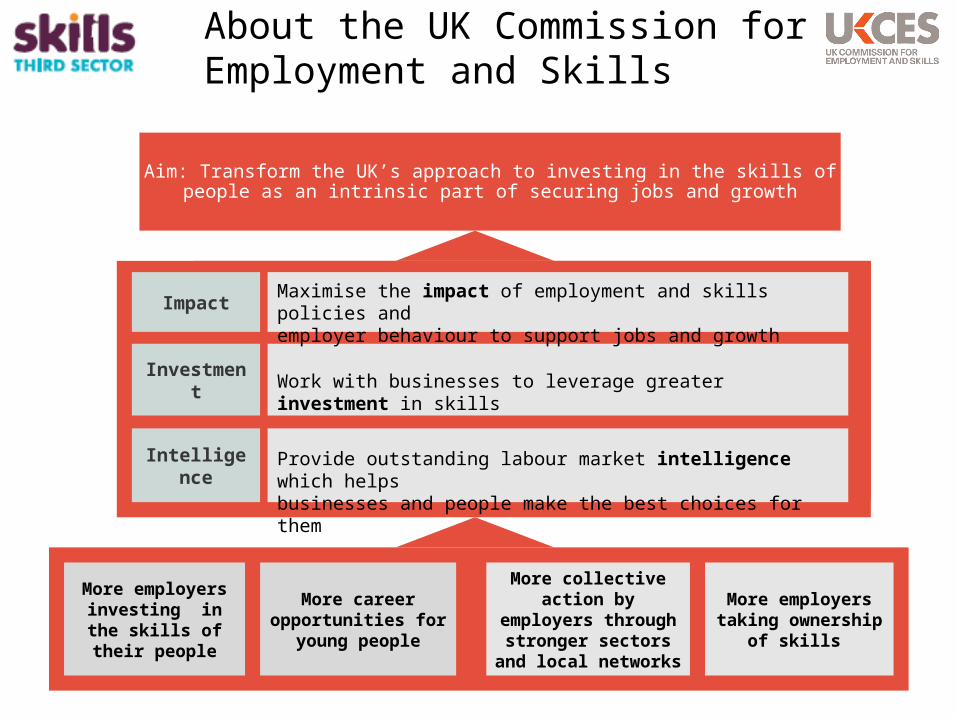
About the UK Commission for Employment and Skills
More employers investing in the
skills of their people
More employers taking ownership of
skills
More career opportunities for
young people
More collective action by employers through stronger sectors and
local networks
Provide outstanding labour market intelligence which helps businesses and people make the best choices for them
Maximise the impact of employment and skills policies and employer behaviour to support jobs and growth
Work with businesses to leverage greater investment in skills
Impact
Investment
Intelligence
Aim: Transform the UK’s approach to investing in the skills of people as an intrinsic part of securing jobs and growth

Our Commissioners
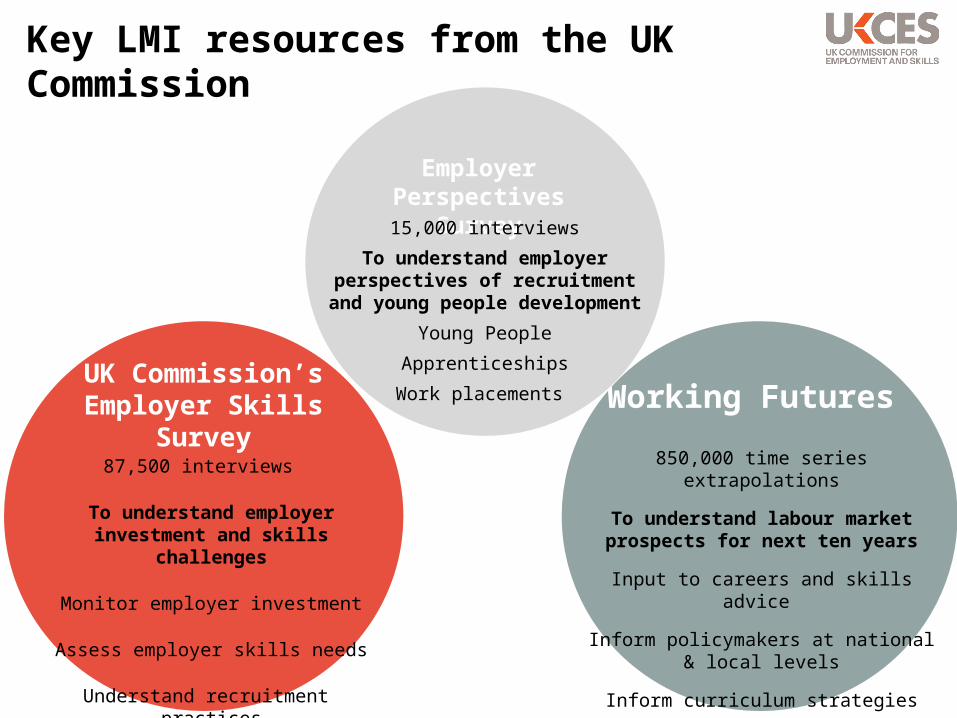
Key LMI resources from the UK Commission
UK Commission’s Employer Skills
Survey87,500 interviews
To understand employer investment and skills challenges
Monitor employer investment
Assess employer skills needs
Understand recruitment practices
Working Futures
850,000 time series extrapolations
To understand labour market prospects for next ten years
Input to careers and skills advice
Inform policymakers at national & local levels
Inform curriculum strategies
Employer Perspectives
Survey15,000 interviews
To understand employer perspectives of recruitment and
young people development
Young People
Apprenticeships
Work placements
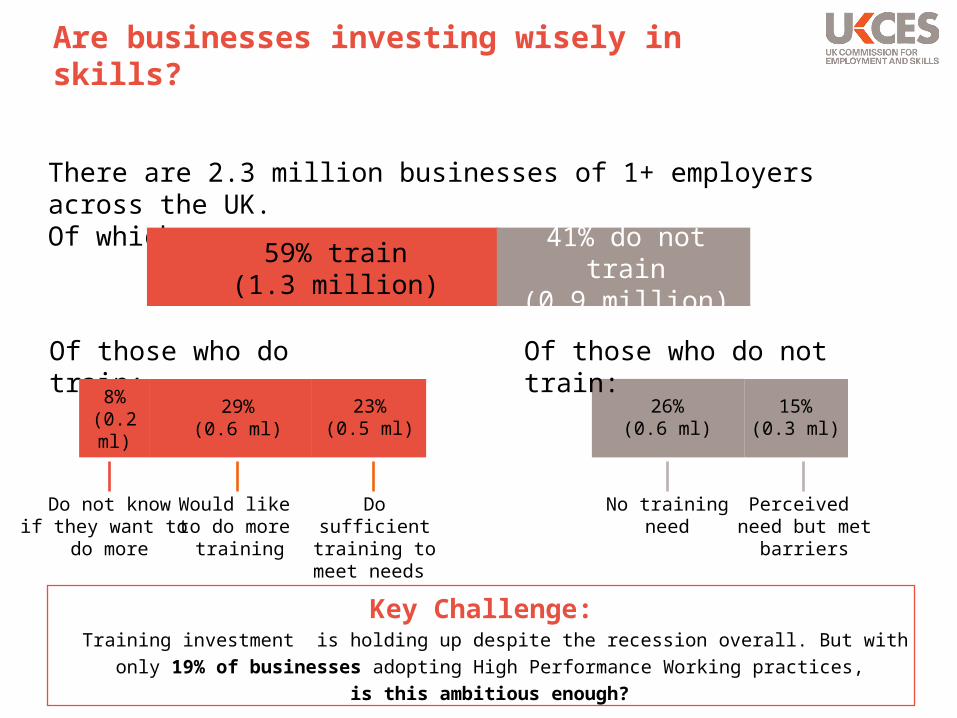
Are businesses investing wisely in skills?
There are 2.3 million businesses of 1+ employers across the UK. Of which...
59% train(1.3 million)
41% do not train(0.9 million)
Of those who do train:
23%(0.5 ml)
29%(0.6 ml)
8%(0.2 ml)
Do not knowif they want to
do more
Would like to do more
training
Do sufficienttraining to
meet needs
26%(0.6 ml)
15%(0.3 ml)
No trainingneed
Perceived need but met
barriers
Of those who do not train:
Key Challenge:Training investment is holding up despite the recession overall. But with only 19% of businesses
adopting High Performance Working practices,
is this ambitious enough?
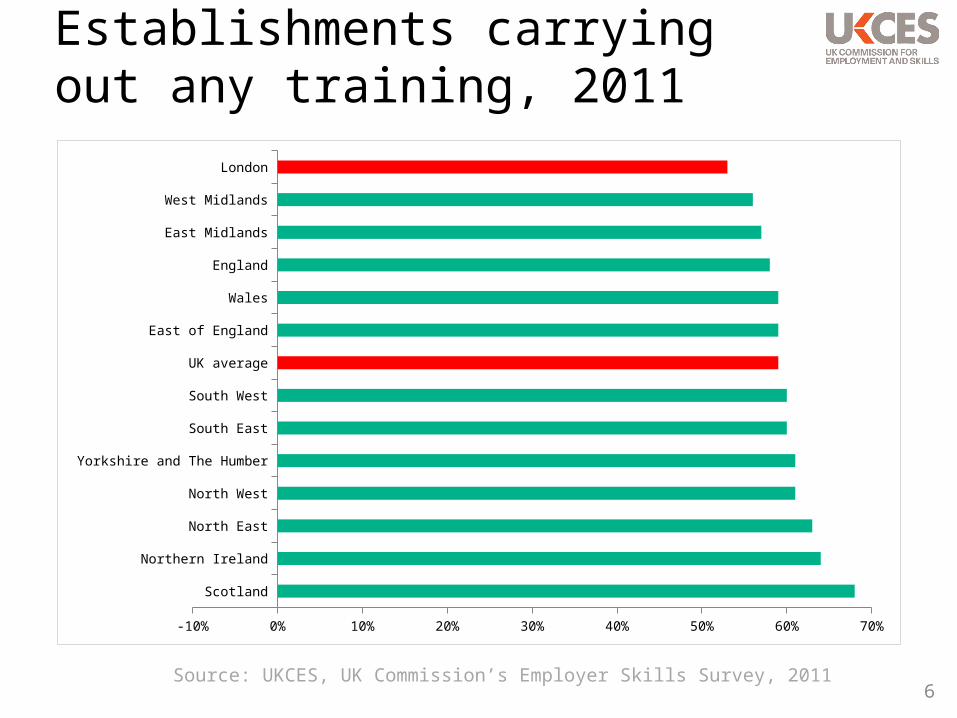
Establishments carrying out any training, 2011
6
Scotland
Northern Ireland
North East
North West
Yorkshire and The Humber
South East
South West
UK average
East of England
Wales
England
East Midlands
West Midlands
London
-10% 0% 10% 20% 30% 40% 50% 60% 70%
Source: UKCES, UK Commission’s Employer Skills Survey, 2011
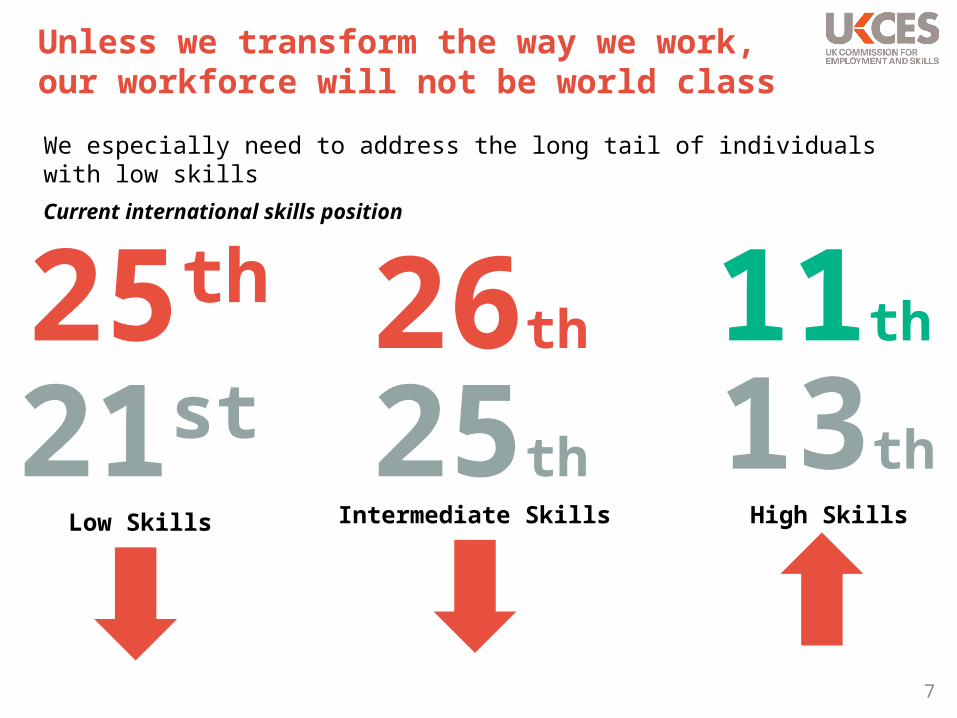
Unless we transform the way we work, our workforce will not be world class
7
We especially need to address the long tail of individuals with low skills
Low Skills Intermediate Skills High Skills
Current international skills position
21st 25th 13th
25th 26th 11th
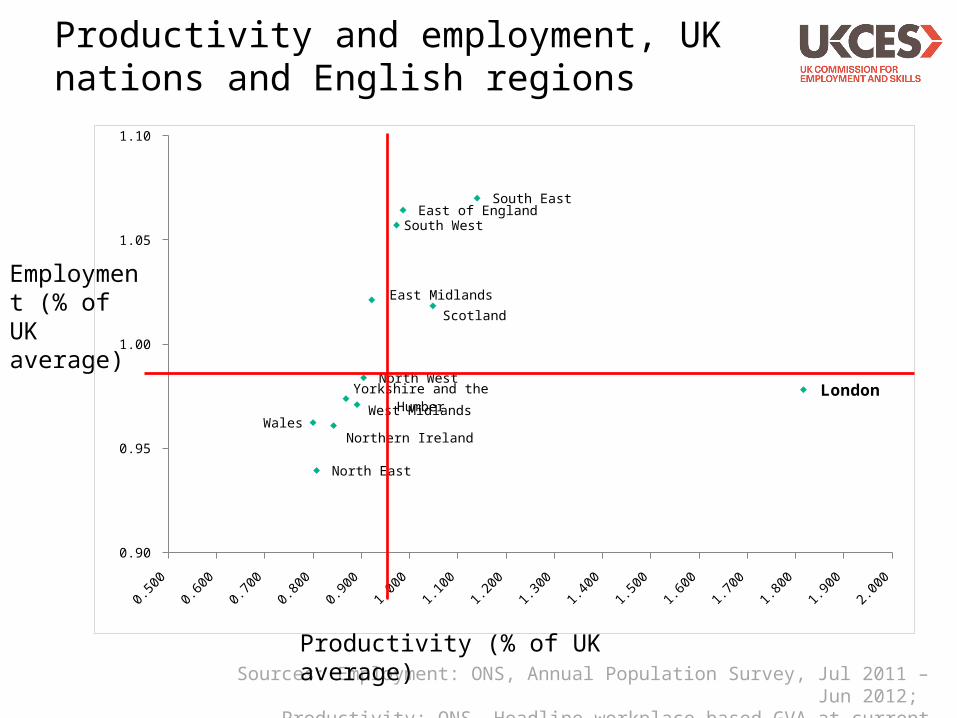
Productivity and employment, UK nations and English regions
0.500 0.600 0.700 0.800 0.900 1.000 1.100 1.200 1.300 1.400 1.500 1.600 1.700 1.800 1.900 2.000 0.90
0.95
1.00
1.05
1.10
North East
North West
Yorkshire and the Humber
East Midlands
West Midlands
East of England
London
South East
South West
Wales
Scotland
Northern Ireland
Sources: Employment: ONS, Annual Population Survey, Jul 2011 – Jun 2012;
Productivity: ONS, Headline workplace based GVA at current basic prices
Productivity (% of UK average)
Employment (% of UK average)
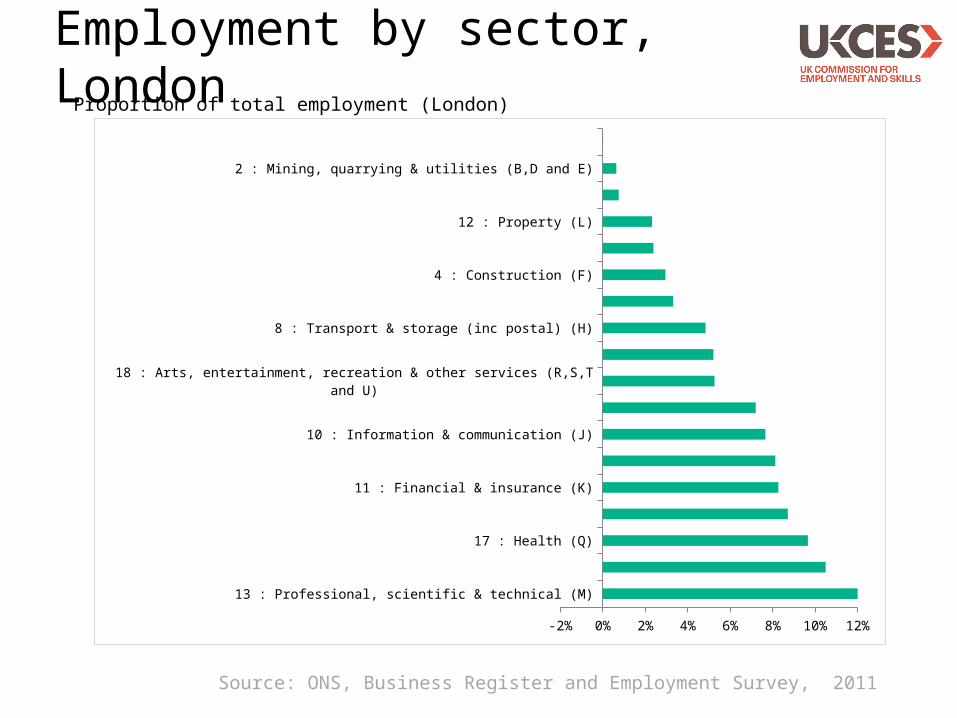
Employment by sector, London
Source: ONS, Business Register and Employment Survey, 2011
13 : Professional, scientific & technical (M)
14 : Business administration & support services (N)
17 : Health (Q)
7 : Retail (Part G)
11 : Financial & insurance (K)
16 : Education (P)
10 : Information & communication (J)
9 : Accommodation & food services (I)
18 : Arts, entertainment, recreation & other services (R,S,T and U)
15 : Public administration & defence (O)
8 : Transport & storage (inc postal) (H)
6 : Wholesale (Part G)
4 : Construction (F)
3 : Manufacturing (C)
12 : Property (L)
5 : Motor trades (Part G)
2 : Mining, quarrying & utilities (B,D and E)
1 : Agriculture, forestry & fishing (A)
-2% 0% 2% 4% 6% 8% 10% 12%
Proportion of total employment (London)

Employment by occupation, London
Source: ONS, Business Register and Employment Survey, 2011
Professionals
Associate professionals
Managers
Admin. & secretarial
Elementary occupations
Skilled trades
Caring, leisure and other services
Sales and customer services
Process, plant and machine operatives
0% 5% 10% 15% 20% 25%
Proportion of total employment (London)
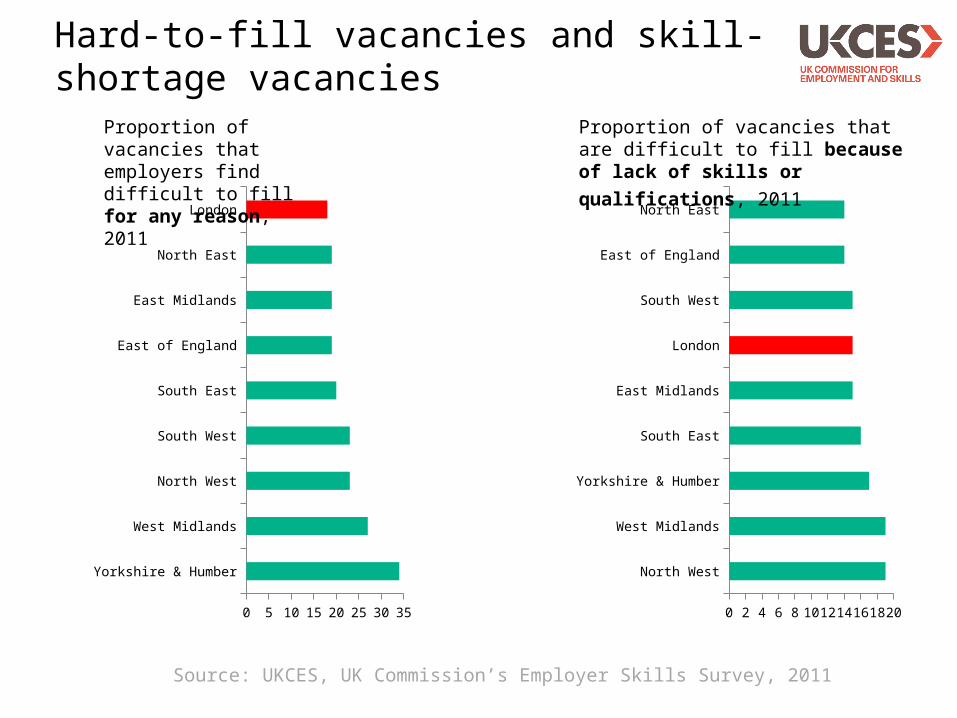
Hard-to-fill vacancies and skill-shortage vacancies
Yorkshire & Humber
West Midlands
North West
South West
South East
East of England
East Midlands
North East
London
0 5 10 15 20 25 30 35
Proportion of vacancies that employers find difficult to fill for any reason, 2011
North West
West Midlands
Yorkshire & Humber
South East
East Midlands
London
South West
East of England
North East
0 2 4 6 8 10 12 14 16 18 20
Proportion of vacancies that are difficult to fill because of lack of skills or
qualifications, 2011
Source: UKCES, UK Commission’s Employer Skills Survey, 2011
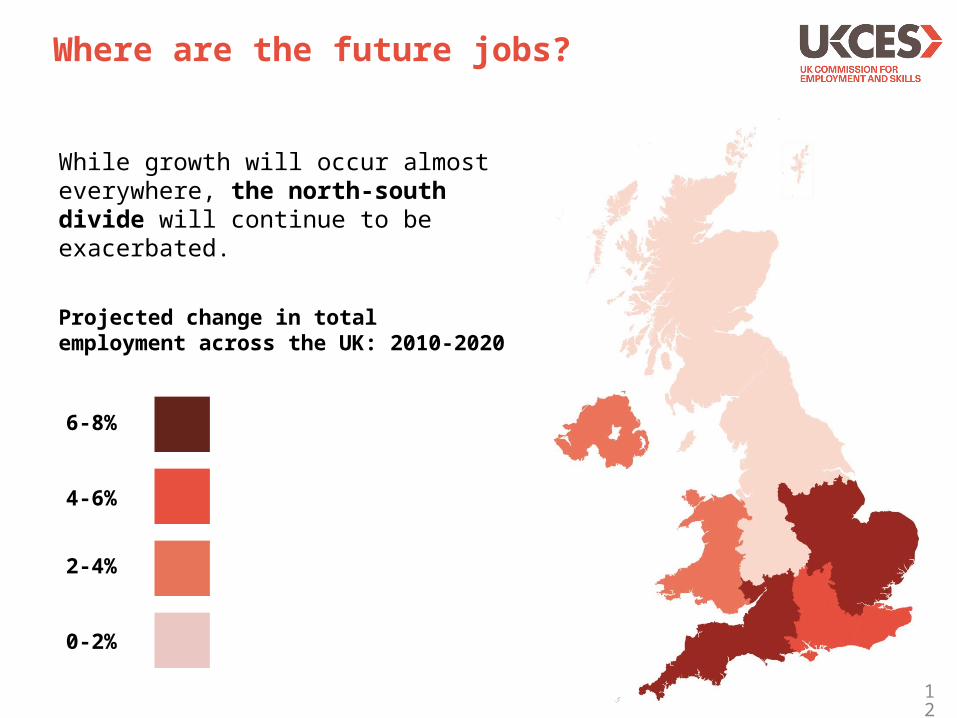
Where are the future jobs?
12
While growth will occur almost everywhere, the north-south divide will continue to be exacerbated.
Projected change in total employment across the UK: 2010-2020
6-8%
4-6%
2-4%
0-2%

Future employment needs - but where will the growth come from in London?
Projected UK employment change by sector (% change) in London and England between 2010-2020
Change(‘000s)
-13-137
-7-80
3-5
21194
73329
2791,083
Sector
Manufacturing
Non-market Services
Primary Sector & Utilities
Construction
Trade accommodation & transport
Business & other services
13
(Source: Working Futures)
% change
London
England
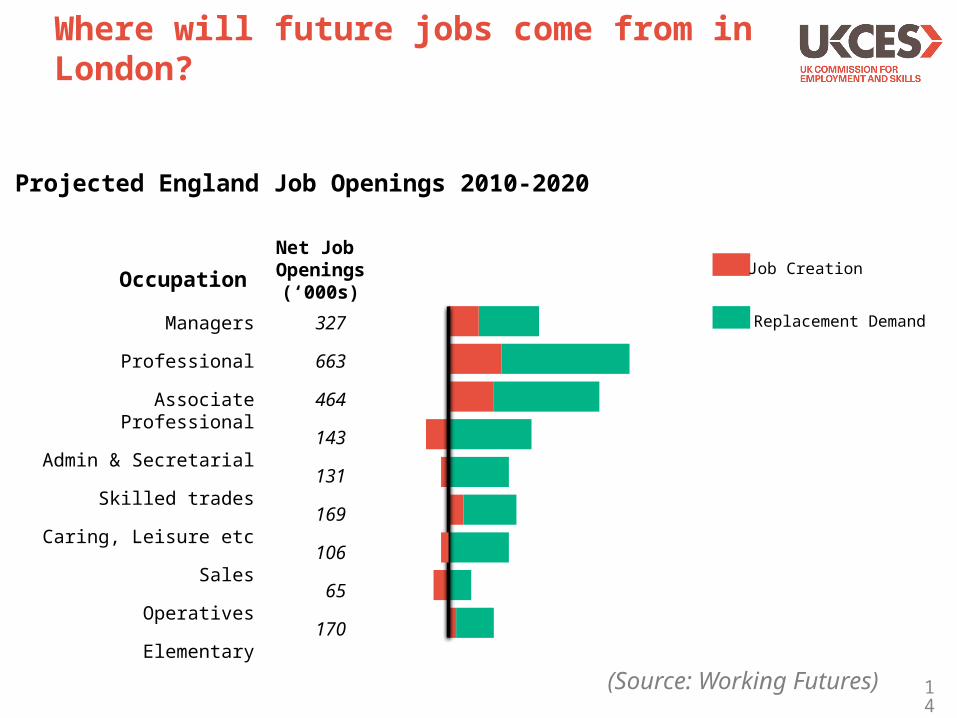
Where will future jobs come from in London?
14
Net Job Openings
(‘000s)Occupation
Managers
Professional
Associate Professional
Admin & Secretarial
Skilled trades
Caring, Leisure etc
Sales
Operatives
Elementary
327
663
464
143
131
169
106
65
170
Projected England Job Openings 2010-2020
Job Creation
Replacement Demand
(Source: Working Futures)
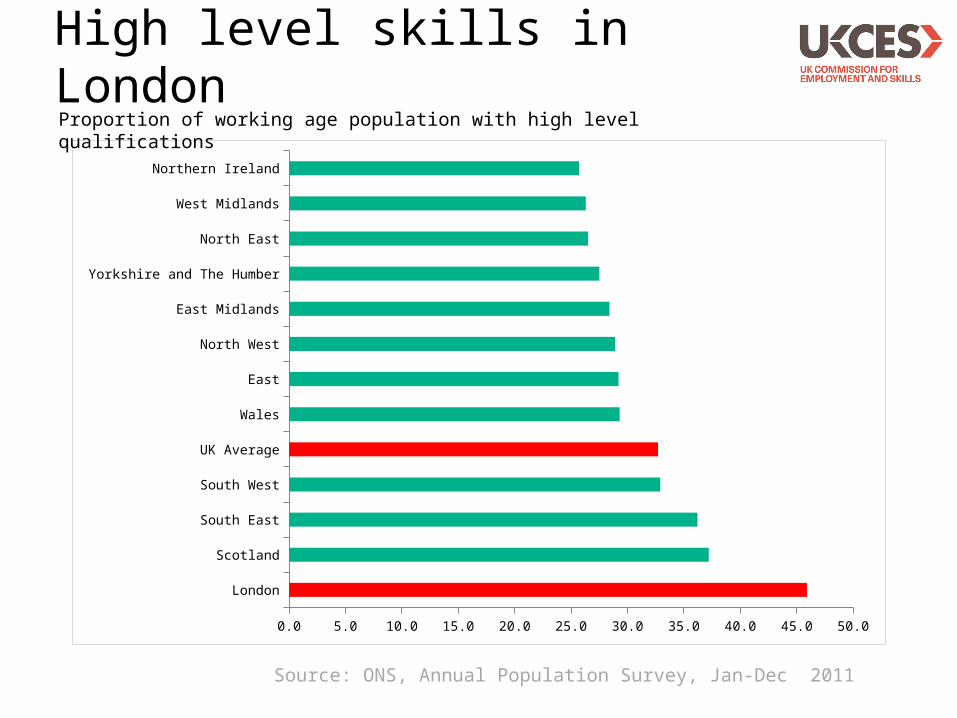
High level skills in London
London
Scotland
South East
South West
UK Average
Wales
East
North West
East Midlands
Yorkshire and The Humber
North East
West Midlands
Northern Ireland
0.0 5.0 10.0 15.0 20.0 25.0 30.0 35.0 40.0 45.0 50.0
Proportion of working age population with high level qualifications
Source: ONS, Annual Population Survey, Jan-Dec 2011
16
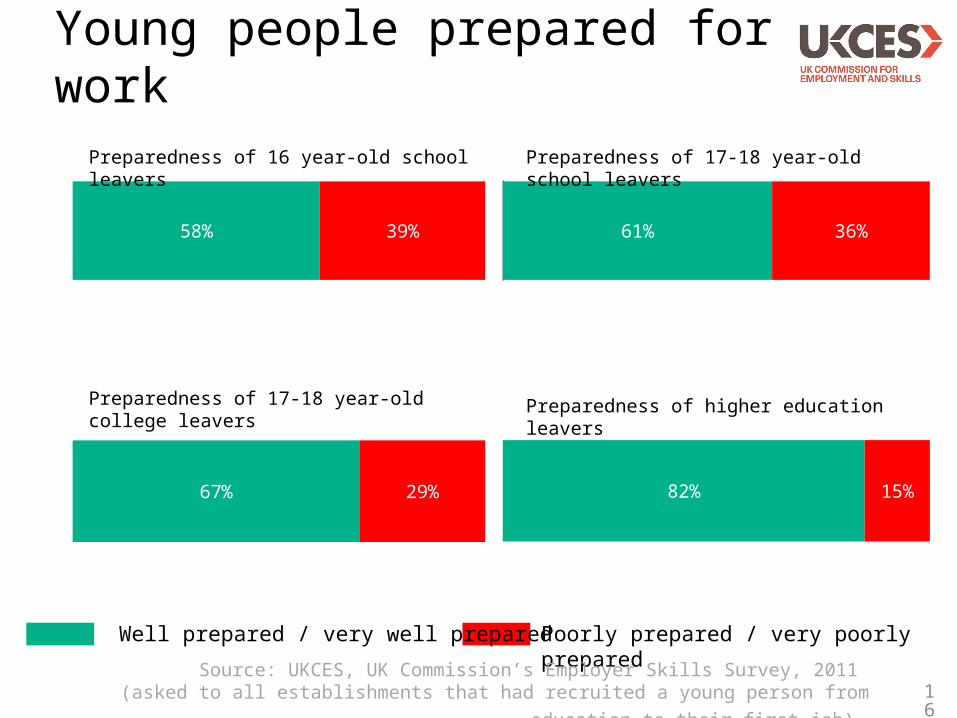
Young people prepared for work
Well prepared / very well prepared Poorly prepared / very poorly prepared
Source: UKCES, UK Commission’s Employer Skills Survey, 2011
(asked to all establishments that had recruited a young person from education to their first job)
58% 39% 61% 36%
67% 29%
Preparedness of 16 year-old school leavers Preparedness of 17-18 year-old school leavers
Preparedness of 17-18 year-old college leavers Preparedness of higher education leavers
82% 15%
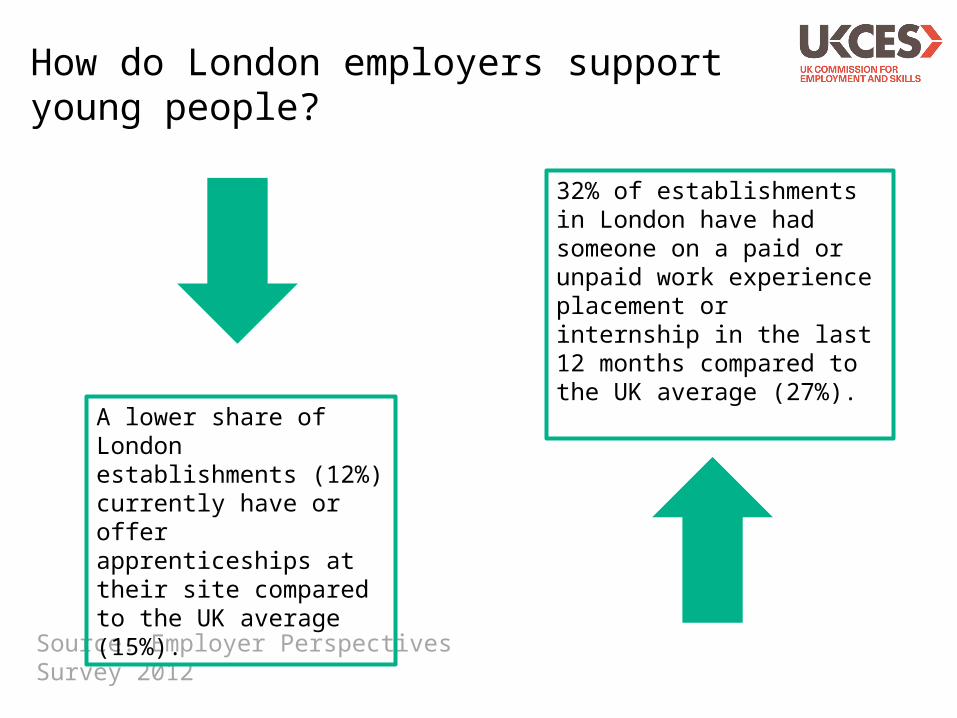
How do London employers support young people?
Source: Employer Perspectives Survey 2012
32% of establishments in London have had someone on a paid or unpaid work experience placement or internship in the last 12 months compared to the UK average (27%).
A lower share of London establishments (12%) currently have or offer apprenticeships at their site compared to the UK average (15%).
Conclusions
18
• London has high productivity and low employment compared to the rest of the UK
• Most net job creation is expected in high level occupations
• London has a higher proportion of people with high level qualifications than the UK average
• London has a lower proportion of hard to fill vacancies than other regions
• But a relatively high proportion of these are due to skills shortages
• A lower proportion of London employers train their staff than the UK average and a lower proportion arranged training that leads to a qualification

Discussion
• Do you recognise this picture of London?
• What could the data be used for?
• What are the challenges in using data?
• How can we support and increase use?

Links and contact details
Information about our LMIhttp://www.ukces.org.uk/ourwork/research/lmi
ESS Local Datahttp://www.ukces.org.uk/local-data
Employer surveyshttp://www.ukces.org.uk/ourwork/employer-surveys
Accessing the [email protected]
Alison Morris – [email protected] Pinto – [email protected]
20


![Welcome [] · Adrienne Dunne, Jim Stewart-Evans, Karen Exley, Sarah Robertson, Rachel Moll, Alison Gowers, John Harrison, Paul Cosford. • PHE’s Air Pollution and Public Health](https://img.pdfslide.us/doc/110x75/5f48d086a750e41d4377c707/welcome-adrienne-dunne-jim-stewart-evans-karen-exley-sarah-robertson-rachel.jpg)