Embed Size (px)
Citation preview

1
Higher Education Students and Qualifiers at Scottish Institutions 2013-14
Issue date: Reference: Summary: FAO:
25 March 2015 SFC/ST/04/2015 To provide the latest information about HE students and qualifiers at Scottish Institutions. Principals and directors of Scotland’s colleges and/or universities
Further information: Contact: Stephen Riddell
Job title: Senior Policy/Analysis Officer Department: Funding Policy Tel: 0131 313 6658 Email: [email protected]
Scottish Funding Council Apex 2
97 Haymarket Terrace Edinburgh EH12 5HD
T 0131 313 6500 F 0131 313 6501
www.sfc.ac.uk
The UK Statistics Authority has designated these statistics as National Statistics, in accordance with the Statistics and Registration Service Act 2007 and signifying compliance with the Code of Practice for Official Statistics.

2
Contents : Page:
Contents 2
List of Tables 3
Summary of Key Findings 4
Student numbers and characteristics 5
Student entrant numbers and characteristics 11
Access and Equalities 17
Qualifiers 22
Participation Rates for Entrants to Scottish Higher Education 28
Notes to Tables 31
Methodology, Data Definitions, and Quality Information 35
Complete list of tables available on SFC website 45

3
List of Tables Page: Table A: Students in higher education at Scottish HEIs and colleges by 7 institution type and level of study, 2004-05 to 2013-14 Table B: Students in higher education in Scottish HEIs and colleges by 9 mode of study and gender, 2004-05 to 2013-14 Table C: Students in higher education in Scottish HEIs and colleges 10 by age, 2004-05 to 2013-14 Table D: Entrants to higher education in Scottish HEIs and colleges 12 by level of study and academic year, 2004-05 to 2013-14 Table E: Entrants to higher education in Scottish HEIs and colleges 13 in 2013-14 by subject and gender Table F: Entrants in higher education at Scottish HEIs and colleges 17 by domicile and level of study, 2004-05 to 2013-14 Table G: Students in higher education at Scottish HEIs and colleges 18 by detailed level of study and ethnicity, 2013-14 Table H: Scottish domiciled entrants from Deprived Areas to Higher Education in 20
the UK by institution type and academic year, 2004-05 to 2013-14 Table I: Qualifiers from higher education courses at Scottish HEIs and 23 Colleges by institution type, level of qualification and academic year, 2004-05 to 2013-14 Table J: Qualifiers from higher education courses at Scottish HEIs and 26 colleges by age, 2004-05 to 2013-14 Table K: Qualifiers from higher education courses at Scottish HEIs and 26 Colleges by pre-study domicile and academic year, 2004-05 to 2013-14 Table L: Qualifiers from Higher Education courses at Scottish HEIs and 27 Colleges by mode of study and gender, 2004-05 to 2013-14 Table M: Higher Education Initial Participation Rate, 2012-13 and 28 2013-14 Table N: Young Participation Rate for 2006 to 2013 Cohort 29

4
Higher Education Students and Qualifiers at Scottish Institutions 2013-14
An Official Statistics Publication for Scotland
25 March 2015
1. Statistics on students and qualifiers on Higher Education (HE) courses at Scottish institutions in 2013-14 are published today by the Scottish Funding Council (SFC). This is the third issue of the publication produced by the Scottish Funding Council and covers the period 2004-05 to 2013-14. The release contains information on HE provision and attainment in higher education institutions (HEIs) and colleges in Scotland.
2. This is a summary report outlining the main trends over the past ten years. The publication is accompanied by an Excel workbook which includes additional tables not included within this report. The list of tables available in this workbook appears at the back of this document. These tables can be found on the SFC website at:
http://www.sfc.ac.uk/PublicationsStatistics/reportspublications/reportspublications.aspx
Student Enrolments
Users of this publication should note that, where reference is made to students, this relates to student enrolments (or instances of study).
Summary of Key Findings
• There were 97,340 higher education qualifiers from Scottish institutions in 2013-14, which is the highest level recorded to date. There was an increase of 1,765 (1.9% from 2012-13 and 20.1% from 2004-05. In 2013-14, Scottish-domiciled students accounted for 70.4% of all qualifiers.
• Of all qualifiers in 2013-14, 65.5% achieved graduate level qualifications (first degree level or above) which were mainly achieved at HEIs. At Scottish colleges, 70.7% of qualifications gained were at HNC/HND level.
• In 2013-14, there were 279,495 students in higher education in Scotland, an increase of 750 (0.3%) compared to 2012-13.
• Over the period 2004-05 to 2013-14 the percentage of student entrants from outside of the UK has grown, increasing from 11.7% in 2004-05 to 18.8% in 2013-14.
5
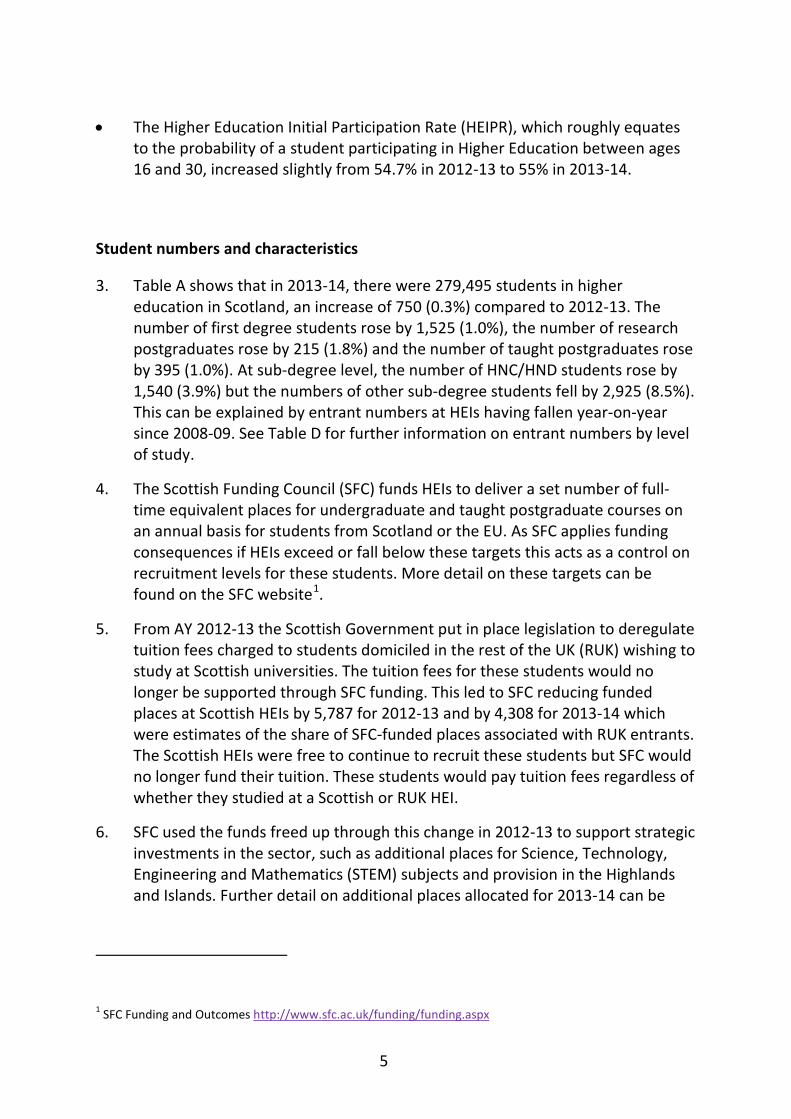
• The Higher Education Initial Participation Rate (HEIPR), which roughly equates
to the probability of a student participating in Higher Education between ages 16 and 30, increased slightly from 54.7% in 2012-13 to 55% in 2013-14.
Student numbers and characteristics
3. Table A shows that in 2013-14, there were 279,495 students in higher education in Scotland, an increase of 750 (0.3%) compared to 2012-13. The number of first degree students rose by 1,525 (1.0%), the number of research postgraduates rose by 215 (1.8%) and the number of taught postgraduates rose by 395 (1.0%). At sub-degree level, the number of HNC/HND students rose by 1,540 (3.9%) but the numbers of other sub-degree students fell by 2,925 (8.5%). This can be explained by entrant numbers at HEIs having fallen year-on-year since 2008-09. See Table D for further information on entrant numbers by level of study.
4. The Scottish Funding Council (SFC) funds HEIs to deliver a set number of full-time equivalent places for undergraduate and taught postgraduate courses on an annual basis for students from Scotland or the EU. As SFC applies funding consequences if HEIs exceed or fall below these targets this acts as a control on recruitment levels for these students. More detail on these targets can be found on the SFC website1.
5. From AY 2012-13 the Scottish Government put in place legislation to deregulate tuition fees charged to students domiciled in the rest of the UK (RUK) wishing to study at Scottish universities. The tuition fees for these students would no longer be supported through SFC funding. This led to SFC reducing funded places at Scottish HEIs by 5,787 for 2012-13 and by 4,308 for 2013-14 which were estimates of the share of SFC-funded places associated with RUK entrants. The Scottish HEIs were free to continue to recruit these students but SFC would no longer fund their tuition. These students would pay tuition fees regardless of whether they studied at a Scottish or RUK HEI.
6. SFC used the funds freed up through this change in 2012-13 to support strategic investments in the sector, such as additional places for Science, Technology, Engineering and Mathematics (STEM) subjects and provision in the Highlands and Islands. Further detail on additional places allocated for 2013-14 can be
1 SFC Funding and Outcomes http://www.sfc.ac.uk/funding/funding.aspx

6
found on the SFC website2.
7. Although this meant fewer funded places overall the number of entrants to HEIs for 2013-14 rose as RUK students continued to choose Scotland as a place to study knowing they would no longer have their study costs paid by SFC.
8. We have again observed an increase in entrants in 2013-14 amongst both the Scottish-domiciled and RUK cohorts. Table F, later in this publication, provides further information.
9. Table A also shows that for higher education institutions (HEIs) as a whole, the number of students reduced marginally by 145 (or 0.06%) since 2012-13 but the number of students participating in HE in colleges rose, by 895 (1.9%).
10. The fall in HEI students relates to sub degree students, which can be explained by entrants to these courses at HEIs reducing year-on-year since a peak in 2008-09. Meanwhile, recruitment to HNC/HND, First Degree, Postgraduate Taught and Postgraduate Research course all increased between 2012-13 and 2013-14, as detailed in paragraph 23 of this report. This means that, despite a reduction in sub-degree entrants, overall entrant numbers to HEIs increased by 930 (1%) between 2012-13 and 2013-14.
11. The rise in college numbers is partly a result of SFC providing additional funded student places to colleges and HEIs with the first 2 years being delivered at college before the student completes their degree at University. Our college baseline report3 provides more detail on students studying HE courses at college.
12. SFC has also published performance indicators4 for those students studying HE courses at college.
13. Table A shows that HEIs accounted for 82.6% of all students enrolled in HE in Scotland in 2013-14, with the remaining 17.4% studying in colleges. While a majority of those at HEIs (65.6%) were studying at first degree level, most students studying HE at colleges (97.7%) were studying at HNC/D level.
14. Further information on the destination of graduates from first degree
2 SFC Outcome Agreements: Indicative Funding Decisions for 2013-14: http://www.sfc.ac.uk/web/FILES/Circulars_SFC1812/SFC1812.pdf 3 College Baseline Report 2013-14: http://www.sfc.ac.uk/communications/Statisticalpublications/2015/SFCST012015.aspx 4 College Performance Indicators 2013-14: http://www.sfc.ac.uk/communications/Statisticalpublications/2015/SFCST022015.aspx

7
programmes is available from the HESA website5. These figures show the proportion of graduates who gain employment on completing their course or who progress to further study.
15. Taught Postgraduate student numbers increased by 395 in 2013-14, a 1% increase on 2012-13. Taught Postgraduate student numbers had previously fallen between 2010-11 and 2012-13.
16. Figures 1 and 2 below provide an overview of student numbers by level and by institution type for AY 2013-14. These provide a useful snapshot of HE activity across the qualification levels and institution types.
Table A: Students in higher education at Scottish HEIs & colleges by institution type and level of study, 2004-05 to 2013-14
5 HESA Destination of Leavers from Higher Education statistics: https://www.hesa.ac.uk/index.php?option=com_content&view=article&id=1899&Itemid=634
All Levels First Degree
ResearchPostgraduate
(1)
TaughtPostgraduate
HNC/HND Othersub-degree
Total
2004-05 270,260 8,420 35,100 133,105 41,800 51,825 2005-06 273,050 8,650 38,675 136,105 41,550 48,070 2006-07 279,560 9,360 43,035 133,740 39,265 54,160 2007-08 272,625 9,615 42,265 132,260 38,755 49,730 2008-09 279,615 9,935 42,760 137,720 39,105 50,095
2009-10 287,565 10,665 44,285 146,175 41,230 45,205 2010-11 290,000 11,325 45,255 149,715 42,315 41,390 2011-12 281,630 11,660 43,280 149,350 41,345 35,990 2012-13 (2) 278,745 11,965 41,530 150,935 39,745 34,565
2013-14 (2) 279,495 12,180 41,925 152,460 41,285 31,640
All students at HEIs
2004-05 217,945 8,420 34,930 132,595 4,780 37,215 2005-06 222,090 8,650 38,535 135,470 4,445 34,990 2006-07 230,100 9,360 42,880 133,180 4,345 40,330 2007-08 224,855 9,615 42,115 131,645 5,085 36,395 2008-09 231,260 9,935 42,660 137,040 4,745 36,875
2009-10 237,765 10,665 44,165 145,535 4,540 32,855 2010-11 238,645 11,325 45,155 148,770 4,120 29,275 2011-12 233,010 11,660 43,245 148,425 3,875 25,800 2012-13 (2) 230,950 11,965 41,515 149,860 3,605 24,005
2013-14 (2) 230,805 12,180 41,925 151,325 4,905 20,470
All students at colleges
2004-05 52,315 - 170 510 37,015 14,610 2005-06 50,960 - 140 635 37,105 13,075 2006-07 49,460 - 155 555 34,920 13,830 2007-08 47,770 - 150 615 33,670 13,335 2008-09 48,355 - 100 680 34,360 13,175
2009-10 49,800 - 120 640 36,690 12,355 2010-11 51,355 - 100 945 38,195 12,115 2011-12 48,620 - 35 925 37,465 10,190 2012-13 (2) 47,795 - 15 1,075 36,140 10,560
2013-14 (2) 48,690 - - 1,135 36,380 11,175
Level of Study
Institution Type /Academic Session
Postgraduate Sub-degree

8
Source: Higher Education Statistics Agency (HESA) and Scottish Funding Council (SFC).Refer to Notes to Tables.
Figure 1 Students in higher education at Scottish HEIs and colleges by level of study, 2013-14
Figure 2 Share of HE students at Scottish institutions by institution type, 2013-14
Research Postgraduate
12,180 4%
Taught
Postgraduate 41,925
15%
First Degree 152,460
55%
HNC/HND 41,285
15%
Other sub-degree 31,640
11%
9
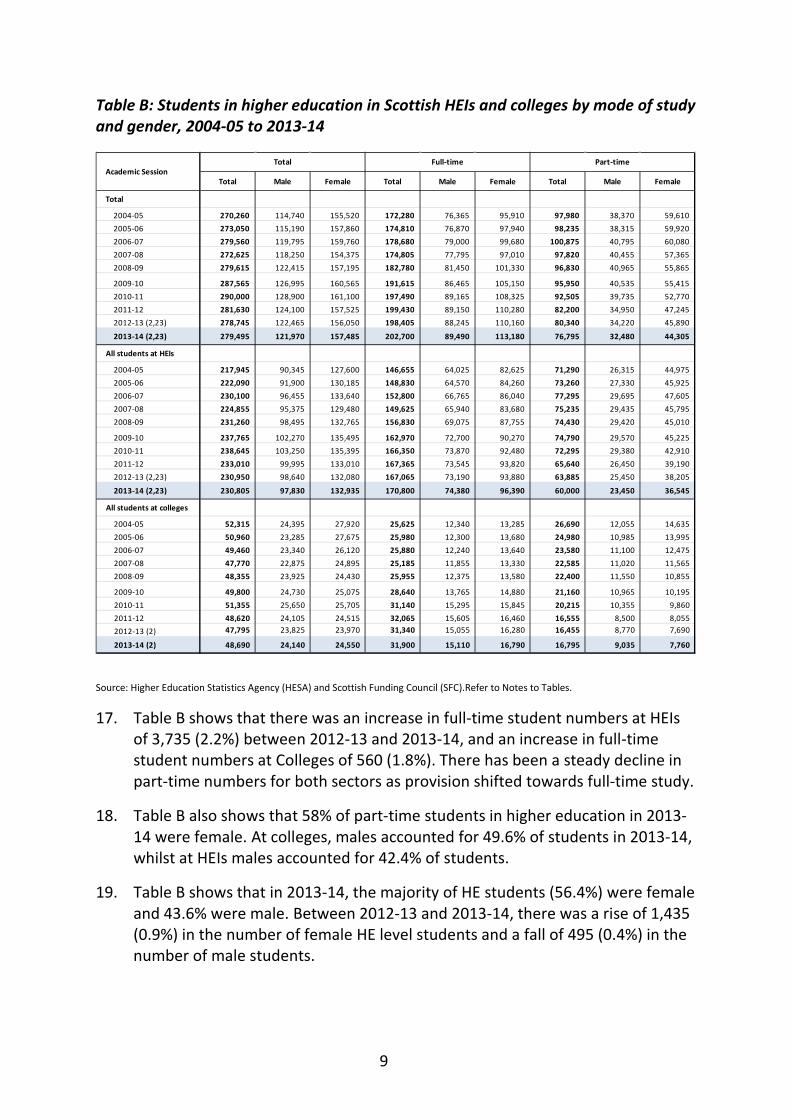
Table B: Students in higher education in Scottish HEIs and colleges by mode of study and gender, 2004-05 to 2013-14
Source: Higher Education Statistics Agency (HESA) and Scottish Funding Council (SFC).Refer to Notes to Tables.
17. Table B shows that there was an increase in full-time student numbers at HEIs of 3,735 (2.2%) between 2012-13 and 2013-14, and an increase in full-time student numbers at Colleges of 560 (1.8%). There has been a steady decline in part-time numbers for both sectors as provision shifted towards full-time study.
18. Table B also shows that 58% of part-time students in higher education in 2013-14 were female. At colleges, males accounted for 49.6% of students in 2013-14, whilst at HEIs males accounted for 42.4% of students.
19. Table B shows that in 2013-14, the majority of HE students (56.4%) were female and 43.6% were male. Between 2012-13 and 2013-14, there was a rise of 1,435 (0.9%) in the number of female HE level students and a fall of 495 (0.4%) in the number of male students.
Total Male Female Total Male Female Total Male Female
Total
2004-05 270,260 114,740 155,520 172,280 76,365 95,910 97,980 38,370 59,610 2005-06 273,050 115,190 157,860 174,810 76,870 97,940 98,235 38,315 59,920 2006-07 279,560 119,795 159,760 178,680 79,000 99,680 100,875 40,795 60,080 2007-08 272,625 118,250 154,375 174,805 77,795 97,010 97,820 40,455 57,365 2008-09 279,615 122,415 157,195 182,780 81,450 101,330 96,830 40,965 55,865
2009-10 287,565 126,995 160,565 191,615 86,465 105,150 95,950 40,535 55,415 2010-11 290,000 128,900 161,100 197,490 89,165 108,325 92,505 39,735 52,770 2011-12 281,630 124,100 157,525 199,430 89,150 110,280 82,200 34,950 47,245 2012-13 (2,23) 278,745 122,465 156,050 198,405 88,245 110,160 80,340 34,220 45,890
2013-14 (2,23) 279,495 121,970 157,485 202,700 89,490 113,180 76,795 32,480 44,305
All students at HEIs
2004-05 217,945 90,345 127,600 146,655 64,025 82,625 71,290 26,315 44,975 2005-06 222,090 91,900 130,185 148,830 64,570 84,260 73,260 27,330 45,925 2006-07 230,100 96,455 133,640 152,800 66,765 86,040 77,295 29,695 47,605 2007-08 224,855 95,375 129,480 149,625 65,940 83,680 75,235 29,435 45,795 2008-09 231,260 98,495 132,765 156,830 69,075 87,755 74,430 29,420 45,010
2009-10 237,765 102,270 135,495 162,970 72,700 90,270 74,790 29,570 45,225 2010-11 238,645 103,250 135,395 166,350 73,870 92,480 72,295 29,380 42,910 2011-12 233,010 99,995 133,010 167,365 73,545 93,820 65,640 26,450 39,190 2012-13 (2,23) 230,950 98,640 132,080 167,065 73,190 93,880 63,885 25,450 38,205
2013-14 (2,23) 230,805 97,830 132,935 170,800 74,380 96,390 60,000 23,450 36,545
All students at colleges
2004-05 52,315 24,395 27,920 25,625 12,340 13,285 26,690 12,055 14,635 2005-06 50,960 23,285 27,675 25,980 12,300 13,680 24,980 10,985 13,995 2006-07 49,460 23,340 26,120 25,880 12,240 13,640 23,580 11,100 12,475 2007-08 47,770 22,875 24,895 25,185 11,855 13,330 22,585 11,020 11,565 2008-09 48,355 23,925 24,430 25,955 12,375 13,580 22,400 11,550 10,855
2009-10 49,800 24,730 25,075 28,640 13,765 14,880 21,160 10,965 10,195 2010-11 51,355 25,650 25,705 31,140 15,295 15,845 20,215 10,355 9,860 2011-12 48,620 24,105 24,515 32,065 15,605 16,460 16,555 8,500 8,055 2012-13 (2) 47,795 23,825 23,970 31,340 15,055 16,280 16,455 8,770 7,690
2013-14 (2) 48,690 24,140 24,550 31,900 15,110 16,790 16,795 9,035 7,760
Academic SessionTotal Full-time Part-time

10
20. The gender split can be partly explained through examination of the Scottish school Leaver destination survey results6. This shows that females were better qualified on leaving school and therefore more able to progress to further study (table 8 ) and that males were more likely to leave school into employment.
Table C: Students in higher education in Scottish HEIs and colleges by age, 2004-05 to 2013-14
Sources: Higher Education Statistics Agency (HESA) Scottish Funding Council (SFC). Refer to Notes to Tables.
6 Scottish School Leaver Destination Survey results: http://www.gov.scot/Topics/Statistics/Browse/School-Education/Datasets/attainmentandleavers
Institution type /Academic session
Total (6) 16-18 19-20 21-24 25-29 30-39 40-49 50-59 60+
Total
2004-05 270,260 39,235 54,390 58,105 28,795 43,150 31,305 11,045 3,965 2005-06 273,050 39,830 55,145 59,230 30,460 42,035 30,910 11,320 3,790 2006-07 279,560 39,770 56,385 61,410 32,410 42,110 31,105 11,805 4,190 2007-08 272,625 38,585 56,085 59,755 32,800 40,095 29,460 11,325 4,200 2008-09 279,615 40,450 57,095 63,280 34,355 39,730 28,630 11,020 4,890
2009-10 287,565 43,330 59,245 66,655 35,400 38,915 27,865 10,855 5,170 2010-11 290,000 41,925 62,415 69,885 36,630 38,560 25,740 10,100 4,655 2011-12 281,630 41,735 62,835 69,725 34,735 35,705 23,010 9,225 4,565 2012-13 278,745 42,370 62,440 70,985 33,715 34,250 21,355 8,995 4,580
2013-14 279,495 42,985 64,605 71,620 33,295 33,625 20,440 8,710 4,135
All students at HEIs
2004-05 217,945 28,555 46,130 50,595 22,835 32,830 24,210 8,960 3,605 2005-06 222,090 28,985 46,505 51,980 24,695 32,790 24,165 9,155 3,510 2006-07 230,100 28,735 47,530 54,140 26,960 33,655 24,835 9,940 3,960 2007-08 224,855 27,940 47,215 52,750 27,395 32,370 23,590 9,390 3,930 2008-09 231,260 29,290 48,105 55,895 28,895 32,175 22,970 9,190 4,615
2009-10 237,765 31,330 49,825 58,705 29,540 31,780 22,395 9,205 4,900 2010-11 238,645 29,955 52,180 60,935 30,475 31,430 20,730 8,425 4,440 2011-12 233,010 29,515 52,605 61,630 29,030 29,280 18,705 7,780 4,395 2012-13 230,950 30,370 51,905 62,970 28,060 28,115 17,500 7,625 4,350
2013-14 230,805 30,755 53,690 63,375 27,675 27,550 16,695 7,120 3,860
All students at colleges
2004-05 52,315 10,680 8,260 7,510 5,960 10,320 7,095 2,090 360 2005-06 50,960 10,845 8,640 7,250 5,760 9,245 6,745 2,160 280 2006-07 49,460 11,035 8,855 7,270 5,445 8,450 6,270 1,865 230 2007-08 47,770 10,645 8,865 7,000 5,405 7,725 5,870 1,935 270 2008-09 48,355 11,160 8,990 7,385 5,460 7,555 5,660 1,835 275
2009-10 49,800 12,000 9,420 7,945 5,860 7,140 5,475 1,650 270 2010-11 51,355 11,970 10,240 8,945 6,155 7,130 5,010 1,675 215 2011-12 48,620 12,220 10,230 8,095 5,705 6,430 4,305 1,445 170 2012-13 47,795 12,000 10,535 8,015 5,655 6,135 3,855 1,370 200
2013-14 48,690 12,225 10,915 8,245 5,620 6,075 3,745 1,590 275

11
21. Table C shows that whilst the number of students aged under 25 rose by 3,415 or 1.9% between 2012-13 and 2014-14 , there was a decline in enrolments for the 25 to 59 age group, which fell by 2,245 or 2.3%.
22. Student numbers for those aged 30 to 49 have reduced noticeably since 2004-05. Consistent with Scottish Government policy, SFC asked colleges and HEIs to prioritise the 16 to 24 age group in order to improve the employability of young people. There was also increased demand from school leavers to attend HEIs during the economic recession (when fewer opportunities were available to enter employment). As first degree numbers for Scottish students attending Scottish HEIs are controlled by SFC through a set number of funded places, if HEIs recruit more school leavers or other younger students, then there will be less available places for older students.
Student entrant numbers and characteristics
23. Table D shows that the total number of new entrants to HE courses rose by 1,950 (or 1.5%) between 2012-13 and 2014-14. This consisted of an increase in postgraduate study of 1,570 (5.3%), a rise in first degree study of 985 (2.1%) and a decline in sub-degree study of 2,140 (7.4%). The number of new entrants at HEIs was 97,900 (72.3% of the total) and the number at colleges was 37,465 (27.7%).
24. Entrants to HNC/HND courses also increased by 1,540 (5.5%) between 2013-14, with increases in these entrants seen at both HEIs and colleges in Scotland.

12
Table D: Entrants to higher education in HEIs and colleges by level of study and academic year: 2004-05 to 2013-14
Sources: Higher Education Statistics Agency (HESA) and Scottish Funding Council (SFC). Refer to Notes to Tables.
Institution Type /Academic Session
Total PostgraduateResearch
(1)
PostgraduateTaught
FirstDegree
HNC/HND OtherSub-degree
Total
2004-05 133,340 2,920 19,690 41,780 31,495 37,445 2005-06 137,565 2,935 23,645 44,010 30,385 36,590 2006-07 142,460 3,275 25,730 42,780 28,965 41,710 2007-08 137,495 3,245 24,675 42,965 28,275 38,235 2008-09 144,130 3,655 25,720 46,775 28,470 39,465
2009-10 147,465 3,790 27,700 50,295 29,600 36,080 2010-11 140,590 3,865 26,840 46,860 30,250 32,775 2011-12 132,365 3,800 25,915 44,945 29,275 28,430 2012-13 133,415 3,940 25,870 46,870 27,945 28,790
2013-14 135,365 4,090 27,290 47,855 29,485 26,650
All students at HEIs
2004-05 90,730 2,920 19,535 41,405 3,390 23,480 2005-06 97,040 2,935 23,505 43,555 2,935 24,110 2006-07 103,575 3,275 25,575 42,400 3,470 28,855 2007-08 100,115 3,245 24,535 42,520 3,765 26,050 2008-09 105,975 3,655 25,645 46,255 3,290 27,125
2009-10 108,840 3,790 27,610 49,765 3,110 24,570 2010-11 101,080 3,865 26,765 46,070 2,885 21,500 2011-12 95,350 3,800 25,905 44,140 2,465 19,040 2012-13 (2) 96,970 3,940 25,870 45,970 2,410 18,780
2013-14 (2) 97,900 4,090 27,290 46,920 3,465 16,135
All students at colleges
2004-05 42,610 - 150 375 28,100 13,970 2005-06 40,525 - 140 450 27,450 12,480 2006-07 38,885 - 155 380 25,495 12,855 2007-08 37,380 - 140 445 24,510 12,185 2008-09 38,150 - 80 515 25,175 12,340
2009-10 38,625 - 90 535 26,490 11,505 2010-11 39,510 - 75 790 27,370 11,275 2011-12 37,015 - 10 805 26,810 9,385 2012-13 (2) 36,445 - - 900 25,535 10,010
2013-14 (2) 37,465 - - 935 26,020 10,510

13
Table E: Entrants to higher education in HEIs and colleges in 2013-14 by subject and gender
Sources: Higher Education Statistics Agency (HESA) and Scottish Funding Council (SFC). Refer to Notes to Tables.
Total Male (%) Female (%) Total Male (%) Female (%) Total Male (%) Female (%) Total Male (%) Female (%)
Total (22) 135,365 43.5% 56.5% 31,375 43.0% 57.0% 47,855 43.0% 57.0% 56,135 44.1% 55.9%
Medical Studies
Subjects all ied to Medicine 13,250 18.1% 81.9% 3,075 25.0% 75.0% 5,485 16.2% 83.8% 4,685 15.7% 84.3%Medicine and Dentistry 2,165 42.6% 57.4% 865 40.1% 59.9% 1,215 43.3% 56.7% 90 56.2% 43.8%
Total 15,415 21.5% 78.5% 3,940 28.3% 71.7% 6,700 21.1% 78.9% 4,775 16.5% 83.5%
Science and Engineering
Agriculture & related subjects 1,110 44.1% 55.9% 390 50.5% 49.5% 170 39.9% 60.1% 550 40.8% 59.2%Architecture, building and planning 3,175 70.4% 29.6% 970 57.0% 43.0% 995 62.5% 37.5% 1,210 87.7% 12.3%Biological Sciences 8,635 36.2% 63.8% 1,645 36.0% 64.0% 5,445 35.2% 64.8% 1,550 39.8% 60.2%Engineering and Technology 13,740 85.3% 14.7% 2,825 76.5% 23.5% 4,235 84.0% 16.0% 6,680 89.8% 10.2%Computer Science 6,680 81.8% 18.2% 1,085 70.1% 29.9% 2,825 84.0% 16.0% 2,770 84.0% 16.0%Mathematical Sciences 1,460 61.3% 38.7% 320 63.0% 37.0% 985 57.7% 42.3% 150 80.9% 19.1%Physical Sciences 3,960 57.2% 42.8% 1,225 55.7% 44.3% 2,400 57.9% 42.1% 340 57.8% 42.2%Veterinary Science 420 21.7% 78.3% 70 42.4% 57.6% 290 18.4% 81.6% 65 15.2% 84.8%
Total 39,180 67.1% 32.9% 8,530 60.7% 39.3% 17,335 60.8% 39.2% 13,315 79.3% 20.7%
Business and Social Studies
Business & Administrative studies 23,935 41.6% 58.4% 6,500 45.8% 54.2% 7,160 41.8% 58.2% 10,275 38.9% 61.1%Law 4,195 38.3% 61.7% 1,760 43.5% 56.5% 1,605 36.3% 63.7% 825 31.0% 69.0%Mass Communication & documentation 1,955 43.0% 57.0% 530 33.3% 66.7% 770 42.6% 57.4% 655 51.1% 48.9%Social Studies 13,265 28.1% 71.9% 2,280 36.9% 63.1% 4,450 34.7% 65.3% 6,535 20.6% 79.4%
Total 43,355 37.2% 62.8% 11,070 43.0% 57.0% 13,990 39.0% 61.0% 18,295 32.4% 67.6%
Education and the Arts
Creative Arts & Design 10,900 34.9% 65.1% 910 35.6% 64.4% 3,060 33.5% 66.5% 6,930 35.5% 64.5%Education 7,240 26.7% 73.3% 4,600 25.9% 74.1% 1,530 15.4% 84.6% 1,110 45.7% 54.3%Historical & Philosophical Studies 4,315 42.4% 57.6% 1,095 49.3% 50.7% 2,060 42.5% 57.5% 1,160 35.6% 64.4%Languages 6,120 31.8% 68.2% 840 31.4% 68.6% 2,290 26.5% 73.5% 2,995 35.9% 64.1%
Total 28,575 33.3% 66.7% 7,445 31.1% 68.9% 8,935 30.7% 69.3% 12,195 36.5% 63.5%
Combined (7) 8,810 40.5% 59.5% 390 32.4% 67.6% 875 45.8% 54.2% 7,540 40.4% 59.6%
Supplementary subjects containedin the above categories
Economics and Politics 2,840 52.0% 48.0% 1,050 48.0% 52.0% 1,710 54.5% 45.5% 80 50.3% 49.7%English 2,375 34.4% 65.6% 340 29.0% 71.0% 1,055 27.1% 72.9% 980 44.0% 56.0%Geography (8) 825 42.2% 57.8% 285 45.8% 54.2% 535 39.6% 60.4% 5 - -Psychology 3,465 24.3% 75.7% 635 26.0% 74.0% 2,235 21.9% 78.1% 595 31.6% 68.4%
Subject AreaAll levels Postgraduate First degree Sub-degree

14
25. Some subject areas have tightly controlled student intakes which influence profile of subjects delivered. Our controlled subjects sector communication outlines these numbers:
http://www.sfc.ac.uk/communications/Circulars/2013/Circulars_SFC022013.aspx
26. Table E shows that a majority (56.5%) of entrants in 2013-14 were female and 43.5% were male. The subject groups with the highest proportions of female entrants were Subjects allied to Medicine (81.9%), Veterinary Science (78.3%) and Education (73.3%). The subject groups with the highest proportion of male entrants were Engineering and Technology (85.6%), Computer Science (81.8%) and Architecture, Building and Planning (70.4%).
27. The HE courses in Scotland with the largest overall numbers of entrants in 2013-14 were Business & Administrative Studies with 23,935 entrants followed by Engineering and Technology with 13,740 entrants and Social Studies with 13,265 entrants.
Figure 3 Scottish domiciled entrants to HE at Scottish HEIs and colleges by level of study: 2004-05 to 2013-14
28. Figure 3 shows that the number of Scottish domiciled postgraduate entrants
has increased by 7.3% between 2004-05 and 2013-14. This can be compared with all postgraduate students in Table A which have increased by 24%.
29. In 2013-14 SFC began investing in additional taught postgraduate places. We have seen an increase in Scottish-domiciled postgraduate entrants of 1,570 (5.3%) between 2012-13 and 2013-14.

15
Figure 4 Non-Scottish domiciled entrants to HE at Scottish HEIs and colleges by domicile: 2004-05 to 2013-14
30. Prior to 2012-13, the number of RUK students at Scottish HEIs had been
controlled to some degree by the number of funded places available at Scottish HEIs which supported the provision of RUK students. The provision for these students is now funded through the de-regulated tuition fees that were introduced for 2012-13. The likely long term effect on RUK recruitment of these changes is uncertain but the initial figures for 2012-13 and 2013-14 displayed in Figure 4 indicate an increase in entrants from RUK, despite the de-regulation of tuition fees.

16
Domicile of Entrants
31. Table F shows that of the 135,365 entrants to HE in Scotland in 2013-14, either at Scottish colleges or HEIs, 99,980 (73.9%) were Scottish domiciled (i.e. living in Scotland prior to study) while 9,845 (7.3%) were from the rest of the UK.
32. Table F shows that the number of Scottish domiciled entrants rose by 1,525 (1.5%) between 2012-13 and 2013-14.
33. Entrants from the European Union have increased by 90 between 2012-13 and 2013-14 (1%) and those from outwith the EU (non-EU Europe and non-European) have increased by 35 (0.2%). Students from RUK have increased by 330 (3.5%) between 2012-13 and 2013-14, with increases in students from each of England, Wales and Northern Ireland.
34. Students from the EU (not RUK) are still eligible to have their provision supported through SFC funding but would have to pay higher fees if they chose to study at an HEI elsewhere in the UK.

17
Table F. Entrants in higher education at Scottish HEIs and colleges by domicile and level of study, 2004-05 to 2013-14
Source: Higher Education Statistics Agency (HESA) and Scottish Funding Council (SFC).Refer to Notes to Tables.
Access and Equalities
35. Table G shows that 88.7% of all students whose ethnicity was recorded were white. Students from an Asian–Chinese background were the second largest ethnic group with 2.4% of the total and students from a Black African background were the third largest ethnic group with 1.9%.
Level of Study /Academic Session
Total alldomiciles
(13)
Scotland England Wales NorthernIreland
Other UK Total UK EU Non-EUEurope
Non-European
All levels
2004-05 133,340 109,220 6,510 215 1,585 50 117,690 5,355 470 9,780 2005-06 137,565 111,210 7,210 235 1,575 80 120,390 5,870 495 10,780 2006-07 142,460 112,910 7,065 240 1,580 75 122,010 6,585 595 13,215 2007-08 137,495 108,175 7,320 260 1,505 70 117,820 6,725 565 12,370 2008-09 144,130 111,555 7,745 235 1,430 110 121,300 7,410 685 14,690 2009-10 147,465 112,495 8,440 275 1,420 335 123,135 8,770 810 14,715 2010-11 140,590 106,460 7,800 235 1,390 75 116,015 7,905 870 15,790 2011-12 132,365 98,150 7,495 260 1,375 75 107,380 8,380 880 15,725 2012-13 133,415 98,455 7,910 285 1,165 155 107,975 8,890 965 15,565
2013-14 135,365 99,980 8,175 315 1,295 60 109,820 8,980 975 15,590
Postgraduate
2004-05 22,610 12,425 1,740 65 230 10 14,525 2,055 255 5,745 2005-06 26,580 14,955 2,060 90 240 20 17,410 2,125 240 6,775 2006-07 29,005 15,145 2,610 95 250 20 18,175 2,290 300 8,205 2007-08 27,920 13,900 2,690 120 270 20 17,035 2,235 295 8,350 2008-09 29,380 14,360 2,550 100 235 20 17,320 2,535 335 9,155 2009-10 31,490 14,690 3,035 115 295 20 18,235 3,150 380 9,695 2010-11 30,705 13,150 3,095 100 270 15 16,660 3,160 395 10,480 2011-12 29,715 11,780 3,280 115 255 15 15,465 3,470 400 10,380 2012-13 29,810 11,725 3,280 120 215 65 15,405 3,730 485 10,175
2013-14 31,375 13,325 3,230 170 240 25 16,995 3,895 470 10,020
First Degree
2004-05 41,780 31,475 3,965 125 1,235 30 36,850 2,495 170 2,255 2005-06 44,010 33,080 4,230 125 1,230 40 38,715 2,825 190 2,275 2006-07 42,780 31,695 3,600 105 1,195 40 36,660 3,180 220 2,700 2007-08 42,965 31,690 3,850 120 1,070 35 36,795 3,615 215 2,340 2008-09 46,775 34,015 4,320 100 1,100 70 39,625 4,075 285 2,790 2009-10 50,295 35,970 4,715 130 1,065 60 41,950 4,830 350 3,155 2010-11 46,860 34,265 3,720 100 1,035 45 39,170 4,175 330 3,185 2011-12 44,945 32,160 3,495 95 1,070 50 36,865 4,210 410 3,455 2012-13 46,870 33,910 3,910 125 885 45 38,875 4,500 370 3,125
2013-14 47,855 34,460 4,255 110 975 25 39,825 4,280 390 3,360
Sub-degree
2004-05 68,940 65,310 805 20 120 10 66,305 805 45 1,785 2005-06 66,980 63,175 915 25 110 20 64,265 920 65 1,730 2006-07 70,675 66,065 850 35 135 15 67,170 1,120 75 2,310 2007-08 66,510 62,485 780 20 170 15 63,890 880 60 1,680 2008-09 67,935 63,135 875 30 95 20 64,310 800 70 2,750 2009-10 65,680 61,835 690 25 60 255 62,950 790 80 1,860 2010-11 63,025 59,045 985 35 85 10 60,185 570 140 2,125 2011-12 57,705 54,210 720 50 50 10 55,045 700 65 1,890 2012-13 56,735 52,825 725 40 65 45 53,695 655 110 2,265
2013-14 56,135 52,190 695 35 80 5 53,000 805 115 2,210

18
Table G. Students in higher education at Scottish HEIs and colleges by level of study and ethnicity, 2013-14
Sources: Higher Education Statistics Agency (HESA) and Scottish Funding Council (SFC). Refer to Notes to Tables.
ResearchPostgraduate
TaughtPostgraduate
HNC/HND Other Sub-degree
All Students 279,495 12,180 41,925 152,460 41,285 31,640
Asian - Bangladeshi 390 35 90 180 60 20
Asian - Chinese 6,080 505 2,275 2,385 150 765
Asian - Indian 3,265 250 920 1,310 345 445
Asian - Pakistani 3,585 110 425 2,190 620 235
Asian - other 3,060 370 880 1,305 260 245
Black - African 4,835 415 1,855 1,770 480 320
Black - Caribbean 290 15 85 125 30 30
Black - other 400 40 135 145 55 20
White 222,615 7,380 24,455 125,450 38,375 26,950
Mixed background 4,000 260 590 2,560 330 255
Other ethnic background 2,555 375 805 995 155 220
Unknown 28,415 2,425 9,410 14,035 420 2,125
Ethnic Background
Level of Study
All Levels
Postgraduate
FirstDegree
Sub-degree

19
36. The proportion of Scottish-domiciled entrants to HE that come from the 20% most deprived areas of Scotland was 15.9% in 2013-14. As 19.3% of the working age population live in the 20% most deprived areas of Scotland, this cohort remain under-represented in higher education in Scotland.
37. Looking now at institution types; students from the 20% most deprived areas remain over-represented in Scotland’s colleges (22.5%) and under-represented amongst Scotland’s HEIs, particularly ancient universities (8.8%) and small specialist institutions (10.7%), although Table H shows that we have seen increases in both of these proportions between 2012-13 and 2013-14. SFC7 allocates additional places to students from most deprived areas.
38. SFC’s ‘Learning for All: Measures of Success 2015’8 publication provides further analysis of statistics concerning those from the most deprived areas at Scotland’s HEIs and Colleges.
39. In 2013-14, entrants from deprived areas were under represented by 3.4 percentage points. In 2005-06, under-representation of this group stood at 5 percentage points. Figure 5 provides an overview of the level of representation by institution type.
7 SFC Outcome Agreement information: http://www.sfc.ac.uk/funding/OutcomeAgreements/OutcomeAgreementsOverview.aspx 8 http://www.sfc.ac.uk/communications/Statisticalpublications/2015/SFCST062015.aspx

20
Table H. Scottish domiciled entrants from deprived areas to higher education in the UK by institution type, 2004-05 to 2013-14
Sources: Higher Education Statistics Agency (HESA) and Scottish Funding Council (SFC). Refer to Notes to Tables.
2004-05 2005-06 2006-07 2007-08 2008-09 2009-10 2010-11 2011-12 2012-13 2013-14
Colleges 21.3% 21.7% 21.8% 21.8% 21.7% 22.6% 22.3% 22.4% 22.8% 22.5%
Ancient Universities (3) 7.9% 7.6% 7.7% 7.3% 7.8% 7.6% 7.9% 7.4% 8.2% 8.8%
Newer Universities 11.6% 11.7% 11.7% 11.1% 11.0% 11.1% 11.2% 10.7% 11.1% 11.9%
Post-92 HEIs 13.9% 14.4% 14.6% 14.8% 14.7% 14.6% 14.8% 13.9% 15.3% 15.0%
Specialised HEIs (2,3) 7.3% 7.7% 6.5% 7.5% 6.6% 7.9% 7.2% 8.6% 7.4% 10.8%
Open University 13.7% 13.2% 13.7% 13.2% 14.0% 14.0% 14.7% 14.7% 15.4% 14.7%
Universities outside Scotland 6.3% 6.8% 6.3% 6.9% 7.4% 7.0% 9.0% 7.5% 5.8% 7.1%
All entrants from deprived areas (17,23) 14.9% 15.0% 15.0% 14.8% 14.9% 15.1% 15.4% 15.1% 15.8% 15.9%
% of Scottish population l iving in deprived areas (17) 19.8% 19.7% 19.6% 19.3% 19.2% 19.1% 19.0% 19.0% 19.3% 19.2%
% of Scottish working age population l iving in deprived areas (18) 19.5% 19.4% 19.4% 19.0% 19.0% 18.9% 18.8% 18.8% 19.3% 19.3%
Under-representation of total population from deprived areas -5.0% -4.7% -4.6% -4.5% -4.3% -4.1% -3.6% -3.9% -3.5% -3.4%
Under-representation of working age population from deprived areas -4.6% -4.4% -4.4% -4.2% -4.1% -3.8% -3.4% -3.7% -3.5% -3.4%
Type of InstitutionPercentage of HE entrants from deprived areas (17)

21
Figure 5: Scottish domiciled entrants to higher education by deprivation classification of domicile and institution type: 2013-14

22
Qualifiers
Qualifier numbers and characteristics
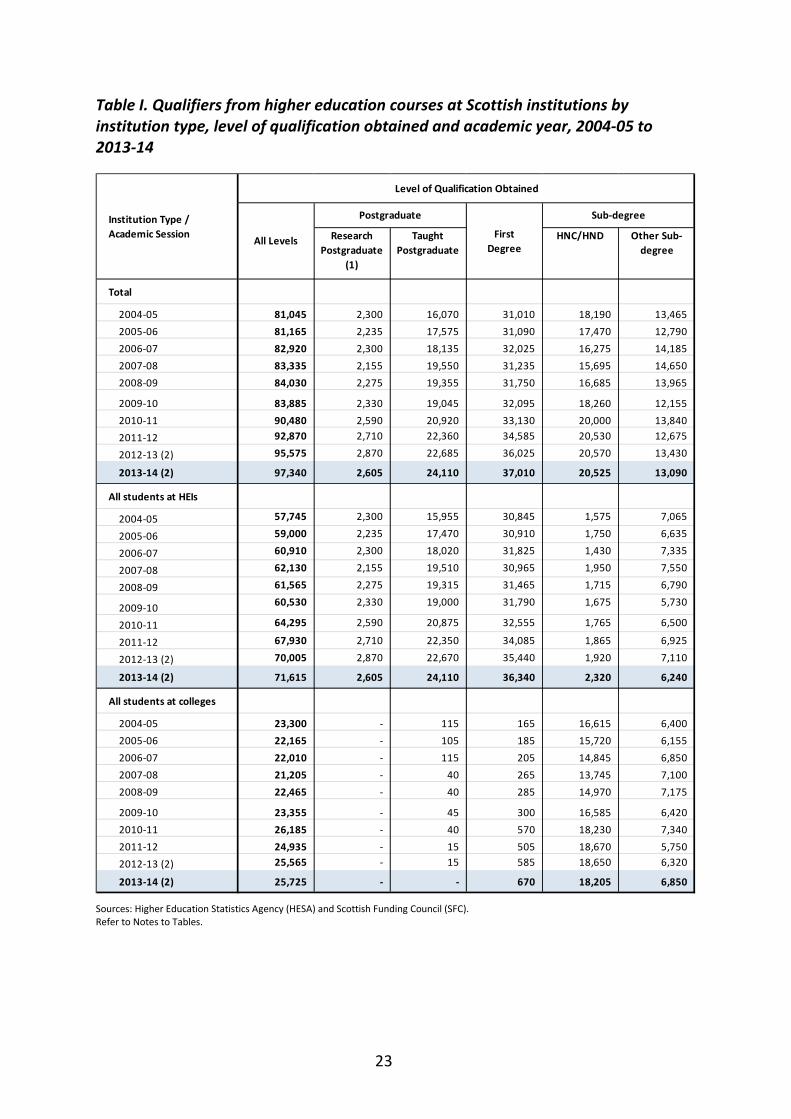
40. Table I (below) shows that the number of higher education qualifiers from Scottish institutions has increased by 1,765 (1.9%) from 2012-13 to 97,340 in 2013-14 – the highest level in the 10 year period.
41. The number qualifying at first degree level rose by 985 (2.7%), and the number at postgraduate level rose by 1,160 (4.6%). The number at HNC/D level however fell slightly by 45 (0.2%), having steadily risen during the previous five academic years from 2008-09 to 2012-13. There was also a reduction in the number of qualifiers at sub-degree level (excluding HNC/Ds), which reduced by 340 (2.5%).
42. Qualifiers from Scottish HEIs increased by 2.3%, from 70,005 in 2012-13 to 71,615 in 2013-14, and have increased by 24% since 2004-05. Altogether, 65.5% of qualifiers in 2013-14 achieved graduate level qualifications (first degree level or above), and these were mainly achieved at HEIs.
23
Table I. Qualifiers from higher education courses at Scottish institutions by institution type, level of qualification obtained and academic year, 2004-05 to 2013-14
Sources: Higher Education Statistics Agency (HESA) and Scottish Funding Council (SFC). Refer to Notes to Tables.
ResearchPostgraduate
(1)
TaughtPostgraduate
HNC/HND Other Sub-degree
Total
2004-05 81,045 2,300 16,070 31,010 18,190 13,465 2005-06 81,165 2,235 17,575 31,090 17,470 12,790 2006-07 82,920 2,300 18,135 32,025 16,275 14,185 2007-08 83,335 2,155 19,550 31,235 15,695 14,650 2008-09 84,030 2,275 19,355 31,750 16,685 13,965
2009-10 83,885 2,330 19,045 32,095 18,260 12,155 2010-11 90,480 2,590 20,920 33,130 20,000 13,840 2011-12 92,870 2,710 22,360 34,585 20,530 12,675
2012-13 (2) 95,575 2,870 22,685 36,025 20,570 13,430
2013-14 (2) 97,340 2,605 24,110 37,010 20,525 13,090
All students at HEIs
2004-05 57,745 2,300 15,955 30,845 1,575 7,065
2005-06 59,000 2,235 17,470 30,910 1,750 6,635
2006-07 60,910 2,300 18,020 31,825 1,430 7,335
2007-08 62,130 2,155 19,510 30,965 1,950 7,550
2008-09 61,565 2,275 19,315 31,465 1,715 6,790
2009-10 60,530 2,330 19,000 31,790 1,675 5,730
2010-11 64,295 2,590 20,875 32,555 1,765 6,500
2011-12 67,930 2,710 22,350 34,085 1,865 6,925
2012-13 (2) 70,005 2,870 22,670 35,440 1,920 7,110
2013-14 (2) 71,615 2,605 24,110 36,340 2,320 6,240
All students at colleges
2004-05 23,300 - 115 165 16,615 6,400 2005-06 22,165 - 105 185 15,720 6,155 2006-07 22,010 - 115 205 14,845 6,850 2007-08 21,205 - 40 265 13,745 7,100 2008-09 22,465 - 40 285 14,970 7,175
2009-10 23,355 - 45 300 16,585 6,420 2010-11 26,185 - 40 570 18,230 7,340 2011-12 24,935 - 15 505 18,670 5,750 2012-13 (2) 25,565 - 15 585 18,650 6,320
2013-14 (2) 25,725 - - 670 18,205 6,850
Institution Type /Academic Session
Level of Qualification Obtained
All Levels
Postgraduate
FirstDegree
Sub-degree

24
43. Many of these qualifying students will be from outwith Scotland but may choose to take up employment in Scotland when their course ends. Retaining these highly qualified graduates is an important benefit of Scotland remaining a net importer of students.
44. Further information on destination of qualifiers is available with the HESA publication on destination of leavers:
https://www.hesa.ac.uk/pr207
HESA also follow graduates over a longer time frame and publish their finding for this group in their longitudinal survey publication:
https://www.hesa.ac.uk/publications-and-products?task=show_year&pubId=1714&versionId=54&yearId=292
Figure 6. Qualifiers from higher education in Scottish HEIs and colleges by level of student: 2013-14

25
Figure 7. Scottish qualifiers from HE in Scottish HEIs and colleges by level of study: 2004-05 to 2013-14
Gender, age and domicile of qualifiers
45. Table J shows that the number of qualifiers aged 16 to 24 increased by 1,965 (3.7%) between 2012-13 and 2013-14. The majority of qualifiers (57%) in 2013-14 were aged below 25.
46. Table K shows that Students with Scottish domiciles accounted for 70.4% of qualifiers from Scottish institutions in 2013-14. Rest of UK students accounted for a further 7.5 % of qualifiers, with 7% from the rest of the EU and 15% from outwith the EU. Between 2012-13 and 2013-14 qualifiers from Scottish domiciles rose by 1,890 (2.8%).
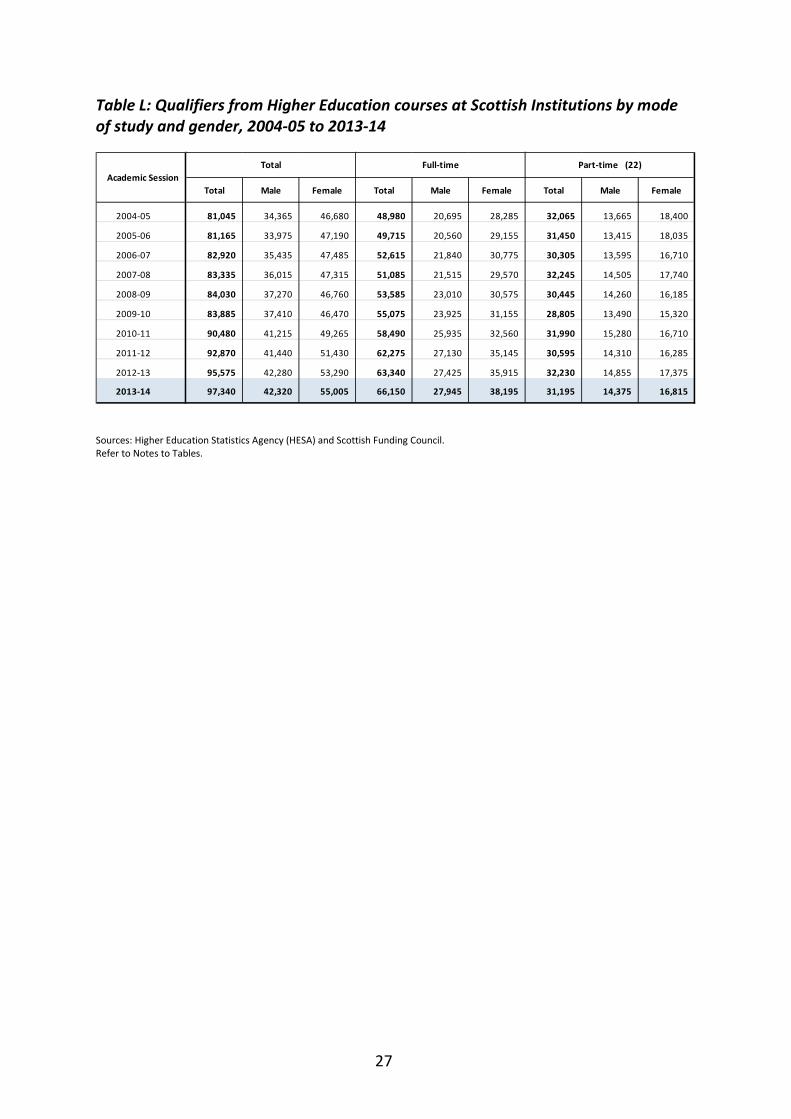
47. Table L shows that in 2013-14, the percentage of males in the qualifier population was 43.5% (down marginally from 44.2% in 2012-13) and that females made up 56.5% of the qualifiers (up marginally from 55.48 in 2012-13).

26
Table J: Qualifiers from Higher Education courses at Scottish Institutions by age, 2004-05 to 2013-14
Sources: Higher Education Statistics Agency (HESA) and Scottish Funding Council. Refer to Notes to Tables.
Table K: Qualifiers from Higher Education courses at Scottish Institutions by pre-study domicile and academic year, 2004-05 to 2013-14
Sources: Higher Education Statistics Agency (HESA) and Scottish Funding Council. Refer to Notes to Tables.
Level of Qualification /Academic Session Total (6) 16-18 19-20 21-24 25-29 30-39 40-49 50-59 60+
All levels
2004-05 81,045 2,200 7,155 30,460 13,380 14,280 10,025 3,000 530 2005-06 81,165 2,145 7,140 31,325 14,140 13,575 9,405 2,960 455 2006-07 82,920 2,310 7,590 32,930 14,540 13,090 9,025 2,915 500 2007-08 83,335 2,280 7,615 32,675 15,040 13,045 8,920 2,970 555 2008-09 84,030 2,580 7,870 33,455 15,025 12,965 8,510 3,005 610 2009-10 83,885 2,830 8,110 33,620 15,495 12,650 7,900 2,735 535 2010-11 90,480 2,930 9,165 36,170 17,270 13,250 7,955 3,000 740 2011-12 92,870 3,140 9,360 37,945 18,360 13,320 7,450 2,705 580 2012-13 95,575 3,585 14,815 38,895 16,055 12,295 6,660 2,545 715
2013-14 97,340 3,755 15,685 39,770 15,930 12,285 6,545 2,615 755
Level of Qualification /Academic Session
Total Scotland Rest of UK EUexcluding
UK
Rest ofthe
world
Total
2004-05 81,045 63,495 6,930 3,765 6,855 2005-06 81,165 62,225 6,665 4,180 8,100 2006-07 82,920 62,710 6,605 4,610 8,990 2007-08 83,335 61,420 6,895 4,820 10,205 2008-09 84,030 61,435 7,485 5,005 10,100
2009-10 83,885 60,740 6,605 5,755 10,725 2010-11 90,480 64,715 7,110 5,955 12,655 2011-12 92,870 65,045 7,500 6,095 14,230 2012-13 95,575 66,640 7,945 6,475 14,515
2013-14 97,340 68,530 7,260 6,855 14,695
27
Table L: Qualifiers from Higher Education courses at Scottish Institutions by mode of study and gender, 2004-05 to 2013-14
Sources: Higher Education Statistics Agency (HESA) and Scottish Funding Council. Refer to Notes to Tables.
Total Male Female Total Male Female Total Male Female
2004-05 81,045 34,365 46,680 48,980 20,695 28,285 32,065 13,665 18,400
2005-06 81,165 33,975 47,190 49,715 20,560 29,155 31,450 13,415 18,035
2006-07 82,920 35,435 47,485 52,615 21,840 30,775 30,305 13,595 16,710
2007-08 83,335 36,015 47,315 51,085 21,515 29,570 32,245 14,505 17,740
2008-09 84,030 37,270 46,760 53,585 23,010 30,575 30,445 14,260 16,185
2009-10 83,885 37,410 46,470 55,075 23,925 31,155 28,805 13,490 15,320
2010-11 90,480 41,215 49,265 58,490 25,935 32,560 31,990 15,280 16,710
2011-12 92,870 41,440 51,430 62,275 27,130 35,145 30,595 14,310 16,285
2012-13 95,575 42,280 53,290 63,340 27,425 35,915 32,230 14,855 17,375
2013-14 97,340 42,320 55,005 66,150 27,945 38,195 31,195 14,375 16,815
Academic SessionTotal Full-time Part-time (22)

28
Participation Rates for Entrants to Scottish Higher Education
Higher Education Initial Participation Rate (HEIPR)
48. The Higher Education Initial Participation Rate (HEIPR) roughly equates to the probability that a 16 year old will participate in Higher Education by the age of 30.
49. The Scottish HEIPR, displayed in Table M, is a measure of all initial entrants9 aged between 16 and 30 (inclusive). The measure does not show the proportion currently participating, the proportion continuing beyond the first six months, or those who successfully complete a course. It measures access to higher education and is suitable for comparison with measures in other countries. Key strengths of these rates, compared to simple student statistics, are that these participation rates are more inclusive and better recognise the importance of lifelong learning.
50. The initial participation rates for each age group (16 to 30) in scope of this calculation are summed to give the HEIPR.
Table M: Scottish Higher Education Initial Participation Rate (HEIPR) by Age 2012-13 and 2013-14
Source: Higher Education Statistics Agency (HESA), Scottish Funding Council (SFC) and National Records of Scotland (NRS)
9 An initial entrant is defined as any student who participates for at least six months on a course which is expected to last for at least six months, who has not participated in Higher Education previously for a period for at least six months (whether at a College or an HEI).
Age Initial
Entrants PopulationInitial
Participation Rate
Initial Entrants Population
Initial Participation
Rate
Year-on-Year Change in
HEIPR16 1,006 61,590 1.6% 1,061 61,362 1.7% ↑17 9,552 62,117 15.4% 9,569 61,868 15.5% ↑18 13,174 65,042 20.3% 13,039 63,905 20.4% ↑19 3,882 68,273 5.7% 3,911 67,369 5.8% ↑20 1,722 73,514 2.3% 1,688 69,697 2.4% ↑21 1,199 76,082 1.6% 1,148 74,680 1.5% ↓22 899 74,210 1.2% 938 76,895 1.2% ↔23 737 72,919 1.0% 781 74,243 1.1% ↑24 738 73,017 1.0% 701 72,573 1.0% ↔25 614 71,332 0.9% 616 72,826 0.8% ↓26 596 70,484 0.8% 598 71,143 0.8% ↔27 542 69,857 0.8% 534 70,361 0.8% ↔28 546 67,971 0.8% 511 69,909 0.7% ↓29 477 68,242 0.7% 443 68,013 0.7% ↔30 412 69,380 0.6% 417 68,417 0.6% ↔
16-30 36,096 1,044,029 54.7% 35,955 1,043,260 55.0% ↑
2012-13 2013-14

29
51. Table M indicates that the Scottish HEIPR has slightly increased from 54.7% in 2012-13 to 55% in 2013-14. It indicates that the distribution of ages of entrants is similar for the two years, and indicates that a significant majority of new entrants continue to be less than 20 years of age. That trend may be explained by SFC prioritising support for the 16 to 24 age group at colleges in recent years.
Young Participation Rate (YPR)
52. The YPR, as displayed in Table N (below), measures the number of 16 year olds in the population in a particular year who participate in HE level study before they turn 20. The YPR is a measure of access to higher education by young people up to and including age 19. It is a true cohort measure10 and analyses the likelihood of 16 year olds participating in higher education over a four year period of time.
53. The YPR counts students only once, but the participation rate builds over a four year period. The HEIPR indicator, by contrast, measures the number of new entrants at HE level for those aged 16 to 30 in a single specified academic year. The YPR recognises that a 16 year old in one particular base year of population may not enter HE aged 16, but by applying this measure, we can capture their entry to HE should they do so within a 4 year period by age 19. For instance, an individual who was 16 in 2010-11 may not enter HE in that academic year but may do so in 2012-13 aged 18.
Table N: Scottish Young Participation Rate: 2006 to 2013 Cohort
Source: Higher Education Statistics Agency (HESA), Scottish Funding Council (SFC) and National Records of Scotland (NRS)
10 An explanation of True Cohort Participation Rates can be found in the ‘Measurements of Participation in Scottish Higher Education Report’ at the following address: http://www.gov.scot/Publications/2010/08/17120618/0
Number of Entrants Population YPR
2006 Cohort 26,489 65,036 40.7%2007 Cohort 26,327 65,446 40.2%2008 Cohort 25,836 63,905 40.4%2009 Cohort 26,363 64,436 40.9%2010 Cohort 27,892 65,976 42.3%2011 Cohort 28,630 65,346 43.8%2012 Cohort 28,053 63,314 44.3%2013 Cohort 28,167 61,566 45.8%
30
54. The Scottish YPR shows a rising trend over the period, attributable to a rising number of entrants and a fall in the cohort population.
55. Further detailed information on the HEIPR and YPR and how they are calculated can be found in SFC’s ‘Participation Rates for Entrants to Scottish Higher Education in 2012-13’ publication11. Breakdowns of Tables M and N can be provided by different variables on request via the contact details on the front page of this report.
11 Participation Rates for Entrants to Scottish Higher Education in 2012-13: http://www.sfc.ac.uk/web/FILES/Statistical_publications_SFCST072014_ParticipationRatesforEntrantstoScottish/Participation_Rates_for_Entrants_to_Scottish_Higher_Education_in_2012-13.pdf

31
Annex A
Notes to Tables
Some of these notes refer to the additional tables published on the SFC website and not to any of the tables in this publication.
1. The figures include Scottish-domiciled postgraduate research students at the Open University up to 2011-12. The Open University had 20 Scottish-domiciled postgraduate research students in 2011-12.
2. Students at the former land-based colleges of Barony, Elmwood and Oatridge, which merged with SAC to form SRUC in October 2012, were still recorded through the college reporting until 2012-13. They are included in the figures for colleges for 2012-13 but are included with the SRUC and HEI related figures in 2013-14.
3. The following changes to institutions have taken place over the period 2004-05 to 2013-14:
• The University of Paisley merged with Bell College at the start of the 2007-08 academic session to become the University of the West of Scotland
• The Edinburgh College of Art merged with the University of Edinburgh at the start of academic session 2011-12
• In 2005-06 Fife College of Further and Higher Education and Glenrothes College merged to form Adam Smith College
• In 2005-06 Falkirk College of Further and Higher Education and Clackmannan College of Further Education merged to form Forth Valley College
• In 2005-06 Glasgow College of Food Technology and Glasgow College of Building and Printing merged to form Glasgow Metropolitan College
• In 2010-11, Glasgow Metropolitan College, Glasgow College of Nautical Studies and Central College Glasgow merged to form City of Glasgow College
• In 2012-13 Telford College, Stevenson College and Jewel and Esk Valley College merged to form Edinburgh College
• In 2012-13 Barony College, Elmwood College and Oatridge College merged with the Scottish Agricultural College to form SRUC
• On 1 November 2013, Aberdeen College and Banff and Buchan College merged to form North East Scotland College
• On 1 August 2013, Ayr College, James Watt College (Kilwinning campus) and

32
Kilmarnock College merged to form Ayrshire College
• On 1 August 2013, Adam Smith College, Carnegie College and SRUC (non-land base element) merged to form Fife College
• On 1 November 2013, North Glasgow College, John Wheatley College and Stow College merged to form Glasgow Kelvin College
• On 31 July 2013, Anniesland College, Cardonald College and Langside College merged to form Glasgow Clyde College
• On 1 November 2013, Angus College and Dundee College merged to form Dundee and Angus College
• On 1 November 2013, Cumbernauld College and Motherwell College merged to form New College Lanarkshire, and on 1 April 2014, they were joined by Coatbridge College
• On 1 August 2013, Clydebank College, Reid Kerr College and James Watt College (Greenock campus) merged to form West College Scotland
The college full-time equivalents (FTEs) for HE students exclude the additional volume associated with students receiving extended learning support as this is not reported in the same way for HEIs.
4. The totals include Scottish domiciled students whose local authority was not recorded.
5. The above table does not include Scottish domiciled students at UK institutions outside of Scotland and does not represent rates of participation in Scottish local authorities.
6. Totals include students whose ages were not reported. In 2013-14 there were 115 students (95 at HEIs and 20 at colleges) whose ages were not reported. The majority of these students whose age was not reported were studying at sub-degree level. For qualifiers in 2013-14 there were 5 students whose ages were not reported.
7. The ‘Combined’ subject grouping is used in recognition of programmes of study which cut across different subject areas.
8. Prior to 2007-08, Environmental Science was included under the heading Geography. In 2007-08 a new subject classification system was introduced (JACS 2.0) and Environmental Science was no longer classified as Geography. The values associated with Geography for 2007-08 to 2013-14 therefore do not include Environmental Science students.
9. This table includes students at UK HEIs only and does not include students

33
studying at colleges.
10. The total for academic years prior to 2012-13 includes a small number of students at the Open University who are domiciled outside the UK.
11. Includes students from the Channel Islands and the Isle of Man and students from the UK whose specific country of domicile was not reported.
12. Total includes students from overseas whose specific country of domicile was not recorded.
13. Total includes UK and overseas students whose specific country of domicile was not reported.
14. Includes 15 HEI students and 680 college students whose disability status was not reported.
15. For colleges, students with an autistic spectrum disorder are included in the category 'A disability, impairment or medical condition not listed above' as they are not reported on separately.
16. Where universities are categorised as Ancient, Small Specialist Institutions, Post-92s or Newer Universities, these categories are comprised of the following HEIs:
Ancient Universities: University of Aberdeen, University of Edinburgh, University of Glasgow, University of St. Andrews;
Newer Universities: University of Dundee, Heriot-Watt University, University of Stirling, University of Strathclyde;
Post-92 Universities: University of Abertay Dundee, Queen Margaret University, Edinburgh, Glasgow Caledonian University, Edinburgh Napier University, University of the West of Scotland, Robert Gordon University and the University of the Highlands and Islands;
Small Specialist Institutions: SRUC, Royal Conservatoire of Scotland, Glasgow School of Art)
17. Deprived areas are defined as the 20 per cent lowest ranked areas in the Scottish Index of Multiple Deprivation (SIMD) for the relevant year. In this table, academic years 2001-02 to 2004-05 relate to SIMD 2004, 2005-06 and 2006-07 relate to SIMD 2006, academic years 2007-08 to 2010-11 relate to SIMD 2009 and academic years 2011-12, 2012-13 and 2013-14 relate to SIMD 2012.
18. The working population is defined as number of persons aged 16-64.
19. This data includes an update from the University of Aberdeen for awards in academic year 2006-07.

34
20. Aegrotat degrees; this is an honours degree without classification; awarded on the understanding that had the candidate not been unwell he or she would have passed.
21. Includes students obtaining qualifications from writing up and dormant status who were previously studying full-time.
22. The total in 2012-13 includes 230 students representing 30.1FTE whose gender was not reported. The total in 2013-14 includes 40 students representing 32.7 FTE whose gender was not reported.
23. The entrant figures shown in the table will not match Scottish domiciled entrant figures in other tables as not all postcodes from student records can be matched, e.g. if they are either incomplete or missing, to postcodes in SIMD. In 2013-14 98.3 per cent of entrant postcodes were successfully matched.
35
Annex B
Methodology, Data Definitions, and Quality Information
Counting of Associate Students
1. This publication reports the total number of student enrolments (instances) for each reporting year. As students can enrol on more than one course in any given year, this will mean that the actual number of students attending a HE course is less than the number of enrolments shown in the report. In some cases a student will enrol on two entirely separate courses in the same academic year and should therefore count more than once in our report but there are also occasions where the student will be counted twice on the same course for administrative purposes.
2. This can occur where a college and HEI share responsibility for the student, for
example, a HEI may act as the awarding body for a course that is partly delivered at college and at the HEI. This may mean the classes for the first year or two are delivered at college and later years at the HEI. This can be an excellent arrangement to improve access to University courses and as such, in 2013-14, SFC has funded around 1,000 additional places to be delivered under this arrangement.
3. These 1,000 places are not however the only students reported in this way as
this policy was built on existing good practice. SFC would therefore like to look at this issue in detail over the coming months to identify the actual overlap by studying individual records.
4. As there is a shared responsibility for these students across both the College
and HEI sectors it will not be a straightforward decision to include these students once in only the college or HEI sector if we decide that these enrolments should only be reported once.
5. SFC estimate the number of these associate students enrolled per academic
year ranges between 1,000 and 2,500, and they are present throughout time series’ presented in this report. As SFC increase funding for arrangements to improve access to University, it is anticipated that numbers of associate students will increase further in the coming academic years.
6. SFC would like to invite users to submit feedback via the e-mail address on the
front page of this report about how these enrolments should be counted in future editions of this publication.

36
Data Sources
7. This publication contains information on students from both colleges and higher education institutions (HEIs) who are attending Higher Education courses in Scotland. These statistics are collected by the Higher Education Statistics Agency (HESA) from HEIs and by the Scottish Funding Council (SFC) from further education colleges (colleges).
8. Where analysis refers to institutions (rather than HEIs or colleges) student data from both Scottish HEIs and Scottish colleges has been combined to report on all Scottish institutions.
Coverage
9. Following a consultation in 2007, the method of counting students at HEIs was changed in 2009 in order to provide a greater level of consistency with HESA. The figures in this publication that relate to higher education institutions are defined by HESA’s standard registration population. To allow comparisons across years all time-series have been revised according to this definition.
10. The standard registration population includes all higher education student instances active at a reporting institution at any point in the reporting period 1st August to 31st July except; dormant students, incoming visiting exchange students, students who study wholly outside the UK, students on sabbatical and writing up students.
11. Data from Scottish colleges continues to be reported in the same way as in previous years and excludes those students who do not complete the first 25% of their course (the point at which they become eligible for funding).
Student Instances
12. HESA’s Student Records use the term ‘instance’ to describe a student’s engagement within an institution. A student may enrol on more than one course and therefore have more than one instance. It is instances that are reported in this publication. This approach is consistent with that of HESA. The same approach is taken when reporting on student activity at Scottish colleges. Where references are made in this release to ‘students’ this should be interpreted as ‘instances’.
Full-time Equivalents
13. Full-time Equivalents (FTE) represent the expected hours of learning undertaken by a student during their course, as a proportion of the expected hours of learning of full-time study, according to the best academic judgement of the reporting institution. For example; a student with an FTE of 0.8 is

37
expected to undertake 20% fewer hours of learning relative to a full-time student on the same course, a student with an FTE of 1.2 is expected to undertake 20% more hours of learning relative to a full-time student on the same course.
14. At UK HEIs, full-time students are those normally required to attend an institution for periods amounting to more than 24 weeks within the year of study, on thick or thin sandwich courses, and those on a study-related year out of their institution. During that time students are normally expected to undertake periods of study, tuition or work experience which amount to an average of at least 21 hours per week. Full-time HE students at Scottish colleges are those which meet the criteria of at least 480 planned notional hours.
Open University
15. Students attending the Open University whose pre-study location (domicile) was in Scotland, are classified in this publication as studying at a Scottish HEI. Where comparisons are made to other UK countries, the Open University is regarded as a separate institution in each country. Students studying at the Open University whose pre-study location was outside the UK or recorded as an unknown UK domicile are excluded prior to 2012-13. This methodology differs from that used by HESA where the Open University is counted as a wholly English institution; as a result student figures reported in this release will differ from those reported by HESA.
UK Comparisons
16. Unless stated otherwise, data from UK institutions outside of Scotland are not included in the analysis. Where data from UK institutions outside of Scotland are included, the analysis compares only HEIs and does not include data from Scottish colleges. In 2013-14, 17.4% of HE students enrolled at Scottish institutions (including Open University students) were studying at Scottish colleges.
Entrants from Deprived Areas of Scotland
17. Analysis of entrants from deprived areas of Scotland is based on the Scottish Index of Multiple Deprivation (SIMD). The Scottish Index of Multiple Deprivation (2012) combines 38 indicators across seven domains, namely: income, employment, health, education, skills and training, housing, geographic access and crime. The overall index is a weighted sum of the seven domain scores. The weighting for each domain is based on the relative importance of the domain in measuring multiple deprivation, the robustness of the data and the time lag between data collection and the production of the SIMD.
18. Entrants from deprived areas are Scottish domiciled entrants to HE whose pre-

38
study location was within one of the 20% lowest ranked areas in Scotland. The SIMD is split into 6,505 small areas called datazones, with the 20% lowest ranked areas comprising of datazones 1 to 1301. A process of postcode matching was undertaken to identify which datazones students belonged to prior to study. In 2013-14, 98.3% of Scottish domiciled students were successfully matched through this process before entrant populations were defined. Entrants whose postcodes belonged to one of the 20% lowest ranked datazones in the SIMD are classified as entrants from deprived areas.
19. To date, there have been four SIMDs (SIMD 2004, SIMD 2006 SIMD 2009 and SIMD 2012). For each academic year contained within the analysis in this release, the most appropriate SIMD (relative to the time-period of applications to study HE in the UK) was selected for use with entrant data for the particular academic year.
20. In this release, academic years 2001-02 to 2004-05 relate to SIMD 2004, 2005-06 and 2006-07 relate to SIMD 2006, academic years 2007-08 to 2010-11 relate to SIMD 2009 and academic years 2011-12, 2012-13 and 2013-14 relate to SIMD 2012.
21. More information on the Scottish Index of Multiple Deprivation can be found at the following web address:
http://www.gov.scot/Topics/Statistics/SIMD
Domicile
22. UK domiciled students are those whose normal residence is in the UK, and for the purposes of this publication include Guernsey, Jersey and the Isle of Man. Officially, the Crown Dependencies of Guernsey, Jersey and the Isle of Man are not part of the UK or the EU. Guernsey and Jersey in this context refer to the Bailiwicks of Guernsey and Jersey, which includes their smaller islands.
23. Other European Union domiciled students are those whose normal residence prior to commencing their programme of study was in countries which were European Union (EU) members (excluding the UK) at 1 December of the reporting period. This includes Austria, Belgium, Bulgaria, Cyprus, Czech Republic, Denmark, Estonia, Finland, France, Germany, Gibraltar, Greece, Hungary, Ireland, Italy, Latvia, Lithuania, Luxembourg, Malta, Netherlands, Poland, Portugal, Romania, Slovakia, Slovenia, Spain and Sweden. Croatia, having joined the EU on 1 July 2013, is not included in 'Other European Union' for 2012-13 publications but will be treated as such from 2013-14 onwards.
24. Non-EU Europe includes European countries not included in the European Union; Albania, Azerbaijani Republic, Belarus, Bosnia and Herzegovina, Georgia, Faroe Islands, Iceland, Kazakhstan, Kyrgyz Republic, Liechtenstein, Macedonia,
39
Monaco, Norway, Russia, San Marino, Switzerland, Tajikistan, Turkey, Turkmenistan, Ukraine, Uzbekistan, Montenegro, Slovenia and Serbia.
25. Non-European-Union students are those whose normal residence prior to commencing their programme of study was outside the EU. Where Non-EU countries are shown separately, individual country figures exclude the country's overseas territories. These individual country figures are listed within the geographic region in which they lie.
Level of Study
26. Postgraduate students include; doctorate, masters, postgraduate bachelor’s degrees, postgraduate diplomas or certificates, PGCE/PGDE and professional qualification at postgraduate level. From 2007-08 professional graduate certificates in education have been reported as undergraduate qualifications and separately from postgraduate certificates in education, in years prior to this both were reported as postgraduate certificates in education.
27. First Degree students include; first degrees, first degrees with qualified teacher status, enhanced first degrees, first degrees obtained concurrently with a diploma and intercalated first degrees.
28. Sub-degree students include; Diploma of Higher Education (DipHE), Certificate of Higher Education (Cert HE), professional qualification at undergraduate level, foundation courses at HE level, HND, HNC, NVQ/SVQ levels 5 and 4, diplomas and certificates at undergraduate level and other formal HE qualifications of less than degree standard. Other Higher Education includes all sub-degree level study excluding HNCs/HNDs.
Subject Tables
29. Subject data from higher education institutions is apportioned to broadly reflect the weight of a particular subject within the study programmes of individual enrolments. This process is consistent with the treatment of subject breakdowns by the Higher Education Statistics Agency (HESA). As well as being counted in the main subject groupings, supplementary subjects are shown separately for clarity. Economics and Politics are included in Social Studies, English is included in Languages, Geography is included in Social Studies, Environmental Science is included in Physical Sciences and Psychology is included in Biological Sciences.
Data Presentation
30. In all tables in this release, figures have been rounded to the nearest 5, and 0, 1 and 2 have been rounded to 0. Unknown values are not displayed individually in tables but are included in totals. Figures may not sum to totals due to rounding

40
and the inclusion of unknown values. Figures and percentages in the text and charts are calculated from rounded values.
Use of Data for Funding
31. SFC use HESA Student Records for HEIs in Scotland to help determine whether institutions have met some of their targets in their Outcome Agreements. Failure to meet targets could potentially lead to financial penalties. Further information about SFC allocations of funding for HEIs and colleges for 2013-14 can be found at:
http://www.sfc.ac.uk/funding/Fundingdecisions/FundingDecisions.aspx
Related Publications
32. The publication has been preceded by the following related publications covering the 2013-14 academic year for Scotland:
HESA Statistical First Release 210- Student Enrolments and Qualifications published in January 2015:
https://www.hesa.ac.uk/sfr210
HESA publication 'Students in Higher Education Institutions 2013/14' published in February 2015:
https://www.hesa.ac.uk/index.php?option=com_pubs&Itemid=&task=show_year&pubId=1&versionId=25&yearId=312
College Performance Indicators 2013-14 published in January 2015:
http://www.sfc.ac.uk/communications/Statisticalpublications/2015/SFCST022015.aspx
College Baseline Report 2013-14 published in January 2015:
http://www.sfc.ac.uk/communications/Statisticalpublications/2015/SFCST012015.aspx
Data Quality Information
33. This section provides a summary of information on this output against five dimensions of quality: Relevance, Accuracy, Timeliness and Punctuality, Accessibility and Clarity, and Comparability.
Relevance
34. HESA is the official UK agency for the collection, analysis and dissemination of quantitative information about higher education at higher education

41
institutions. It was set up by agreement between the relevant government departments, the higher education funding councils and the universities and colleges. A primary purpose of the Student data collection is to provide each of the bodies listed below with accurate and comprehensive statistical information regarding student enrolments. SFC collects data on provision at colleges through the Further Education Statistics (FES) data collections.
35. The statistics are used both within and outside the Scottish Government and the Scottish Funding Council to monitor educational trends and as a baseline for further analysis of the underlying data. Some of the key users are:
• Ministers and the Scottish Parliament • Officials in the Scottish Government • Other government departments • The Scottish Funding Council • Higher Education Institutions and representative bodies • Students, researchers, and academics • Individual citizens, private companies, and the media 36. These statistics are used in a variety of ways. Some examples of these are:
• Advice to Ministers • To inform the education policy development and decision-making process in
Scotland • To answer parliamentary questions • General background and research • Inclusions in reports and briefings
Accuracy
37. The HESA Student Record and the student records for colleges contain information about individual enrolments, which, because a student can be enrolled on more than one programme of study, may exceed the number of students.
38. The procedures followed by HESA to ensure quality of the data are provided on the HESA website at:
http://www.hesa.ac.uk/index.php?option=com_studrec&Itemid=232&mnl=12051
39. HESA also provide draft student enrolment tables and lists of anomalies to all
statutory customers, including SFC, to review before tables are signed off as accurate.
The guidance issued by SFC for the submission of the Scottish college records is 40.

42
located at:
http://www.sfc.ac.uk/guidance/SubmittingStatisticalInformation/FE_statistical_data/stats_guidance_notes_1314.aspx
41. Colleges submit their returns via the FES ON LINE web tool which performs around 150 separate validations on each record. These validations are updated on an annual basis based on feedback from statistical advisory and performance indicator groups. These validations include ensuring returns are submitted in line with FES guidance. As well as performing data validation, the FES ON LINE system provides colleges with management reports which include summaries of the college returns by level, council area, ethnicity and disability and by SIMD quintiles. The reports also provide comparison with the data for previous years.
42. SFC allocates £500m per year to colleges to support places for students and to provide financial student support. As a result colleges undergo significant audit of their student records to ensure these funds are being spent in line with guidance. This includes verifying student enrolment details and checking of withdrawal information. The funding allocations include a postcode premium for recruitment from deprived areas. As well as incentivising colleges to recruit students from deprived areas this also ensures SFC received high quality postcode data.
43. SFC has prioritised recruitment from the 16 to 24 age group in recent years. Since 2012-13 colleges have set recruitment targets for these priority groups within their outcome agreements. This will have had an impact on the recruitment profile which is closely monitored through the quarterly FES returns as part of the outcome agreement monitoring process. It will also have an effect on data quality as colleges monitor data more closely and at an earlier point in the academic year meaning reporting errors are picked up earlier and corrected before the student record is returned to SFC.
44. The following table gives the proportions of the overall student populations at Scottish HEIs and colleges where the ethnicity and disability were unknown, both for all students and for Scottish domiciled students only. The proportion of Scottish-domiciled students at Scottish HEIs and colleges for whom their unitary authority of residence was not recorded is also given.

43
Proportion unknown for key variables
45. Scottish HEIs are only required to return ethnicity information for UK-domiciled
students.
46. HESA changed the reporting requirements for disability information for the 2010-11 academic session so that new entrants from 2010-11 onwards for whom it was not known whether or not the students had a disability had to be recorded as having ‘no known disability’.
Timeliness and Punctuality
47. HESA collected student enrolment data for the 2013-14 academic year between August and October 2014. They produced their first statistical release in January 2015 and follow this up with the annual publication ‘Students in Higher Education Institutions’ which was released on 12 February 2015. SFC produced this bulletin in March 2015, meeting the planned date of publication.
Accessibility and Clarity
48. This statistical bulletin is pre-announced and then published on Scottish Funding Council website. It is accompanied by more detailed tables available on the website only, a free to use service.
Comparability
HESA collects student enrolment data from all publicly funded UK HEIs, so 49.comparison with other countries within the UK is possible. The Statistical First
Proportion of Unknowns for key variables 2012-13 2013-14LA unknown forScottish Domiciles
HEIs 0.4% 0.5%Colleges 2.3% 2.0%
Ethnicity unknownHEIs
Scottish Domiciles 2.3% 2%All HEI students 11.5% 11.9%
Colleges Scottish domiciles 2.2% 2.1%All college students 2.1% 2.1%
Disability unknownHEIs
Scottish domiciles 0.0% 0.0%All HEI students 0.0% 0.0%
Colleges Scottish domiciles 3% 1.4%All college students 3% 1.4%

44
Release ‘Higher Education Student Enrolments and Qualifications Obtained at Higher Education Institutions’ in the United Kingdom’ provides information on this topic, see https://www.hesa.ac.uk/sfr210.

45
Complete list of tables available on SFC website
Table Title
1 Students in higher education at Scottish HEIs and colleges by institution type and level of study, 2004-05 to 2013-14
2 Students in higher education in HEIs in Scotland by institution, 2004-05, 2012-13 and 2013-14
3 Students in higher education in Colleges in Scotland by institution, 2004-05, 2012-13 and 2013-14
4 Full-time equivalents (FTE) of students in higher education in Scottish HEIs and colleges by gender, 2005-06 to 2013-14
5 Scottish domiciled students in higher education at Scottish HEIs and colleges by domicile (local authority), 2007-08 to 2013-14
6 Students in higher education in Scottish HEIs and colleges by mode of study and gender, 2004-05 to 2013-14
7 Distance learning students in higher education in Scottish HEIs and colleges by gender and level of study, 2004-05 to 2013-14
8 Students in higher education in Scottish HEIs and colleges by age, 2004-05 to 2013-14
9 Students in higher education in Scottish HEIs and colleges by age and level of study, 2004-05 to 2013-14
10a Students in higher education in Scottish HEIs and colleges by subject and level of study, 2013-14
10b Students in higher education in Scottish HEIs and colleges by subject and gender, 2013-14
10c Students in higher education in Scottish HEIs and colleges by subject, 2004-05 to 2013-14
11 Students in higher education at UK HEIs by country of institution and level of study, 2009-10 to 2013-14
12 Full-time equivalents (FTE) of students in higher education in UK HEIs by gender, 2009-10 to 2013-14
13 Entrants to higher education in Scottish HEIs and colleges by level of study and academic year, 2004-05 to 2013-14
14 Entrants in higher education in Scottish HEIs and colleges by age and level of study, 2004-05 to 2013-14
15 Entrants to higher education in Scottish HEIs and colleges by level, subject and gender, 2013-14
16 Entrants to higher education in Scottish HEIs and colleges by subject and gender, 2013-14
17 Scottish domiciled entrants in higher education at Scottish HEIs and colleges by domicile (local authority), 2008-09 to 2013-14
18 Entrants in higher education at UK HEIs by country of institution and level of study, 2009-10 to 2013-14
19 Scottish domiciled students in higher education at HEIs and colleges in the UK by country of institution and level of study, 2013-14
20 Students in higher education at Scottish HEIs and colleges by domicile and type of institution, 2013-14
21 Students in higher education at Scottish HEIs and colleges by domicile and level, 2004-05 to 2013-14
22 Entrants to higher education in Scottish HEIs and colleges by domicile and level, 2004-05 to 2013-

46
14
23 Students in higher education at UK HEIs by domicile and country of institution, 2009-10 to 2013-14
24a and b
Students in higher education in Scottish HEIs and colleges by receipt of Disabled Students Allowance (DSA) and disability type, 2013-14
25a Scottish domiciled entrants from deprived areas to higher education in the UK by institution type, 2013-14
25b Scottish domiciled entrants from Deprived Areas to Higher Education in the UK by institution type and academic year, 2004-05 to 2013-14
26 Students in higher education at Scottish HEIs and colleges by detailed level of study and ethnicity, 2013-14
27 Entrants to higher education at Scottish HEIs and colleges by ethnicity, 2004-05 to 2013-14
28 Qualifiers from higher education courses at Scottish institutions by institution type, level of qualification obtained and academic year, 2004-05 to 2013-14
29 Qualifiers from higher education courses at Scottish institutions by mode of study and gender, 2004-05 to 2013-14
30 Qualifiers from Higher Education courses at Scottish institutions by level of qualification obtained age group and academic year, 2004-05 to 2013-14
31 Qualifiers from Higher Education courses in HEIs in Scotland by institution, 2004-05, 2012-13 and 2013-14
32 Qualifiers from Higher Education courses in Colleges in Scotland by institution, 2004-05, 2012-13 and 2013-14
33 Table 33, Qualifiers from higher education courses at Scottish institutions by detailed qualification level of qualification obtained and institution type, 2013-14
34 Qualifiers from higher education courses at Scottish institutions by subject of study and academic year, 2004-05 to 2013-14
35 Qualification classification of qualifiers from first degree courses at Scottish HEIs by gender, award and academic year, 2004-05 to 2013-14
36 Qualifiers from higher education courses at Scottish institutions by qualification obtained, pre-study domicile and academic year, 2004-05 to 2013-14
37a Scottish domiciled qualifiers from higher education courses at Scottish HEIs and colleges by detailed level of study and ethnicity, 2013-14
38 Disability as a Percentage of Student Population, 2013-14
39a Qualifiers from higher education courses at Scottish institutions by local authority and level of qualification obtained, 2013-14
39b Qualifiers from higher education courses at Scottish institutions by local authority and academic year, 2008-09 to 2013-14
40 Qualifiers from higher education courses at UK HEIs by country of institution, level of qualification obtained and academic year, 2009-10 to 2013-14
41 Higher Education Initial Participation Rate (HEIPR) 2012-13 and 2013-14
42 Young Participation Rate (YPR) for 2013 Cohort