Embed Size (px)
Citation preview

Higher Education Sector: The Market’s PerspectiveNovember 2019

Section 1 Sector Outlook and Trends
Section 2 Financial Strength Monitoring: NECHE Pilot Program

November 2019
Page 2Rating Agency Outlooks The rating agencies provide at least annual outlooks on their views of the higher education sector,
however S&P’s outlooks focus more on the balance of rating changes than Moody’s. Moody’s approach is to forecast estimates of revenue and expense growth trends for the sector and
thereby set an outlook that reflects the “fundamental credit conditions” impacting the sector over the next 12‐18 months.
S&P rates approximately 260 private colleges and universities as well as 150 public institutions. Moody’s rates approximately 245 private colleges and universities as well as 190 public institutions, not
including community colleges that are rated primarily by other teams. Enrollment at rated institutions likely covers more than 75% of four‐year, non‐profit and public
institution enrollment. In any given year, the vast majority of ratings reviewed are affirmed, however for every upgrade of a
rating, there have generally been more downgrades in recent years.
2017 2018 2019 2016 2017 2018 2019 2016 2017 2018 2019
Higher Ed Bifurcated *US Community Colleges *
PositiveStableNegative
2016S&P Moody's Fitch
November 2019
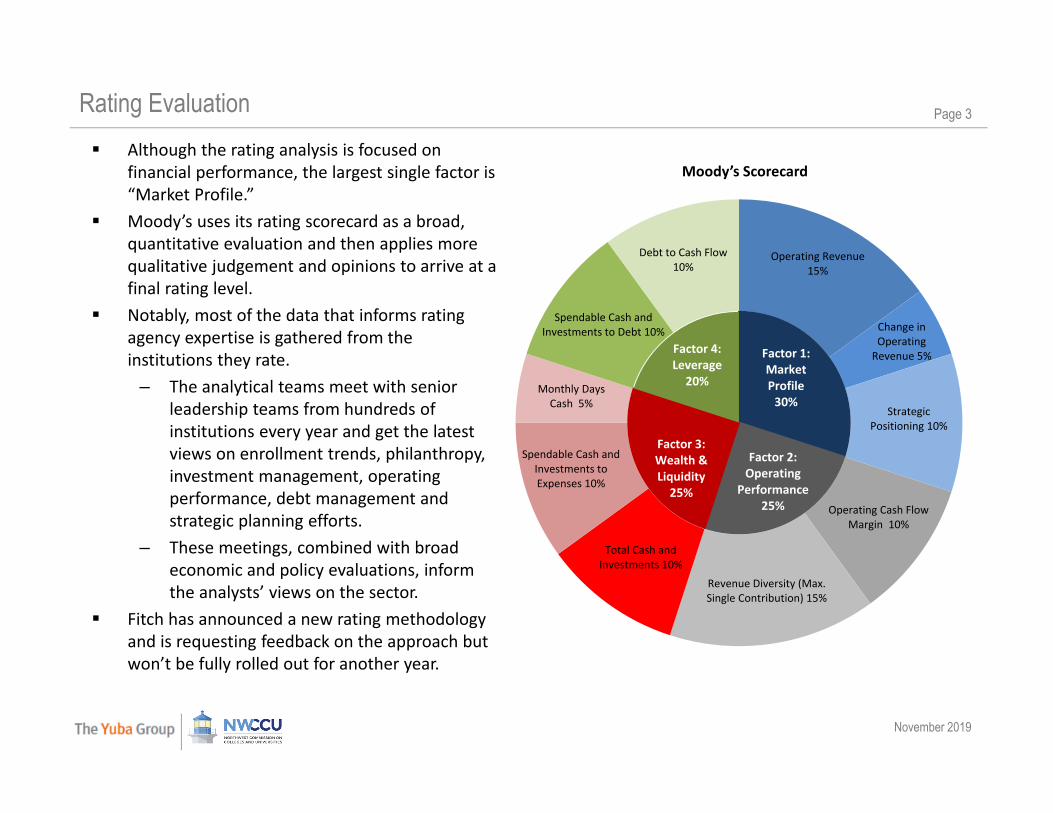
Page 3Rating Evaluation Although the rating analysis is focused on
financial performance, the largest single factor is “Market Profile.”
Moody’s uses its rating scorecard as a broad, quantitative evaluation and then applies more qualitative judgement and opinions to arrive at a final rating level.
Notably, most of the data that informs rating agency expertise is gathered from the institutions they rate.– The analytical teams meet with senior
leadership teams from hundreds of institutions every year and get the latest views on enrollment trends, philanthropy, investment management, operating performance, debt management and strategic planning efforts.
– These meetings, combined with broad economic and policy evaluations, inform the analysts’ views on the sector.
Fitch has announced a new rating methodology and is requesting feedback on the approach but won’t be fully rolled out for another year.
Operating Revenue 15%
Change in Operating Revenue 5%
Strategic Positioning 10%
Operating Cash Flow Margin 10%
Revenue Diversity (Max. Single Contribution) 15%
Total Cash and Investments 10%
Spendable Cash and Investments to Expenses 10%
Monthly Days Cash 5%
Spendable Cash and Investments to Debt 10%
Debt to Cash Flow10%
Moody’s Scorecard
Factor 1: Market Profile30%
Factor 2: Operating
Performance25%
Factor 3: Wealth & Liquidity25%
Factor 4: Leverage20%
November 2019
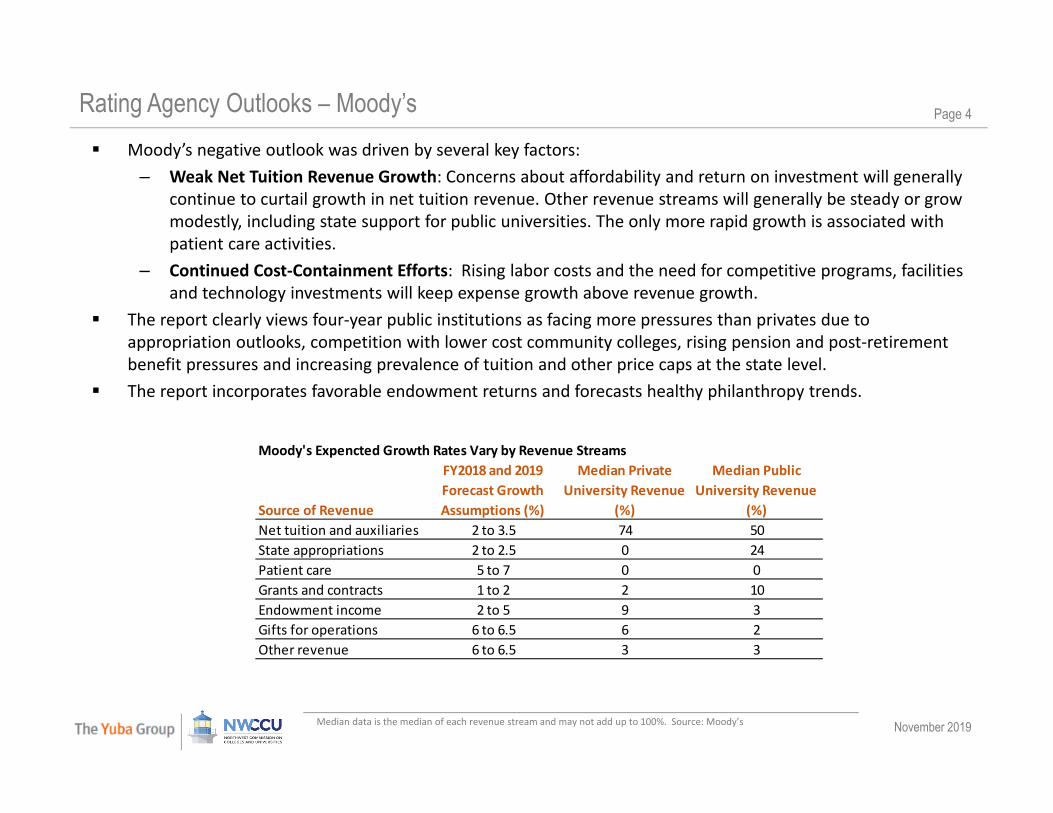
Page 4Rating Agency Outlooks – Moody’s Moody’s negative outlook was driven by several key factors:
– Weak Net Tuition Revenue Growth: Concerns about affordability and return on investment will generally continue to curtail growth in net tuition revenue. Other revenue streams will generally be steady or grow modestly, including state support for public universities. The only more rapid growth is associated with patient care activities.
– Continued Cost‐Containment Efforts: Rising labor costs and the need for competitive programs, facilities and technology investments will keep expense growth above revenue growth.
The report clearly views four‐year public institutions as facing more pressures than privates due to appropriation outlooks, competition with lower cost community colleges, rising pension and post‐retirement benefit pressures and increasing prevalence of tuition and other price caps at the state level.
The report incorporates favorable endowment returns and forecasts healthy philanthropy trends.
Median data is the median of each revenue stream and may not add up to 100%. Source: Moody’s
Moody's Expencted Growth Rates Vary by Revenue Streams
Source of Revenue
FY2018 and 2019 Forecast Growth Assumptions (%)
Median Private University Revenue
(%)
Median Public University Revenue
(%)Net tuition and auxiliaries 2 to 3.5 74 50State appropriations 2 to 2.5 0 24Patient care 5 to 7 0 0Grants and contracts 1 to 2 2 10Endowment income 2 to 5 9 3Gifts for operations 6 to 6.5 6 2Other revenue 6 to 6.5 3 3

November 2019
Page 5Rating Agency Outlooks – S&P S&P’s outlook forecast the greatest challenges for “the middle,” meaning schools that aren’t the most
selective or aren’t close to open access. – These schools are viewed as having the most challenging message to convey to parents and students
who are looking more and more for “value” for their tuition dollars.– The view seems to be that community colleges face fewer challenges because they do not face the same
skepticism about overall cost and student indebtedness while also potentially serving the need for flexible, skill‐based programs that directly address employer needs.
– Highly selective institutions’ depth of demand and ability to support broad financial aid programs shields these institutions as well.

November 2019
Page 6Key Sector Outlook Themes
Affordability– Value perception– Loans / Indebtedness– Political pressures– Competition
International Student Market ChangesDemographicsGovernment– Taxation– Increasing regulation
Expense Pressures– Healthcare– Compliance– Wages & Low Unemployment– Infrastructure
Growing Distrust/Skepticism on Value of DegreeFor‐Profit Competition & Deregulation
Delivery Methods– Online– Asynchronous– Competency based– Corporate / Workplace delivery
PhilanthropyEfficiency / Expenses– Multi‐institutional pooling– Mergers?
Pressures: Opportunities:
November 2019
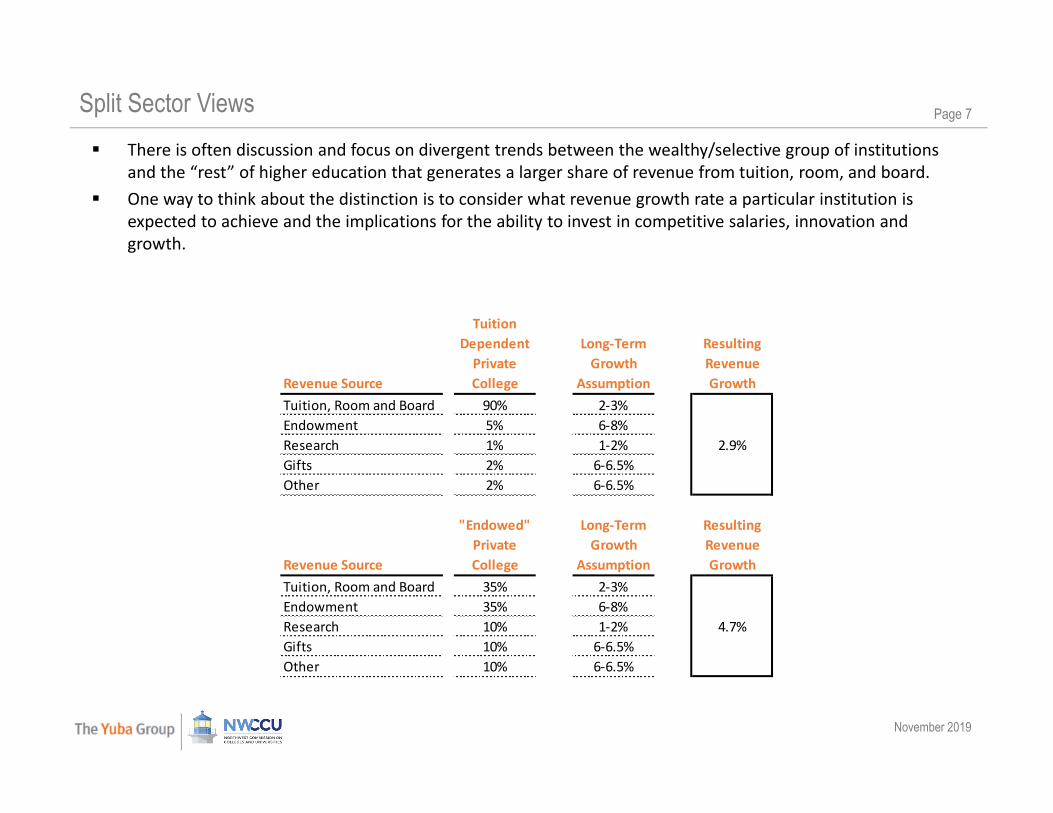
Page 7Split Sector Views There is often discussion and focus on divergent trends between the wealthy/selective group of institutions
and the “rest” of higher education that generates a larger share of revenue from tuition, room, and board. One way to think about the distinction is to consider what revenue growth rate a particular institution is
expected to achieve and the implications for the ability to invest in competitive salaries, innovation and growth.
Revenue Source
Tuition Dependent Private College
Long‐Term Growth
Assumption
Resulting Revenue Growth
Tuition, Room and Board 90% 2‐3%Endowment 5% 6‐8%Research 1% 1‐2%Gifts 2% 6‐6.5%Other 2% 6‐6.5%
Revenue Source
"Endowed" Private College
Long‐Term Growth
Assumption
Resulting Revenue Growth
Tuition, Room and Board 35% 2‐3%Endowment 35% 6‐8%Research 10% 1‐2%Gifts 10% 6‐6.5%Other 10% 6‐6.5%
2.9%
4.7%

November 2019
Page 8One View into “Haves” vs “Have Nots” Evidence of challenges
for “have‐nots” in the sector has been growing.
Schools in the bottom tier of the WSJ/Times Higher Ed ranking have seen a sharp divergence in enrollment trends since 2010.

November 2019
Page 9Net Tuition Revenue - Publics Net tuition revenue has been under pressure since the financial crisis with large numbers of colleges
experiencing declines in revenue and most facing growth at or below inflation. Because of the annual and four‐year cycle of classes, trends in net tuition may lag “current” trends. FY2019 and 2020 projections seem to indicate the long‐term picture remains challenging.

November 2019
Page 10Net Tuition Revenue - Privates
November 2019
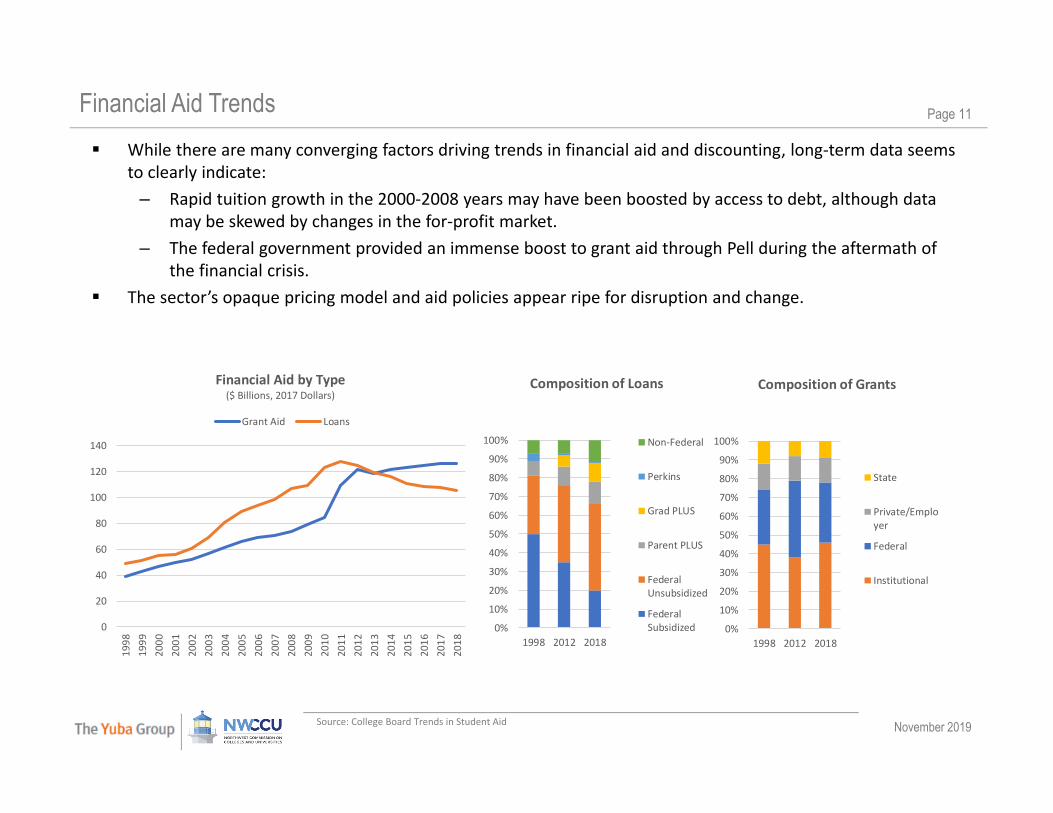
Page 11Financial Aid Trends While there are many converging factors driving trends in financial aid and discounting, long‐term data seems
to clearly indicate:– Rapid tuition growth in the 2000‐2008 years may have been boosted by access to debt, although data
may be skewed by changes in the for‐profit market.– The federal government provided an immense boost to grant aid through Pell during the aftermath of
the financial crisis. The sector’s opaque pricing model and aid policies appear ripe for disruption and change.
Source: College Board Trends in Student Aid
0
20
40
60
80
100
120
140
1998
1999
2000
2001
2002
2003
2004
2005
2006
2007
2008
2009
2010
2011
2012
2013
2014
2015
2016
2017
2018
Financial Aid by Type($ Billions, 2017 Dollars)
Grant Aid Loans
0%
10%
20%
30%
40%
50%
60%
70%
80%
90%
100%
1998 2012 2018
Composition of Loans
Non‐Federal
Perkins
Grad PLUS
Parent PLUS
FederalUnsubsidized
FederalSubsidized 0%
10%
20%
30%
40%
50%
60%
70%
80%
90%
100%
1998 2012 2018
Composition of Grants
State
Private/Employer
Federal
Institutional

November 2019
Page 12Governmental Expenditures on Higher Education Although state funding faced pressures after the financial crisis as state tax revenues were constrained,
federal funding in aggregate across all funding types expanded dramatically helping to cushion the impact. Considering the potential for another recession in the future, the governmental funding support and cushion
for the sector may not repeat and lead to more significant impacts on various revenues sources.
$64 $70$90
$111 $115 $109 $105 $107 $102 $101 $108
$89 $92$90
$88 $83$77 $77 $80 $84 $86
$87
$0
$50
$100
$150
$200
$250
2007 2008 2009 2010 2011 2012 2013 2014 2015 2016 2017
State and Federal Support for Higher Education($Billions, adjusted for inflation)
Total Federal Total State
Source: Pew Charitable Trust, “Two Decades of Change in Federal and State Higher Education Funding
November 2019
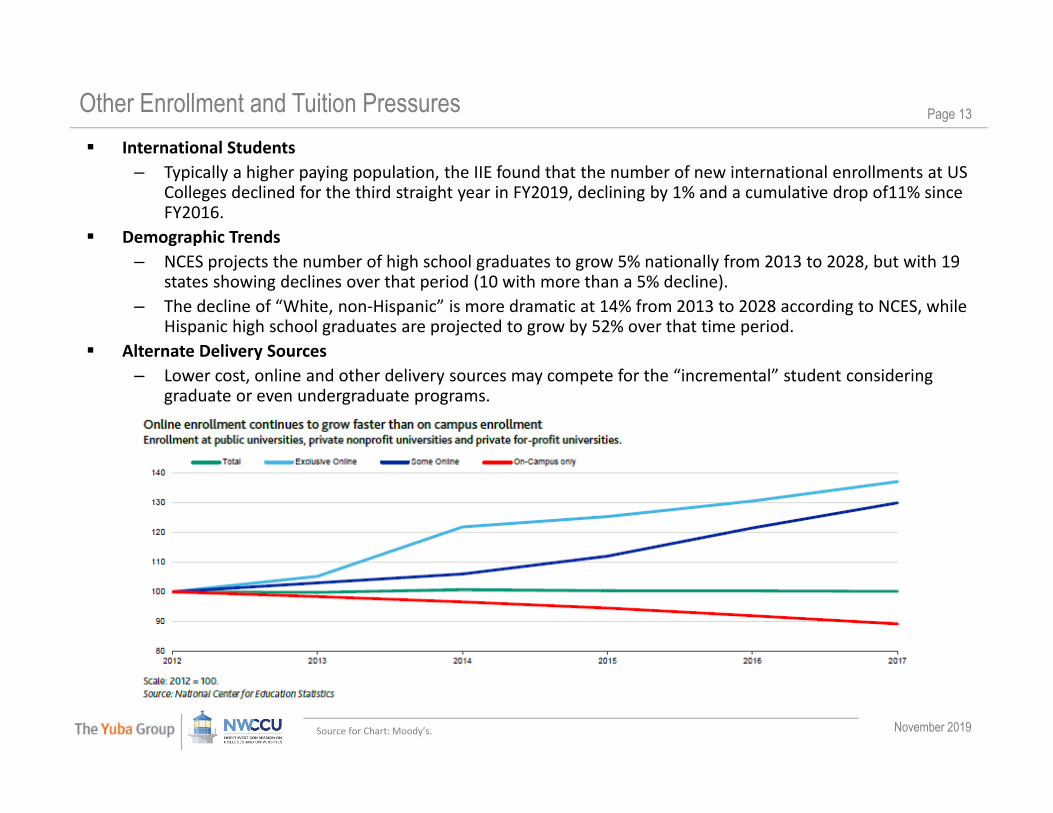
Page 13Other Enrollment and Tuition Pressures International Students
– Typically a higher paying population, the IIE found that the number of new international enrollments at US Colleges declined for the third straight year in FY2019, declining by 1% and a cumulative drop of11% since FY2016.
Demographic Trends– NCES projects the number of high school graduates to grow 5% nationally from 2013 to 2028, but with 19
states showing declines over that period (10 with more than a 5% decline).– The decline of “White, non‐Hispanic” is more dramatic at 14% from 2013 to 2028 according to NCES, while
Hispanic high school graduates are projected to grow by 52% over that time period. Alternate Delivery Sources
– Lower cost, online and other delivery sources may compete for the “incremental” student considering graduate or even undergraduate programs.
Source for Chart: Moody’s.

November 2019
Page 14Public Opinion & Perception The narrative around higher education has clearly shifted; after decades of a “mantra” of more enrollment in
higher education would lead to better pay and better growth for the economy, the narrative in popular press has focused on stories of astronomical indebtedness and majors or programs with little practical application. – In a recent survey, 42% of respondents agreed with the statement that “for most high school students,
pursuing a college degree is not a worthwhile investment because it will lead to student debt with little chance of finding a good‐paying job.”
Articles have also focused on indebtedness with headlines about the “all‐time high” balances of student loans at $1.6 trillion and balances of student loans rising 157% in the past eleven years.
The general positive or negative view of higher education comes back to impact the sector at a variety of levels, including policymaking, overall enrollment trends, and family decision‐making on affordability. – Higher education is tremendously diverse and the nuances of how the trends in debt and opinion polls
are influenced by economic conditions, for‐profit institution practices, and geography are unlikely to be dealt with in the media.
Similarly, in the policy arena, the political narrative has largely followed the public opinion and media coverage tone.– The perception of higher education as “elite”, wealthy, inefficient and slow to adapt seems to be
embedded in many policy proposals. – Adopted tax reform in 2017 may have, at least in part, been reflective of these pressures.
Section 1 Sector Outlook and Trends
Section 2 Financial Strength Monitoring: NECHE Pilot Program

November 2019
Page 16Financial Oversight Development The closure of several small institution in the New England region, including a disruptive and
high profile closure of Mount Ida College, created significant pressure to enhance financial oversight of schools in the political and policy arena.
NECHE worked to strengthen its review of financially fragile institutions and to ensure that all governing boards understand their responsibilities with respect to financial monitoring.
NECHE adopted a pilot program following the recommendations of the Boston Consortium for Higher Education, which included a governance training effort and a financial screening tool. – The financial screening tool was developed by The Yuba Group in conjunction with The
Boston Consortium and other experts as a complement to NECHE’s existing oversight process.

November 2019
Page 17Screening Process Overview
Data Collection‐Audited Financials‐Summary enrollment
Screen 1‐Quantitative only
Pass Fail‐No other actions ‐ARFE data request‐Data collection annually
Data Collection‐Interim financials and enrollment data‐Other tailored requests
Screen 2‐Quantitative and Qualitative‐ARFE Committee Review
Pass* Fail*‐Return to Screen 1 the following year
‐Public Notice / Show Cause / Probation
‐Demonstrate teachout responsibility awareness
‐Required teachout plan
1
22
3
Enhanced Screening Key Steps:All institutions submit data necessary to run the screenNECHE processes screen to identify institutions for ARFE reviewNECHE’s ARFE committee reviews all data and determines appropriate actions for institutions that fail the quantitative screen
‐ ARFE committee enhanced bynew metrics and consistent data as baseline

November 2019
Page 18Screening Summary

November 2019
Page 19Sample Dashboard The table below was shared with NECHE as a potential dashboard for ARFE committee members to observe
trends over time of the key screening metrics. For institutions, a similar approach may make sense in order to monitor performance against the screen. However, for each institution more relevant and detailed metrics could likely be identified to be more
valuable to governance and management team discussions and planning.

November 2019
Page 20Background on Yuba Group The Yuba Group provides independent, objective analysis and advice to not‐for‐profit and higher education
Institutions through its offices in Boston, New York and San Francisco. The firm’s professionals have extensive prior direct experience with investment banking, rating agency, underwriting and swap activities in addition to providing advisory services.
Yuba clients include a broad range of higher education and not‐for‐profit Institutions. In addition to assisting in the issuance of taxable and tax‐exempt bonds, as well as direct bank purchases, letter of credit substitutions, swap unwinds and restructurings, the firm works with its clients on capital project and financing strategies, debt capacity analyses and developing debt/swap management guidelines.
Contact:Roger Goodman, PartnerThe Yuba Group [email protected]
UNIVERSITY OF RICHMOND

November 2019
Page 21Disclaimer The Yuba Group LLC does not provide tax, legal and/or accounting advice. Changes to the assumptions outlined in these materials may
have an impact on the results. All market prices, data and other information are not warranted as to completeness or accuracy and are subject to change without notice. Any statements made herein do not necessarily reflect those of The Yuba Group LLC.
Receipt of these materials does not constitute a municipal advisory or fiduciary relationship unless otherwise documented in a formal engagement agreement.
The Yuba Group LLC shall not be liable for any loss or liability suffered by you resulting from the provision of the information or your use or reliance in any way on the information.
Pursuant to Municipal Securities Rulemaking Board (“MSRB”) Rule G‐42, on Duties of Non‐Solicitor Municipal Advisors, Municipal Advisors are required to make certain written disclosures to clients which include, among other things, conflicts of interest and any legal or disciplinary events of the firm and its associated persons.– Conflicts of Interest
The Yuba Group represents that in connection with the issuance of municipal securities, Yuba may receive compensation from anissuer or “obligated person” for services rendered, which compensation is contingent upon the successful closing of a transaction and/or is based on the size of a transaction. Consistent with the requirements of MSRB Rule G‐42, Yuba hereby discloses that such contingent and/or transactional compensation may present a potential conflict of interest regarding Yuba’s ability to provideunbiased advice to enter into such transaction. This conflict of interest will not impair Yuba’s ability to render unbiased and competent advice or to fulfill its fiduciary duty to the issuer or to fulfill its duty of care to an obligated person.If Yuba becomes aware of any additional potential or actual conflict of interest after this disclosure, Yuba will disclose the detailed information in writing to the issuer or obligated person in a timely manner.
– Legal or Disciplinary EventsYuba currently does not have any legal events or disciplinary history on Yuba’s Form MA and Form MA‐I, which includes information about any criminal actions, regulatory actions, investigations, terminations, judgments, liens, civil judicial actions, customercomplaints, arbitrations and civil litigation. Issuers and obligated persons may electronically access Yuba’s most recent Form MA and each most recent Form MA‐I filed with the Commission at the following website: http://www.sec.gov/edgar/searchedgar/companysearch.html.There have been no material changes to a legal or disciplinary event disclosure on any Form MA or Form MA‐I filed with the SEC. If any material legal or regulatory action is brought against Yuba, we will provide complete disclosure to our clients in detail allowing such client to evaluate Yuba, its management and personnel.
Additional disclaimers and conditions are available at http://www.yubagroup.com/disclaimer.