Embed Size (px)
Citation preview

www.steunpuntSSL.be
HIGHER EDUCATION GRADUATES AND THEIR
EMPLOYABILITY
Walter Van Trier HIVA (KU Leuven) and Faculty of Economics and Business Administration (Ghent University)
1st International Conference on Graduate Employability
Follow Project – Lissabon October 11/12, 2012
STRUCTURE OF PRESENTATION
• EU-Policy Context and the (proposed) EU-Employability
Benchmark
• What brings higher education graduates in the orbit of
an ‘employability’ discourse?
• Which questions should one really ask? And which
‘indicators’ follow from this?
• Is there recent research that show us the way forward?
• Final remarks
7-12-2012 Follow – Lissabon October 11/12, 2012 2
EU-POLICY CONTEXT
AND
EU-EMPLOYMENT BENCHMARK
7-12-2012 Follow – Lissabon October 11/12, 2012 3
EMPLOYABILITY AND THE ‘BOLOGNA
PROCESS’ (I)
• What is employability?
“There are many definitions of employability. For the
purpose of the Bologna Follow-up Group, employability is
defined as the ability to gain initial employment, to
maintain employment, and to be able to move around
within the labour market.”
7-12-2012 Follow – Lissabon October 11/12, 2012 4
WHAT AND WHEN IS EDUCATION
EXPECTED TOCONTRIBUTE?
• Preparation for employment
– Capacity of Education and Training Systems to equip young
people with key competences and necessary motivation and
understanding of the labour market
• Transition from education to employment
– Capacity of Education and Training Systems to (create)
link(eage)s to employers and the world of work
• Stay in employment and progress in career
– Capacity of Education and Training Systems to update and
upgrade the knowledge and skills of workers
7-12-2012 Follow – Lissabon October 11/12, 2012 5
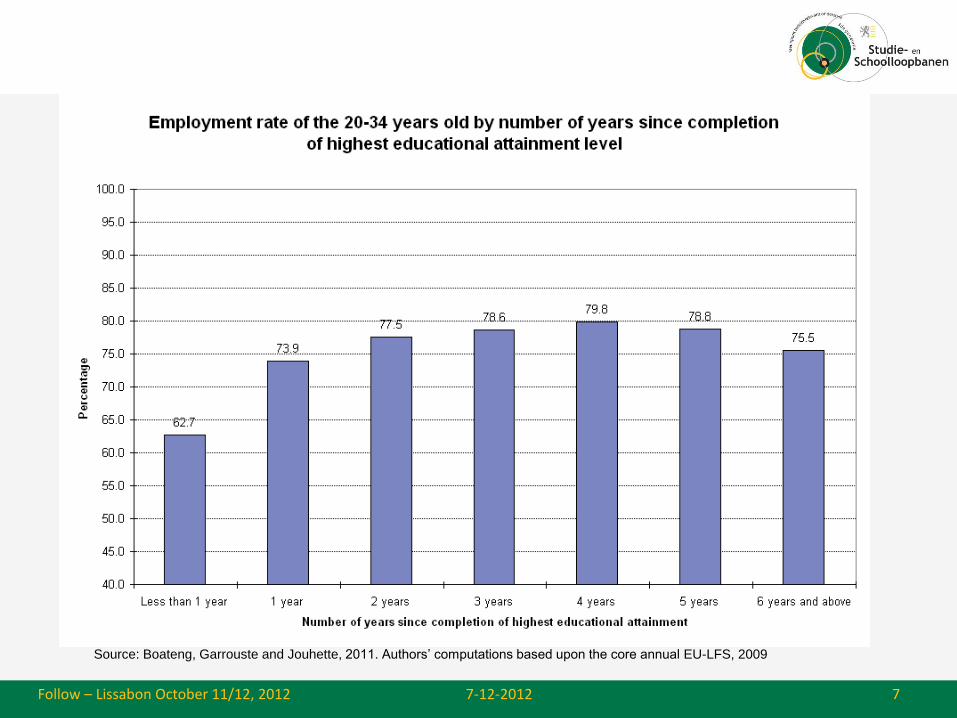
PROPOSAL FOR A BENCHMARK
• Working Group on Employability => proposal for a
benchmark
• Since the labour market entry entry takes longer and
becomes more chaotic, proposal to use the average of the
employment rate for young people within the same birth
cohort, being one, two or three years after leaving the
educational system.
• EU-LFS as only existing comparative data-set
7-12-2012 Follow – Lissabon October 11/12, 2012 6
7-12-2012 Follow – Lissabon October 11/12, 2012 7
Source: Boateng, Garrouste and Jouhette, 2011. Authors’ computations based upon the core annual EU-LFS, 2009
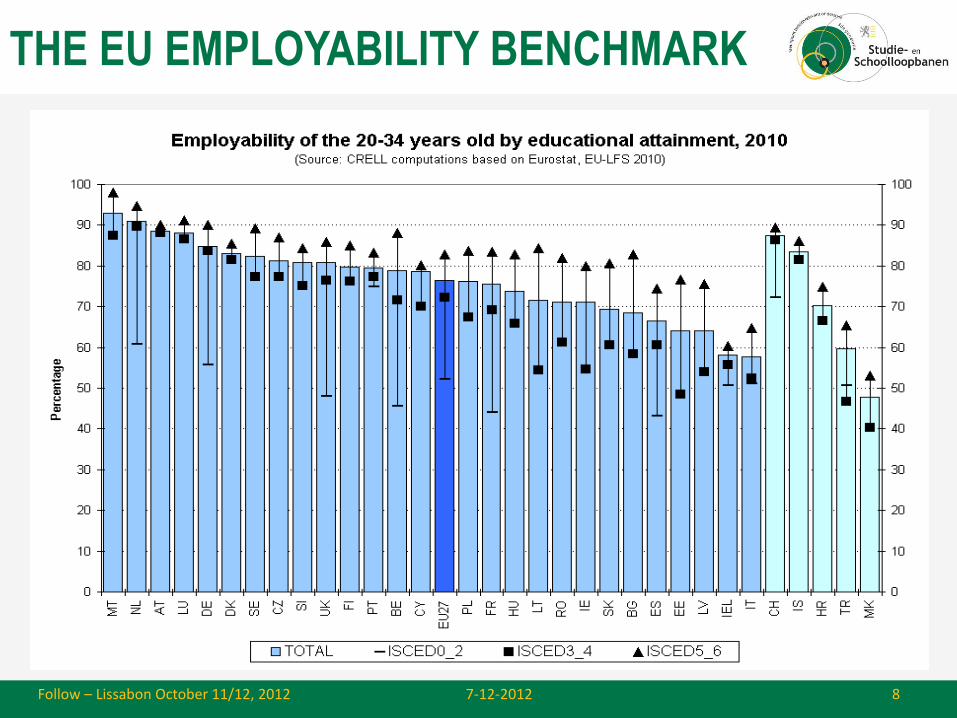
THE EU EMPLOYABILITY BENCHMARK
7-12-2012 Follow – Lissabon October 11/12, 2012 8

SOME EXTENSIONS ARE POSSIBLE
• Given the data available in the EU-LFS, this general procedure
could be applied to several sub-groups (gender, ethnicity, field of
education, …)
• Or be used with different definitions of what is considered to be
‘employment’ (full time, type of contract, etc.), although data
would refer to ‘employment’ at the time of the interview
• Special modules added to the EU-LFS in 2000 and 2009 would
also allow to look more in detail at the transition period (like
length of the search period to first job, …)
Nevertheless, availability of comparative data is limited
7-12-2012 Follow – Lissabon October 11/12, 2012 9
WHY DO HIGHER EDUCATION
GRADUATES ENTER THE
‘EMPLOYABILITY’ DISCOURSE?
7-12-2012 Follow – Lissabon October 11/12, 2012 10
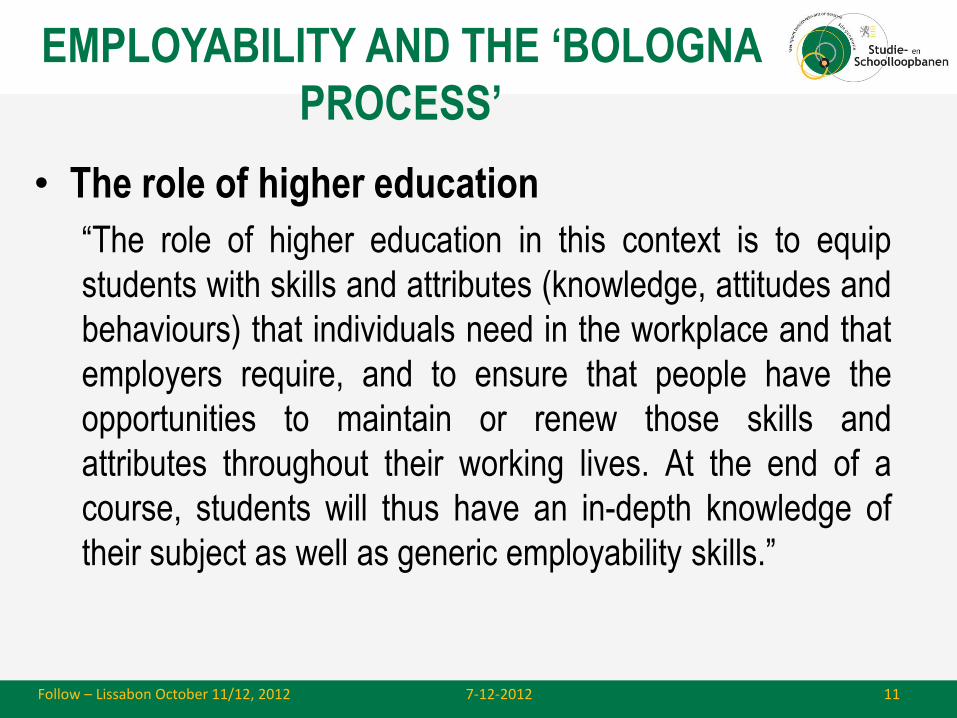
EMPLOYABILITY AND THE ‘BOLOGNA
PROCESS’
• The role of higher education
“The role of higher education in this context is to equip
students with skills and attributes (knowledge, attitudes and
behaviours) that individuals need in the workplace and that
employers require, and to ensure that people have the
opportunities to maintain or renew those skills and
attributes throughout their working lives. At the end of a
course, students will thus have an in-depth knowledge of
their subject as well as generic employability skills.”
7-12-2012 Follow – Lissabon October 11/12, 2012 11

7-12-2012 Follow – Lissabon October 11/12, 2012 12
U. TEICHLER (Higher Education in Europe, vol.23, 1998, n°4)
“The transition from higher education to employment is viewed as a
phenomenon that deserves attention, for graduation from a higher
education institution is no longer a guarantee of a prestigious
position and demanding job tasks. (…) It is obvious that transition
from higher education to employment has become a complex
process that requires substantial time and effort and often
stretches over a long period.” (p.556)
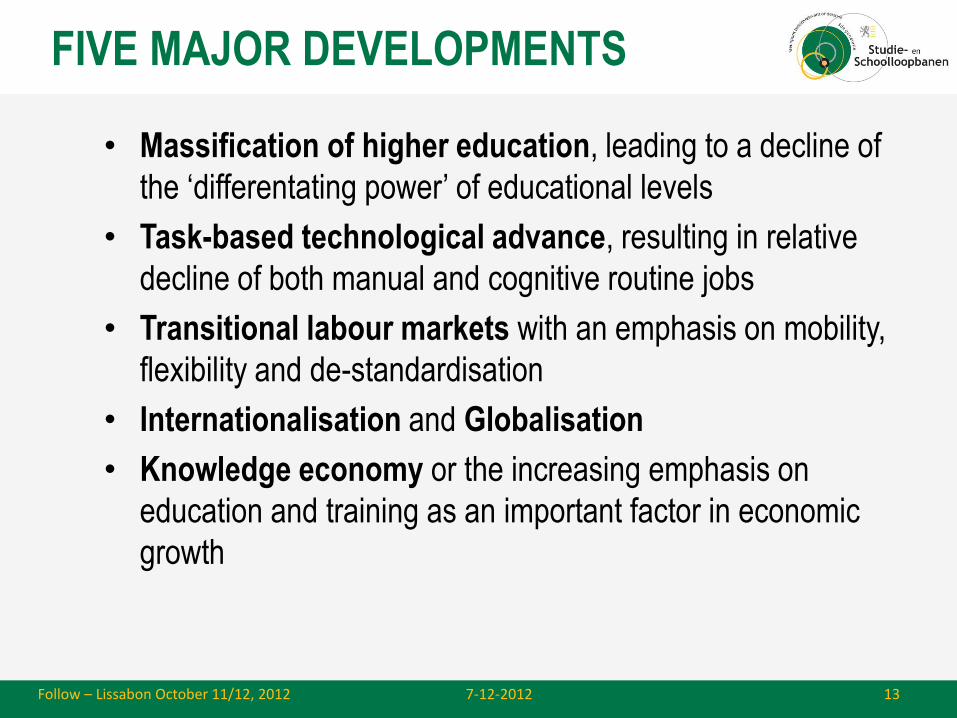
FIVE MAJOR DEVELOPMENTS
• Massification of higher education, leading to a decline of
the ‘differentating power’ of educational levels
• Task-based technological advance, resulting in relative
decline of both manual and cognitive routine jobs
• Transitional labour markets with an emphasis on mobility,
flexibility and de-standardisation
• Internationalisation and Globalisation
• Knowledge economy or the increasing emphasis on
education and training as an important factor in economic
growth
7-12-2012 Follow – Lissabon October 11/12, 2012 13
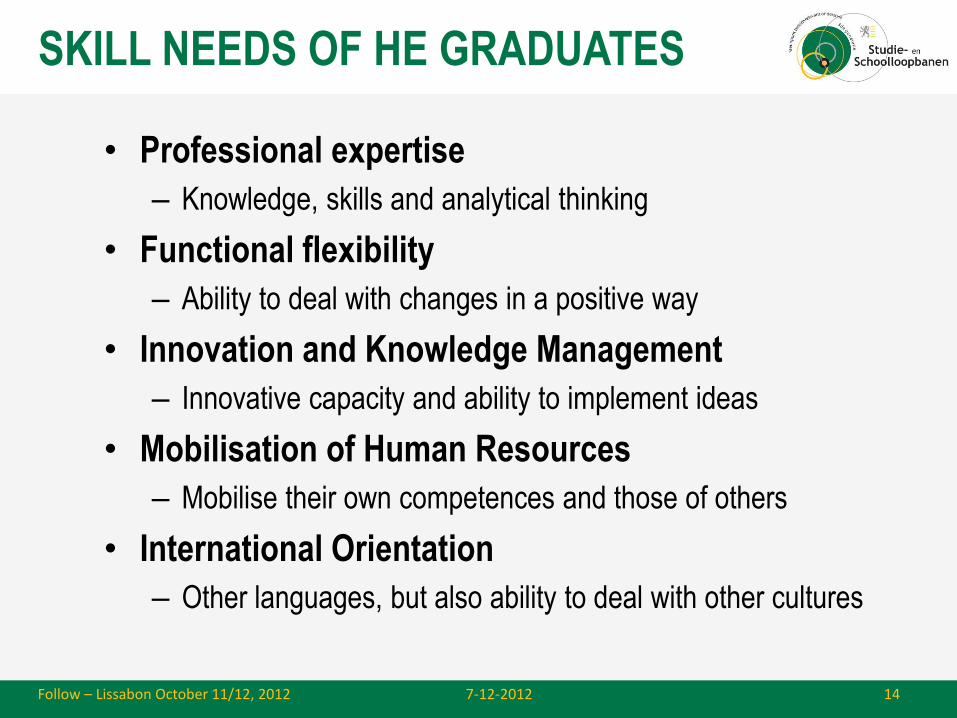
SKILL NEEDS OF HE GRADUATES
• Professional expertise
– Knowledge, skills and analytical thinking
• Functional flexibility
– Ability to deal with changes in a positive way
• Innovation and Knowledge Management
– Innovative capacity and ability to implement ideas
• Mobilisation of Human Resources
– Mobilise their own competences and those of others
• International Orientation
– Other languages, but also ability to deal with other cultures
7-12-2012 Follow – Lissabon October 11/12, 2012 14
TAKING THE (INDIVIDUAL AND/OR
SOCIAL) INVESTMENT POINT OF
VIEW
7-12-2012 Follow – Lissabon October 11/12, 2012 15

THREE IMPORTANT QUESTIONS
• Do the skills and competences acquired by higher education graduates sufficiently match the skills and competences required to do their jobs properly?
• And, if so, do ‘we’ make proper use of the skills and competences acquired by higher education graduates?
• To what extend and through which mechanisms can and/or do educational systems influence the production of the skills and competences acquired and/or required?
• What kind of data are needed to answer the two former questions?
7-12-2012 Follow – Lissabon October 11/12, 2012 16
SOME EXAMPLES FROM RECENT
RESEARCH
7-12-2012 Follow – Lissabon October 11/12, 2012 17
FIRST EXAMPLE:
THE SONAR RESEARCH PROGRAMME
7-12-2012 Follow – Lissabon October 11/12, 2012 18
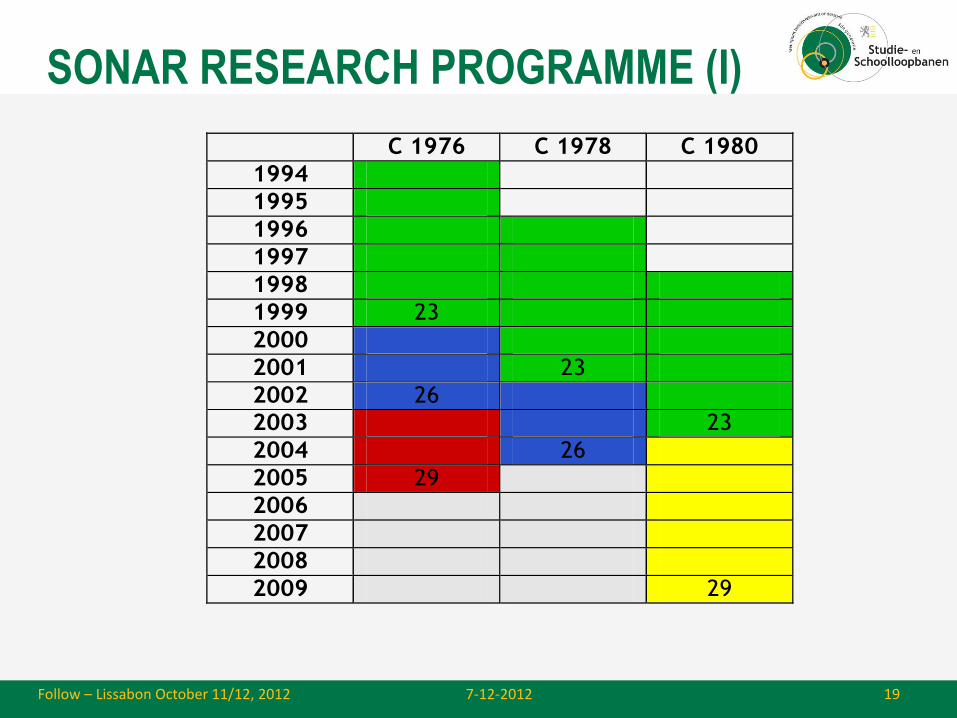
SONAR RESEARCH PROGRAMME (I)
7-12-2012 Follow – Lissabon October 11/12, 2012 19
C 1976 C 1978 C 1980
1994
1995
1996
1997
1998
1999 23
2000
2001 23
2002 26
2003 23
2004 26
2005 29
2006
2007
2008
2009 29
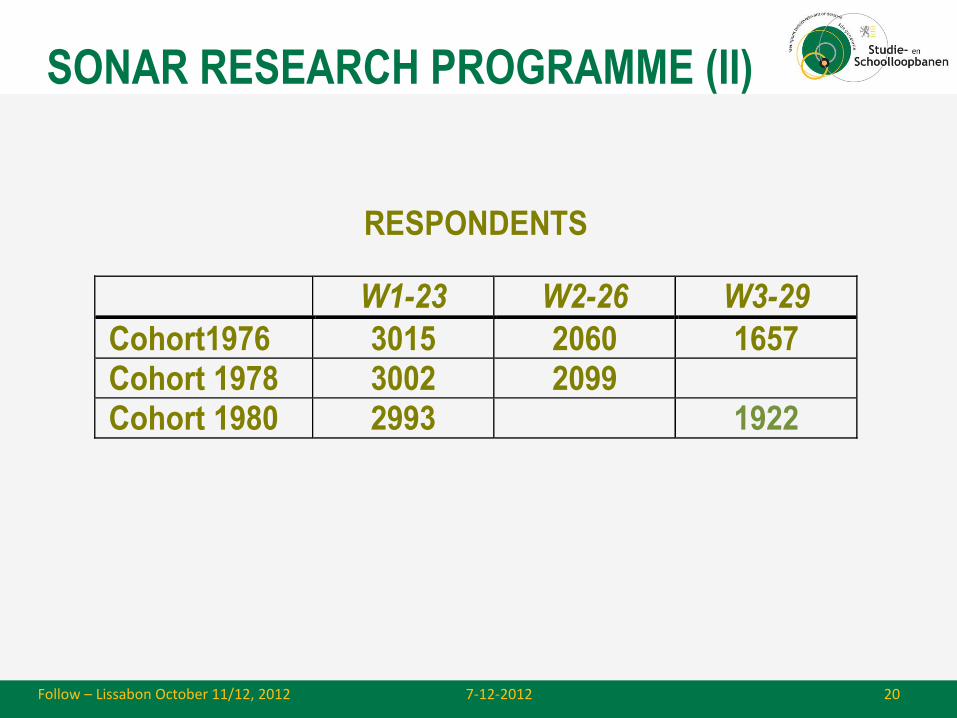
SONAR RESEARCH PROGRAMME (II)
7-12-2012 Follow – Lissabon October 11/12, 2012 20
RESPONDENTS
W1-23 W2-26 W3-29
Cohort1976 3015 2060 1657
Cohort 1978 3002 2099
Cohort 1980 2993 1922
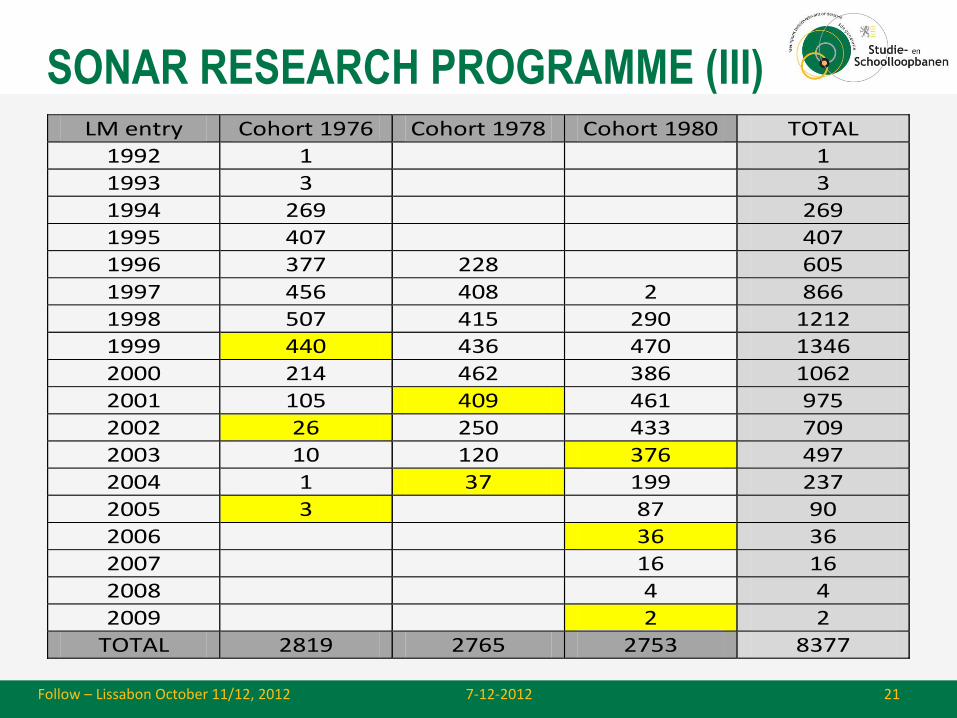
SONAR RESEARCH PROGRAMME (III)
7-12-2012 Follow – Lissabon October 11/12, 2012 21
LM entry Cohort 1976 Cohort 1978 Cohort 1980 TOTAL
1992 1 1
1993 3 3
1994 269 269
1995 407 407
1996 377 228 605
1997 456 408 2 866
1998 507 415 290 1212
1999 440 436 470 1346
2000 214 462 386 1062
2001 105 409 461 975
2002 26 250 433 709
2003 10 120 376 497
2004 1 37 199 237
2005 3 87 90
2006 36 36
2007 16 16
2008 4 4
2009 2 2
TOTAL 2819 2765 2753 8377
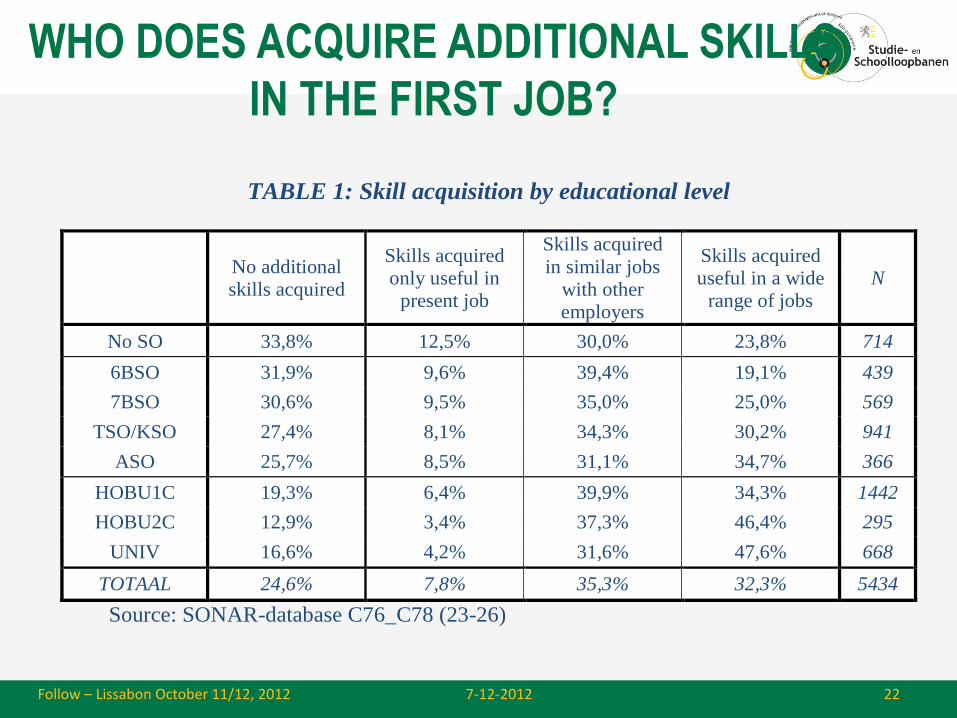
WHO DOES ACQUIRE ADDITIONAL SKILLS
IN THE FIRST JOB?
7-12-2012 Follow – Lissabon October 11/12, 2012 22
TABLE 1: Skill acquisition by educational level
No additional
skills acquired
Skills acquired
only useful in
present job
Skills acquired
in similar jobs
with other
employers
Skills acquired
useful in a wide
range of jobs
N
No SO 33,8% 12,5% 30,0% 23,8% 714
6BSO 31,9% 9,6% 39,4% 19,1% 439
7BSO 30,6% 9,5% 35,0% 25,0% 569
TSO/KSO 27,4% 8,1% 34,3% 30,2% 941
ASO 25,7% 8,5% 31,1% 34,7% 366
HOBU1C 19,3% 6,4% 39,9% 34,3% 1442
HOBU2C 12,9% 3,4% 37,3% 46,4% 295
UNIV 16,6% 4,2% 31,6% 47,6% 668
TOTAAL 24,6% 7,8% 35,3% 32,3% 5434
Source: SONAR-database C76_C78 (23-26)
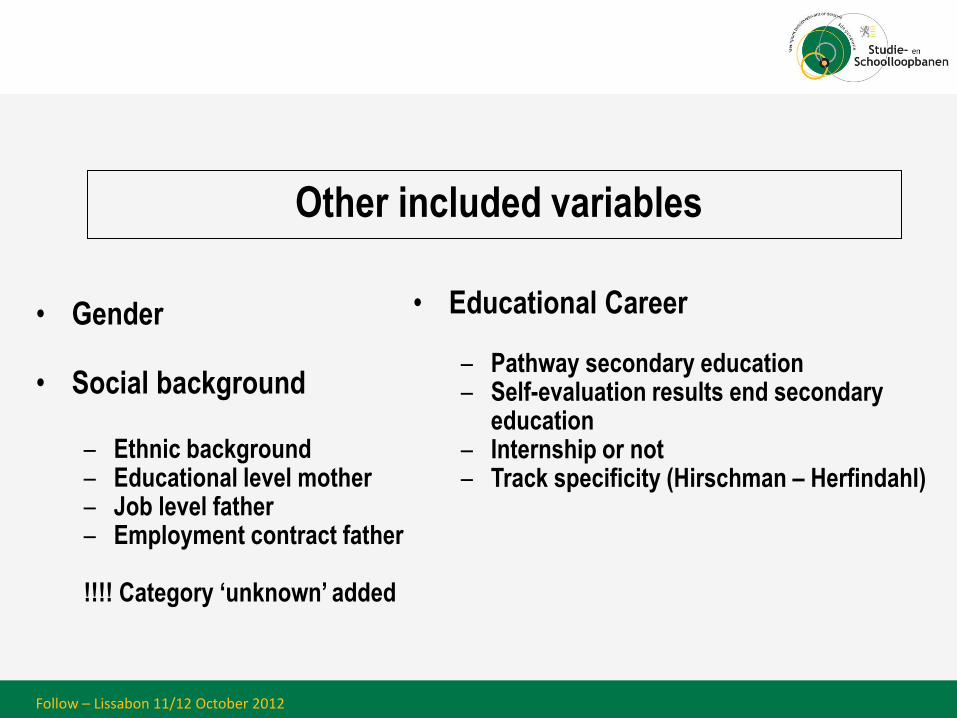
• Gender
• Social background – Ethnic background – Educational level mother – Job level father – Employment contract father !!!! Category ‘unknown’ added
• Educational Career
– Pathway secondary education – Self-evaluation results end secondary
education – Internship or not – Track specificity (Hirschman – Herfindahl)
Other included variables
Follow – Lissabon 11/12 October 2012
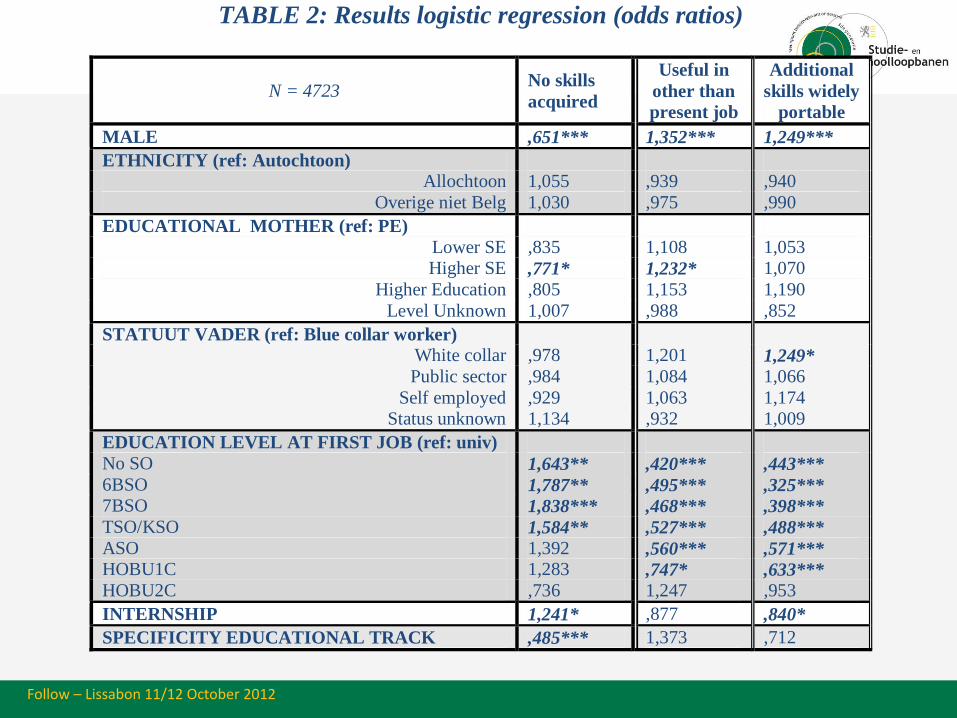
TABLE 2: Results logistic regression (odds ratios)
N = 4723 No skills
acquired
Useful in
other than
present job
Additional
skills widely
portable
MALE ,651*** 1,352*** 1,249***
ETHNICITY (ref: Autochtoon) Allochtoon 1,055 ,939 ,940
Overige niet Belg 1,030 ,975 ,990
EDUCATIONAL MOTHER (ref: PE)
Lower SE ,835 1,108 1,053 Higher SE ,771* 1,232* 1,070
Higher Education ,805 1,153 1,190
Level Unknown 1,007 ,988 ,852
STATUUT VADER (ref: Blue collar worker) White collar ,978 1,201 1,249*
Public sector ,984 1,084 1,066
Self employed ,929 1,063 1,174 Status unknown 1,134 ,932 1,009
EDUCATION LEVEL AT FIRST JOB (ref: univ)
No SO 1,643** ,420*** ,443***
6BSO 1,787** ,495*** ,325*** 7BSO 1,838*** ,468*** ,398***
TSO/KSO 1,584** ,527*** ,488***
ASO 1,392 ,560*** ,571*** HOBU1C 1,283 ,747* ,633***
HOBU2C ,736 1,247 ,953
INTERNSHIP 1,241* ,877 ,840*
SPECIFICITY EDUCATIONAL TRACK ,485*** 1,373 ,712
Follow – Lissabon 11/12 October 2012
W. Van Trier TIY Tallinn 8-10 September 2011
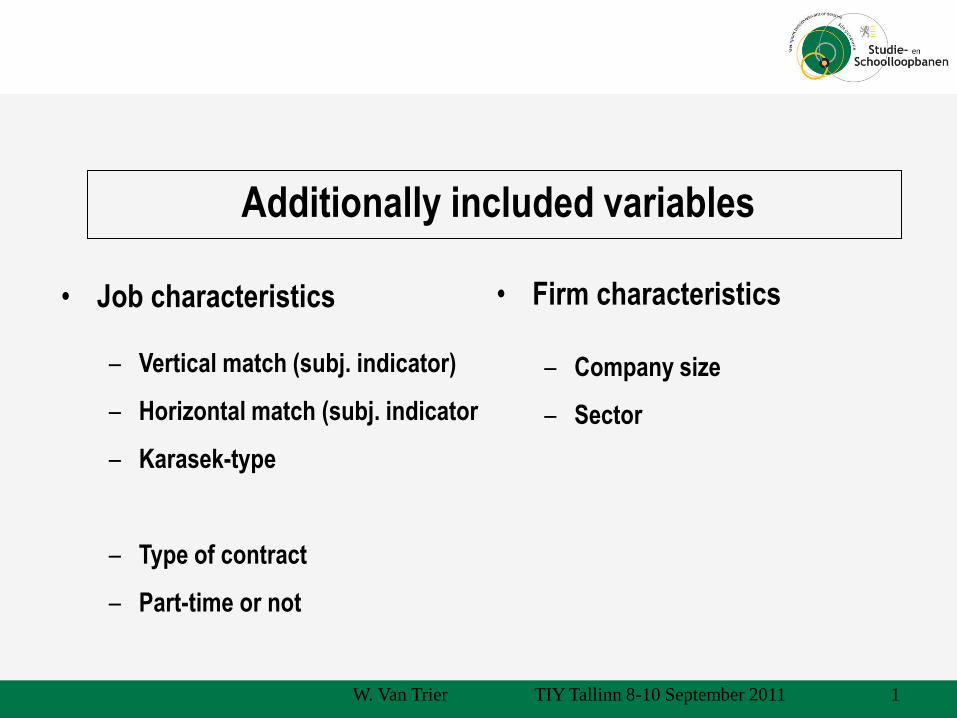
• Job characteristics
– Vertical match (subj. indicator)
– Horizontal match (subj. indicator
– Karasek-type
– Type of contract
– Part-time or not
• Firm characteristics
– Company size
– Sector
1
Additionally included variables
No additional
skills
acquired
Skills
acquired only
useful in
present job
Skills
acquired in
similar jobs
with other
employers
Skills
acquired
useful in a
wide range of
jobs
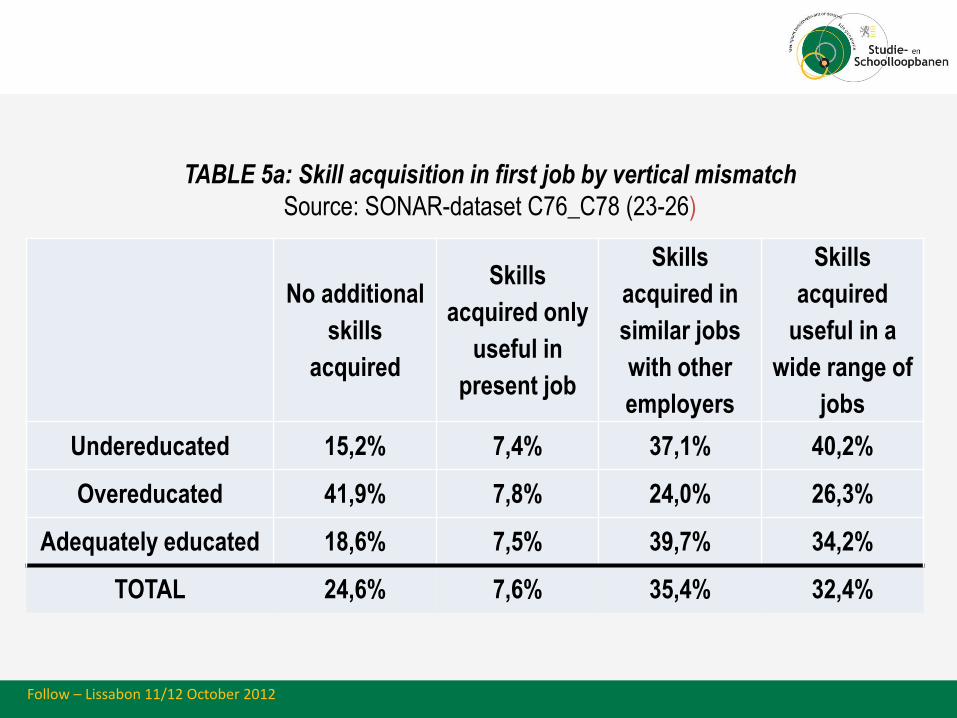
Undereducated 15,2% 7,4% 37,1% 40,2%
Overeducated 41,9% 7,8% 24,0% 26,3%
Adequately educated 18,6% 7,5% 39,7% 34,2%
TOTAL 24,6% 7,6% 35,4% 32,4%
TABLE 5a: Skill acquisition in first job by vertical mismatch
Source: SONAR-dataset C76_C78 (23-26)
Follow – Lissabon 11/12 October 2012
No additional
skills acquired
Skills acquired
only useful in
present job
Skills acquired
in similar jobs
with other
employers
Skills acquired
useful in a wide
range of jobs
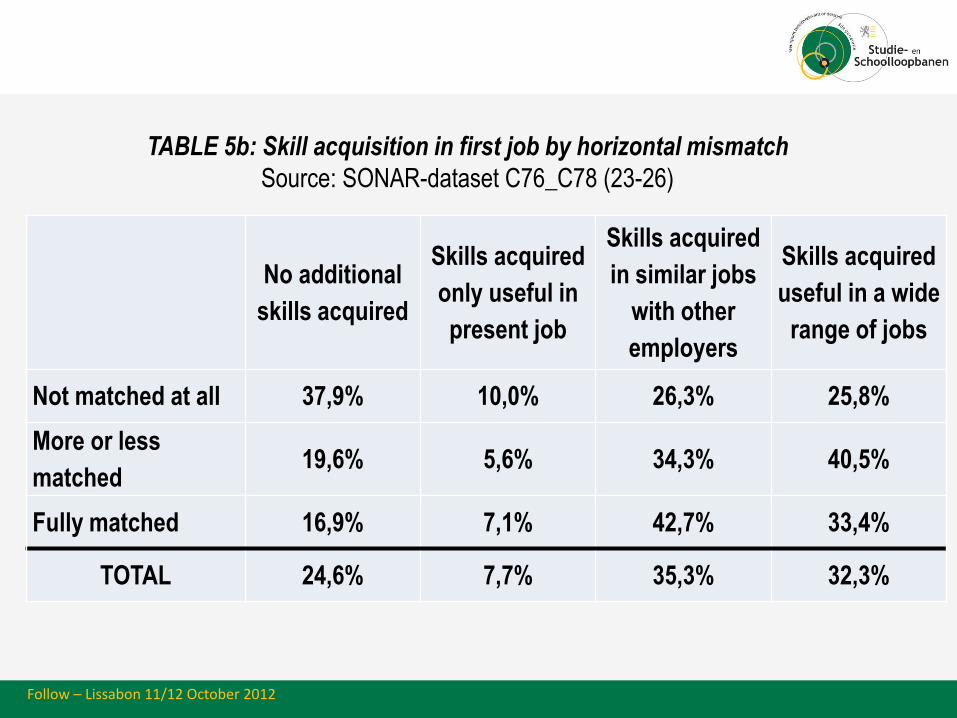
Not matched at all 37,9% 10,0% 26,3% 25,8%
More or less
matched 19,6% 5,6% 34,3% 40,5%
Fully matched 16,9% 7,1% 42,7% 33,4%
TOTAL 24,6% 7,7% 35,3% 32,3%
TABLE 5b: Skill acquisition in first job by horizontal mismatch
Source: SONAR-dataset C76_C78 (23-26)
Follow – Lissabon 11/12 October 2012
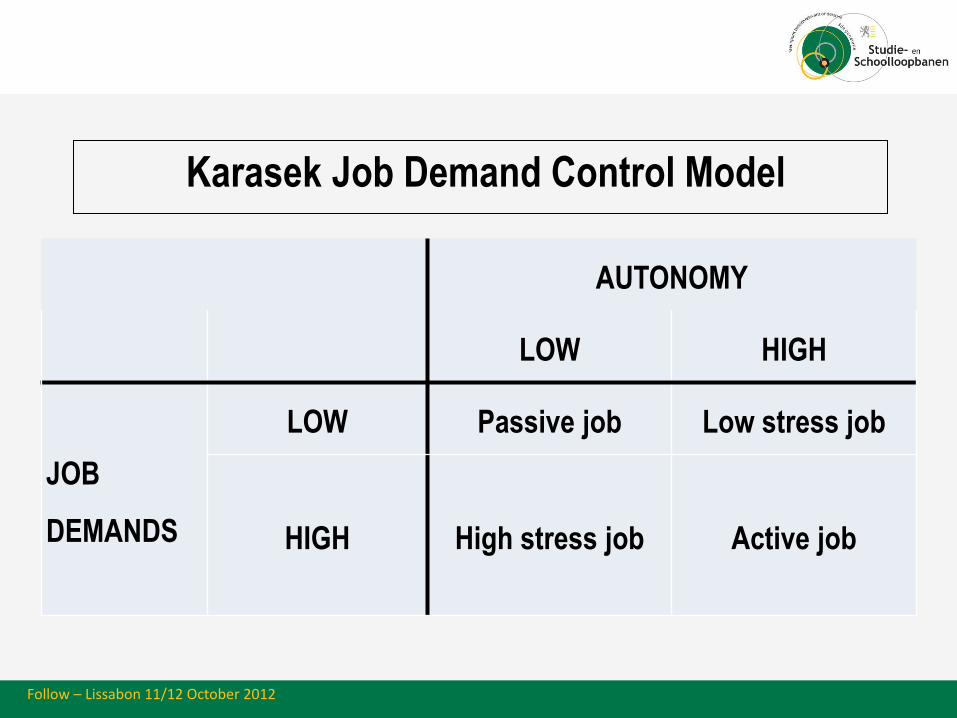
AUTONOMY
LOW HIGH
JOB
DEMANDS
LOW Passive job Low stress job
HIGH High stress job Active job
Karasek Job Demand Control Model
Follow – Lissabon 11/12 October 2012
No
additional
skills
acquired
Skills
acquired
only useful
in present
job
Skills
acquired in
similar jobs
with other
employers
Skills
acquired
useful in a
wide range
of jobs
N
Type job
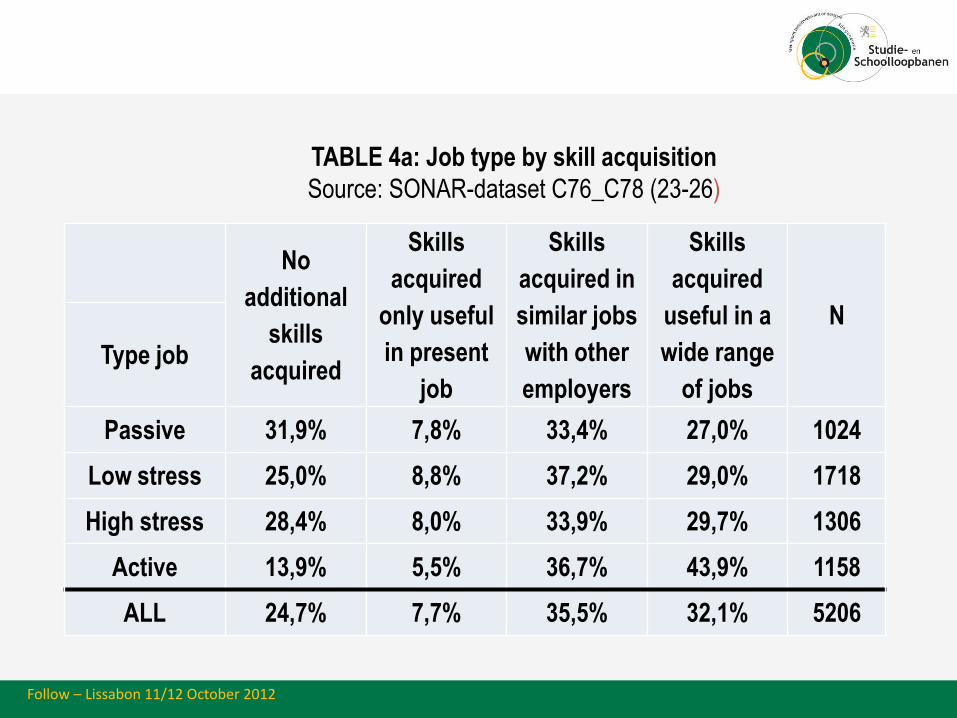
Passive 31,9% 7,8% 33,4% 27,0% 1024
Low stress 25,0% 8,8% 37,2% 29,0% 1718
High stress 28,4% 8,0% 33,9% 29,7% 1306
Active 13,9% 5,5% 36,7% 43,9% 1158
ALL 24,7% 7,7% 35,5% 32,1% 5206
TABLE 4a: Job type by skill acquisition
Source: SONAR-dataset C76_C78 (23-26)
Follow – Lissabon 11/12 October 2012
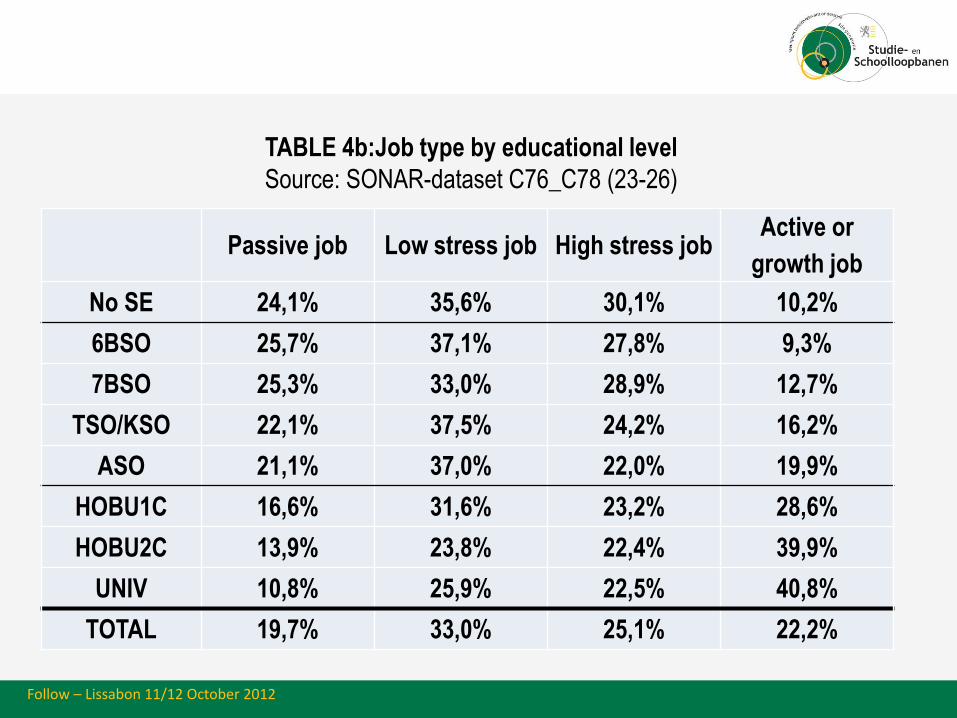
Passive job Low stress job High stress job Active or
growth job
No SE 24,1% 35,6% 30,1% 10,2%
6BSO 25,7% 37,1% 27,8% 9,3%
7BSO 25,3% 33,0% 28,9% 12,7%
TSO/KSO 22,1% 37,5% 24,2% 16,2%
ASO 21,1% 37,0% 22,0% 19,9%
HOBU1C 16,6% 31,6% 23,2% 28,6%
HOBU2C 13,9% 23,8% 22,4% 39,9%
UNIV 10,8% 25,9% 22,5% 40,8%
TOTAL 19,7% 33,0% 25,1% 22,2%
TABLE 4b:Job type by educational level
Source: SONAR-dataset C76_C78 (23-26)
Follow – Lissabon 11/12 October 2012
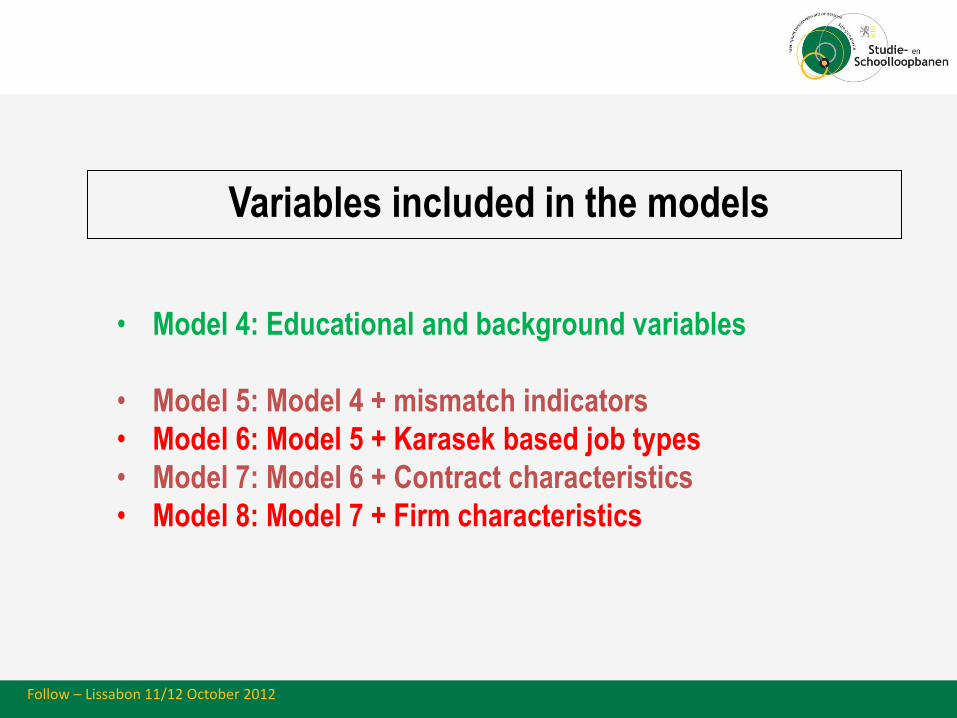
• Model 4: Educational and background variables
• Model 5: Model 4 + mismatch indicators
• Model 6: Model 5 + Karasek based job types
• Model 7: Model 6 + Contract characteristics
• Model 8: Model 7 + Firm characteristics
Variables included in the models
Follow – Lissabon 11/12 October 2012
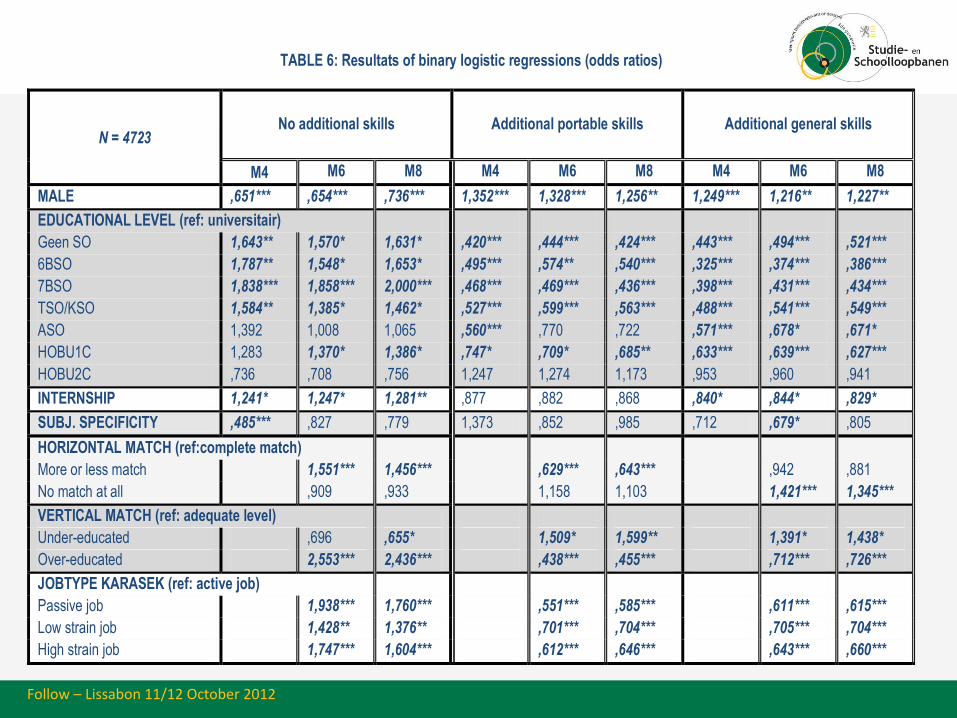
TABLE 6: Resultats of binary logistic regressions (odds ratios)
N = 4723 No additional skills Additional portable skills
Additional general skills
M4 M6 M8 M4 M6 M8 M4 M6 M8
MALE ,651*** ,654*** ,736*** 1,352*** 1,328*** 1,256** 1,249*** 1,216** 1,227**
EDUCATIONAL LEVEL (ref: universitair)
Geen SO 1,643** 1,570* 1,631* ,420*** ,444*** ,424*** ,443*** ,494*** ,521***
6BSO 1,787** 1,548* 1,653* ,495*** ,574** ,540*** ,325*** ,374*** ,386***
7BSO 1,838*** 1,858*** 2,000*** ,468*** ,469*** ,436*** ,398*** ,431*** ,434***
TSO/KSO 1,584** 1,385* 1,462* ,527*** ,599*** ,563*** ,488*** ,541*** ,549***
ASO 1,392 1,008 1,065 ,560*** ,770 ,722 ,571*** ,678* ,671*
HOBU1C 1,283 1,370* 1,386* ,747* ,709* ,685** ,633*** ,639*** ,627***
HOBU2C ,736 ,708 ,756 1,247 1,274 1,173 ,953 ,960 ,941
INTERNSHIP 1,241* 1,247* 1,281** ,877 ,882 ,868 ,840* ,844* ,829*
SUBJ. SPECIFICITY ,485*** ,827 ,779 1,373 ,852 ,985 ,712 ,679* ,805
HORIZONTAL MATCH (ref:complete match)
More or less match 1,551*** 1,456*** ,629*** ,643*** ,942 ,881
No match at all ,909 ,933 1,158 1,103 1,421*** 1,345***
VERTICAL MATCH (ref: adequate level)
Under-educated ,696 ,655* 1,509* 1,599** 1,391* 1,438*
Over-educated 2,553*** 2,436*** ,438*** ,455*** ,712*** ,726***
JOBTYPE KARASEK (ref: active job)
Passive job 1,938*** 1,760*** ,551*** ,585*** ,611*** ,615***
Low strain job 1,428** 1,376** ,701*** ,704*** ,705*** ,704***
High strain job 1,747*** 1,604*** ,612*** ,646*** ,643*** ,660***
Follow – Lissabon 11/12 October 2012
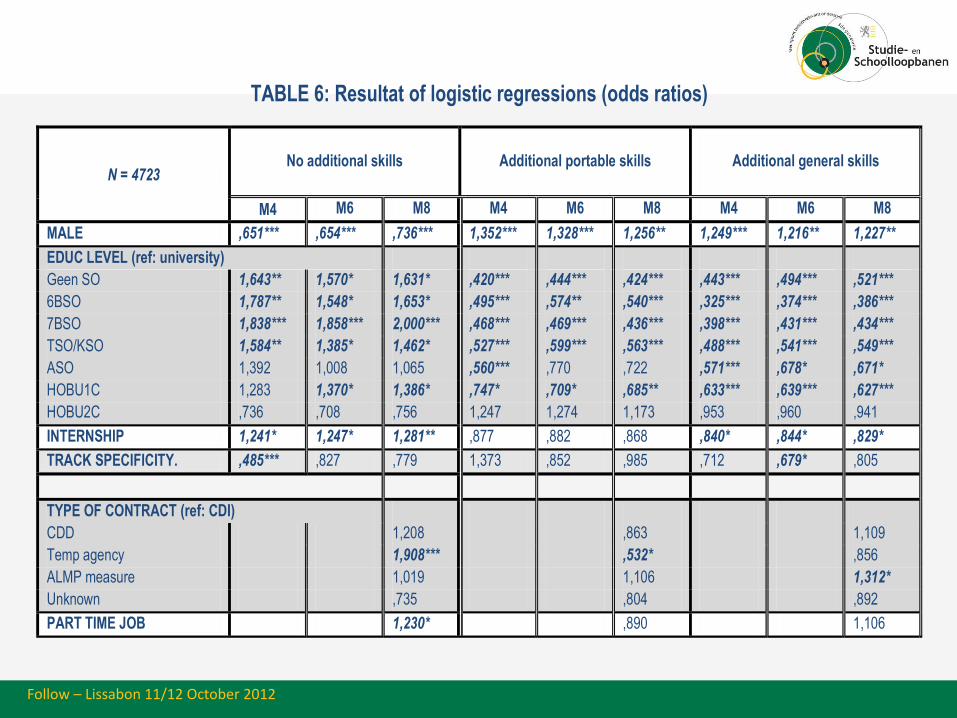
TABLE 6: Resultat of logistic regressions (odds ratios)
N = 4723 No additional skills Additional portable skills
Additional general skills
M4 M6 M8 M4 M6 M8 M4 M6 M8
MALE ,651*** ,654*** ,736*** 1,352*** 1,328*** 1,256** 1,249*** 1,216** 1,227**
EDUC LEVEL (ref: university)
Geen SO 1,643** 1,570* 1,631* ,420*** ,444*** ,424*** ,443*** ,494*** ,521***
6BSO 1,787** 1,548* 1,653* ,495*** ,574** ,540*** ,325*** ,374*** ,386***
7BSO 1,838*** 1,858*** 2,000*** ,468*** ,469*** ,436*** ,398*** ,431*** ,434***
TSO/KSO 1,584** 1,385* 1,462* ,527*** ,599*** ,563*** ,488*** ,541*** ,549***
ASO 1,392 1,008 1,065 ,560*** ,770 ,722 ,571*** ,678* ,671*
HOBU1C 1,283 1,370* 1,386* ,747* ,709* ,685** ,633*** ,639*** ,627***
HOBU2C ,736 ,708 ,756 1,247 1,274 1,173 ,953 ,960 ,941
INTERNSHIP 1,241* 1,247* 1,281** ,877 ,882 ,868 ,840* ,844* ,829*
TRACK SPECIFICITY. ,485*** ,827 ,779 1,373 ,852 ,985 ,712 ,679* ,805
TYPE OF CONTRACT (ref: CDI)
CDD 1,208 ,863 1,109
Temp agency 1,908*** ,532* ,856
ALMP measure 1,019 1,106 1,312*
Unknown ,735 ,804 ,892
PART TIME JOB 1,230* ,890 1,106
Follow – Lissabon 11/12 October 2012
W. Van Trier TIY Tallinn 8-10 September 2011 1
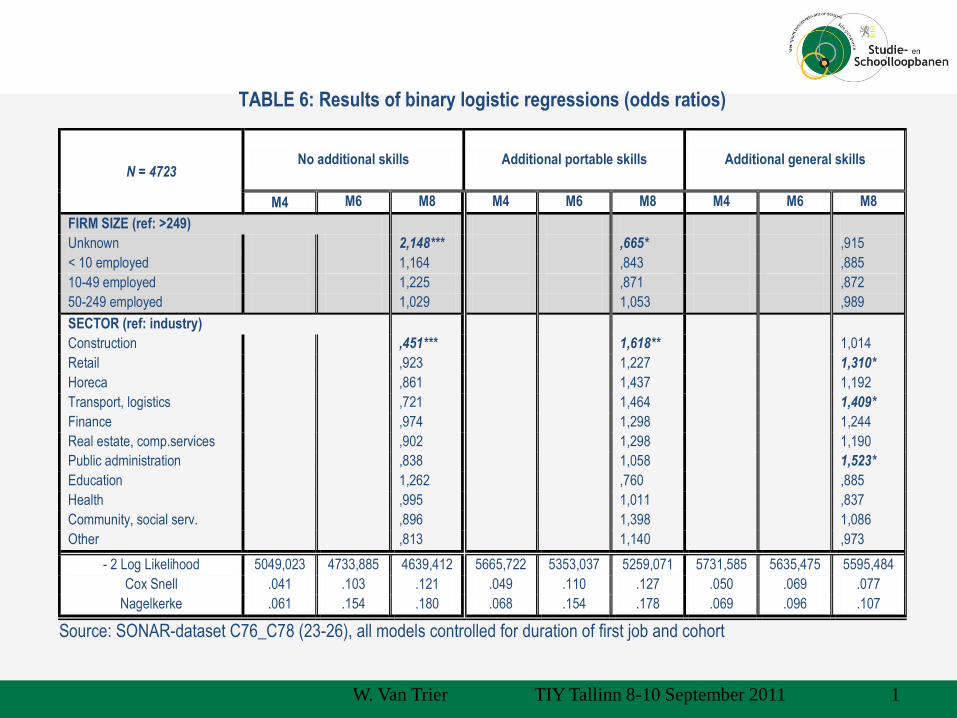
TABLE 6: Results of binary logistic regressions (odds ratios)
N = 4723 No additional skills Additional portable skills
Additional general skills
M4 M6 M8 M4 M6 M8 M4 M6 M8
FIRM SIZE (ref: >249)
Unknown 2,148*** ,665* ,915
< 10 employed 1,164 ,843 ,885
10-49 employed 1,225 ,871 ,872
50-249 employed 1,029 1,053 ,989
SECTOR (ref: industry)
Construction ,451*** 1,618** 1,014
Retail ,923 1,227 1,310*
Horeca ,861 1,437 1,192
Transport, logistics ,721 1,464 1,409*
Finance ,974 1,298 1,244
Real estate, comp.services ,902 1,298 1,190
Public administration ,838 1,058 1,523*
Education 1,262 ,760 ,885
Health ,995 1,011 ,837
Community, social serv. ,896 1,398 1,086
Other ,813 1,140 ,973
- 2 Log Likelihood 5049,023 4733,885 4639,412 5665,722 5353,037 5259,071 5731,585 5635,475 5595,484
Cox Snell .041 .103 .121 .049 .110 .127 .050 .069 .077
Nagelkerke .061 .154 .180 .068 .154 .178 .069 .096 .107
Source: SONAR-dataset C76_C78 (23-26), all models controlled for duration of first job and cohort
35
• Introducing job and firm characteristics does not affect
either the significance or the coefficient of educational level
and gender.
• However, this does not imply that the variables relating to
job and firm characteristics are unimportant and could not
account for at least part of the differences of skill acquisition
in the first job.
Results (II)
Follow – Lissabon 11/12 October 2012
36
• Whoever does not start his labour market career in an
‘active’ risks far more than his or her collegues who do not
to acquire any additional skills during the first job. In
addition, they have a much lower probability to acquire
additional portable or general skills.
• There is not much difference between the other job types.
Results (II)
Follow – Lissabon 11/12 October 2012
37
• Not only type of job, but the nature of the match seems to be
of importance.
• Over-educated (under-educated) run a greater (smaller) risk
not to acquire any additional skills than adequately matched
entrants. A similar results is found with regard to acquiring
additional portable skills.
• Results for horizontal mismatch are much less clear.
Results (III)
Follow – Lissabon 11/12 October 2012
38
• The type of employment contract is clearly of some importance. Part-time work implies a greater risk not to acquire any additional skills, but does not significantly affect acquiring portable or general skills.
• The risk of not acquiring any additional skills is greater for youngsters who find their first job via a temp agency as compared to young people who start in a contract of indeterminate duration.
• Results for sector seem intuitively acceptable.
• No statistical significant influence of firm size.
Results (IV)
Follow – Lissabon 11/12 October 2012
39
TWO MAIN CONCLUSIONS
• Importance of ‘learning capacity’ as well as ‘job characteristics’
• Risk of widening gap in ‘skill richness’ is real
BUT
• How to differentiate between ‘educational level’ as a sorting
mechanism over jobs and as an indicator of ‘learning capacity’?
Main conclusions
Follow – Lissabon 11/12 October 2012
SECOND EXAMPLE:
THE REFLEX/HEGESCO PROJECT
7-12-2012 Follow – Lissabon October 11/12, 2012 40
REFLEX/HEGESCO
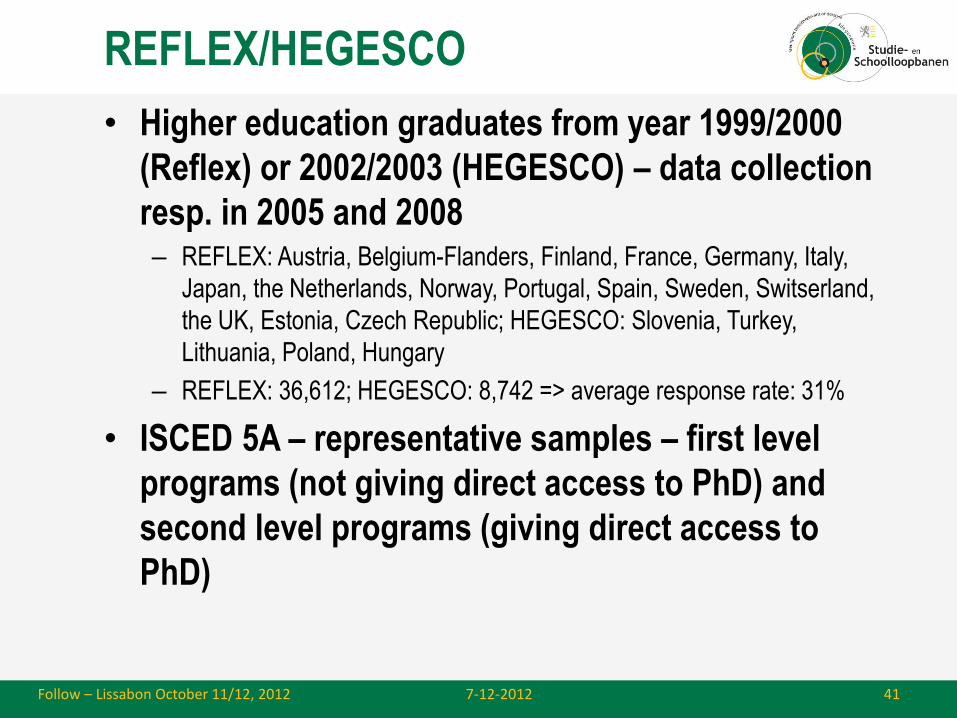
• Higher education graduates from year 1999/2000
(Reflex) or 2002/2003 (HEGESCO) – data collection
resp. in 2005 and 2008 – REFLEX: Austria, Belgium-Flanders, Finland, France, Germany, Italy,
Japan, the Netherlands, Norway, Portugal, Spain, Sweden, Switserland,
the UK, Estonia, Czech Republic; HEGESCO: Slovenia, Turkey,
Lithuania, Poland, Hungary
– REFLEX: 36,612; HEGESCO: 8,742 => average response rate: 31%
• ISCED 5A – representative samples – first level
programs (not giving direct access to PhD) and
second level programs (giving direct access to
PhD)
7-12-2012 Follow – Lissabon October 11/12, 2012 41
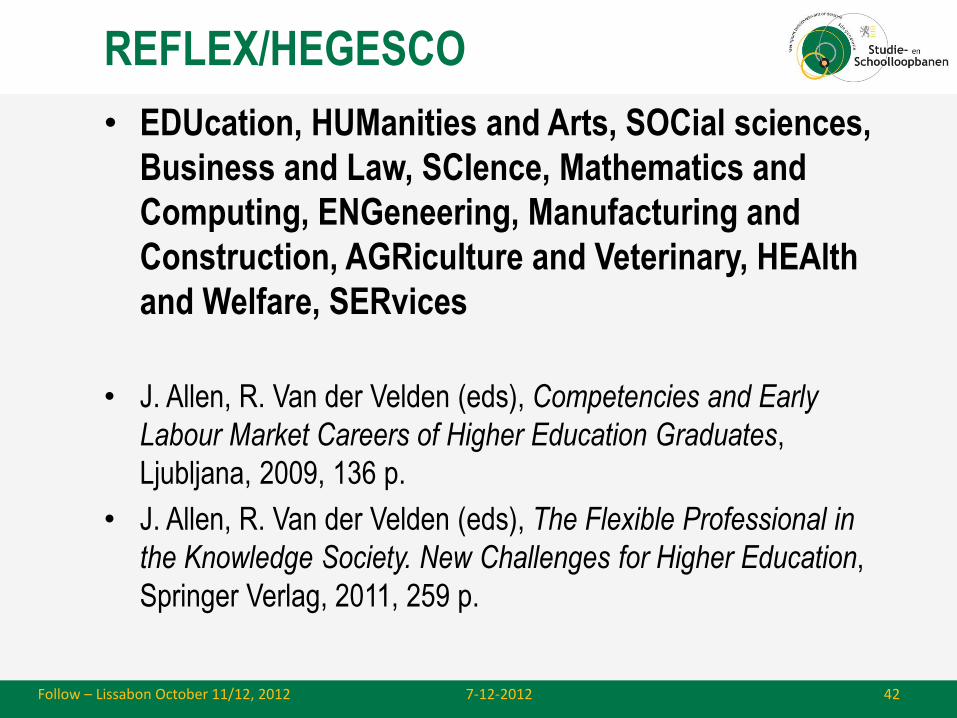
REFLEX/HEGESCO
• EDUcation, HUManities and Arts, SOCial sciences,
Business and Law, SCIence, Mathematics and
Computing, ENGeneering, Manufacturing and
Construction, AGRiculture and Veterinary, HEAlth
and Welfare, SERvices
• J. Allen, R. Van der Velden (eds), Competencies and Early
Labour Market Careers of Higher Education Graduates,
Ljubljana, 2009, 136 p.
• J. Allen, R. Van der Velden (eds), The Flexible Professional in
the Knowledge Society. New Challenges for Higher Education,
Springer Verlag, 2011, 259 p.
7-12-2012 Follow – Lissabon October 11/12, 2012 42
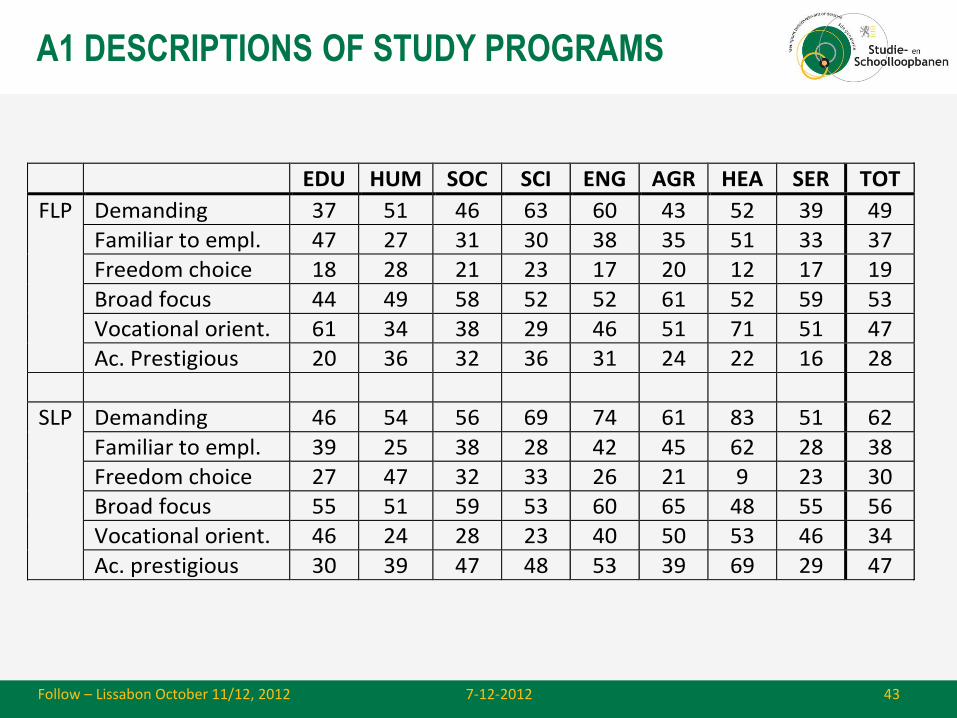
A1 DESCRIPTIONS OF STUDY PROGRAMS
7-12-2012 Follow – Lissabon October 11/12, 2012 43
EDU HUM SOC SCI ENG AGR HEA SER TOT
FLP Demanding 37 51 46 63 60 43 52 39 49
Familiar to empl. 47 27 31 30 38 35 51 33 37
Freedom choice 18 28 21 23 17 20 12 17 19
Broad focus 44 49 58 52 52 61 52 59 53
Vocational orient. 61 34 38 29 46 51 71 51 47
Ac. Prestigious 20 36 32 36 31 24 22 16 28
SLP Demanding 46 54 56 69 74 61 83 51 62
Familiar to empl. 39 25 38 28 42 45 62 28 38
Freedom choice 27 47 32 33 26 21 9 23 30
Broad focus 55 51 59 53 60 65 48 55 56
Vocational orient. 46 24 28 23 40 50 53 46 34
Ac. prestigious 30 39 47 48 53 39 69 29 47
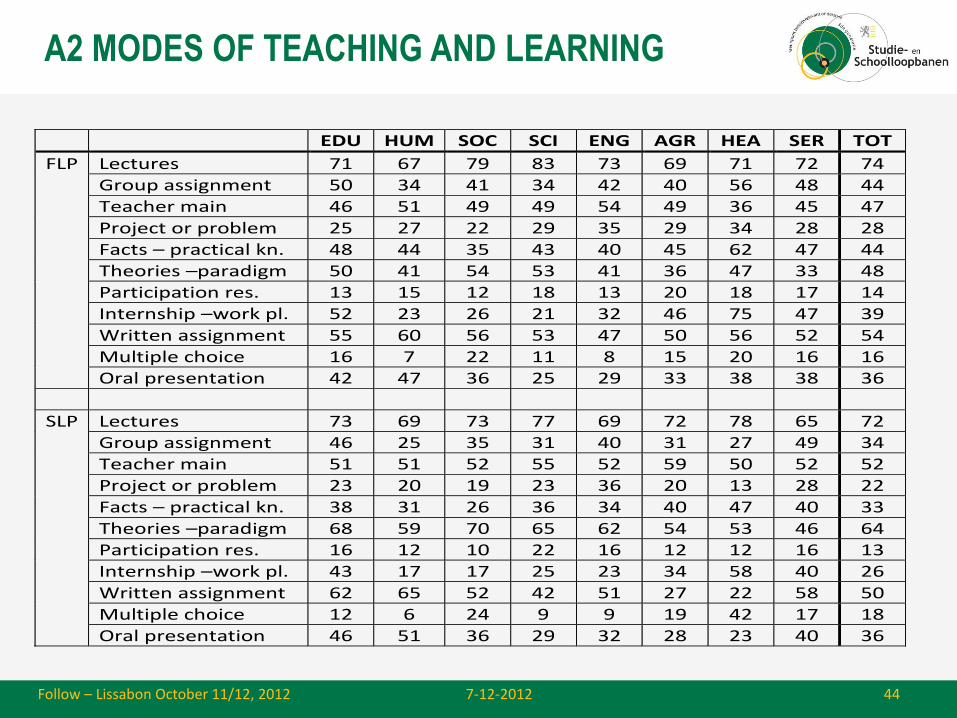
A2 MODES OF TEACHING AND LEARNING
7-12-2012 Follow – Lissabon October 11/12, 2012 44
EDU HUM SOC SCI ENG AGR HEA SER TOT
FLP Lectures 71 67 79 83 73 69 71 72 74
Group assignment 50 34 41 34 42 40 56 48 44
Teacher main 46 51 49 49 54 49 36 45 47
Project or problem 25 27 22 29 35 29 34 28 28
Facts – practical kn. 48 44 35 43 40 45 62 47 44
Theories –paradigm 50 41 54 53 41 36 47 33 48
Participation res. 13 15 12 18 13 20 18 17 14
Internship –work pl. 52 23 26 21 32 46 75 47 39
Written assignment 55 60 56 53 47 50 56 52 54
Multiple choice 16 7 22 11 8 15 20 16 16
Oral presentation 42 47 36 25 29 33 38 38 36
SLP Lectures 73 69 73 77 69 72 78 65 72
Group assignment 46 25 35 31 40 31 27 49 34
Teacher main 51 51 52 55 52 59 50 52 52
Project or problem 23 20 19 23 36 20 13 28 22
Facts – practical kn. 38 31 26 36 34 40 47 40 33
Theories –paradigm 68 59 70 65 62 54 53 46 64
Participation res. 16 12 10 22 16 12 12 16 13
Internship –work pl. 43 17 17 25 23 34 58 40 26
Written assignment 62 65 52 42 51 27 22 58 50
Multiple choice 12 6 24 9 9 19 42 17 18
Oral presentation 46 51 36 29 32 28 23 40 36
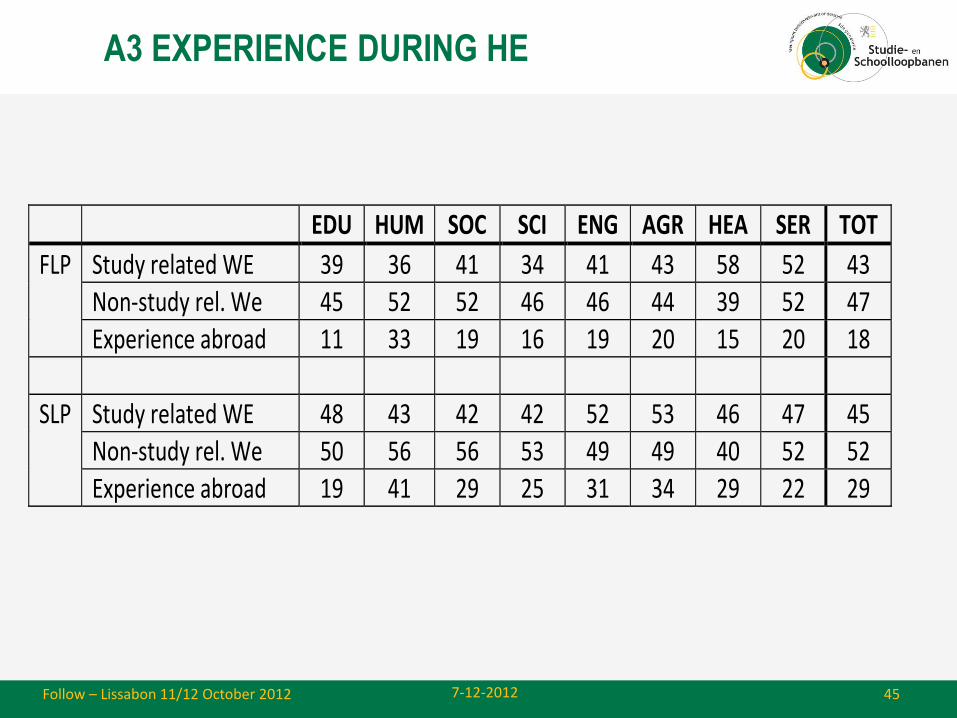
A3 EXPERIENCE DURING HE
7-12-2012 Follow – Lissabon 11/12 October 2012 45
EDU HUM SOC SCI ENG AGR HEA SER TOT
FLP Study related WE 39 36 41 34 41 43 58 52 43
Non-study rel. We 45 52 52 46 46 44 39 52 47
Experience abroad 11 33 19 16 19 20 15 20 18
SLP Study related WE 48 43 42 42 52 53 46 47 45
Non-study rel. We 50 56 56 53 49 49 40 52 52
Experience abroad 19 41 29 25 31 34 29 22 29
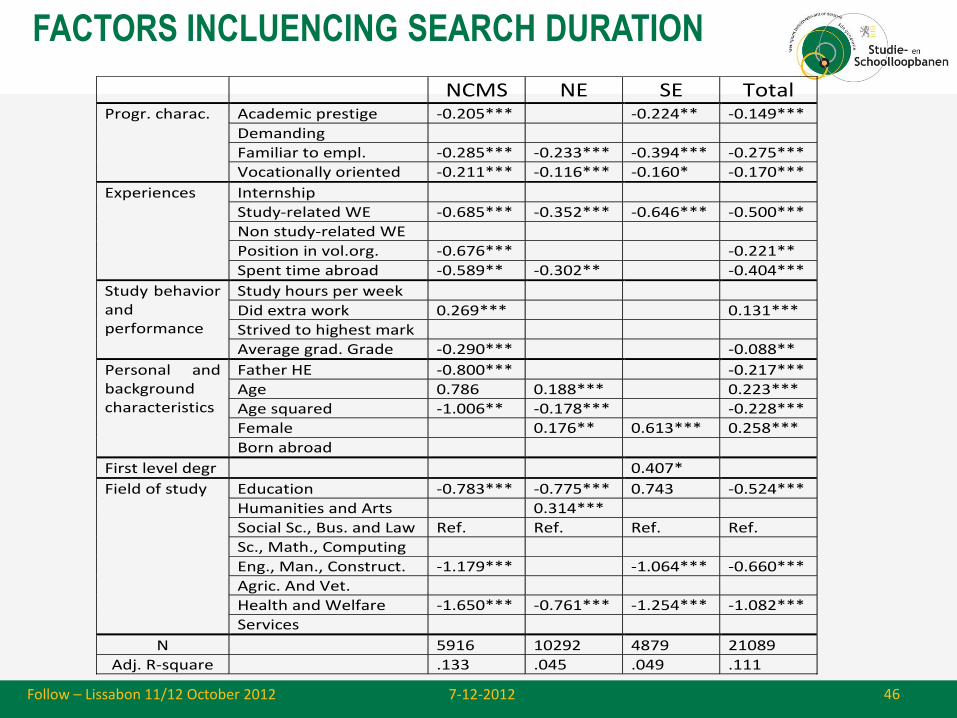
FACTORS INCLUENCING SEARCH DURATION
7-12-2012 Follow – Lissabon 11/12 October 2012 46
NCMS NE SE Total Progr. charac. Academic prestige -0.205*** -0.224** -0.149***
Demanding
Familiar to empl. -0.285*** -0.233*** -0.394*** -0.275***
Vocationally oriented -0.211*** -0.116*** -0.160* -0.170***
Experiences Internship
Study-related WE -0.685*** -0.352*** -0.646*** -0.500***
Non study-related WE
Position in vol.org. -0.676*** -0.221**
Spent time abroad -0.589** -0.302** -0.404***
Study behavior and performance
Study hours per week
Did extra work 0.269*** 0.131***
Strived to highest mark
Average grad. Grade -0.290*** -0.088**
Personal and background characteristics
Father HE -0.800*** -0.217***
Age 0.786 0.188*** 0.223***
Age squared -1.006** -0.178*** -0.228***
Female 0.176** 0.613*** 0.258***
Born abroad
First level degr 0.407*
Field of study Education -0.783*** -0.775*** 0.743 -0.524***
Humanities and Arts 0.314***
Social Sc., Bus. and Law Ref. Ref. Ref. Ref.
Sc., Math., Computing
Eng., Man., Construct. -1.179*** -1.064*** -0.660***
Agric. And Vet.
Health and Welfare -1.650*** -0.761*** -1.254*** -1.082***
Services
N 5916 10292 4879 21089
Adj. R-square .133 .045 .049 .111
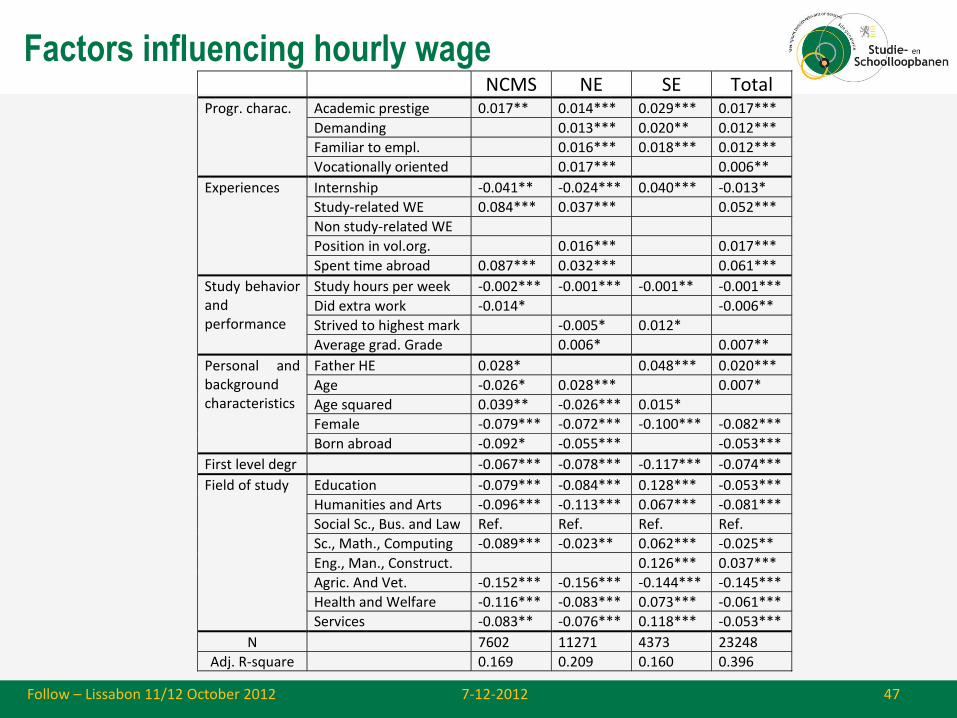
Factors influencing hourly wage
7-12-2012 Follow – Lissabon 11/12 October 2012 47
NCMS NE SE Total Progr. charac. Academic prestige 0.017** 0.014*** 0.029*** 0.017***
Demanding 0.013*** 0.020** 0.012***
Familiar to empl. 0.016*** 0.018*** 0.012***
Vocationally oriented 0.017*** 0.006**
Experiences Internship -0.041** -0.024*** 0.040*** -0.013*
Study-related WE 0.084*** 0.037*** 0.052***
Non study-related WE
Position in vol.org. 0.016*** 0.017***
Spent time abroad 0.087*** 0.032*** 0.061***
Study behavior and performance
Study hours per week -0.002*** -0.001*** -0.001** -0.001***
Did extra work -0.014* -0.006**
Strived to highest mark -0.005* 0.012*
Average grad. Grade 0.006* 0.007**
Personal and background characteristics
Father HE 0.028* 0.048*** 0.020***
Age -0.026* 0.028*** 0.007*
Age squared 0.039** -0.026*** 0.015*
Female -0.079*** -0.072*** -0.100*** -0.082***
Born abroad -0.092* -0.055*** -0.053***
First level degr -0.067*** -0.078*** -0.117*** -0.074***
Field of study Education -0.079*** -0.084*** 0.128*** -0.053***
Humanities and Arts -0.096*** -0.113*** 0.067*** -0.081***
Social Sc., Bus. and Law Ref. Ref. Ref. Ref.
Sc., Math., Computing -0.089*** -0.023** 0.062*** -0.025**
Eng., Man., Construct. 0.126*** 0.037***
Agric. And Vet. -0.152*** -0.156*** -0.144*** -0.145***
Health and Welfare -0.116*** -0.083*** 0.073*** -0.061***
Services -0.083** -0.076*** 0.118*** -0.053***
N 7602 11271 4373 23248
Adj. R-square 0.169 0.209 0.160 0.396
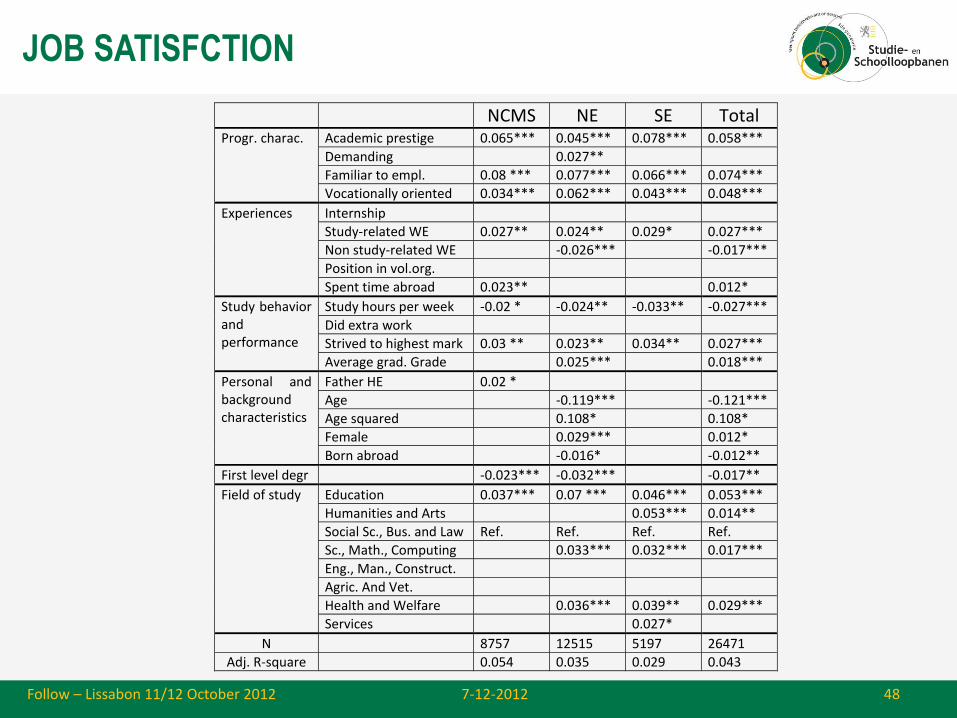
JOB SATISFCTION
7-12-2012 Follow – Lissabon 11/12 October 2012 48
NCMS NE SE Total Progr. charac. Academic prestige 0.065*** 0.045*** 0.078*** 0.058***
Demanding 0.027**
Familiar to empl. 0.08 *** 0.077*** 0.066*** 0.074***
Vocationally oriented 0.034*** 0.062*** 0.043*** 0.048***
Experiences Internship
Study-related WE 0.027** 0.024** 0.029* 0.027***
Non study-related WE -0.026*** -0.017***
Position in vol.org.
Spent time abroad 0.023** 0.012*
Study behavior and performance
Study hours per week -0.02 * -0.024** -0.033** -0.027***
Did extra work
Strived to highest mark 0.03 ** 0.023** 0.034** 0.027***
Average grad. Grade 0.025*** 0.018***
Personal and background characteristics
Father HE 0.02 *
Age -0.119*** -0.121***
Age squared 0.108* 0.108*
Female 0.029*** 0.012*
Born abroad -0.016* -0.012**
First level degr -0.023*** -0.032*** -0.017**
Field of study Education 0.037*** 0.07 *** 0.046*** 0.053***
Humanities and Arts 0.053*** 0.014**
Social Sc., Bus. and Law Ref. Ref. Ref. Ref.
Sc., Math., Computing 0.033*** 0.032*** 0.017***
Eng., Man., Construct.
Agric. And Vet.
Health and Welfare 0.036*** 0.039** 0.029***
Services 0.027*
N 8757 12515 5197 26471
Adj. R-square 0.054 0.035 0.029 0.043
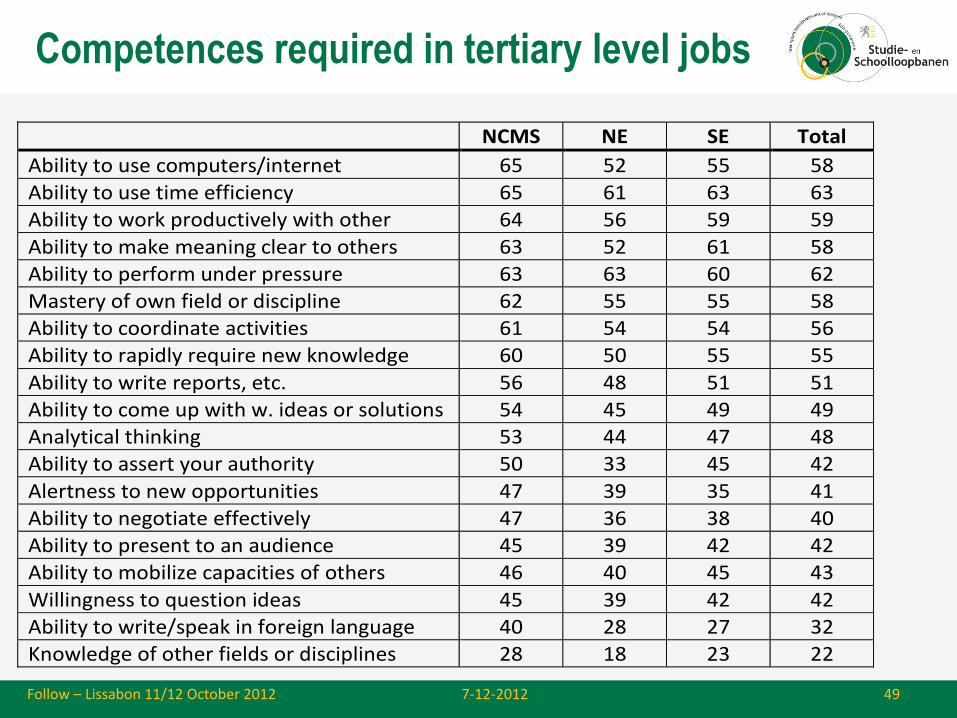
Competences required in tertiary level jobs
7-12-2012 Follow – Lissabon 11/12 October 2012 49
NCMS NE SE Total
Ability to use computers/internet 65 52 55 58
Ability to use time efficiency 65 61 63 63
Ability to work productively with other 64 56 59 59
Ability to make meaning clear to others 63 52 61 58
Ability to perform under pressure 63 63 60 62
Mastery of own field or discipline 62 55 55 58
Ability to coordinate activities 61 54 54 56
Ability to rapidly require new knowledge 60 50 55 55
Ability to write reports, etc. 56 48 51 51
Ability to come up with w. ideas or solutions 54 45 49 49
Analytical thinking 53 44 47 48
Ability to assert your authority 50 33 45 42
Alertness to new opportunities 47 39 35 41
Ability to negotiate effectively 47 36 38 40
Ability to present to an audience 45 39 42 42
Ability to mobilize capacities of others 46 40 45 43
Willingness to question ideas 45 39 42 42
Ability to write/speak in foreign language 40 28 27 32
Knowledge of other fields or disciplines 28 18 23 22
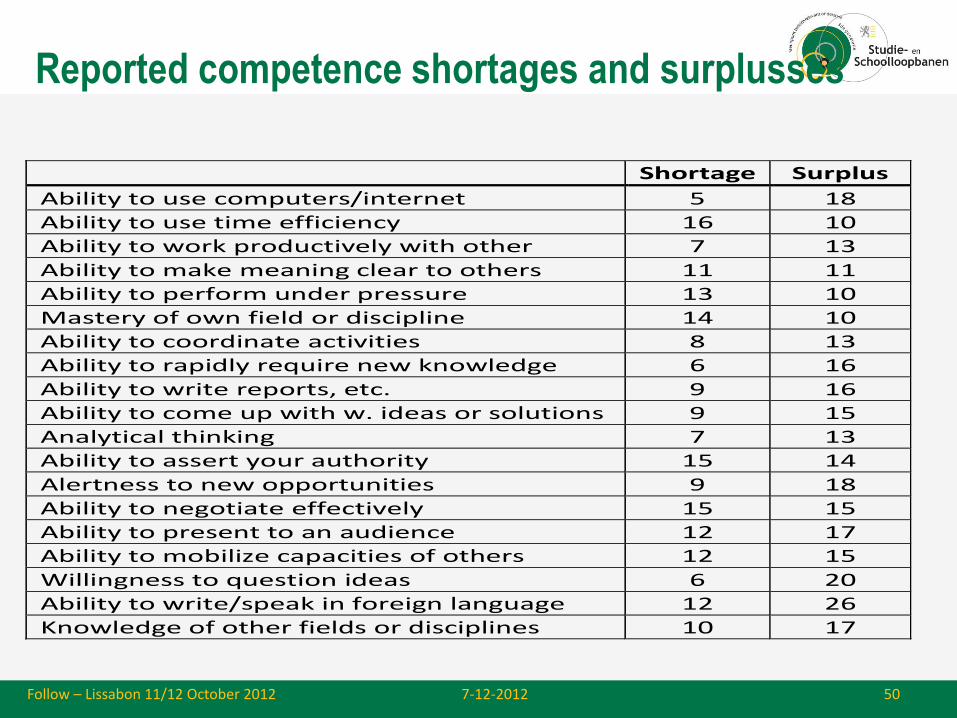
Reported competence shortages and surplusses
7-12-2012 Follow – Lissabon 11/12 October 2012 50
Shortage Surplus
Ability to use computers/internet 5 18
Ability to use time efficiency 16 10
Ability to work productively with other 7 13
Ability to make meaning clear to others 11 11
Ability to perform under pressure 13 10
Mastery of own field or discipline 14 10
Ability to coordinate activities 8 13
Ability to rapidly require new knowledge 6 16
Ability to write reports, etc. 9 16
Ability to come up with w. ideas or solutions 9 15
Analytical thinking 7 13
Ability to assert your authority 15 14
Alertness to new opportunities 9 18
Ability to negotiate effectively 15 15
Ability to present to an audience 12 17
Ability to mobilize capacities of others 12 15
Willingness to question ideas 6 20
Ability to write/speak in foreign language 12 26
Knowledge of other fields or disciplines 10 17
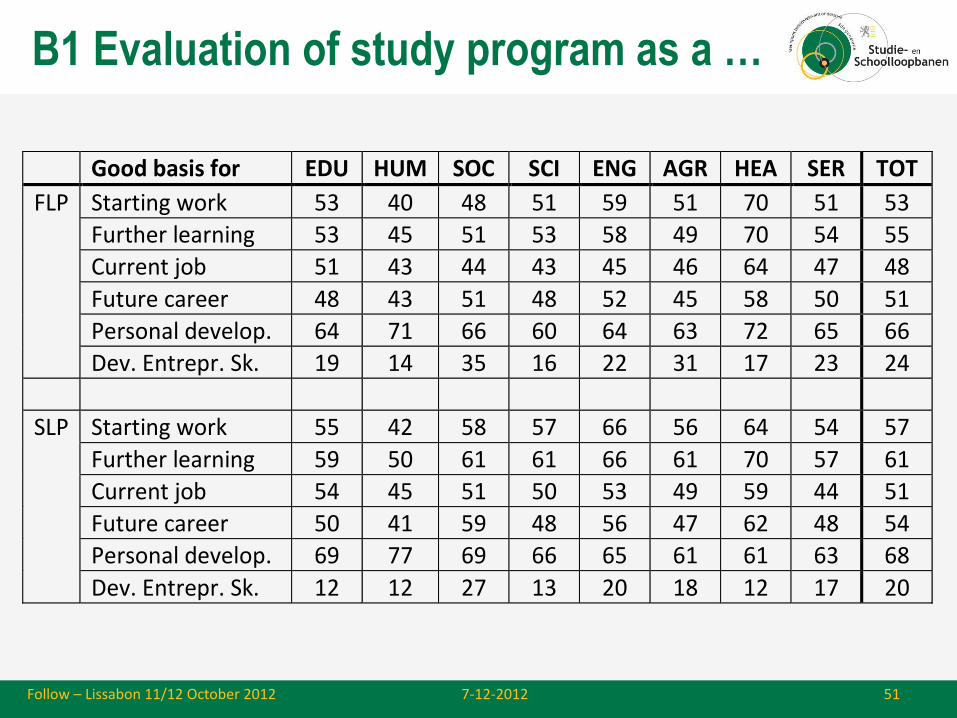
B1 Evaluation of study program as a …
7-12-2012 Follow – Lissabon 11/12 October 2012 51
Good basis for EDU HUM SOC SCI ENG AGR HEA SER TOT
FLP Starting work 53 40 48 51 59 51 70 51 53
Further learning 53 45 51 53 58 49 70 54 55
Current job 51 43 44 43 45 46 64 47 48
Future career 48 43 51 48 52 45 58 50 51
Personal develop. 64 71 66 60 64 63 72 65 66
Dev. Entrepr. Sk. 19 14 35 16 22 31 17 23 24
SLP Starting work 55 42 58 57 66 56 64 54 57
Further learning 59 50 61 61 66 61 70 57 61
Current job 54 45 51 50 53 49 59 44 51
Future career 50 41 59 48 56 47 62 48 54
Personal develop. 69 77 69 66 65 61 61 63 68
Dev. Entrepr. Sk. 12 12 27 13 20 18 12 17 20
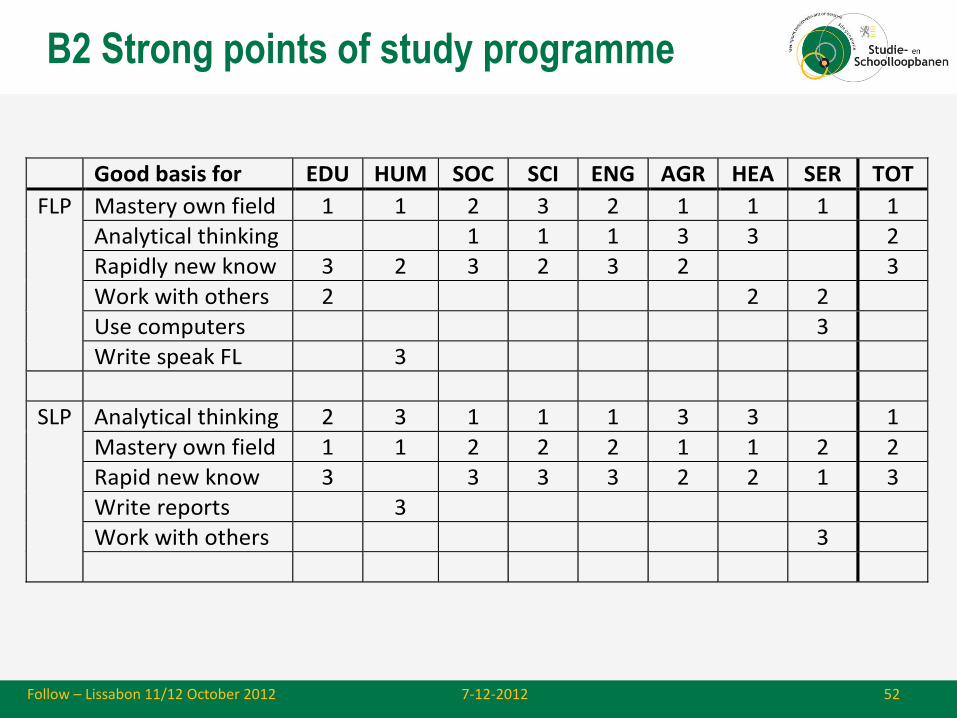
B2 Strong points of study programme
7-12-2012 Follow – Lissabon 11/12 October 2012 52
Good basis for EDU HUM SOC SCI ENG AGR HEA SER TOT
FLP Mastery own field 1 1 2 3 2 1 1 1 1
Analytical thinking 1 1 1 3 3 2
Rapidly new know 3 2 3 2 3 2 3
Work with others 2 2 2
Use computers 3
Write speak FL 3
SLP Analytical thinking 2 3 1 1 1 3 3 1
Mastery own field 1 1 2 2 2 1 1 2 2
Rapid new know 3 3 3 3 2 2 1 3
Write reports 3
Work with others 3
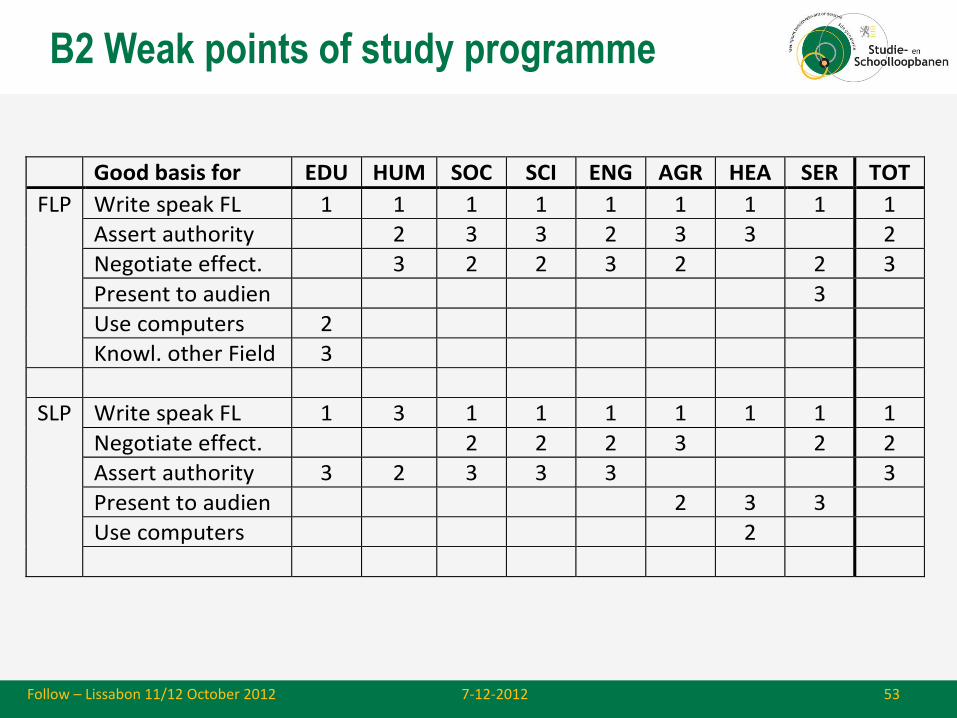
B2 Weak points of study programme
7-12-2012 Follow – Lissabon 11/12 October 2012 53
Good basis for EDU HUM SOC SCI ENG AGR HEA SER TOT
FLP Write speak FL 1 1 1 1 1 1 1 1 1
Assert authority 2 3 3 2 3 3 2
Negotiate effect. 3 2 2 3 2 2 3
Present to audien 3
Use computers 2
Knowl. other Field 3
SLP Write speak FL 1 3 1 1 1 1 1 1 1
Negotiate effect. 2 2 2 3 2 2
Assert authority 3 2 3 3 3 3
Present to audien 2 3 3
Use computers 2
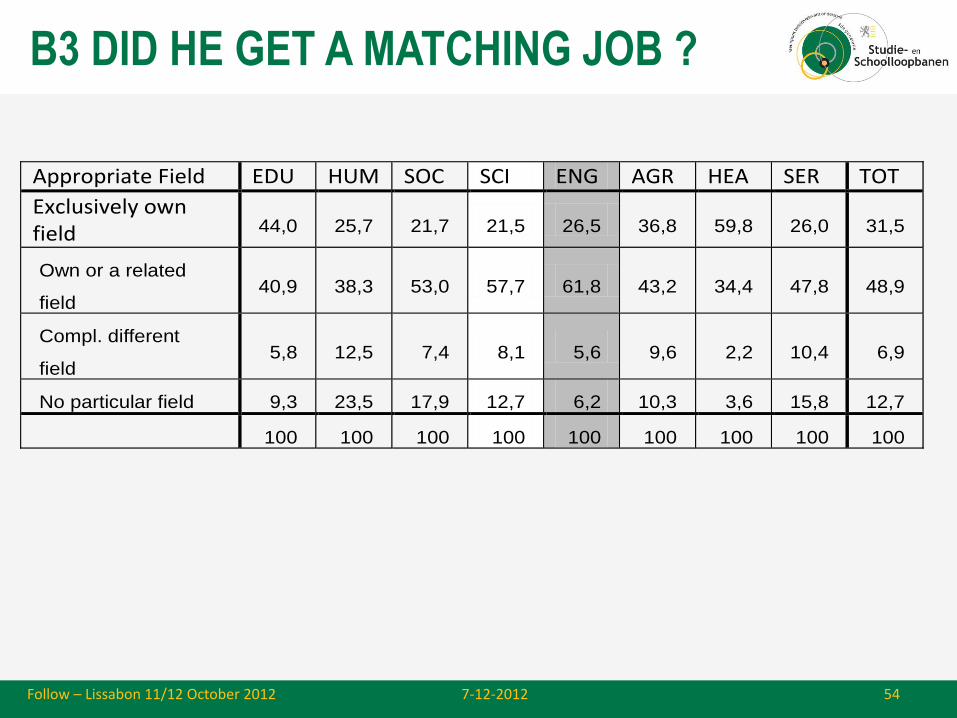
B3 DID HE GET A MATCHING JOB ?
7-12-2012 Follow – Lissabon 11/12 October 2012 54
Appropriate Field EDU HUM SOC SCI ENG AGR HEA SER TOT
Exclusively own field 44,0 25,7 21,7 21,5 26,5 36,8 59,8 26,0 31,5
Own or a related
field 40,9 38,3 53,0 57,7 61,8 43,2 34,4 47,8 48,9
Compl. different
field 5,8 12,5 7,4 8,1 5,6 9,6 2,2 10,4 6,9
No particular field 9,3 23,5 17,9 12,7 6,2 10,3 3,6 15,8 12,7
100 100 100 100 100 100 100 100 100

B4 HOW DID HE-GRADUATES FIND WORK?
7-12-2012 Follow – Lissabon 11/12 October 2012 55
Way of finding work EDU HUM SOC SCI ENG AGR HEA SER TOT
Newspaper ad. 15,3 13,8 15,7 12,4 12,1 10,9 11,5 13,5 13,7
Public empl. 4,8 5,3 4,2 5,2 3,1 3,6 3,2 5,2 4,2
Private empl. agency 2,0 5,2 6,9 3,6 3,0 1,7 2,8 6,6 4,4
Through internet 4,2 5,2 7,6 9,8 8,3 4,4 3,0 6,0 6,5
Contact empl. myself 28,3 19,5 17,6 16,1 22,9 21,5 31,4 23,3 22,0
Approached by empl. 14,0 12,4 9,2 10,8 12,4 14,4 10,6 10,7 11,2
Work placement HE 7,9 4,1 7,8 9,6 10,1 8,9 13,9 8,1 8,9
Family, friends, … 12,4 17,6 16,8 15,2 14,5 18,2 9,8 14,6 14,8
Help of HE institution 2,2 5,1 5,1 8,8 6,7 5,6 4,1 4,2 5,3
Set up own business 1,5 3,7 2,3 1,4 2,5 5,1 1,1 1,2 2,2
Other 6,6 7,4 6,0 6,4 4,2 5,6 8,1 6,2 6,3
Previous work 0,8 0,6 0,7 0,7 0,2 0,1 0,5 0,4 0,6
100 100 100 100 100 100 100 100 100
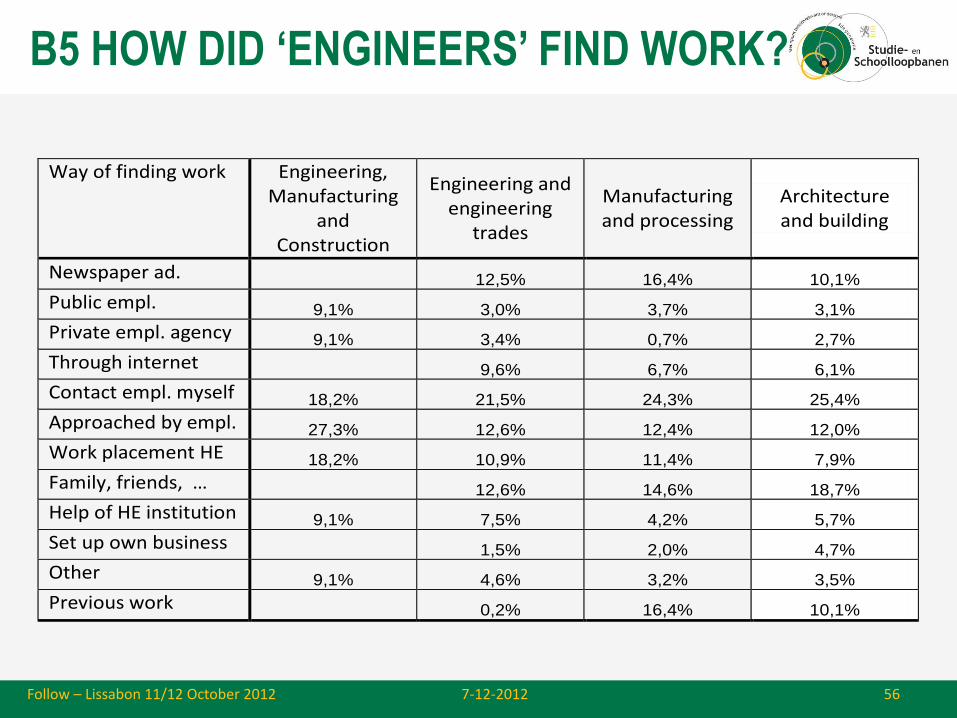
B5 HOW DID ‘ENGINEERS’ FIND WORK?
7-12-2012 Follow – Lissabon 11/12 October 2012 56
Way of finding work Engineering, Manufacturing
and Construction
Engineering and engineering
trades
Manufacturing and processing
Architecture and building
Newspaper ad. 12,5% 16,4% 10,1%
Public empl. 9,1% 3,0% 3,7% 3,1%
Private empl. agency 9,1% 3,4% 0,7% 2,7%
Through internet 9,6% 6,7% 6,1%
Contact empl. myself 18,2% 21,5% 24,3% 25,4%
Approached by empl. 27,3% 12,6% 12,4% 12,0%
Work placement HE 18,2% 10,9% 11,4% 7,9%
Family, friends, … 12,6% 14,6% 18,7%
Help of HE institution 9,1% 7,5% 4,2% 5,7%
Set up own business 1,5% 2,0% 4,7%
Other 9,1% 4,6% 3,2% 3,5%
Previous work 0,2% 16,4% 10,1%
FINAL REMARKS (I)
• Monitoring is not enough, there is also a big need to
understand the mechanisms producing the outcomes.
• Data-collection does not only need to deliver the
necessary input for the construction of a proper set of
(multi-dimensional) indicators, but also the data needed
for the analysis of the factors driving the trends and
developments.
7-12-2012 Follow – Lissabon October 11/12, 2012 57
FINAL REMARKS (II)
• Remember that success in the labour market does not (necessarily) signal high quality educational performance. (Or does it?)
• Remember also that one size does not fit all !!! (Or is there convergence?)
• Remember that education does not have the same ‘structuring capacity’ in all countries under consideration. (Or is this less and less important?)
7-12-2012 Follow – Lissabon October 11/12, 2012 58

THANKS FOR YOUR ATTENTION
OR
7-12-2012 Follow – Lissabon 11/12 October 2012 59