Embed Size (px)
Citation preview
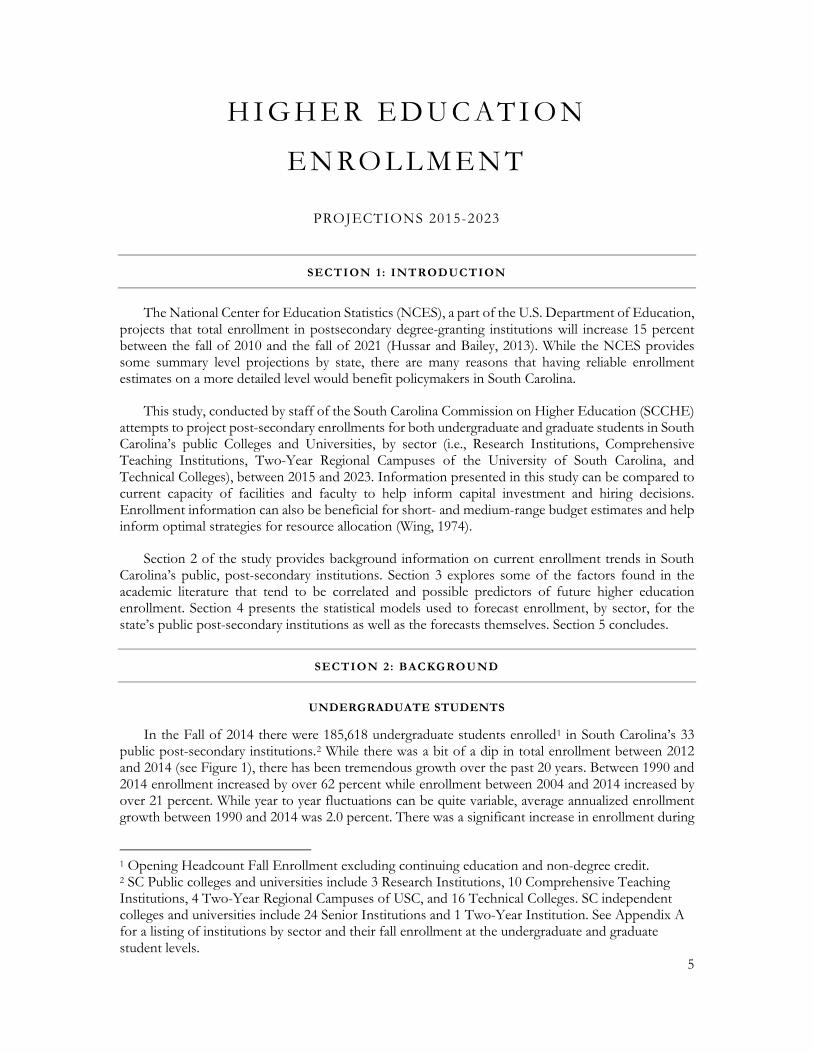
HIGHER EDUCATION ENROLLMENT
PROJECTIONS 2015-2023
S E P T E M B E R 2 0 1 5
R E P O R T B Y : E R I C A M . V O N N E S S E N , P H . D .
S . C . C O M M I S S I O N O N H I G H E R E D U C A T I O N
1 1 2 2 L A D Y S T . , S U I T E 3 0 0 C O L U M B I A , S C 2 9 2 0 1
1

E X E C U T I V E S U M M A RY Introduction: This report provides an overview of enrollment trends and enrollment projections at both the undergraduate and graduate level, by sector, for public colleges and universities in South Carolina. Using institutional enrollment data from the late 1970s through 2014, statistical models were built for each sector to determine which factors influence their enrollment and help predict future enrollment. Findings: Undergraduate Student Enrollment Enrollment in higher education has grown tremendously over the past 25 years.
Between 1990 and 2014 total enrollment in all public undergraduate programs has grown
62.5 percent, or about 2.0 percent per year. Between 1990 and 2014 total enrollment in all independent undergraduate programs has
grown 38.7 percent, or about 1.4 percent per year. While enrollment growth is projected to continue to increase over the next decade, there will be significant differences in the growth patterns of each of the sectors. Between 2014 and 2023 undergraduate enrollment is projected to increase: 11.6 percent to slightly more than 207,000 for all public undergraduate students,
o 16.0 percent to slightly more than 49,000 at the Research Institutions,
o 5.8 percent to nearly 50,000 in the Comprehensive Teaching Institutions,
o 13.1 percent to nearly 104,000 in the Technical Colleges, and
o 0.9 percent to just under 4,500 at the Two-Year Regional Campuses of USC.
Across all public sectors, the single best predictor of enrollment in one year is the level of enrollment in the prior year. Additional economic variables had differing impacts on enrollment depending on the sector examined. Since 1990, the level of undergraduate enrollment has become increasingly influenced by the unemployment rate. As the unemployment rate has risen, so too has enrollment in the state’s undergraduate
programs. All else equal, o Approximately 56 percent of the variation in enrollment at the Research Institutions
could be explained by variation in the state average unemployment rate.
o Approximately 57 percent of the variation in enrollment at the Comprehensive Teaching Institutions could be explained by variation in the state average unemployment rate.
2

o Approximately 56 percent of the variation in enrollment at the Technical Colleges could be explained by variation in the state average unemployment rate.
o Approximately 45 percent of the variation in enrollment at the Two-Year Regional Campuses of USC could be explained by variation in the state average unemployment rate.
Other economic variables that appear to play a role in the enrollment levels of undergraduate students include real per capita personal income and the number of seniors enrolled in the state’s public high schools. Increases in per capita personal income tend to increase undergraduate enrollment in the
Technical Colleges, Comprehensive Teaching Institutions, and Research Institutions.
Increases in the number of public high school seniors tend to increase undergraduate enrollment in the Research Institutions.
Increases in the level of unemployment in the counties traditionally served by the Two-Year Regional Campuses of USC typically increase undergraduate enrollment in those schools.
Graduate Student Enrollment Graduate student enrollment overall has grown at a much slower pace than undergraduate enrollment with significantly more variability. Between 1990 and 2014 total enrollment in all graduate programs has grown only 6.7
percent, or about 0.2 percent per year. Enrollment growth for graduate students is projected to grow marginally over the next decade in South Carolina—consistent with national trends. However, there appear to be significantly different outlooks for the Research vs. Comprehensive Teaching Institutions. Between 2014 and 2023 graduate student enrollment is projected to: Increase 7.0 percent to slightly more than 21,500 for all public graduate students,
Increase 2.7 percent to slightly more than 15,700 at the Research Institutions, and
Increase 20.7 percent to over 5,800 in the Comprehensive Teaching Institutions.
Contrary to enrollment for the undergraduate students, increases in the unemployment rate tend to decrease enrollments in graduate programs—particularly for those in the Comprehensive Teaching Institutions.
3

TA B L E O F C O N T E N T S Section 1: Introduction ................................................................................................. 5 Section 2: Background .................................................................................................. 5
Undergraduate Students ........................................................................................................ 5 Graduate Students .................................................................................................................. 9
Section 3: Potential Factors Influencing Enrollment ................................................... 9 High School Seniors, Racial Composition, and Birth Rates .......................................... 10 Unemployment Rate ............................................................................................................ 13 Personal Income ................................................................................................................... 19
Section 4: Forecast Models and Results ...................................................................... 19 Undergraduate—Two Year Regional Campuses of USC .............................................. 20 Undergraduate—Technical Colleges ................................................................................. 21 Undergraduate—Public Comprehensive Teaching Institutions ................................... 23 Undergraduate—Public Research Institutions ................................................................ 26 Undergraduate Students—Total Enrollment ................................................................... 28 Graduate Students—Comprehensive Teaching Institutions ......................................... 29 Graduate Students—Research Institutions ...................................................................... 31 Graduate Students—Total Enrollment ............................................................................ 33
Section 5: Conclusion .................................................................................................. 34 References ................................................................................................................... 36 Appendix A: Public and Independent Enrollment ...................................................... 38 Appendix B: Regression Results ................................................................................. 40 Appendix C: Methodology Cohort Survival and Economic Projections ..................... 42
Survival Rates ........................................................................................................................ 42 Forecasted Real Personal Income Per Capita .................................................................. 42 Unemployment Rates .......................................................................................................... 44
4
H I G H E R E D U C AT I O N
E N RO L L M E N T
PROJECTIONS 2015-2023
SECTION 1 : INTRODUCTION
The National Center for Education Statistics (NCES), a part of the U.S. Department of Education, projects that total enrollment in postsecondary degree-granting institutions will increase 15 percent between the fall of 2010 and the fall of 2021 (Hussar and Bailey, 2013). While the NCES provides some summary level projections by state, there are many reasons that having reliable enrollment estimates on a more detailed level would benefit policymakers in South Carolina.
This study, conducted by staff of the South Carolina Commission on Higher Education (SCCHE) attempts to project post-secondary enrollments for both undergraduate and graduate students in South Carolina’s public Colleges and Universities, by sector (i.e., Research Institutions, Comprehensive Teaching Institutions, Two-Year Regional Campuses of the University of South Carolina, and Technical Colleges), between 2015 and 2023. Information presented in this study can be compared to current capacity of facilities and faculty to help inform capital investment and hiring decisions. Enrollment information can also be beneficial for short- and medium-range budget estimates and help inform optimal strategies for resource allocation (Wing, 1974).
Section 2 of the study provides background information on current enrollment trends in South Carolina’s public, post-secondary institutions. Section 3 explores some of the factors found in the academic literature that tend to be correlated and possible predictors of future higher education enrollment. Section 4 presents the statistical models used to forecast enrollment, by sector, for the state’s public post-secondary institutions as well as the forecasts themselves. Section 5 concludes.
SECTION 2: BACKGROUND
UNDERGRADUATE STUDENTS
In the Fall of 2014 there were 185,618 undergraduate students enrolled1 in South Carolina’s 33 public post-secondary institutions.2 While there was a bit of a dip in total enrollment between 2012 and 2014 (see Figure 1), there has been tremendous growth over the past 20 years. Between 1990 and 2014 enrollment increased by over 62 percent while enrollment between 2004 and 2014 increased by over 21 percent. While year to year fluctuations can be quite variable, average annualized enrollment growth between 1990 and 2014 was 2.0 percent. There was a significant increase in enrollment during
1 Opening Headcount Fall Enrollment excluding continuing education and non-degree credit. 2 SC Public colleges and universities include 3 Research Institutions, 10 Comprehensive Teaching Institutions, 4 Two-Year Regional Campuses of USC, and 16 Technical Colleges. SC independent colleges and universities include 24 Senior Institutions and 1 Two-Year Institution. See Appendix A for a listing of institutions by sector and their fall enrollment at the undergraduate and graduate student levels.
5

the most recent recession with enrollment increasing 7.8 percent between 2008 and 2009, the largest single year increase during the period.
Figure 1: Total Public Undergraduate Enrollment, 1990-2014
Growth has been strongest in the Technical Colleges with average annualized growth between 1990 and 2014 of 3.0 percent. This was followed by Research Institutions (1.4 percent), Comprehensive Teaching Institutions (1.2 percent), and USC Two-Year Regional Campuses (1.0 percent).
114,207
150,826
185,618
100,000
110,000
120,000
130,000
140,000
150,000
160,000
170,000
180,000
190,000
200,000
1990199219941996199820002002200420062008201020122014
6
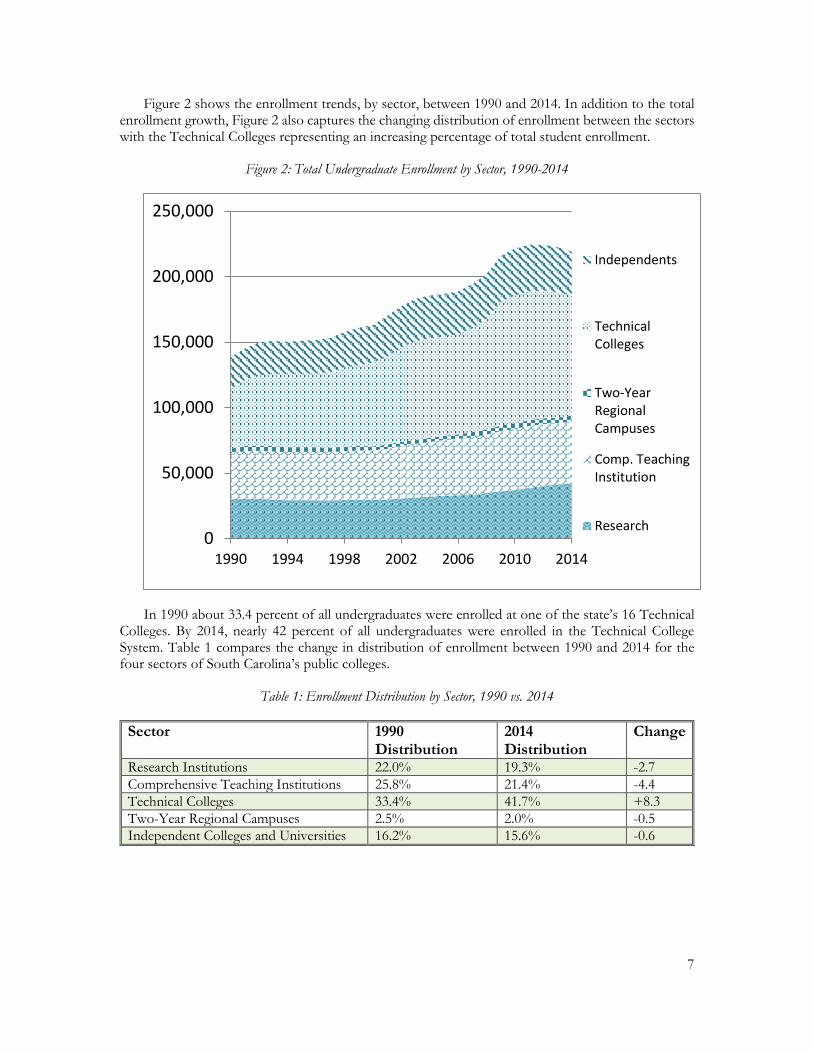
Figure 2 shows the enrollment trends, by sector, between 1990 and 2014. In addition to the total enrollment growth, Figure 2 also captures the changing distribution of enrollment between the sectors with the Technical Colleges representing an increasing percentage of total student enrollment.
Figure 2: Total Undergraduate Enrollment by Sector, 1990-2014
In 1990 about 33.4 percent of all undergraduates were enrolled at one of the state’s 16 Technical Colleges. By 2014, nearly 42 percent of all undergraduates were enrolled in the Technical College System. Table 1 compares the change in distribution of enrollment between 1990 and 2014 for the four sectors of South Carolina’s public colleges.
Table 1: Enrollment Distribution by Sector, 1990 vs. 2014
Sector 1990 Distribution
2014 Distribution
Change
Research Institutions 22.0% 19.3% -2.7 Comprehensive Teaching Institutions 25.8% 21.4% -4.4 Technical Colleges 33.4% 41.7% +8.3 Two-Year Regional Campuses 2.5% 2.0% -0.5 Independent Colleges and Universities 16.2% 15.6% -0.6
0
50,000
100,000
150,000
200,000
250,000
1990 1994 1998 2002 2006 2010 2014
Independents
TechnicalColleges
Two-YearRegionalCampuses
Comp. TeachingInstitution
Research
7

Enrollment in the state’s Independent colleges and universities has grown 55.0% percent between 1990 and 2014, or about 1.8 percent per year. Enrollment has declined significantly since peaking in 2010. Similarly to the public technical colleges, independent colleges and universities saw about a 4.1 percent drop in total undergraduate enrollment between 2010 and 2014.
Figure 3: Total Independent Undergraduate Student Enrollment, 1990-2014
The percentage of all undergraduate students enrolled in the independent colleges and universities declined slightly over the past 24 years from about 16.2 percent in 1990 to about 15.6 percent in 2014. This percentage has been fairly consistently in the 15 to 17 percent range, thus no enrollment projections were made for the independent institutions for undergraduate students.
22,149
35,79534,326
15,000
20,000
25,000
30,000
35,000
40,000
1990 1993 1996 1999 2002 2005 2008 2011 2014
8

GRADUATE STUDENTS 3
Shifting to graduate student enrollment in public colleges and universities, the total headcounts have remained mostly flat over the past 20 years with significantly more variability across the 20-year span (See Figure 3). Since 1990, total enrollment has grown at an annualized rate of 0.3 percent. Over the previous 10 years, annualized growth was about 0.2 percent per year.
Figure 4: Total Public Graduate Student Enrollment, 1990-2014
Due to limitations in the consistency of data reporting on enrollment of graduate students at independent colleges and universities and the fact that the number of schools offering graduate programs has changed significantly during the period of study,4 no analysis of independent college and university graduate students is undertaken in this study.
SECTION 3: POTENTIAL FACTORS INFLUENCING ENROLLMENT
Section 2 provided an overview of enrollment in South Carolina’s undergraduate and graduate in the recent past. In order to complete predictions on enrollment going forward, it was necessary to examine possible factors that could influence the number of students in the state’s higher education system. Explored below are a number of economic variables that were considered when choosing the
3 Includes Master’s, Unclassified Graduates, Doctor’s-Professional Practice, and Doctor’s-Research/Scholarship 4 Anderson University, Claflin University, Coker College, Limestone College, North Greenville University, Presbyterian College, and South University all began offering graduate programs after 1990.
18,881
21,067
20,139
16,000
17,000
18,000
19,000
20,000
21,000
22,000
23,000
24,000
1990 1993 1996 1999 2002 2005 2008 2011 2014
9

appropriate statistical models to make enrollment projections. Past research has found that many of these are good predictors of future enrollment in higher education.
HIGH SCHOOL SENIORS, RACIAL COMPOSITION, AND BIRTH RATES
A logical starting point to estimate future college enrollment is to examine trends in the number of students progressing through the state’s high schools. A number of studies have found that the number of high school graduates affects college student enrollment (Chen, 2008; Claggett, 1989; Lins, 1960; Wing, 1974). The NCES provides data on public school enrollments in grades 1 through 12, as well as the number of students graduating.5 More recent state-level data on headcount by grade is also available from the South Carolina Department of Education. Using historical rates of grade progression, we can estimate a potential future supply of individuals who may enroll in one of South Carolina’s public colleges or universities through the year 2023.
A projection of the number of 12th graders in the state’s public high schools is achieved by examining the number of students currently enrolled in grades 3 through 11. Those students currently in the 11th grade would be expected to begin enrolling in college in the fall term of 2016. Those students currently in the 3rd grade would be expected to begin enrolling in college in the fall term of 2024.
Changes in headcount between grades can result from grade retention and acceleration, net migration among states and schools (e.g., public vs. private), dropouts, early graduations, and mortality (Prescott and Bransberger, 2012). While none of these are modeled explicitly, cohort survival ratios do implicitly capture their influence through year-to-year trends. Using the survival rates of individuals between 3rd and 4th, 4th and 5th…etc. we have calculated the projected number of seniors through 2023. These results are shown in Table 2.
Table 2: Projected Public High School Seniors, 2015-2024
Current Grade Level
2014/15 Headcount6
Anticipated Graduation Year
Projected Number of Seniors7
12 45,626 2015 45,626 11 49,980 2016 46,285 10 56,488 2017 46,399 9 64,724 2018 47,317 8 57,044 2019 47,587 7 55,962 2020 46,781 6 55,456 2021 46,766 5 55,230 2022 47,227 4 55,749 2023 48,009 3 57,407 2024 49,739
5 The enrollment at private high schools in South Carolina is not very large. In 2008-2009 the total was about 2,900 graduates or about 7% of the state’s total. The Western Institute for Higher Education (WICHE) projects that this will drop to about 5% by 2017-2018. Nonpublic high school students were not considered in these projections due to their fairly stable percentage and small numbers. 6 45-day ADM counts from South Carolina Department of Education, 2014-15. This includes enrollment at Charter Schools, Virtual Schools, School for the Deaf and the Blind, Department of Juvenile Justice, Department of Corrections, and the Governor’s Schools. 7 Cohort survival analysis implicitly accounts for drop outs, out of state migration, and in migration to the state, assuming those trends are fairly consistent over time. Any deviations from long-term trends have the potential to impact the projected numbers.
10

Using the same cohort survival ratio methodology, it is also possible to project the number of public high school graduates during this time period to compare to other sources such as projections made by the Western Interstate Commission for Higher Education (WICHE). Table 3 provides the estimated number of public high school graduates each academic year using both the WICHE and SCCHE projections. On average, the SCCHE projections are about 2.5 percent higher than the WICHE projections.
The underlying assumptions for the SCCHE projections are that there are no significant changes in the percent of high school students graduating, that the distribution of students between public and private schools remains fairly constant, and that migration patterns into and out of the state remain consistent. Changes in any of these factors have the potential to significantly impact the prospective higher education pipeline.
Table 3: Projected Public High School Graduates, 2015-2024
Academic Year WICHE Projections SCCHE Projections Difference8 2015/16 38,678 40,856 +5.6% 2016/17 39,617 40,956 +3.4% 2017/18 40,910 41,767 +2.1% 2018/19 40,953 42,005 +2.6% 2019/20 40,005 41,294 +3.2% 2020/21 39,905 41,280 +3.4% 2021/22 40,485 41,688 +3.0% 2022/23 41,739 42,378 +1.5% 2023/24 45,032 43,904 -2.5% Average +2.5%
WICHE also provides projections for the number of public high school graduates broken out into racial/ethnic groups. In South Carolina, the population of White, Non-Hispanic high school graduates is projected to grow only 3.9 percent between 2014 and 2023 while the population of Hispanic graduates is expected to grow by 145.5 percent, American Indian/Alaska Native by 132.4 percent, and Asian/Pacific Islander by 127.4 percent. The number of Black, Non-Hispanic graduates are projected to grow about 6.4 percent during this time period. Table 4 provides the estimated number of graduates through the year 2022-2023.
Table 4: WICHE Projected Public High School Graduates by Race/Ethnicity, 2008-2022
Academic Year
Native Am./Alaska
Asian/Pacific Black Hispanic White, non-Hispanic
2008-09 107 605 14,541 1,227 22,453 2009-10* 82 652 14,291 1,327 22,492 2010-11* 69 534 14,294 1,443 22,704
8 The methodology used for the WICHE and SCCHE projections is largely similar—Cohort Survival Analysis. The main difference is that WICHE uses both current data and a five-year smoothed average while the SCCHE projections used only the most recently available survival rates. Since survival rates have been increasing in recent years, this accounts for the higher SCCHE projections compared to WICHE.
11

Academic Year
Native Am./Alaska
Asian/Pacific Black Hispanic White, non-Hispanic
2011-12* 61 610 14,465 1,603 22,993 2012-13* 78 651 13,442 1,768 22,551 2013-14* 80 653 12,200 1,628 22,169 2014-15* 74 715 12,099 1,787 22,404 2015-16* 85 735 12,343 2,025 22,832 2016-17* 96 829 12,433 2,118 23,598 2017-18* 107 925 12,990 2,455 23,937 2018-19* 103 988 12,867 2,701 23,827 2019-20* 94 1,016 12,250 2,873 23,445 2020-21* 112 1,013 11,998 3,042 23,560 2021-22* 128 1,055 11,995 3,226 23,902 2022-23* 172 1,377 12,756 4,579 22,958
*Projected
This will result in a change in the distribution of high school graduates with the share of White, Non-Hispanic graduates dropping from about 60.4 percent in 2014 to 53.4 percent by 2023. The share of Hispanic graduates will likely grow from 4.8 percent to 11.8 percent while the share of Black high school graduates will slip slightly from 32.6 percent to 31.2 percent.
This potential change in the distribution of high school graduates by race may have an impact on potential college enrollment immediately succeeding graduation. According to the Bureau of Labor Statistics annual review of the College Enrollment and Work Status of recent high school graduates, in 2013, 65.9 percent of all high school graduates were enrolled in a two- or four-year program by October of their graduation year. This percentage differs based on race/ethnicity as well as year as shown in Table 5.
Table 5: National9 College Enrollment of Recent HS Graduates by Race/Ethnicity, 2010-2014
Academic Year
Native Am./Alaska
Asian/Pacific Black Hispanic White, non-Hispanic
2010 N/A 84.0% 61.4% 59.6% 68.6% 2011 N/A 86.7% 67.5% 66.6% 67.7% 2012 N/A 82.2% 58.2% 70.3% 66.6% 2013 N/A 79.1% 59.3% 59.9% 67.1%
Source: Bureau of Labor Statistics, TED: The Economics Daily May 8, 2014
Given that Hispanic high school graduates have historically had lower rates of immediate college enrollment, combined with their projected growth rate in the state, this is likely to limit enrollment growth in SC institutions. This effect may be compensated for with efforts such as: increased out-of-
9 There were no college enrollment rates by race/ethnicity available at the state level. The National Center for Higher Education Management Systems estimates that in 2010 about 68.3% of recent SC high school graduates enrolled in higher education. This is similar to the national rates.
12

state recruitment, increased high school graduation rates, increased high school to college progression rates, and/or attracting additional non-traditionally aged students.
While outside the scope of this study, it is important to note that there may be a decline in the number of high school seniors in the long-run as the number of births in South Carolina declined, on average, two percent per year between 2009 and 2013 as the state experienced the worst economic downturn since the Great Depression. Figure 5 shows the fluctuating pattern of births in the state between 1990 and 2013. The decline in the number of births is not anticipated to have any impact on South Carolina higher education enrollment until at least 2027.
Figure 5: South Carolina Births, 1990-201310
Those individuals born between 2005 and 2008, who could be expected to graduate between 2023 and 2026, are the latest “bubble” that could be expected to raise higher education enrollment rates through population alone. Unless there are changes in the percentage of students graduating high school and enrolling in higher education or additional participation from non-traditional age students, it is likely that enrollments will peak in the mid-2020s.
Preliminary data from the National Vital Statistics Reports, released June 17, 2015, showed the number of births for SC to be 57,617 for 2014 which would be about a 1.4 percent increase over 2013 levels and the first increase since 2008. It is too early to tell if this will be a continuing trend or just an isolated bump. Nationally, the birth rate also increased about 1 percent between 2013 and 2014.
UNEMPLOYMENT RATE
In theory, higher rates of unemployment increase the attractiveness of higher education by lowering the opportunity cost of not working in a full-time job. A difficult job market also can provide incentives for individuals to retrain for occupations and careers that may be in more demand.
Empirically, there have been mixed results when researchers have examined the relationship between postsecondary enrollment and the unemployment rate. Craft et al. (2012), Helmelt & Marcotte, 2011, and Stanley & French, 2009 all found no relationship between unemployment and
10 Centers for Disease Control: National Vital Statistics Reports
50,000
52,000
54,000
56,000
58,000
60,000
62,000
64,000
1990 1993 1996 1999 2002 2005 2008 2011
13
enrollment11. Kane (1995) and DeLeeuw (2012) both found a positive relationship between unemployment and enrollment in two-year public colleges. Using data from 2001-2008 from South Carolina’s and Virginia’s Technical Colleges, Rivers (2010) found a small positive relationship for South Carolina and a small negative relationship for Virginia, although both were insignificant at conventional levels.
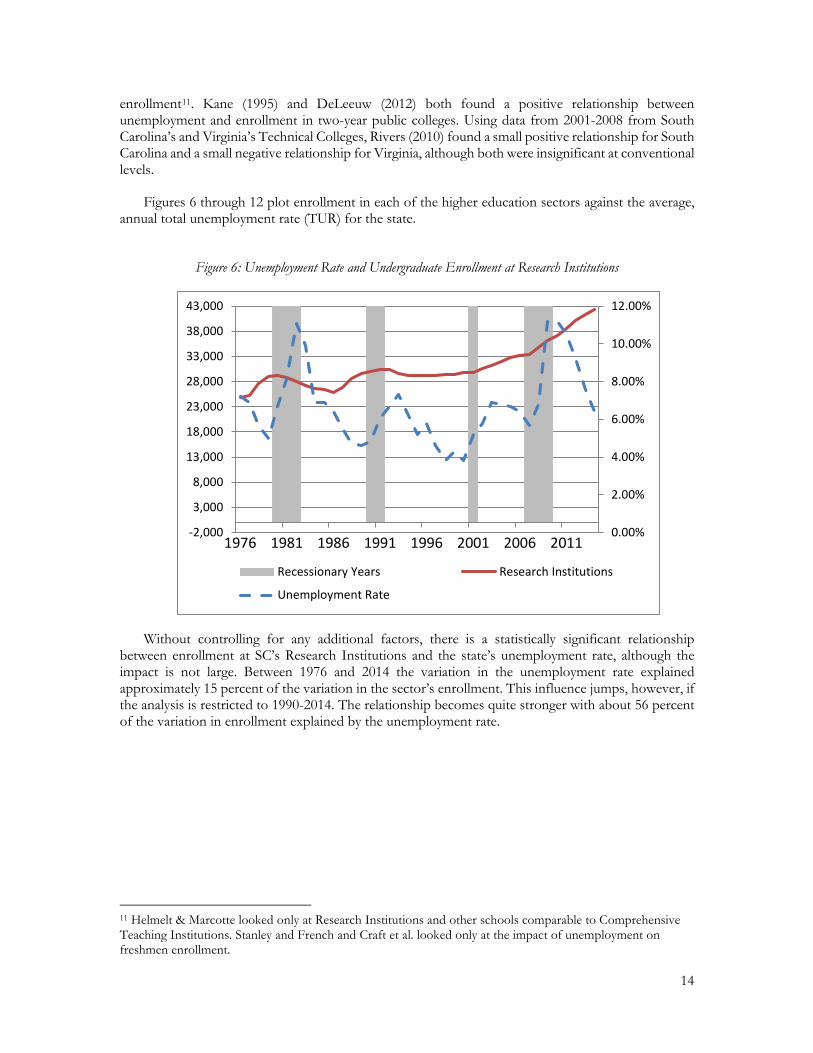
Figures 6 through 12 plot enrollment in each of the higher education sectors against the average, annual total unemployment rate (TUR) for the state.
Figure 6: Unemployment Rate and Undergraduate Enrollment at Research Institutions
Without controlling for any additional factors, there is a statistically significant relationship between enrollment at SC’s Research Institutions and the state’s unemployment rate, although the impact is not large. Between 1976 and 2014 the variation in the unemployment rate explained approximately 15 percent of the variation in the sector’s enrollment. This influence jumps, however, if the analysis is restricted to 1990-2014. The relationship becomes quite stronger with about 56 percent of the variation in enrollment explained by the unemployment rate.
11 Helmelt & Marcotte looked only at Research Institutions and other schools comparable to Comprehensive Teaching Institutions. Stanley and French and Craft et al. looked only at the impact of unemployment on freshmen enrollment.
0.00%
2.00%
4.00%
6.00%
8.00%
10.00%
12.00%
-2,000
3,000
8,000
13,000
18,000
23,000
28,000
33,000
38,000
43,000
1976 1981 1986 1991 1996 2001 2006 2011
Recessionary Years Research Institutions
Unemployment Rate
14

Figure 7: Unemployment Rate and Undergraduate Enrollment at Comprehensive Teaching Institutions
Between 1976 and 2014, there is no statistically significant relationship between enrollment at the Comprehensive Teaching Institutions and the state unemployment rate. However, if the time period is restricted to post-1990, there is a much stronger, positive and statistically significant relationship. The variation in the unemployment rate explains approximately 57 percent of the variation in enrollment during that time period.
Figure 8: Unemployment Rate and Undergraduate Enrollment at USC’s Two-Year Regional Campuses
As the unemployment rate increases, so, too, does enrollment at USC’s Two-Year Regional Campuses. The relationship is statistically significant at conventional levels. Approximately 45 percent of the variation in the sector’s enrollment can be explained by variations in the state unemployment rate.
0.00%
2.00%
4.00%
6.00%
8.00%
10.00%
12.00%
-2,000
3,000
8,000
13,000
18,000
23,000
28,000
33,000
38,000
43,000
48,000
1976 1981 1986 1991 1996 2001 2006 2011Recessionary YearsComprehensive Teaching InstitutionsUnemployment Rate
0.00%
2.00%
4.00%
6.00%
8.00%
10.00%
12.00%
0
1,000
2,000
3,000
4,000
1990 1993 1996 1999 2002 2005 2008 2011 2014Recessionary YearsTwo-Year USC Regional CampusesUnemployment Rate
15

From Figure 8, it appears that the state unemployment rate has some predictive power for enrollment at USC’s Two-Year Regional campuses, however, if the unemployment rate is more narrowly focused to the counties traditionally served by these campuses, there is a slightly stronger relationship. Figure 9 provides a comparison of the headcount at USC’s Regional Two-Year campuses from 1990 through 2014 to the area12 unemployment rate.
Figure 9: Unemployment Rate Selected Counties vs. USC’s Two-Year Regional Campus Enrollment, 1990-2014
12 The area includes the following counties: Allendale, Bamberg, Barnwell, Cherokee, Chester, Chesterfield, Clarendon, Colleton, Fairfield, Hampton, Kershaw, Lancaster, Laurens, Lee, Newberry, Sumter, Union, Williamsburg, and York.
0.0%
2.0%
4.0%
6.0%
8.0%
10.0%
12.0%
14.0%
16.0%
0
1,000
2,000
3,000
4,000
1990 1993 1996 1999 2002 2005 2008 2011 2014Recessionary Years Two-Year USC Regional CampusesArea Unemployment
16
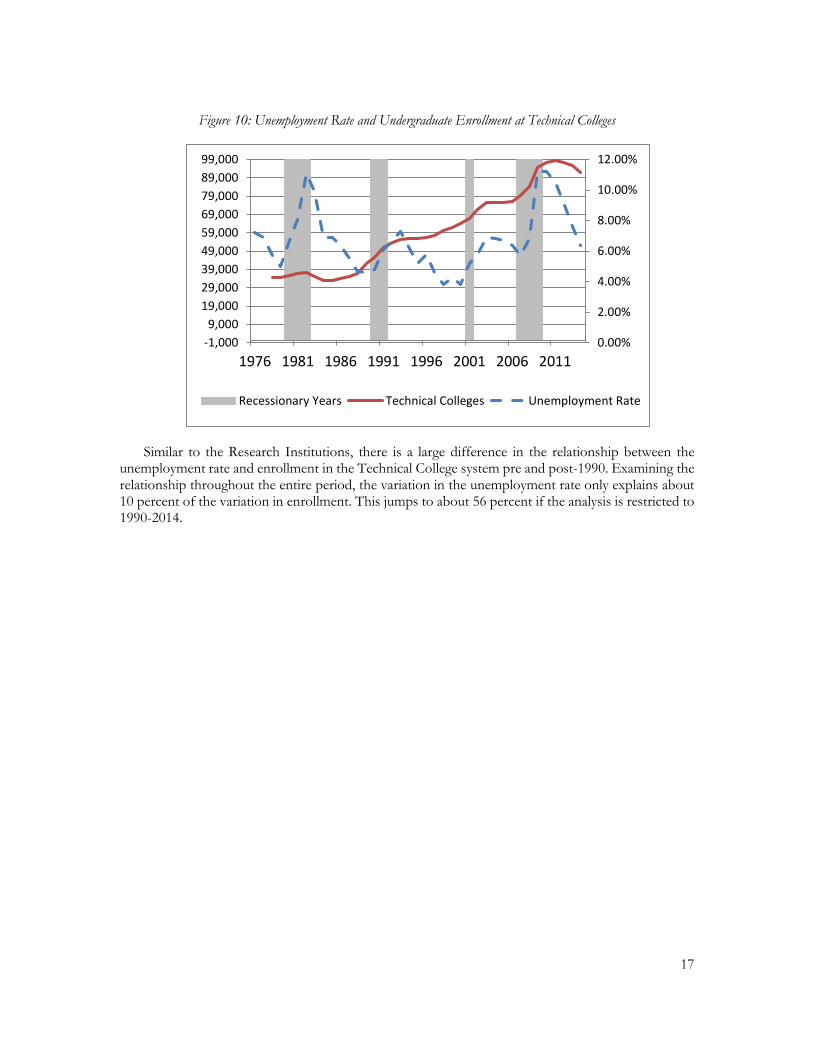
Figure 10: Unemployment Rate and Undergraduate Enrollment at Technical Colleges
Similar to the Research Institutions, there is a large difference in the relationship between the unemployment rate and enrollment in the Technical College system pre and post-1990. Examining the relationship throughout the entire period, the variation in the unemployment rate only explains about 10 percent of the variation in enrollment. This jumps to about 56 percent if the analysis is restricted to 1990-2014.
0.00%
2.00%
4.00%
6.00%
8.00%
10.00%
12.00%
-1,0009,000
19,00029,00039,00049,00059,00069,00079,00089,00099,000
1976 1981 1986 1991 1996 2001 2006 2011
Recessionary Years Technical Colleges Unemployment Rate
17
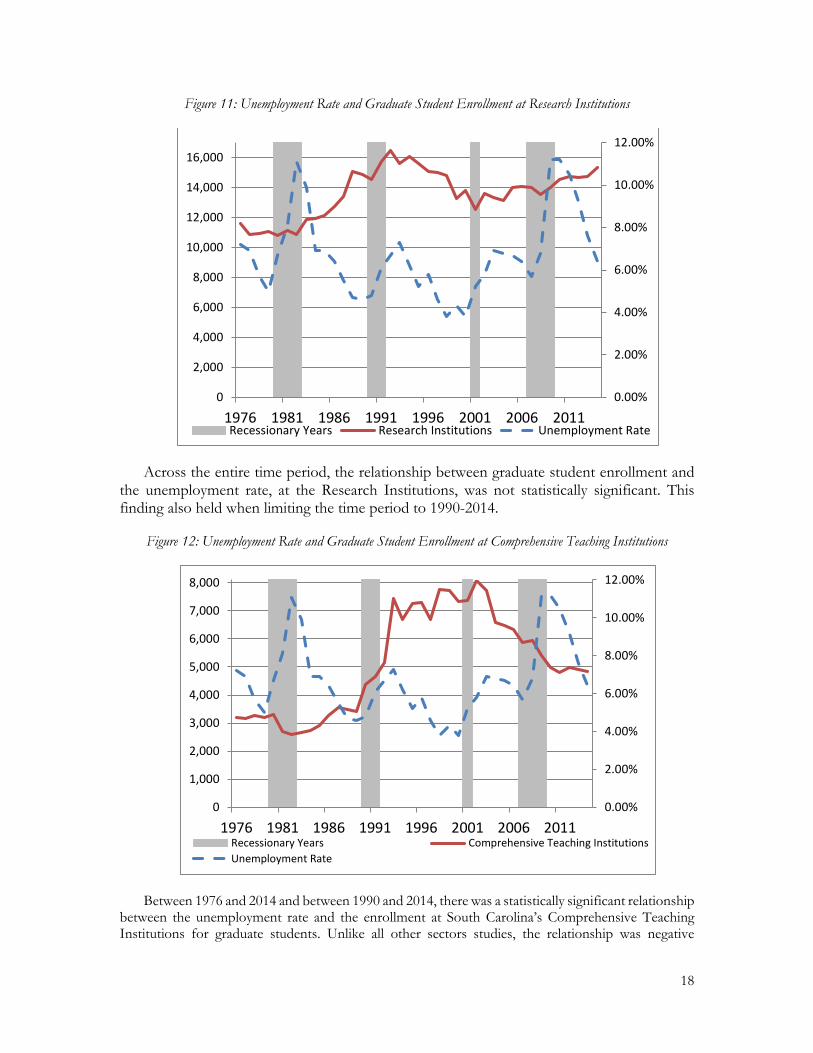
Figure 11: Unemployment Rate and Graduate Student Enrollment at Research Institutions
Across the entire time period, the relationship between graduate student enrollment and the unemployment rate, at the Research Institutions, was not statistically significant. This finding also held when limiting the time period to 1990-2014.
Figure 12: Unemployment Rate and Graduate Student Enrollment at Comprehensive Teaching Institutions
Between 1976 and 2014 and between 1990 and 2014, there was a statistically significant relationship between the unemployment rate and the enrollment at South Carolina’s Comprehensive Teaching Institutions for graduate students. Unlike all other sectors studies, the relationship was negative
0.00%
2.00%
4.00%
6.00%
8.00%
10.00%
12.00%
0
2,000
4,000
6,000
8,000
10,000
12,000
14,000
16,000
1976 1981 1986 1991 1996 2001 2006 2011Recessionary Years Research Institutions Unemployment Rate
0.00%
2.00%
4.00%
6.00%
8.00%
10.00%
12.00%
0
1,000
2,000
3,000
4,000
5,000
6,000
7,000
8,000
1976 1981 1986 1991 1996 2001 2006 2011Recessionary Years Comprehensive Teaching InstitutionsUnemployment Rate
18

meaning that as unemployment rose, enrollment of graduate students in this sector declined. One possible explanation for this finding is that during economic downturns, it may be necessary to put additional graduate education on hold to join or return to the labor market.
PERSONAL INCOME
Lehr and Newton (1978) find that increases in average per capita income are positively associated with enrollment demand. Their findings indicate that students in Oregon are less sensitive to the current prices of education (tuition) than they are to their ability to pay for it (personal income). They find that, especially for community colleges, enrollment is more sensitive to parental income than other types of schools.
Real per capita income in South Carolina has grown at about 1 percent per year between 1990 and 2014 with moderate dips in 1991 and 2008-2010. This upward trend is likely to have a positive impact on enrollment in higher education in South Carolina according to Lehr and Newton’s findings.
Figure 13: Real Per Capita Income South Carolina, 1980-2014
SECTION 4: FORECAST MODELS AND RESULT S
A system-wide, aggregate forecast for public undergraduate enrollment is obtained by summing the individual forecasts of the four major sectors of public colleges and universities: Research Institutions, Comprehensive Teaching Institutions, Two-Year Regional Campuses of USC, and Technical Colleges. Several different types of models are used to forecast enrollment at the various institutional sectors depending on best fit. While some sectors have enrollments that are best predicted by their own past enrollment values, others are more strongly influenced by structural factors such as the number of high school seniors in the prior year, the unemployment rate, or per capita income. Standard econometric diagnostic tests and analyses of fit were used to produce the best model for each sector.
$0$5,000
$10,000$15,000$20,000$25,000$30,000$35,000$40,000
1980
1983
1986
1989
1992
1995
1998
2001
2004
2007
2010
2013
Recessionary Years Per Capita Income
19
UNDERGRADUATE—TWO YEAR REGIONAL CAMPUSES OF USC
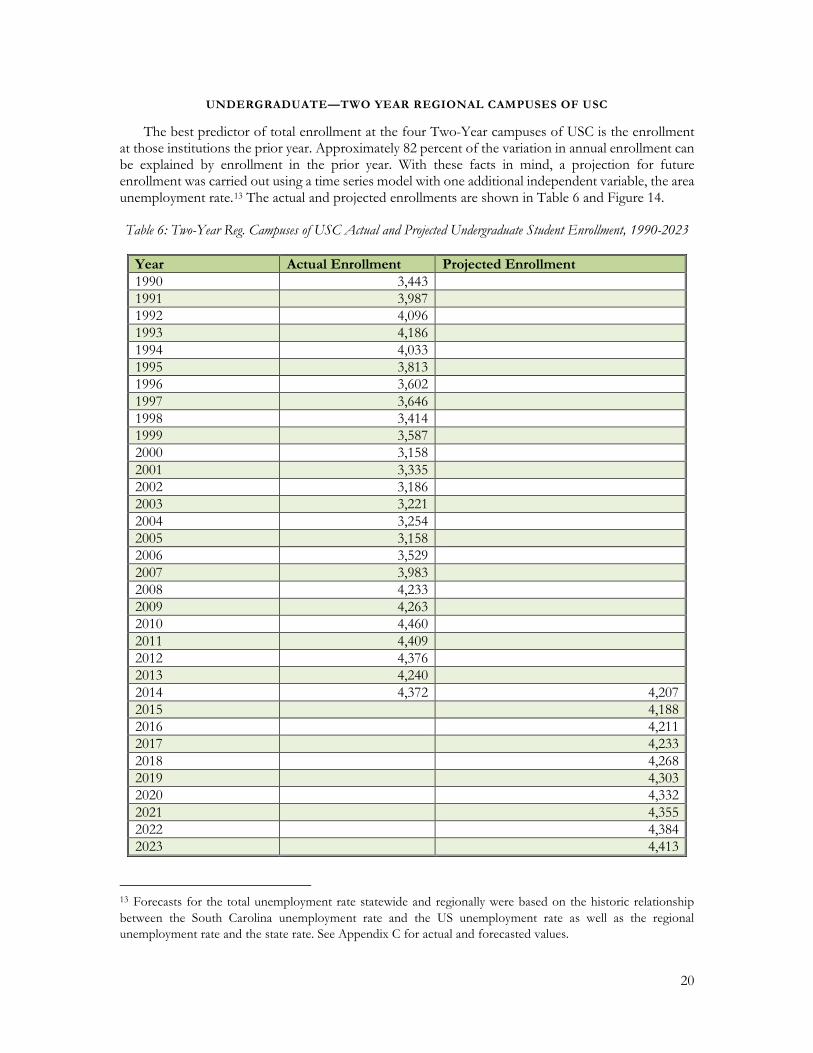
The best predictor of total enrollment at the four Two-Year campuses of USC is the enrollment at those institutions the prior year. Approximately 82 percent of the variation in annual enrollment can be explained by enrollment in the prior year. With these facts in mind, a projection for future enrollment was carried out using a time series model with one additional independent variable, the area unemployment rate.13 The actual and projected enrollments are shown in Table 6 and Figure 14.
Table 6: Two-Year Reg. Campuses of USC Actual and Projected Undergraduate Student Enrollment, 1990-2023
Year Actual Enrollment Projected Enrollment 1990 3,443 1991 3,987 1992 4,096 1993 4,186 1994 4,033 1995 3,813 1996 3,602 1997 3,646 1998 3,414 1999 3,587 2000 3,158 2001 3,335 2002 3,186 2003 3,221 2004 3,254 2005 3,158 2006 3,529 2007 3,983 2008 4,233 2009 4,263 2010 4,460 2011 4,409 2012 4,376 2013 4,240 2014 4,372 4,207 2015 4,188 2016 4,211 2017 4,233 2018 4,268 2019 4,303 2020 4,332 2021 4,355 2022 4,384 2023 4,413
13 Forecasts for the total unemployment rate statewide and regionally were based on the historic relationship between the South Carolina unemployment rate and the US unemployment rate as well as the regional unemployment rate and the state rate. See Appendix C for actual and forecasted values.
20
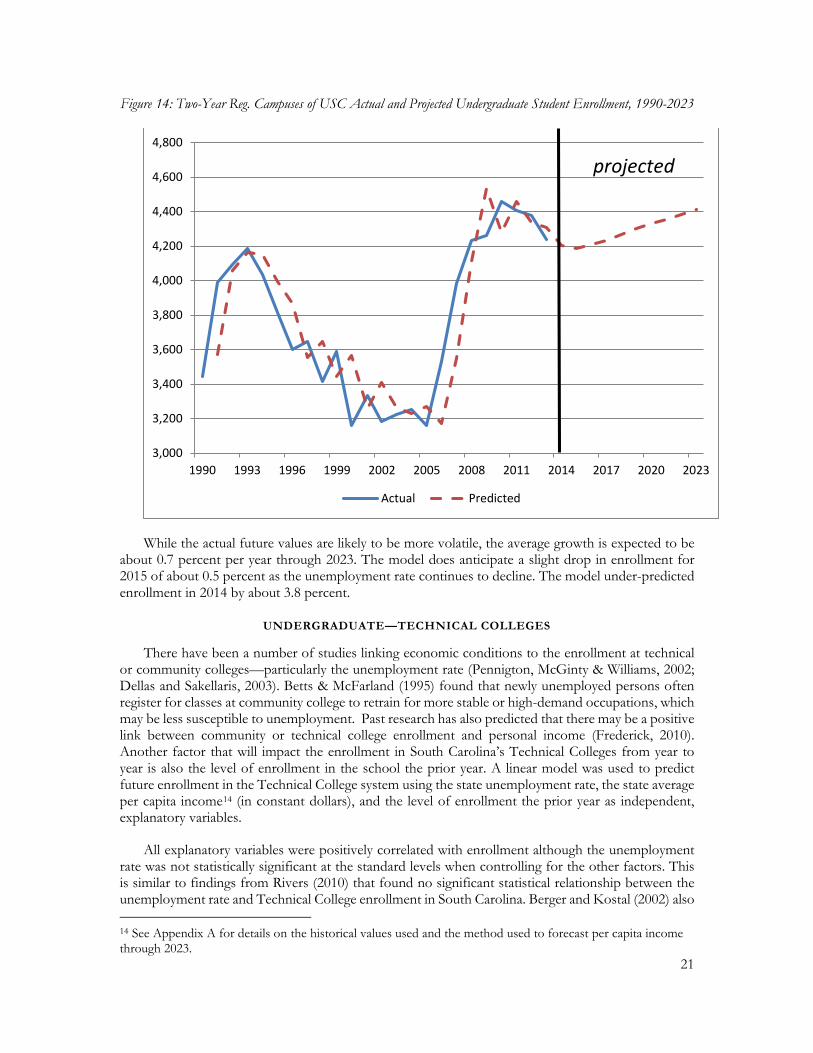
Figure 14: Two-Year Reg. Campuses of USC Actual and Projected Undergraduate Student Enrollment, 1990-2023
While the actual future values are likely to be more volatile, the average growth is expected to be about 0.7 percent per year through 2023. The model does anticipate a slight drop in enrollment for 2015 of about 0.5 percent as the unemployment rate continues to decline. The model under-predicted enrollment in 2014 by about 3.8 percent.
UNDERGRADUATE—TECHNICAL COLLEGES
There have been a number of studies linking economic conditions to the enrollment at technical or community colleges—particularly the unemployment rate (Pennigton, McGinty & Williams, 2002; Dellas and Sakellaris, 2003). Betts & McFarland (1995) found that newly unemployed persons often register for classes at community college to retrain for more stable or high-demand occupations, which may be less susceptible to unemployment. Past research has also predicted that there may be a positive link between community or technical college enrollment and personal income (Frederick, 2010). Another factor that will impact the enrollment in South Carolina’s Technical Colleges from year to year is also the level of enrollment in the school the prior year. A linear model was used to predict future enrollment in the Technical College system using the state unemployment rate, the state average per capita income14 (in constant dollars), and the level of enrollment the prior year as independent, explanatory variables.
All explanatory variables were positively correlated with enrollment although the unemployment rate was not statistically significant at the standard levels when controlling for the other factors. This is similar to findings from Rivers (2010) that found no significant statistical relationship between the unemployment rate and Technical College enrollment in South Carolina. Berger and Kostal (2002) also
14 See Appendix A for details on the historical values used and the method used to forecast per capita income through 2023.
3,000
3,200
3,400
3,600
3,800
4,000
4,200
4,400
4,600
4,800
1990 1993 1996 1999 2002 2005 2008 2011 2014 2017 2020 2023
Actual Predicted
projected
21

failed to find a statistically significant relationship between community college enrollment and the unemployment rate.
All else equal, enrollment in the Technical College system tends to rise as per capita income rises, and the enrollment in the prior year positively impacts enrollment in the present period. The full regression results are shown in Appendix B.
Table 7: Technical College System Actual and Projected Undergraduate Student Enrollment, 1978-2023
Year Actual Enrollment Projected Enrollment 1978 34,582 1979 34,441 1980 35,753 1981 36,742 1982 37,506 1983 34,965 1984 32,863 1985 33,061 1986 34,306 1987 34,962 1988 36,713 1989 42,035 1990 45,509 1991 50,787 1992 53,549 1993 55,293 1994 56,016 1995 55,933 1996 56,362 1997 57,621 1998 60,343 1999 61,665 2000 63,918 2001 66,991 2002 71,895 2003 75,424 2004 75,628 2005 75,725 2006 76,309 2007 79,383 2008 84,270 2009 94,434 2010 97,420 2011 98,318 2012 97,584 2013 95,744 2014 91,726 95,287 2015 94,810 2016 94,822 2017 95,217
22

Year Actual Enrollment Projected Enrollment 2018 96,091 2019 97,342 2020 98,795 2021 100,318 2022 101,984 2023 103,764
Figure 15: Technical College System Actual and Projected Undergraduate Student Enrollment, 1978-2023
While the actual future values are likely to be more volatile, the average growth is expected to be about 1.0 percent per year for the Technical College system through 2023. The model does anticipate a slight drop in enrollment for 2015 of about 0.5 percent as the unemployment rate continues to decline and the impact of the enrollment drop the prior year persists. The model over-predicted 2014 enrollment by about 3.9 percent.
UNDERGRADUATE—PUBLIC COMPREHENSIVE TEACHING INSTITUTIONS
For the public Comprehensive Teaching Institutions (CTI) the single best predictor of next year’s enrollment is this year’s enrollment. There is also some predictive power in the real per capita personal income (PCI) in the state as well as the state unemployment rate. Ordinary Least Squares regression was used to forecast enrollment for the CTIs using the enrollment from the prior year, the state unemployment rate, and the per capita personal income.
0
20,000
40,000
60,000
80,000
100,000
120,000
1978 1983 1988 1993 1998 2003 2008 2013 2018 2023
Actual Predicted
projected
23
Once again, the unemployment rate became an insignificant predictor of enrollment after controlling for prior year enrollment and the state per capita personal income. Both prior year enrollment and per capita income were positively related to enrollment in Comprehensive Teaching Institutions. Full regression results are shown in Appendix B, Table 2.
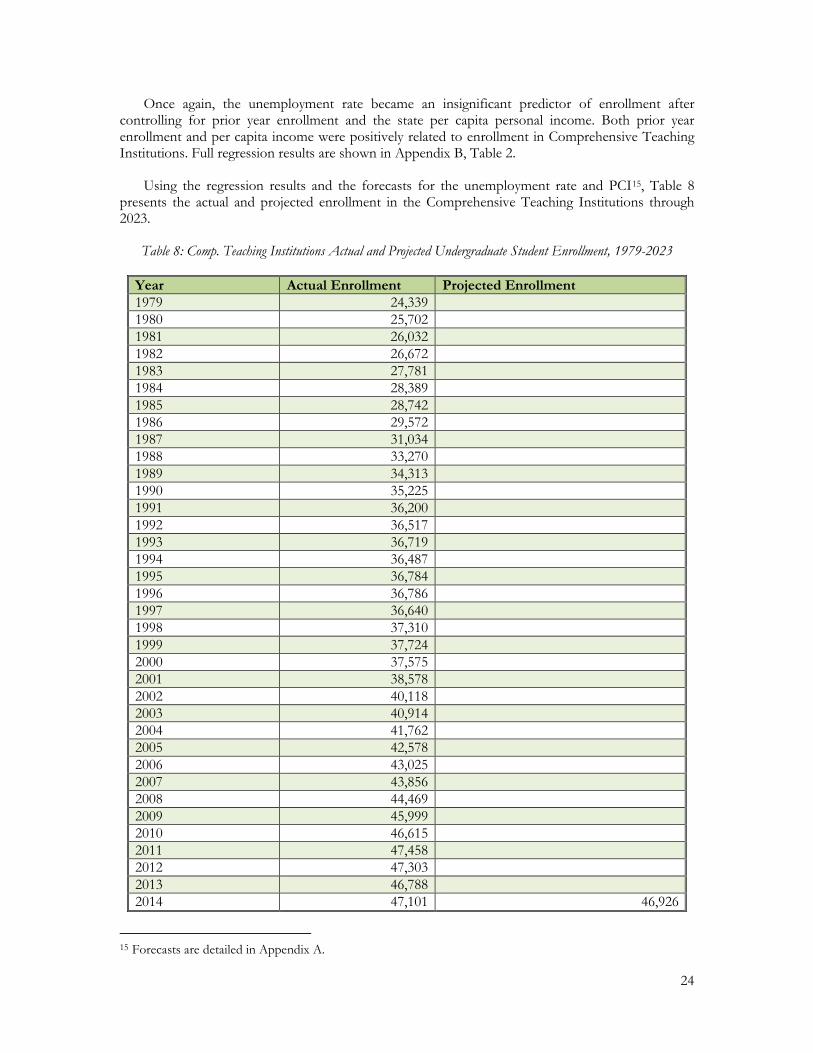
Using the regression results and the forecasts for the unemployment rate and PCI15, Table 8 presents the actual and projected enrollment in the Comprehensive Teaching Institutions through 2023.
Table 8: Comp. Teaching Institutions Actual and Projected Undergraduate Student Enrollment, 1979-2023
Year Actual Enrollment Projected Enrollment 1979 24,339 1980 25,702 1981 26,032 1982 26,672 1983 27,781 1984 28,389 1985 28,742 1986 29,572 1987 31,034 1988 33,270 1989 34,313 1990 35,225 1991 36,200 1992 36,517 1993 36,719 1994 36,487 1995 36,784 1996 36,786 1997 36,640 1998 37,310 1999 37,724 2000 37,575 2001 38,578 2002 40,118 2003 40,914 2004 41,762 2005 42,578 2006 43,025 2007 43,856 2008 44,469 2009 45,999 2010 46,615 2011 47,458 2012 47,303 2013 46,788 2014 47,101 46,926
15 Forecasts are detailed in Appendix A.
24

Year Actual Enrollment Projected Enrollment 2015 47,051 2016 47,235 2017 47,468 2018 47,769 2019 48,126 2020 48,517 2021 48,926 2022 49,361 2023 49,818
25
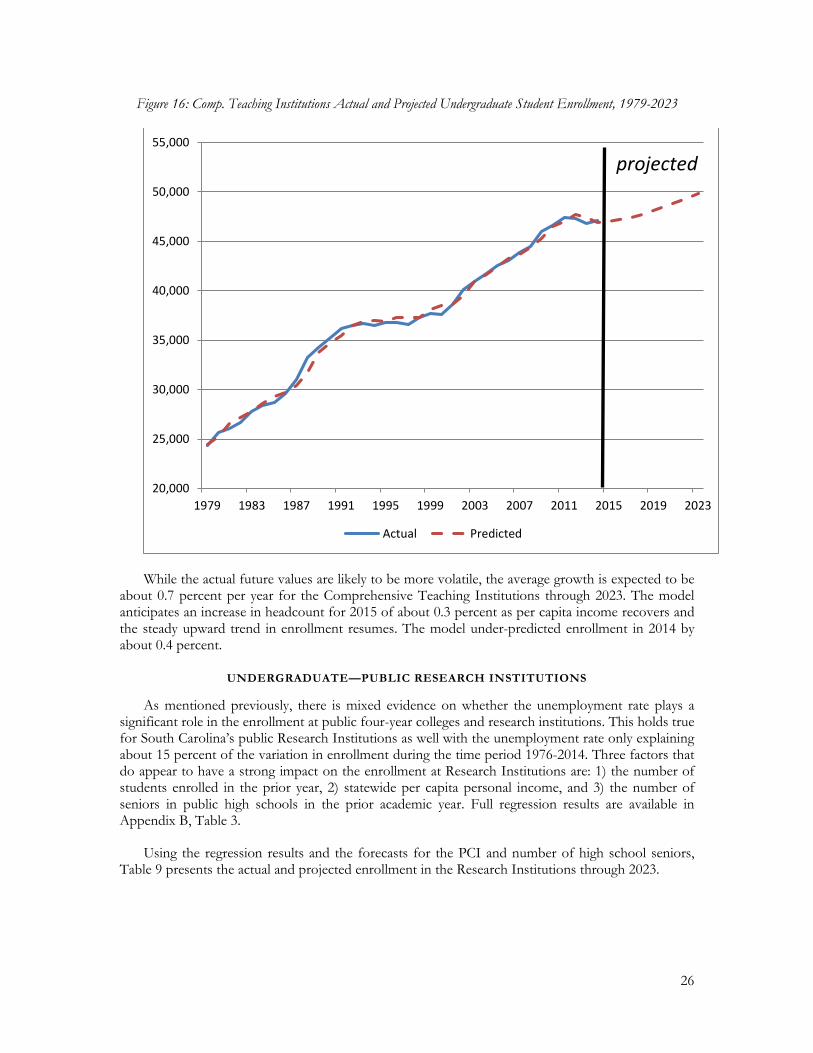
Figure 16: Comp. Teaching Institutions Actual and Projected Undergraduate Student Enrollment, 1979-2023
While the actual future values are likely to be more volatile, the average growth is expected to be about 0.7 percent per year for the Comprehensive Teaching Institutions through 2023. The model anticipates an increase in headcount for 2015 of about 0.3 percent as per capita income recovers and the steady upward trend in enrollment resumes. The model under-predicted enrollment in 2014 by about 0.4 percent.
UNDERGRADUATE—PUBLIC RESEARCH INSTITUTIONS
As mentioned previously, there is mixed evidence on whether the unemployment rate plays a significant role in the enrollment at public four-year colleges and research institutions. This holds true for South Carolina’s public Research Institutions as well with the unemployment rate only explaining about 15 percent of the variation in enrollment during the time period 1976-2014. Three factors that do appear to have a strong impact on the enrollment at Research Institutions are: 1) the number of students enrolled in the prior year, 2) statewide per capita personal income, and 3) the number of seniors in public high schools in the prior academic year. Full regression results are available in Appendix B, Table 3.
Using the regression results and the forecasts for the PCI and number of high school seniors, Table 9 presents the actual and projected enrollment in the Research Institutions through 2023.
20,000
25,000
30,000
35,000
40,000
45,000
50,000
55,000
1979 1983 1987 1991 1995 1999 2003 2007 2011 2015 2019 2023
Actual Predicted
projected
26
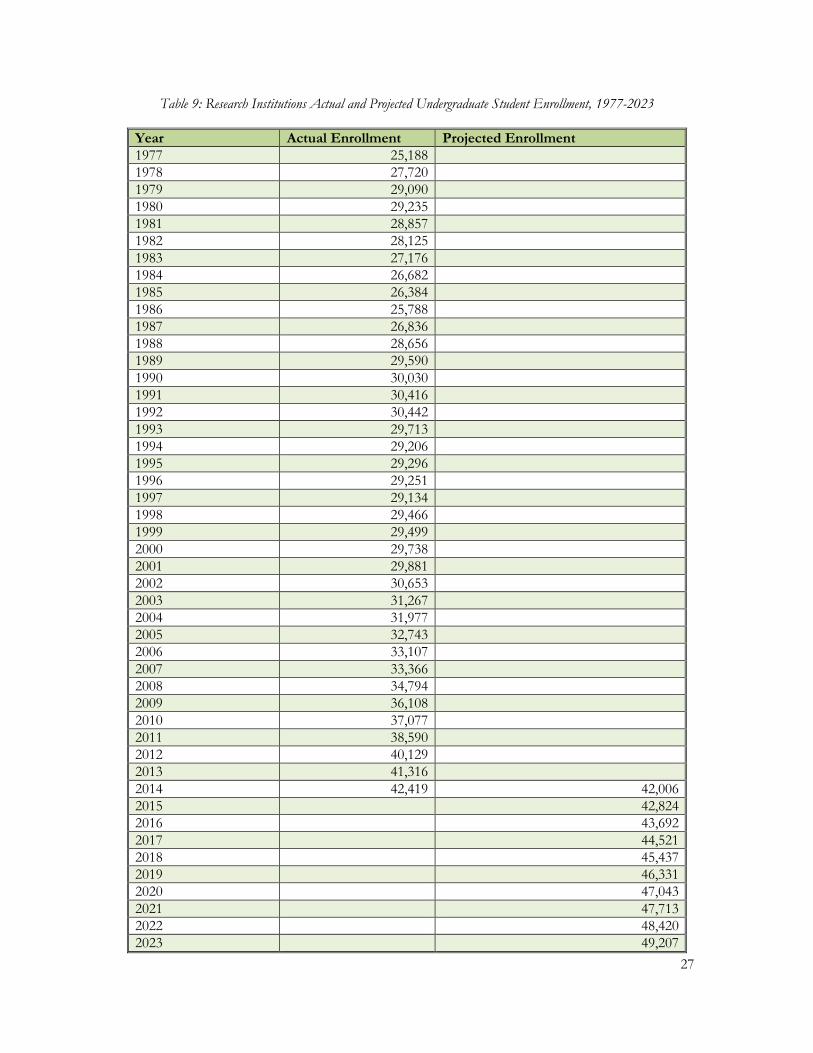
Table 9: Research Institutions Actual and Projected Undergraduate Student Enrollment, 1977-2023
Year Actual Enrollment Projected Enrollment 1977 25,188 1978 27,720 1979 29,090 1980 29,235 1981 28,857 1982 28,125 1983 27,176 1984 26,682 1985 26,384 1986 25,788 1987 26,836 1988 28,656 1989 29,590 1990 30,030 1991 30,416 1992 30,442 1993 29,713 1994 29,206 1995 29,296 1996 29,251 1997 29,134 1998 29,466 1999 29,499 2000 29,738 2001 29,881 2002 30,653 2003 31,267 2004 31,977 2005 32,743 2006 33,107 2007 33,366 2008 34,794 2009 36,108 2010 37,077 2011 38,590 2012 40,129 2013 41,316 2014 42,419 42,006 2015 42,824 2016 43,692 2017 44,521 2018 45,437 2019 46,331 2020 47,043 2021 47,713 2022 48,420 2023 49,207
27

Figure 17: Research Institutions Actual and Projected Undergraduate Student Enrollment, 1977-2023
The model projects that headcount at Research Institutions in South Carolina will continue to experience aggressive growth over the next several years. Between 2015 and 2023, annual growth is expected to average 1.8 percent per year with both personal income and the number of SC high school seniors expected to continue to grow over the medium-term. The model slightly under-predicts enrollment in 2014 by 1 percent.
UNDERGRADUATE STUDENTS—TOTAL ENROLLMENT
Using the information in the four sections above, it is possible to aggregate the enrollment forecasts across all four sectors for a final undergraduate projection. Figure 18 provides that aggregate enrollment information.
20,000
25,000
30,000
35,000
40,000
45,000
50,000
55,000
1977 1982 1987 1992 1997 2002 2007 2012 2017 2022
Actual Predicted
projected
28

Figure 18: Total Undergraduate Student Actual and Projected Enrollment, 1990-2023
Total enrollment for undergraduate students is projected to grow 11.6 percent between 2014 and 2023, or about 1.2 percent per year. It is estimated that enrollment will top 207,000 students by 2024.
GRADUATE STUDENTS—COMPREHENSIVE TEACHING INSTITUTIONS
There has been significantly less research on the forecasting of graduate student enrollment levels. While there has been some work on factors that increase the likelihood of an individual’s probability of enrollment in a graduate program, as a system, there has been less attention. It is likely that the number of graduate students in a given year may be correlated with the number of individuals receiving degrees in the prior year as this is a likely supply of enrollees. There is also evidence that the health of the economy plays a role in the enrollment rates for graduate programs.
The factors that best predict enrollment in graduate programs at the state’s Comprehensive Teaching Institutions are the lagged graduate student enrollment at those institutions and the state unemployment rate. An ordinary least squares regression was used to make projections and the results are shown in Appendix B, Table 4. Both variables were significant at standard levels. As the unemployment rate rises, graduate student enrollment at these institutions tends to decrease.
Using the regression results and the forecasts for the unemployment rate, Table 10 presents the actual and projected enrollment in the Comprehensive Teaching Institutions through 2023.
Table 10: Comprehensive Teaching Institutions Actual and Projected Graduate Student Enrollment, 1976-2023
Year Actual Enrollment Projected Enrollment 1976 3,182 1977 3,159 1978 3,282 1979 3,205
100,000
120,000
140,000
160,000
180,000
200,000
220,000
1990 1993 1996 1999 2002 2005 2008 2011 2014 2017 2020 2023
Actual Predicted
projected
29

Year Actual Enrollment Projected Enrollment 1980 3,314 1981 2,704 1982 2,601 1983 2,676 1984 2,737 1985 2,925 1986 3,285 1987 3,554 1988 3,492 1989 3,431 1990 4,364 1991 4,658 1992 5,153 1993 7,441 1994 6,678 1995 7,256 1996 7,302 1997 6,677 1998 7,762 1999 7,725 2000 7,329 2001 7,359 2002 8,088 2003 7,727 2004 6,603 2005 6,496 2006 6,355 2007 5,863 2008 5,948 2009 5,402 2010 4,977 2011 4,804 2012 4,973 2013 4,903 2014 4,832 4,987 2015 4,981 2016 5,125 2017 5,264 2018 5,384 2019 5,486 2020 5,579 2021 5,671 2022 5,756 2023 5,833
30

Figure 19: Comprehensive Teaching Institutions Actual and Projected Graduate Student Enrollment, 1990-2023
The model projects that graduate student headcount at Comprehensive Teaching Institutions in South Carolina will continue to experience moderate growth over the next several years. Between 2015 and 2023, annual growth is expected to average 2.0 percent per year with the unemployment rate continuing to decline over the medium-term. The model over-projected enrollment in 2014 by about 3.2 percent.
GRADUATE STUDENTS—RESEARCH INSTITUTIONS
The best predictor of enrollment at Research Institution graduate programs is the level of enrollment in the prior year. A time-series model16 was used to forecast graduate student enrollment.
Using the regression results, Table 11 presents the actual and projected enrollment in the Comprehensive Teaching Institutions through 2023.
Table 11: Research Institutions Actual and Projected Enrollment, 1976-2023
Year Actual Enrollment Projected Enrollment 1976 11,589 1977 10,860 1978 10,938 1979 11,071
16 ARIMA(1,1,0)
0
1,000
2,000
3,000
4,000
5,000
6,000
7,000
8,000
9,000
1990 1993 1996 1999 2002 2005 2008 2011 2014 2017 2020 2023
Actual Projected
projected
31

Year Actual Enrollment Projected Enrollment 1980 10,812 1981 11,158 1982 10,902 1983 11,833 1984 11,967 1985 12,160 1986 12,707 1987 13,410 1988 15,072 1989 14,846 1990 14,517 1991 15,717 1992 16,492 1993 15,581 1994 16,094 1995 15,624 1996 15,060 1997 15,035 1998 14,822 1999 13,296 2000 13,801 2001 12,517 2002 13,623 2003 13,340 2004 13,162 2005 13,986 2006 14,090 2007 14,028 2008 13,539 2009 13,998 2010 14,531 2011 14,723 2012 14,658 2013 14,726 2014 15,307 14,830 2015 14,929 2016 15,028 2017 15,127 2018 15,226 2019 15,325 2020 15,425 2021 15,524 2022 15,623 2023 15,722
32

Figure 20: Research Institutions Actual and Projected Graduate Student Enrollment, 1976-2023
The model projects that graduate student headcount at Research Institutions in South Carolina will continue to experience slow growth over the next several years. Between 2015 and 2023, annual growth is expected to average 0.3 percent per year. The model under-projects 2014 enrollment by about 3.1 percent.
GRADUATE STUDENTS—TOTAL ENROLLMENT
Combining the projections for the Research Institutions and the Comprehensive Teaching Institutions, we can get the final, total projection of the number of graduate students likely to be enrolled over the next several years.
10,000
11,000
12,000
13,000
14,000
15,000
16,000
17,000
1976 1981 1986 1991 1996 2001 2006 2011 2016 2021
Actual Predicted
projected
33

Figure 21: Total Graduate Student Actual and Projected Enrollment, 1990-2023
The total number of graduate students expected to be enrolled by 2023 is approximately 21,500. This corresponds to about 7.0 percent growth between 2014 and 2023 or about 0.8 percent per year.
SECTION 5: CONCLUSION
Over the next nine years, it is anticipated that undergraduate student headcount will continue to increase by about 11.6 percent overall in the public colleges and universities. There are significant differences in the projected growth by sector with the Research Institutions predicted to grow the most at 16.0 percent followed by the Technical College System (+13.1 percent), the Comprehensive Teaching Institutions (+5.8 percent), and finally a small amount of growth (+0.9 percent) for the Two-Year Regional Campuses of USC.
Economic factors tending to increase enrollment include growth in per capita personal income and a growth in the number of potential students coming out of the state’s public school system.
While enrollment in the institution the prior year is the most highly correlated statistic with current enrollment, there appears to be a strengthening relationship over the past 20 years between enrollment and the unemployment rate in all of the undergraduate higher education sectors. Economic cycles will likely continue to have a large impact on enrollment going forward as students balance the rising cost of higher education against the job opportunities and other personal and financial benefits from increased education.
Changes in technology and the delivery of service are also likely to have a major impact over the next decade although the most significant change will likely be the composition of students and not necessarily the total number of students being served.
In the “out” years it is important to take note of the significant dip in the birth rate that occurred during the most recent recession. This will tend to have a negative impact on higher education enrollment unless there are corresponding increases in graduation rates or the types of students enrolling in higher education. Also the changing racial/ethnic composition of high school graduates is
15,000
16,000
17,000
18,000
19,000
20,000
21,000
22,000
23,000
24,000
1990 1993 1996 1999 2002 2005 2008 2011 2014 2017 2020 2023
Actual Projected
projected
34

likely to limit enrollment growth unless additional minority students are attracted to college programs at higher rates than have been experienced historically.
For graduate student enrollment, the projected increase by 2023 is about 7.0 percent. This disguises the dramatic differences between the Research and Comprehensive Teaching Institutions. While the headcount in Research Institution graduate programs is forecasted to grow only 2.7 percent by 2023, enrollment at the Comprehensive Teaching Institutions is expected to increase by nearly 21 percent. These dynamics will shift the distribution of graduate students to about 73 percent in Research and 27 percent in Comprehensive Teaching Institutions.
Unlike undergraduate enrollment, headcount in graduate programs does not tend to increase during economic downturns. Instead, it appears that graduate students, particularly in the Comprehensive Teaching Institutions, tend to put their additional education on hold during times of higher unemployment. This could be an important factor for administrators to consider when balancing the anticipated increase in demand of undergraduate programs during a recession with a decrease in the demand for graduate programs.
Finally, it is important to track whether there are significant changes in the high school graduation rates and the percent of students who pursue higher education after the typical age range of 18-29. Since the birth rate declined precipitously during the most recent recession, increases in the percentage of traditional high school graduates enrolling in higher education and increases in the numbers of non-traditional students will need to make up for potential shortfalls from the lower birth rates. It is also useful for each institution to closely examine their own enrollment trends to determine how future economic and demographic shifts may impact the demand on their resources.
35

REFERENCES
Berger, Mark C. and Thomas Kostal. (2002) “Financial Resources, Regulation, and Enrollment in US Public Higher Education. Economics of Education Review, 21, 101-110.
Betts, Julian R. and Laurel L. McFarland. (1995) “Safe Port in a Storm: The Impact of Labor Market Conditions on Community College Enrollments.” Journal of Human Resources. Vol. 30. 741-765.
Chen, Chau-Kuang. (2008) “An Integrated Enrollment Forecast Model.” IR Applications. Vol. 15.
Clagett, Craig. (1989) “Credit Headcount Forecast for Fall 1989-90: Component Yield Method Projections.” Planning Brief PB90-3.
Craft, Kim R., Joe G. Baker, Brent E. Myers, and Abe Harraf. (2012) “Tuition Revenues and Enrollment Demand: The Case of Southern Utah University.” Association for Institutional Research Vol. 124.
DeLeeuw, Jamie. (2012) “Unemployment Rate and Tuition as Enrollment Predictors.” Monroe County Community College.
Dellas, Harris and Plutarchos Sakellaris. (2003). “On the Cyclicality of Schooling: Theory and Evidence.” Oxford Economic Papers 55, 148-172.
Frederick, Allison. (2010) “Predicting Community College Tuition and Enrollments and Simulating the Initial Effects of President Obama’s American Graduation Initiative.” Undergraduate Economic Review. Vol. 7(1).
Hamilton, Brady E., Martin, Joyce A., Osterman, Michelle J.K., and Curtin, Sally C. (2015) “Births: Preliminary Data for 2014.” National Vital Statistics Report, 64(6).
Helmelt, Steven W. and Dave E. Marcotte. (2011) “The Impact of Tuition Increases on Enrollment at Public Colleges and Universities.” Educational Evaluation and Policy Analysis, 33(4), 435-457.
Hussar, W. J. and T.M. Bailey. (2013) “Projections of Education Statistics to 2022.” National Center for Education Statistics. Washington, DC: U.S. Government Printing Office. Kane, T.J. (1995) “Rising Public College Tuition and College Entry: How Well do Public Subsidies Promote Access to College.” Working Paper No. 5164.
Lehr, Dona K. and Jan M. Newton. (1978). “Time Series and Cross-Sectional Investigations of the Demand for Higher Education. Economic Inquiry, 16, 411-422.
Lins, L. J. (1960) “Methodology of Enrollment Projections for Colleges and Universities.” American Association of Collegiate Registrars and Admissions Officers.
36
Pennington, Kevin. L., Dixie McGinty and Mitchell R. Williams (2002). “Community College Enrollment as a Function of Economic Indicators. Community College Journal of Research and Practice, 26, 431-437.
Prescott, Brian T. and Peace Bransberger. Knocking at the College Door: Projections of High School Graduates (2012). Boulder, CO: Western Interstate Commission on Higher Education.
Rivers, Hope E. (2010) “An Analysis of Economic Variables Affecting Enrollments in the South Carolina Technical College System and Virginia Community College System.” Dissertation University of South Carolina.
Stanley, Rodney E. and Edward P. French. (2009) “Evaluating Increased Enrollment Levels in Institutions of Higher Education: A Look at Merit-Based Scholarship Programs.” Public Administration Quarterly, 33(1), 4-36.
Wing, Paul. (1974) Higher Education Enrollment Forecasting: A Manual for State-Level Agencies. Boulder, CO: Western Interstate Commission on Higher Education.
37

APPENDIX A: PUBLIC AND IND EPEND ENT ENROLLMENT
Tables A.1 and A.2 are the Fall 2014 headcount enrollment, by institution, by sector, and by level for South Carolina’s public and independent colleges and universities studied in this report.
Table A.1: Headcount Enrollment by Sector and Level Public, Fall 2014
Institution Undergraduate Students Graduate Students PUBLIC INSTITUTIONS
Research Institutions Clemson 17,260 4,597 USC Columbia 24,866 8,105 MUSC 293 2,605
Comprehensive Teaching Institutions The Citadel 2,763 829 Coastal Carolina 9,364 612 College of Charleston 10,440 1,016 Francis Marion 3,605 339 Lander 2,717 70 SC State 2,791 540 USC Aiken 3,256 188 USC Beaufort 1,794 USC Upstate 5,397 188 Winthrop 4,974 1,050
Two-Year Regional Campuses of USC USC Lancaster 1,738 USC Salkehatchie 1,076 USC Sumter 879 USC Union 679
Technical Colleges Aiken 2,351 Central Carolina 3,963 Denmark 1,678 Florence-Darlington 6,215 Greenville 12,592 Horry-Georgetown 7,335 Midlands 11,424 Northeastern 1,090 Orangeburg-Calhoun 3,060 Piedmont 5,694 Spartanburg CC 5,495 TC of the Lowcountry 2,529 Tri-County 6,386 Trident 16,136 Williamsburg 717 York 5,061 Public Total 185,618 20,139
38
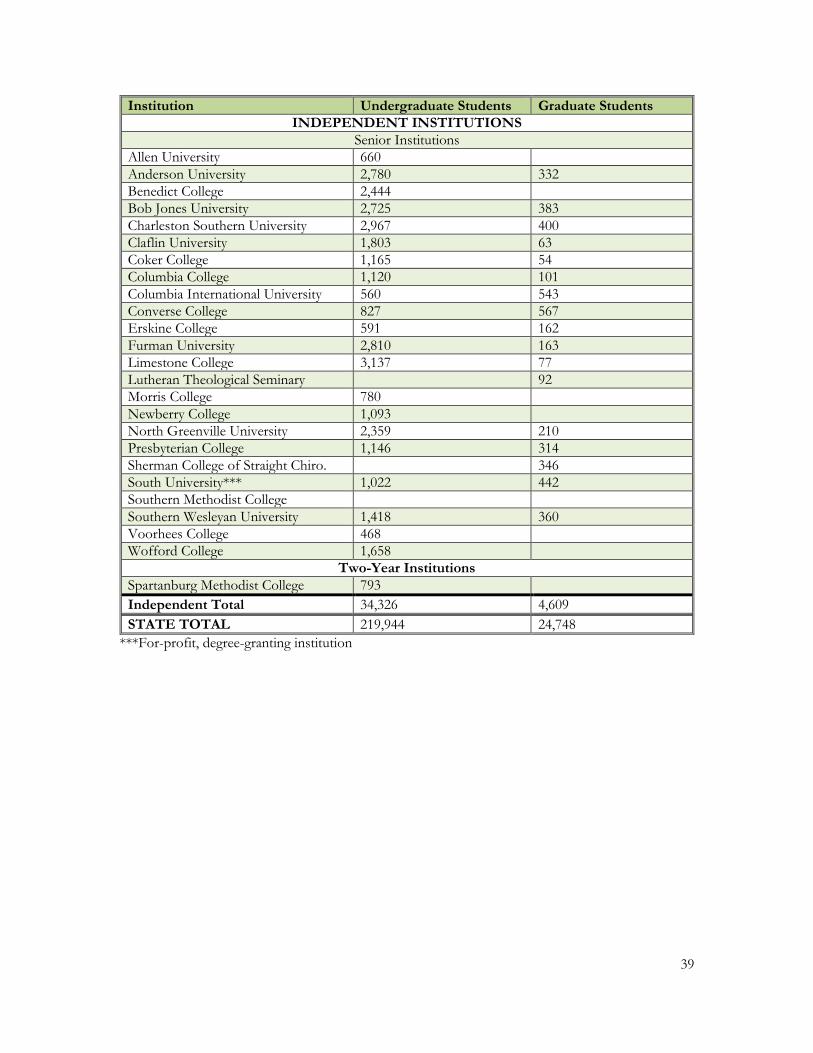
Institution Undergraduate Students Graduate Students INDEPENDENT INSTITUTIONS
Senior Institutions Allen University 660 Anderson University 2,780 332 Benedict College 2,444 Bob Jones University 2,725 383 Charleston Southern University 2,967 400 Claflin University 1,803 63 Coker College 1,165 54 Columbia College 1,120 101 Columbia International University 560 543 Converse College 827 567 Erskine College 591 162 Furman University 2,810 163 Limestone College 3,137 77 Lutheran Theological Seminary 92 Morris College 780 Newberry College 1,093 North Greenville University 2,359 210 Presbyterian College 1,146 314 Sherman College of Straight Chiro. 346 South University*** 1,022 442 Southern Methodist College Southern Wesleyan University 1,418 360 Voorhees College 468 Wofford College 1,658
Two-Year Institutions Spartanburg Methodist College 793 Independent Total 34,326 4,609 STATE TOTAL 219,944 24,748
***For-profit, degree-granting institution
39

APPENDIX B: REGRESSION RESULTS
Table B.1: OLS Regression Results for Technical Colleges Undergraduate
Variable Coefficient (Standard Error)
Constant -22,519.08* (12499.84)
Lagged Headcount 0.782*** (0.107)
Unemployment Rate 78,281.44 (61,653.39)
Per Capita Income 1.026 ** (0.481)
R2 0.9911 Adjusted R2 0.9902 n 35 ***p<0.01, **p<0.05, *p<0.10 Jack knife standard errors used to reduce bias.
Table B.2: OLS Regression Results for Comprehensive Teaching Institutions Undergraduate
Variable Coefficient (Standard Error)
Constant -412.308 (1,026.822)
Lagged Headcount 0.841*** (0.059)
Unemployment Rate 10,884.74 (6,916.795)
Per Capita Income 0.198** (0.085)
R2 0.9944 Adjusted R2 0.9938 n 35 ***p<0.01, **p<0.05, *p<0.10 Jack knife standard errors used to correct for bias.
40
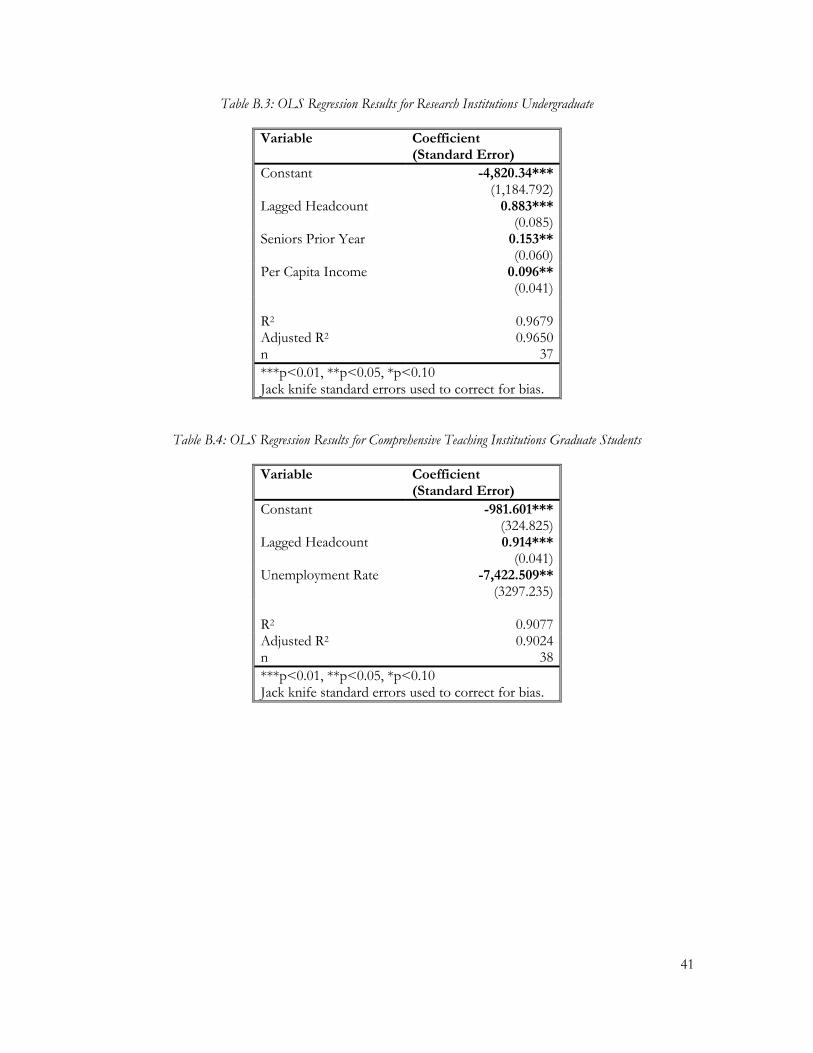
Table B.3: OLS Regression Results for Research Institutions Undergraduate
Variable Coefficient (Standard Error)
Constant -4,820.34*** (1,184.792)
Lagged Headcount 0.883*** (0.085)
Seniors Prior Year 0.153** (0.060)
Per Capita Income 0.096** (0.041)
R2 0.9679 Adjusted R2 0.9650 n 37 ***p<0.01, **p<0.05, *p<0.10 Jack knife standard errors used to correct for bias.
Table B.4: OLS Regression Results for Comprehensive Teaching Institutions Graduate Students
Variable Coefficient (Standard Error)
Constant -981.601*** (324.825)
Lagged Headcount 0.914*** (0.041)
Unemployment Rate -7,422.509** (3297.235)
R2 0.9077 Adjusted R2 0.9024 n 38 ***p<0.01, **p<0.05, *p<0.10 Jack knife standard errors used to correct for bias.
41

APPENDIX C: METHOD OLOGY COHORT SURVIVAL AND ECONOMIC PROJECTIONS
SURVIVAL RATES
NCES enrollment by grade level for 2011/12 and 2012/13 was used to calculate the cohort survival ratios (CSR) necessary to calculate the projected number of high school seniors presented in Table 2. The number of students in the 3rd grade in 2011/12 can be expected to move to the 4th grade in 2012/13. Each grade CSR was calculated using the headcount data found in Table C.1.
Table C.1: Cohort Survival Ratios based on Enrollments 3rd-12th Grades17
Grade 2011/12 2012/13 Cohort Survival Ratio
3 53,730 53,354 4 54,157 54,058 1.0061 5 55,713 54,541 1.0071 6 56,312 56,493 1.0140 7 55,250 56,807 1.0088 8 54,243 55,365 1.0021 9 60,710 61,897 1.1411 10 54,075 54,033 0.8900 11 48,328 47,963 0.8870 12 44,684 44,755 0.9261
In general, these rates have been fairly consistent since 2006/07 with some minor increases in the survival ratio between 9th / 10th, 10th / 11th, and 11th / 12th grades. These data only reflect enrollment in the state’s public schools although it is apparent that many students that were enrolled in private schools during their elementary and middle school years move into the public system when they reach the 9th grade (i.e., CSR between 8th and 9th grades is significantly greater than 1). Another implicit assumption made in the models is that the trends in numbers of students in private schools and transferring between public and private schools remains consistent throughout the forecast period.
FORECASTED REAL PERSONAL INCOME PER CAPITA
Data from 1976 through 2014 was obtained from the Bureau of Economic Analysis regional account for per capita personal income in South Carolina. Using the Bureau of Labor Statistics’ Consumer Price Index, All Urban Consumers, US City Average, All Items, Non-Seasonally Adjusted, Annual data, these measures were transformed into “constant” 2014 dollars. To project future values of per capita personal income, the Holt-Winters non-seasonal exponential smoothing technique was used to forecast out nine periods (2015-2023). The actual and forecasted values for real personal income per capita are shown in Table C.2.
17 National Center for Education Statistics: Enrollment in public elementary or secondary schools by level, grade, and state or jurisdiction
42

Table C.2: Real Personal Income per Capita, 1976-202318
Year Per Capita Personal Income (constant 2014 $s)
Forecasted Per Capita Personal Income (constant 2014 $s)
1976 22,663 21,706 1977 22,881 23,127 1978 23,616 23,345 1979 23,412 24,079 1980 22,745 23,876 1981 22,876 23,209 1982 22,708 23,339 1983 23,718 23,172 1984 25,037 24,181 1985 25,656 25,500 1986 26,592 26,120 1987 27,196 27,056 1988 28,120 27,659 1989 28,816 28,583 1990 28,982 29,280 1991 28,444 29,445 1992 29,020 28,908 1993 29,269 29,483 1994 29,931 29,732 1995 30,453 30,394 1996 31,053 30,916 1997 31,772 31,517 1998 33,094 32,236 1999 33,664 33,558 2000 34,535 34,127 2001 34,536 34,998 2002 34,535 35,000 2003 34,580 34,999 2004 35,163 35,044 2005 35,585 35,626 2006 36,535 36,049 2007 36,946 36,998 2008 36,459 37,410 2009 35,772 36,923 2010 35,455 36,236 2011 35,867 35,919 2012 36,440 36,301 2013 36,400 36,904 2014 36,934 36,864 2015 37,398
18 1976-2014 data from BEA with adjustments from BLS CPI. 43

Year Per Capita Personal Income (constant 2014 $s)
Forecasted Per Capita Personal Income (constant 2014 $s)
2016 37,861 2017 38,325 2018 38,788 2019 39,252 2020 39,715 2021 40,179 2022 40,642 2023 41,106
UNEMPLOYMENT RATES
The forecasts for the US unemployment rate came from the Congressional Budget Office’s Economic projections 2015-2025, Table F-2. The SC unemployment rate forecasts were estimated from those rates based on the historic relationship between the national and state rates. The unemployment rates for the counties served by the 2-year regional campuses have traditionally been about 25 percent higher than the statewide average. The actual unemployment rate projections used for model estimation are shown in Table C.3.
Table C.3: Projected Unemployment Rates Nationally and Statewide, 2015-2023
Year US Unemployment Rate SC Unemployment Rate Area Unemployment Rate
2014 6.2% (actual) 6.4% (actual) 8.0% 2015 5.5% 5.6% 7.0% 2016 5.4% 5.5% 6.9% 2017 5.3% 5.4% 6.8% 2018 5.4% 5.5% 6.9% 2019 5.5% 5.6% 7.0% 2020 5.5% 5.6% 7.0% 2021 5.4% 5.5% 6.9% 2022 5.4% 5.5% 6.9% 2023 5.4% 5.5% 6.9%
44