Embed Size (px)
Citation preview
Staff Findings and Recommendations
Higher Education Certificate Programs
December 19, 2014
Legislative Program Review and Investigations Committee
Connecticut General Assembly
2013-2014 Committee Members Senate
John A. Kissel, Co-Chair
John W. Fonfara Steve Cassano
Eric D. Coleman Anthony Guglielmo
Joe Markley
House Mary M. Mushinsky, Co-Chair
Christie M. Carpino Brian Becker
Marilyn Giuliano Brenda L. Kupchick
Diana S. Urban
(860) 240-0300
Committee Staff on Project Maryellen Duffy, Principal Analyst Scott Simoneau, Principal Analyst
Legislative Program Review and Investigations Committee Connecticut General Assembly
State Capitol Room 506 Hartford, CT 06106
www.cga.ct.gov/pri/index.asp [email protected]
PRI Study Highlights December 2014
Higher Education Certificate Programs
Background In May 2014, the Legislative Program Review and Investigations Committee (PRI) voted to examine the effectiveness of workforce development sub-baccalaureate certificate programs to determine if the type of certificate holders Connecticut is producing is aligned with employer demand. The study is to develop a detailed description of certificates awarded by the Board of Regents for Higher Education (BOR), (which for this project is effectively the 12 public community colleges and Charter Oak State College), and 57 private occupational schools, which tend to be for-profit.
A prominent workforce study has indicated that in Connecticut 65 percent of all jobs will require some type of postsecondary education beyond high school by 2018. The most recent figures indicate that Connecticut’s postsecondary education attainment level is about 56 percent. This suggests a fairly significant gap.
The data in this report show that private occupational schools offered 308 certificate programs and accounted for about three-quarters (18,668) of the approximately 25,000 certificate program enrollments and 19,000 (13,651) awards in academic year 2013. (The actual totals would be higher because 20 percent of private occupational schools did not report complete data).
Over the same time period, community college noncredit programs enrolled 4,240 students (16 percent) and awarded 3,208 certificates (17 percent) from 141 programs, while community college for-credit programs had 1,819 enrollments (7 percent) and 2,035 awards (11 percent) granted in 101 programs.
This report contains staff findings and 11 recommendations.
Main Staff Findings Transparency and accountability needs to be improved for all certificate programs. Potential and current students cannot easily compare certificate program costs and outcomes across schools and colleges. BOR needs to correct fundamental problems in managing certificate programs. BOR’s process for collecting and reporting certain data about for-credit and noncredit certificates is unreliable and not comprehensive. BOR does not have a definition of certificates or a comprehensive, coordinated marketing plan for certificate programs Similarly named noncredit certificate programs as well as the noncredit program approval processes vary considerably by community college. Differences among similar programs included course hours, tuition costs, and the type of qualifications earned. Not all community colleges use the same criteria for approving new certificates. OHE needs to improve oversight practices and capabilities. OHE does not audit certain private occupational school student data and relies on unpaid evaluators to review occupational school certificate curriculums.
PRI Staff Recommendations OHE shall maintain a website that provides for comparative information among certificate programs. Certain certificate program information shall also be available on each school’s website. The goal of this recommendation is to allow potential and current students to be able to compare and select the certificate program that best meets their needs
BOR’s management processes should be improved. BOR should: improve its tracking of student information; develop a written definition of educational certificates; and create a system-wide marketing plan.
BOR should adopt a uniform naming convention for noncredit programs offered by the community colleges. The community colleges need to reduce the confusion that can ensue because certificates with the same name differ in many aspects.
Certain BOR practices should be standardized. The approval process for new noncredit programs should be consistent but maintain approval at each community college level. All 12 community colleges should consider incorporating the cost of taking a national certification exam into the cost of tuition and fees as some do now.
OHE should audit data submitted by independent colleges and universities, and develop a cost estimate to fund curriculum evaluators. Ensuring the accuracy of data and appropriate curriculums are important oversight functions.
Legislative Program Review and Investigations Committee Staff Office State Capitol * 210 Capitol Avenue * Room 506 * Hartford, CT 06106-1591
P: (860) 240-0300 * F: (860) 240-0327 * E-mail: [email protected]
i
Acronyms
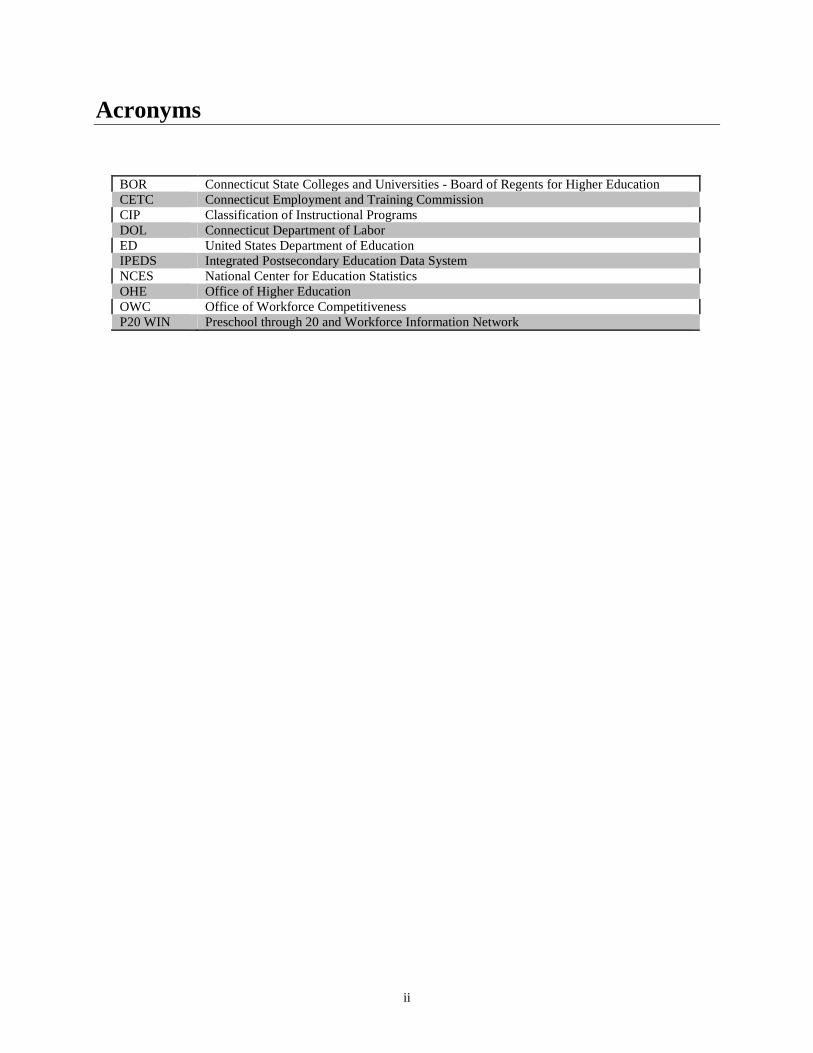
BOR Connecticut State Colleges and Universities - Board of Regents for Higher Education CETC Connecticut Employment and Training Commission CIP Classification of Instructional Programs DOL Connecticut Department of Labor ED United States Department of Education IPEDS Integrated Postsecondary Education Data System NCES National Center for Education Statistics OHE Office of Higher Education OWC Office of Workforce Competitiveness P20 WIN Preschool through 20 and Workforce Information Network
ii

Proposed PRI Staff Recommendations 1. The Office of Higher Education shall develop and maintain a cost and
outcome reporting system to provide information about all certificates awarded by public, private, and nonprofit institutions. Each entity shall provide the required data annually, to the office in a uniform format developed by the office. The office shall publish the data provided on its website that allows for basic comparisons to be made among similar types of certificate programs, as well as more detailed program information in a format determined by the office. The detailed profile shall include the following:
a. tuition and fees for a student completing within the normal amount of time based on program length and full- or part-time attendance;
b. typical costs for books and supplies (unless a part of tuition and fees) and the cost of room and board, if applicable;
c. median loan debt incurred by students who completed a for-credit certificate program (separately by Title IV loans and other education debt, including private and institutional loans) and for students completing a noncredit program, if available;
d. enrollments and awards by year;
e. basic demographic information (gender, age, and race/ethnicity);
f. graduation rates for student cohorts completing the program;
g. average time to complete program;
h. job placement rates for students completing the program;
i. entry level starting salary, based on Connecticut DOL statistics;
j. average salary, based on Connecticut DOL statistics;
k. annual/cohort national certification pass rate, (if applicable); and
l. state licensure pass rate, (if applicable).
Each college or private occupational school that offers a certificate program shall publish this information on its website as prominently as the certificate program description.
2. Each college or private occupational school shall develop a one-page fact sheet for each certificate program offered that provides basic information to the
Program Review and Investigations Committee Staff Findings and Recommendations: December 19, 2014
1
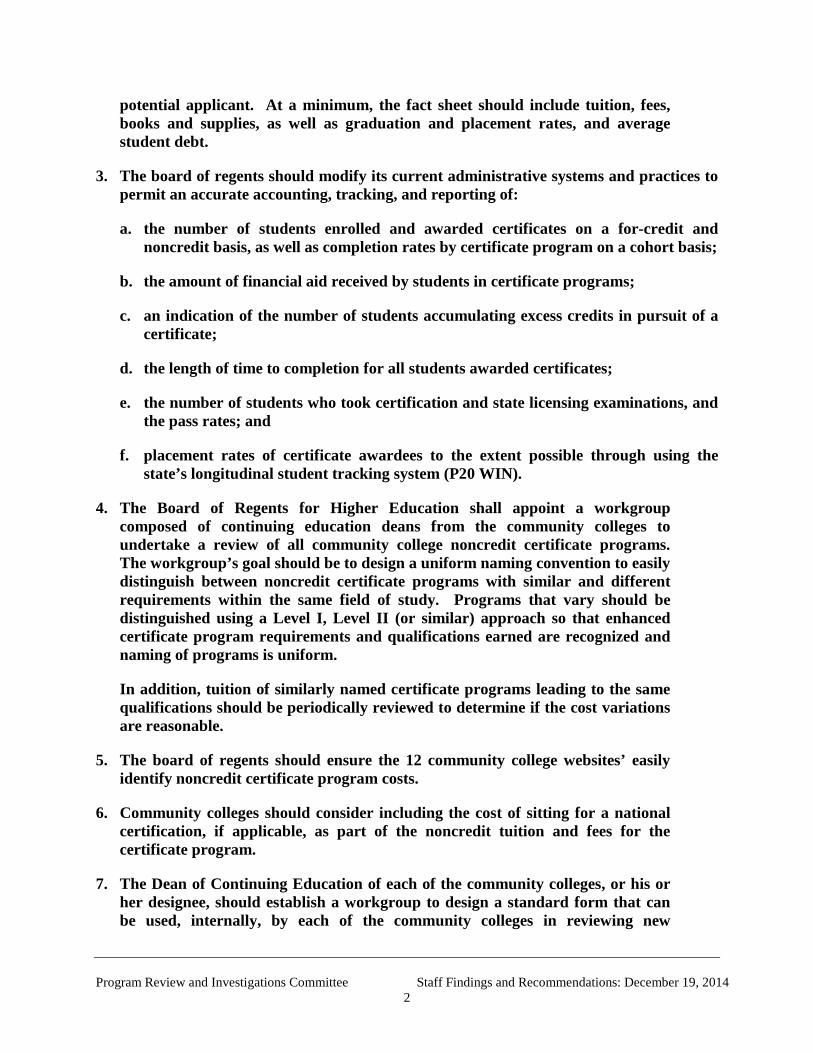
potential applicant. At a minimum, the fact sheet should include tuition, fees, books and supplies, as well as graduation and placement rates, and average student debt.
3. The board of regents should modify its current administrative systems and practices to permit an accurate accounting, tracking, and reporting of:
a. the number of students enrolled and awarded certificates on a for-credit and noncredit basis, as well as completion rates by certificate program on a cohort basis;
b. the amount of financial aid received by students in certificate programs;
c. an indication of the number of students accumulating excess credits in pursuit of a certificate;
d. the length of time to completion for all students awarded certificates;
e. the number of students who took certification and state licensing examinations, and the pass rates; and
f. placement rates of certificate awardees to the extent possible through using the state’s longitudinal student tracking system (P20 WIN).
4. The Board of Regents for Higher Education shall appoint a workgroup composed of continuing education deans from the community colleges to undertake a review of all community college noncredit certificate programs. The workgroup’s goal should be to design a uniform naming convention to easily distinguish between noncredit certificate programs with similar and different requirements within the same field of study. Programs that vary should be distinguished using a Level I, Level II (or similar) approach so that enhanced certificate program requirements and qualifications earned are recognized and naming of programs is uniform.
In addition, tuition of similarly named certificate programs leading to the same qualifications should be periodically reviewed to determine if the cost variations are reasonable.
5. The board of regents should ensure the 12 community college websites’ easily identify noncredit certificate program costs.
6. Community colleges should consider including the cost of sitting for a national certification, if applicable, as part of the noncredit tuition and fees for the certificate program.
7. The Dean of Continuing Education of each of the community colleges, or his or her designee, should establish a workgroup to design a standard form that can be used, internally, by each of the community colleges in reviewing new
Program Review and Investigations Committee Staff Findings and Recommendations: December 19, 2014
2
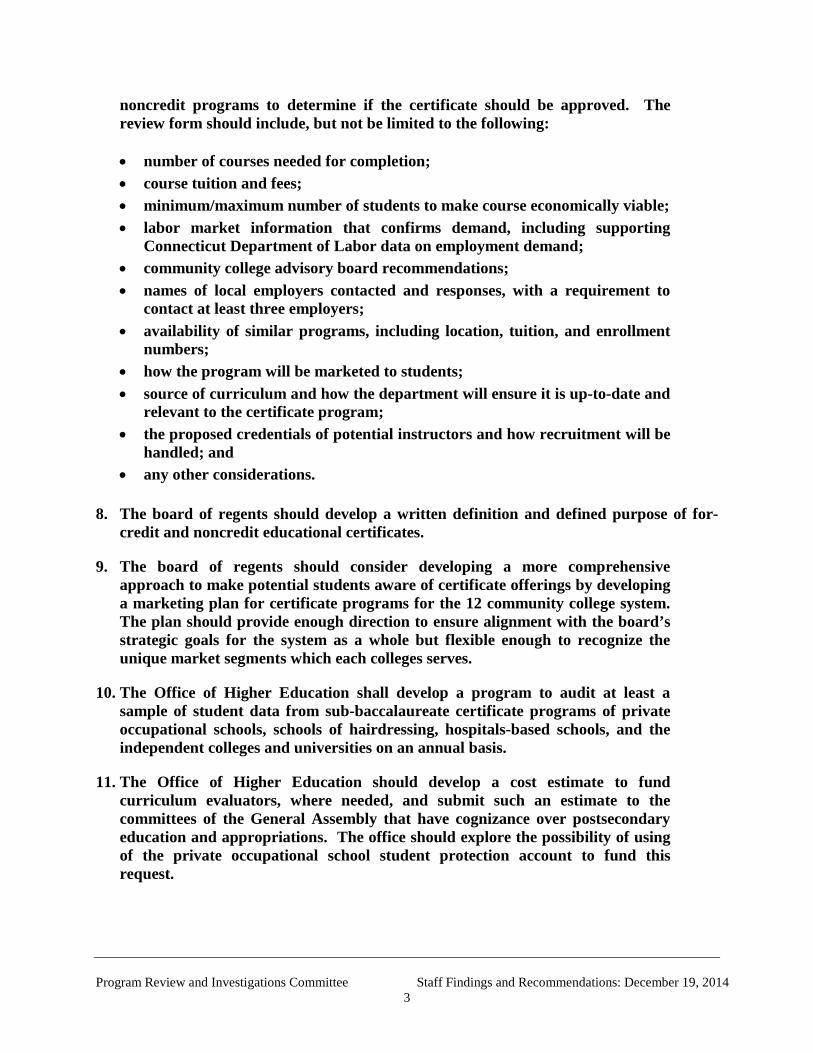
noncredit programs to determine if the certificate should be approved. The review form should include, but not be limited to the following: • number of courses needed for completion; • course tuition and fees; • minimum/maximum number of students to make course economically viable; • labor market information that confirms demand, including supporting
Connecticut Department of Labor data on employment demand; • community college advisory board recommendations; • names of local employers contacted and responses, with a requirement to
contact at least three employers; • availability of similar programs, including location, tuition, and enrollment
numbers; • how the program will be marketed to students; • source of curriculum and how the department will ensure it is up-to-date and
relevant to the certificate program; • the proposed credentials of potential instructors and how recruitment will be
handled; and • any other considerations.
8. The board of regents should develop a written definition and defined purpose of for-
credit and noncredit educational certificates.
9. The board of regents should consider developing a more comprehensive approach to make potential students aware of certificate offerings by developing a marketing plan for certificate programs for the 12 community college system. The plan should provide enough direction to ensure alignment with the board’s strategic goals for the system as a whole but flexible enough to recognize the unique market segments which each colleges serves.
10. The Office of Higher Education shall develop a program to audit at least a sample of student data from sub-baccalaureate certificate programs of private occupational schools, schools of hairdressing, hospitals-based schools, and the independent colleges and universities on an annual basis.
11. The Office of Higher Education should develop a cost estimate to fund curriculum evaluators, where needed, and submit such an estimate to the committees of the General Assembly that have cognizance over postsecondary education and appropriations. The office should explore the possibility of using of the private occupational school student protection account to fund this request.
Program Review and Investigations Committee Staff Findings and Recommendations: December 19, 2014
3

Program Review and Investigations Committee Staff Findings and Recommendations: December 19, 2014
4
Table of Contents
Higher Education Certificate Programs
PRI Report Highlights ............................................................................................................................ i INTRODUCTION ................................................................................................................................... 1
I. COMBINED OVERVIEW AND INDVIDUAL PROFILES .................................................... 9
Certificate Program Data Findings in Brief .............................................................................. 9 Overview .................................................................................................................................. 9 The Board of Regents for Higher Education: Community Colleges ........................................ 15 Profile of For-Credit Community College Certificate Programs .............................................. 17 Profile of Noncredit Community College Certificate Programs .............................................. 24 Profile of Private Occupational Schools ................................................................................... 29
II. PRI STAFF FINDINGS AND RECOMMENDATIONS .......................................................... 39 Transparency and Accountability Needs to be Improved for All Certificate Programs ........... 39 The Board of Regents Process for Collecting and Reporting Certain Data about For-Credit and Noncredit Certificates is Unreliable and Not Comprehensive ........................................... 42 Similar Noncredit Certificate Programs Vary Considerably by Community College .............. 44 Approval Process for New Noncredit Certificate Programs Varies Among the Community Colleges .................................................................................................................................... 48 The Board of Regents Does Not Have a Definition of Certificates .......................................... 49 The Board of Regents Has No Comprehensive, Coordinated Marketing Plan for Certificate Programs ................................................................................................................................... 50 The Office of Higher Education Does Not Audit Certain Student Data ................................... 51 The Office of Higher Education Curriculum Evaluators Are Not Paid .................................... 52
APPENDICES
A. Postsecondary Institutions Included in This Study B. Outcomes for Community College For-Credit Certificate Graduates

Introduction
Higher Education Certificate Programs
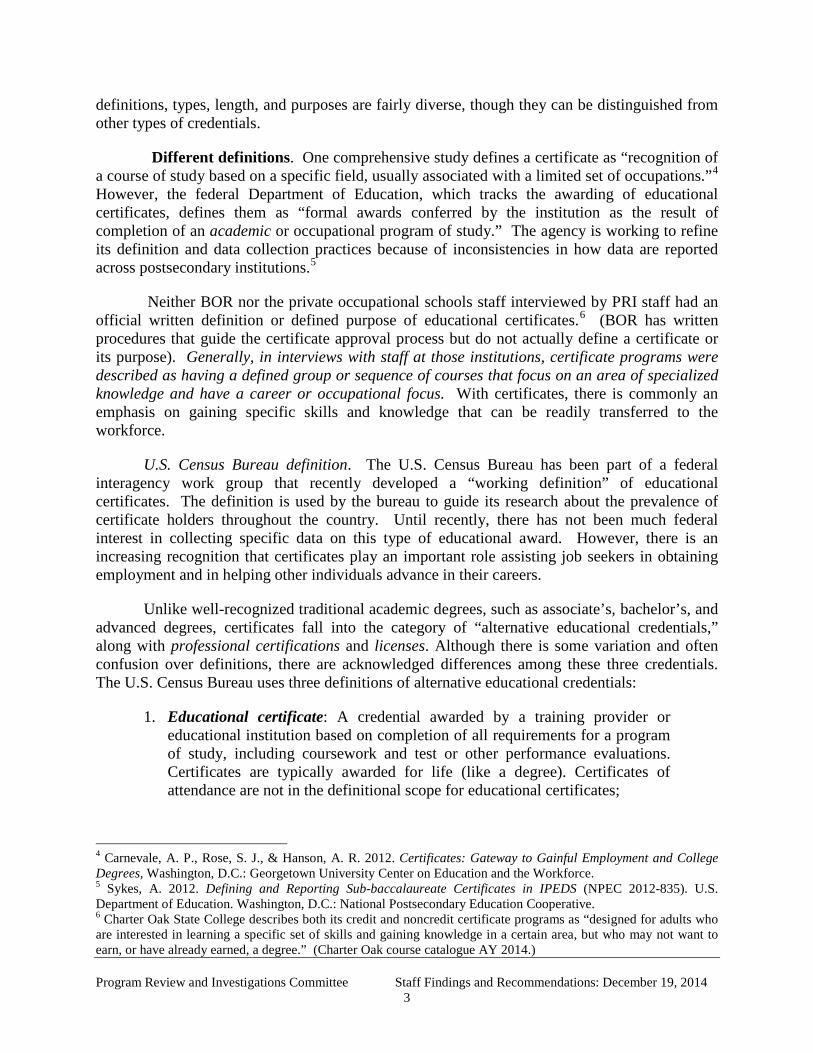
In May 2014, the Legislative Program Review and Investigations (PRI) Committee approved a study to examine how effectively certain sub-baccalaureate certificates are meeting Connecticut’s workforce demand. Specifically, the study scope required a detailed profile of certificate programs awarded by the Board of Regents for Higher Education (BOR), (which for this study, concerns only the state’s 12 community colleges and Charter Oak State College),1 and private occupational schools, which tend to be for-profit institutions. (A list of the institutions included in this study can be found in Appendix A.)
The study also examines, on a limited basis, whether the supply of certificate holders is aligned with job demand. In October, PRI staff provided an update to the committee, after which a public hearing was held to gather further input on this topic. As part of that update, staff explained to the committee that the Connecticut Department of Labor (DOL) and the BOR were assisting in extracting data through the use of the P20 WIN system that would allow for an examination of outcomes of students who have completed certificate programs at the community colleges to determine if post-graduation from the programs had impacted earnings.
Data concerns. A number of data problems prevented PRI staff from providing a complete analysis as anticipated in the scope of study. A full description of data problems is noted below. One of the more prominent roadblocks was DOL’s difficulty in providing the data necessary to examine supply and demand trends for certificate programs.
Study Findings
This report contains PRI staff findings and 11 recommendations. PRI staff found a lack of certificate program information for potential and current students that would allow for valid comparisons among schools and colleges. There was considerable variation both across and within for-credit and noncredit community certificate programs – even with programs that had the identical name. In addition, PRI staff found the cost of tuition varied considerable among similarly named certificate programs both within the community college system and when compared to programs offered by private occupational schools.
The intent of the recommendations is to increase the amount of information available about certificate programs to potential and current students. By improving transparency, 1 While the study’s scope includes an examination of BOR’s state universities, a search of sub-baccalaureate certificates for those institutions in a U.S. Department of Education database (Integrated Postsecondary Education Data System, or IPEDs) yielded no results and a search on BOR’s website located only one for-credit sub-baccalaureate program (in American Studies at Central Connecticut State University). That certificate is primarily for international students who come to the U.S. for an introductory program in American studies. Thus, PRI staff did not identify any noncredit certificates offered by the state universities to include in the study. In addition, Charter Oak State College had only 50 for-credit certificate programs whose incorporation will not change the findings and recommendations. Similarly, PRI staff received data from Goodwin College, a nonprofit college, which had seven certificate programs with student enrollments. An analysis of these programs will be provided separately in the final report. Program Review and Investigations Committee Staff Findings and Recommendations: December 19, 2014
1
students will be able to easily compare certificate programs among the various schools and colleges to identify the program that best meets their needs. PRI staff believes that all schools and colleges should be held accountable by publishing tuition costs, completion rates, and placement rates, which will aid students in their program and school choices.
The federal government recently adopted regulations to provide more transparency for students about schools offering certificate programs that are eligible for federal Title IV funding and lead to “gainful employment in a recognized occupation” (i.e., in Connecticut, the for-credit certificate programs at the community colleges and 10 of the 57 private occupational schools). The term has been used since 1965 under Title IV of the Higher Education Act, but never defined.2
Much of the information recommended by PRI staff to be published may be federally required for schools and colleges that are eligible to receive federal financial aid. However, as noted by staff in the October update, most private occupational schools, as well as non-credit programs offered by the community colleges, do not fall under these federal requirements because federal financial aid is not available to students. PRI staff believes that students enrolling in certificate programs will benefit from similar information being provided for both Title IV and non-Title IV schools and programs.
Providers
Educational certificates are offered by many types of organizations: community colleges; technical and business schools; trade unions; businesses; professional organizations; and government agencies. However, most certificates are awarded by for-profit private occupational schools (also referred to as “career” or “technical” colleges), community colleges, and private nonprofit colleges. The focus of this study is on for-credit and noncredit sub-baccalaureate certificate programs offered by the BOR and private occupational schools.3 Combined, these institutions account for most of the certificates awarded in Connecticut based on the best available information.
Definition of Certificate Programs
There are various definitions of what constitutes a postsecondary sub-baccalaureate educational certificate. Broadly speaking, a sub-baccalaureate certificate could be defined as any award below the bachelor’s degree level that was granted based on a formal program of study. Program review staff consulted academic and government literature, as well as conducted interviews with national experts, BOR staff, and staff at certain private occupational schools to determine how certificates are defined, developed, and marketed. Certificate program
2 The Association of Private Colleges and Universities filed suit on November 6, 2014, challenging the newly adopted regulations. The regulations penalize Title IV schools whose program graduates have annual loan payments greater than 12 percent of total earnings and greater than 30 percent of discretionary earnings. The regulations also require public disclosures regarding performance and outcomes of their gainful employment programs including information on costs, earnings, debt, and completion rates. 3 Due to concerns with data quality and time constraints, other certificate-awarding institutions - such as hospital-based schools, schools of hairdressing/cosmetology, certain religious-based institutions, and technical high schools - have been excluded from the study. Program Review and Investigations Committee Staff Findings and Recommendations: December 19, 2014
2
definitions, types, length, and purposes are fairly diverse, though they can be distinguished from other types of credentials.
Different definitions. One comprehensive study defines a certificate as “recognition of a course of study based on a specific field, usually associated with a limited set of occupations.”4 However, the federal Department of Education, which tracks the awarding of educational certificates, defines them as “formal awards conferred by the institution as the result of completion of an academic or occupational program of study.” The agency is working to refine its definition and data collection practices because of inconsistencies in how data are reported across postsecondary institutions.5
Neither BOR nor the private occupational schools staff interviewed by PRI staff had an official written definition or defined purpose of educational certificates.6 (BOR has written procedures that guide the certificate approval process but do not actually define a certificate or its purpose). Generally, in interviews with staff at those institutions, certificate programs were described as having a defined group or sequence of courses that focus on an area of specialized knowledge and have a career or occupational focus. With certificates, there is commonly an emphasis on gaining specific skills and knowledge that can be readily transferred to the workforce.
U.S. Census Bureau definition. The U.S. Census Bureau has been part of a federal interagency work group that recently developed a “working definition” of educational certificates. The definition is used by the bureau to guide its research about the prevalence of certificate holders throughout the country. Until recently, there has not been much federal interest in collecting specific data on this type of educational award. However, there is an increasing recognition that certificates play an important role assisting job seekers in obtaining employment and in helping other individuals advance in their careers.
Unlike well-recognized traditional academic degrees, such as associate’s, bachelor’s, and advanced degrees, certificates fall into the category of “alternative educational credentials,” along with professional certifications and licenses. Although there is some variation and often confusion over definitions, there are acknowledged differences among these three credentials. The U.S. Census Bureau uses three definitions of alternative educational credentials:
1. Educational certificate: A credential awarded by a training provider or educational institution based on completion of all requirements for a program of study, including coursework and test or other performance evaluations. Certificates are typically awarded for life (like a degree). Certificates of attendance are not in the definitional scope for educational certificates;
4 Carnevale, A. P., Rose, S. J., & Hanson, A. R. 2012. Certificates: Gateway to Gainful Employment and College Degrees, Washington, D.C.: Georgetown University Center on Education and the Workforce. 5 Sykes, A. 2012. Defining and Reporting Sub-baccalaureate Certificates in IPEDS (NPEC 2012-835). U.S. Department of Education. Washington, D.C.: National Postsecondary Education Cooperative. 6 Charter Oak State College describes both its credit and noncredit certificate programs as “designed for adults who are interested in learning a specific set of skills and gaining knowledge in a certain area, but who may not want to earn, or have already earned, a degree.” (Charter Oak course catalogue AY 2014.) Program Review and Investigations Committee Staff Findings and Recommendations: December 19, 2014
3
2. Professional certification: A credential awarded by a certification body based on an individual demonstrating through an examination process that he or she has acquired the designated knowledge, skills, and abilities to perform a specific job. The examination can be written, oral, or performance-based. Certification is a time-limited credential that is renewed through a recertification process; and
3. License: A credential awarded by a licensing agency (typically state
government) based on pre-determined criteria. The criteria may include some combination of degree attainment, certifications, certificates, assessment, apprenticeship programs, or work experience. Licenses are time-limited and must be renewed periodically.
Credit status. Certificate programs and their courses, can be offered for credit or not,
depending on the institution. Community colleges offer both types of programs while for-profit institutions only offer noncredit programs. However, personnel from one for-profit school told PRI staff that in the case of student transfers, the receiving schools determine if the courses are “credit worthy,” implying that at least sometimes, credit is granted.
Various reasons have been offered regarding why a college or university might offer a
certificate program on a for-credit or noncredit basis. For-credit programs can connect to a pathway to an associate’s or bachelor’s degree, and potentially allow course credits to transfer to other institutions. Also, federal financial aid is available to students in for-credit programs. For those benefits, for-credit programs can take more time for the school to develop than noncredit programs and must meet certain accreditation requirements. They often require the student to take general education courses that may not be directly related to the occupation of interest.
A certificate program may be set up as noncredit because there is not a perceived
necessity for the pathways connection, transferability, or accreditation status, when weighted against the preliminary effort and monitoring involved. They are typically classified for workforce or personal development. Noncredit programs may also be viewed as the appropriate type for programs designed with specific businesses in mind. Finally, the reason may be tradition.
Length. Certificate program lengths differ. A student enrolled in a full-time certificate program can take a few months to complete the program or four years, depending on the certificate. The majority of certificate programs offered in Connecticut take two years or less to complete, for students enrolled full-time.
Purpose. Knowing the reason why a prospective student would enroll in a certificate program, can help to inform the definition and purpose of the program. Studies of certificate programs and staff interviews with those in the postsecondary education field suggest that the reasons individuals enroll in certificate programs vary tremendously. The programs can serve as occupational training for high school graduates trying to enter a particular field or industry, or for a worker looking to change fields. In addition, certificates can be used to prepare for an industry
Program Review and Investigations Committee Staff Findings and Recommendations: December 19, 2014
4
certification, state licensure, or as a way to begin a path to a college degree. Further, experienced workers with college degrees may also use certificate programs to learn a new skill.7
Educational certificates can be very beneficial to both students and employers. For employers, certificates are often viewed as a recognized credential, and for students, the benefits are savings in time and money, increased earnings potential, and job stability. Individual outcomes, of course, can vary considerably.
Study Methodology and Sources
A variety of sources and methods were used to conduct research for this study. This included:
• interviews with higher education researchers and policy analysts; • a review of available and relevant literature on the topic; • additional interviews with personnel representing the larger private
occupational schools in Connecticut and with the administrative staff of BOR, the state Office of Higher Education (OHE), and DOL; and
• analysis of: − longitudinal student data (Preschool through 20 Workforce
Information Network, known as P20 WIN) by examining a cohort of community college for-credit certificate graduates to determine the impact the certificate made on careers and wages;
− demographic data provided by BOR on community college and Charter Oak students enrolled in and awarded certificates, and the types of certificates received by them; and
− data provided by OHE on the types of certificate programs offered, and graduation and placement rates for private occupational school programs.
Data sources. Information on the types of certificate programs offered and the students
enrolled in these programs was provided by four sources for the July 1, 2012 to June 30, 2013 academic year (AY): 1) BOR for the community colleges and Charter Oak State College; 2) OHE for the private occupational schools; 3) the P20 WIN system accessed by DOL, who linked a cohort of students that had graduated from community college certificate programs with pre- and post-graduate wage data; and 4) Goodwin College on the types of certificate programs it offers.
Because there is no single entity that compiles information on certificate programs in the state, the data varies, even within the board of regents – information on certificate programs and student demographics available differs between for-credit programs and noncredit. In addition, each data set had caveats associated with it, which are noted below.
7 Carnevale, A. P., Rose, S. J., & Hanson, A. R. 2012 Program Review and Investigations Committee Staff Findings and Recommendations: December 19, 2014
5
Board of Regents. The board of regents provided PRI staff with community college certificate student enrollment and completion data for both for-credit and noncredit programs. The board noted several caveats related to the ability to analyze the databases including that they do not:
• allow for a cohort of students enrolled in certificate programs to be tracked to determine completion rates (meaning a group of students who began a program at the same time is followed to identify those same students who completed the program);
• identify if a state or national exam is required to enter the occupational field, and if so, the percent of students passing the test; and
• distinguish between the number of awards granted versus the number of students that received multiple award(s) – only number of awards granted are captured.
The board also noted an additional caveat when interpreting the noncredit certificate completion data. The completion rate may also be undercounted because some students move from noncredit to for-credit programs of study before completing the noncredit program. These students should be measured as successful, but instead are counted as non-completers, which skews noncredit certificate completion statistics.
While preparing the data for PRI staff, the board found that many noncredit student enrollments and awards granted were not accounted for in its data system because most of the data is maintained by each individual college. As a result, the board indicated that the numbers reported to PRI staff underrepresent the noncredit certificate program activity that actually occurred at any given community college and may only be interpreted as the minimum number of noncredit completions. The board indicated to PRI staff that the board it working to correct this flaw in the system and expects to have more complete data by next year.
Finally, the board had to revise the data provided to committee staff several times in order to provide the most accurate information. The last revision to the for-credit data was on October 22, and for to the noncredit data, November 25.
Private occupational schools. Private occupational school student enrollment, completion, and placement data were collected through an annual survey administered by the Office of Higher Education and certain student demographic data were collected by OHE using a survey instrument developed by PRI. A total of 46 out of 57 schools (80 percent) and their associated branches provided survey data for AY 2013. Not all schools provided data for each question, the data are self-reported to OHE, and the data was not audited for accuracy. In addition, information about student pass rates on national certification and state licensing exams was not available. Certain data on enrollments, awards, and placements were provided in July and revisions to the AY 2013 data were made and received in October and November. Data on demographic characteristics was received in October, with revisions also made in October.
Program Review and Investigations Committee Staff Findings and Recommendations: December 19, 2014
6

Charter Oak State College and Goodwin College. PRI staff received a portion of requested data from Goodwin College in December, which did not allow enough time for an exploration of the data. Both Charter Oak State College and Goodwin College offer a very limited number of certificate programs. For these reasons, information on their certificate programs is not included in the body of this report, but will be provided in the final report.
Department of Labor. Although PRI staff began working with DOL and BOR staff in early August in order to fulfill the committee’s charge to examine the alignment between certificate graduates and employment following graduation, DOL did not provide needed data until December 2014, leaving committee staff little time to evaluate it.
In addition, DOL staff was unable to provide additional data that was requested by PRI staff in July on: 1) overall job supply and demand projections; and 2) wage data for sectors and/or occupations where a certificate was either required or desired by an employer.
Report Organization
This report has two chapters. Chapter I provides a comparison of the certificate programs offered by the board through its community colleges and the private occupational schools. This chapter also contains a detailed profile of community colleges and postsecondary occupational schools that offer certificate programs. The types of programs available and information on the students that have enrolled and graduated from them is described. Chapter II contains PRI staff findings and proposed recommendations.
Program Review and Investigations Committee Staff Findings and Recommendations: December 19, 2014
7

Chapter I
Combined Overview and Individual Profiles
This chapter describes and analyzes certificate programs offered at the community colleges on a for-credit and noncredit basis, as well as programs available at the state’s postsecondary private occupational schools. The chapter begins with a combined overview that compares the programs at the private occupational schools to the community colleges and then presents individual profiles for each entity.
To perform this analysis, the program review committee staff relied on data provided by the Board of Regents for Higher Education for the 12 community colleges and the Office of Higher Education for 46 private occupational schools. Due to the different systems, including data the two state agencies oversee, there were variations in the type of information collected. Therefore, although this chapter includes profiles of the two types of certificates offered (i.e., for credit and noncredit) by the community colleges and the private occupational schools (noncredit only), the same data could not be presented across all of the colleges and schools.
Certificate Program Data Findings in Brief
In general, the data show that private occupational schools accounted for about three-quarters of the approximately 25,000 certificate program enrollments and 19,000 awards in academic year 2013 (AY 2013). The majority of students enrolled in either public or private programs are under the age of thirty. The private occupational schools’ student bodies were more racially and ethnically diverse than those of the for-credit community college programs.
There is some overlap in broadly defined instructional areas among the community college programs and the private occupational schools, especially in the health professions. However, when the certificate programs are examined by more specific occupational areas, there was very little overlap among the largest programs.
In addition, most private occupational school programs are shorter than community college programs. Furthermore, while there are some private occupational schools programs that have a lower overall tuition compared to similar programs at community colleges, the average cost to the student per credit (or equivalent credit when converted from course hours to credits) is higher among the private occupational schools. This may not be surprising as the private occupational schools do not benefit from any state subsidy and are largely for-profit organizations. Still, examples of striking price differences between the community college and private occupational schools can be found among several common certificate programs and some examples are provided in this chapter.
Overview
Enrollments and awards. In AY 2013, private occupational schools, by far, enrolled and awarded the majority of the certificates in Connecticut, as illustrated in Figure I-1. About three-quarters of all student enrollments and awards were from private occupational schools.
Program Review and Investigations Committee Staff Findings and Recommendations: December 19, 2014
9
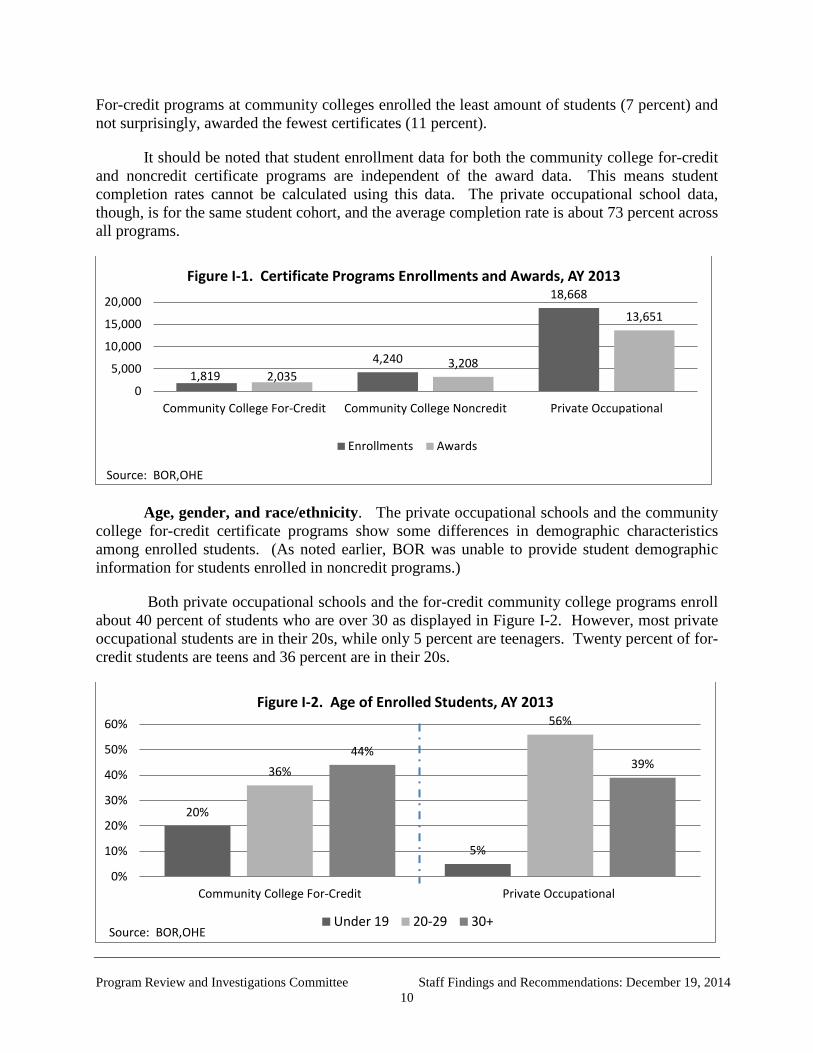
For-credit programs at community colleges enrolled the least amount of students (7 percent) and not surprisingly, awarded the fewest certificates (11 percent).
It should be noted that student enrollment data for both the community college for-credit and noncredit certificate programs are independent of the award data. This means student completion rates cannot be calculated using this data. The private occupational school data, though, is for the same student cohort, and the average completion rate is about 73 percent across all programs.
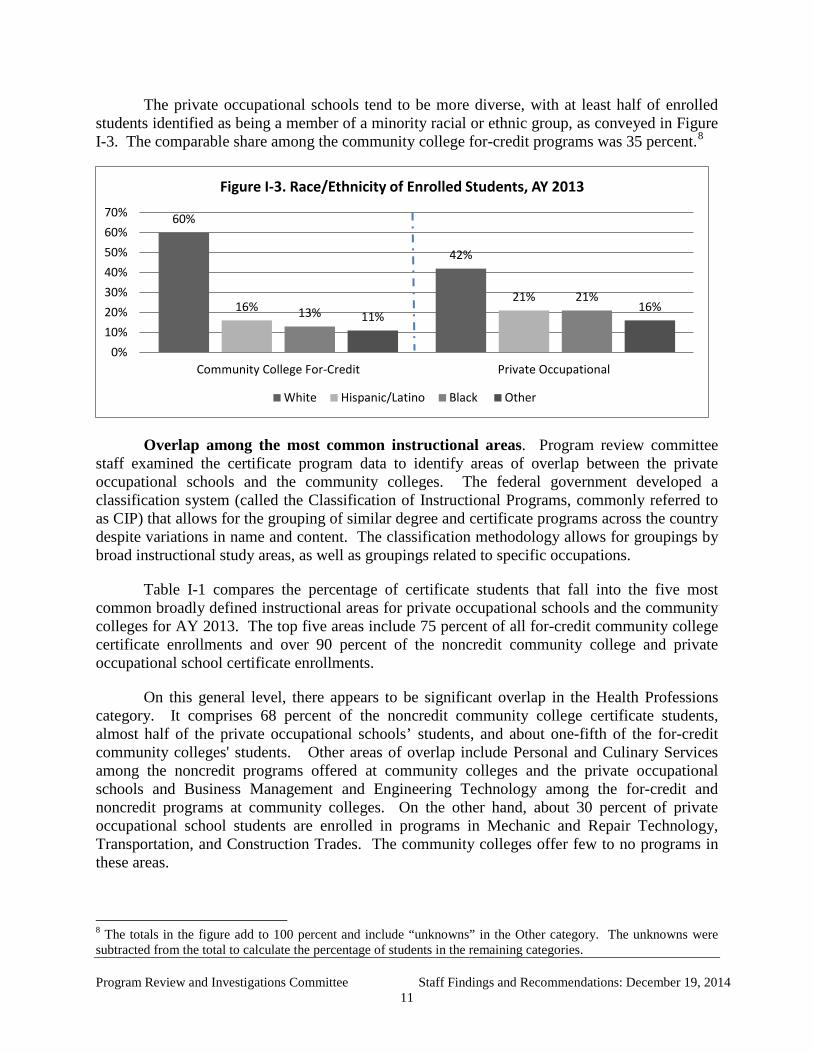
Age, gender, and race/ethnicity. The private occupational schools and the community college for-credit certificate programs show some differences in demographic characteristics among enrolled students. (As noted earlier, BOR was unable to provide student demographic information for students enrolled in noncredit programs.)
Both private occupational schools and the for-credit community college programs enroll about 40 percent of students who are over 30 as displayed in Figure I-2. However, most private occupational students are in their 20s, while only 5 percent are teenagers. Twenty percent of for-credit students are teens and 36 percent are in their 20s.
1,819 4,240
18,668
2,035 3,208
13,651
0
5,000
10,000
15,000
20,000
Community College For-Credit Community College Noncredit Private Occupational
Source: BOR,OHE
Figure I-1. Certificate Programs Enrollments and Awards, AY 2013
Enrollments Awards
20%
5%
36%
56%
44% 39%
0%
10%
20%
30%
40%
50%
60%
Community College For-Credit Private Occupational
Source: BOR,OHE
Figure I-2. Age of Enrolled Students, AY 2013
Under 19 20-29 30+
Program Review and Investigations Committee Staff Findings and Recommendations: December 19, 2014
10
The private occupational schools tend to be more diverse, with at least half of enrolled students identified as being a member of a minority racial or ethnic group, as conveyed in Figure I-3. The comparable share among the community college for-credit programs was 35 percent.8
Overlap among the most common instructional areas. Program review committee staff examined the certificate program data to identify areas of overlap between the private occupational schools and the community colleges. The federal government developed a classification system (called the Classification of Instructional Programs, commonly referred to as CIP) that allows for the grouping of similar degree and certificate programs across the country despite variations in name and content. The classification methodology allows for groupings by broad instructional study areas, as well as groupings related to specific occupations.
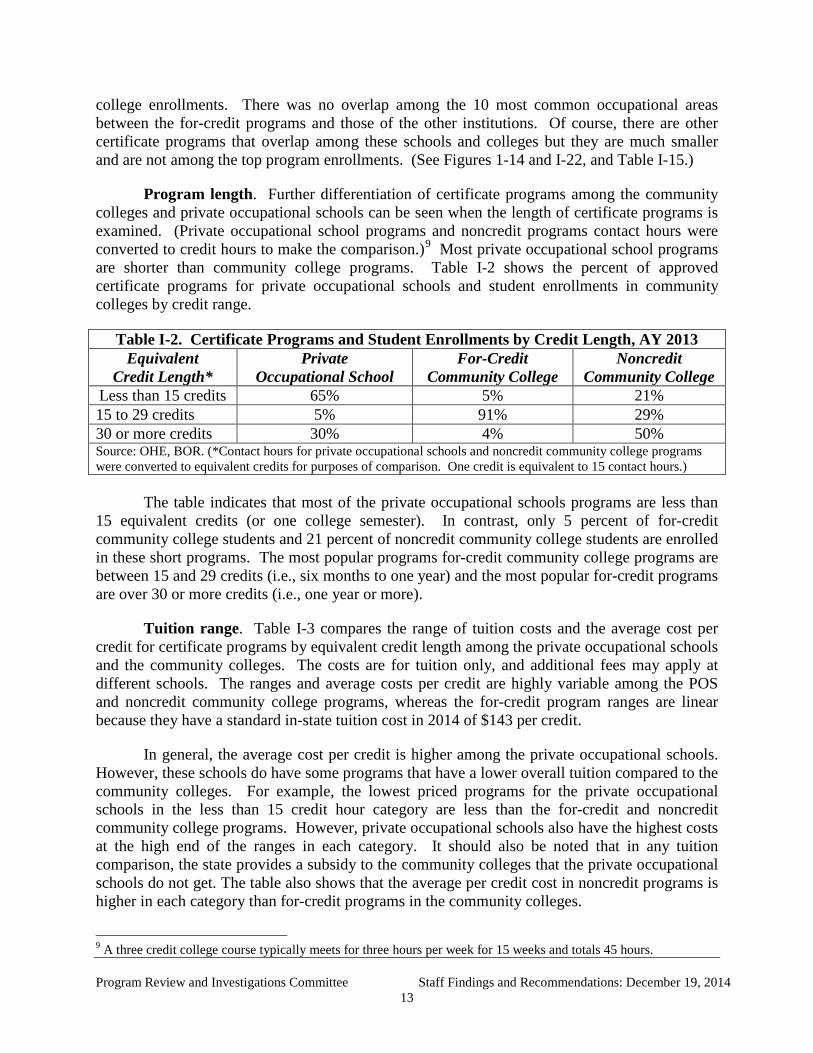
Table I-1 compares the percentage of certificate students that fall into the five most common broadly defined instructional areas for private occupational schools and the community colleges for AY 2013. The top five areas include 75 percent of all for-credit community college certificate enrollments and over 90 percent of the noncredit community college and private occupational school certificate enrollments.
On this general level, there appears to be significant overlap in the Health Professions category. It comprises 68 percent of the noncredit community college certificate students, almost half of the private occupational schools’ students, and about one-fifth of the for-credit community colleges' students. Other areas of overlap include Personal and Culinary Services among the noncredit programs offered at community colleges and the private occupational schools and Business Management and Engineering Technology among the for-credit and noncredit programs at community colleges. On the other hand, about 30 percent of private occupational school students are enrolled in programs in Mechanic and Repair Technology, Transportation, and Construction Trades. The community colleges offer few to no programs in these areas.
8 The totals in the figure add to 100 percent and include “unknowns” in the Other category. The unknowns were subtracted from the total to calculate the percentage of students in the remaining categories.
60%
42%
16% 21%
13% 21%
11% 16%
0%10%20%30%40%50%60%70%
Community College For-Credit Private Occupational
Figure I-3. Race/Ethnicity of Enrolled Students, AY 2013
White Hispanic/Latino Black Other
Program Review and Investigations Committee Staff Findings and Recommendations: December 19, 2014
11
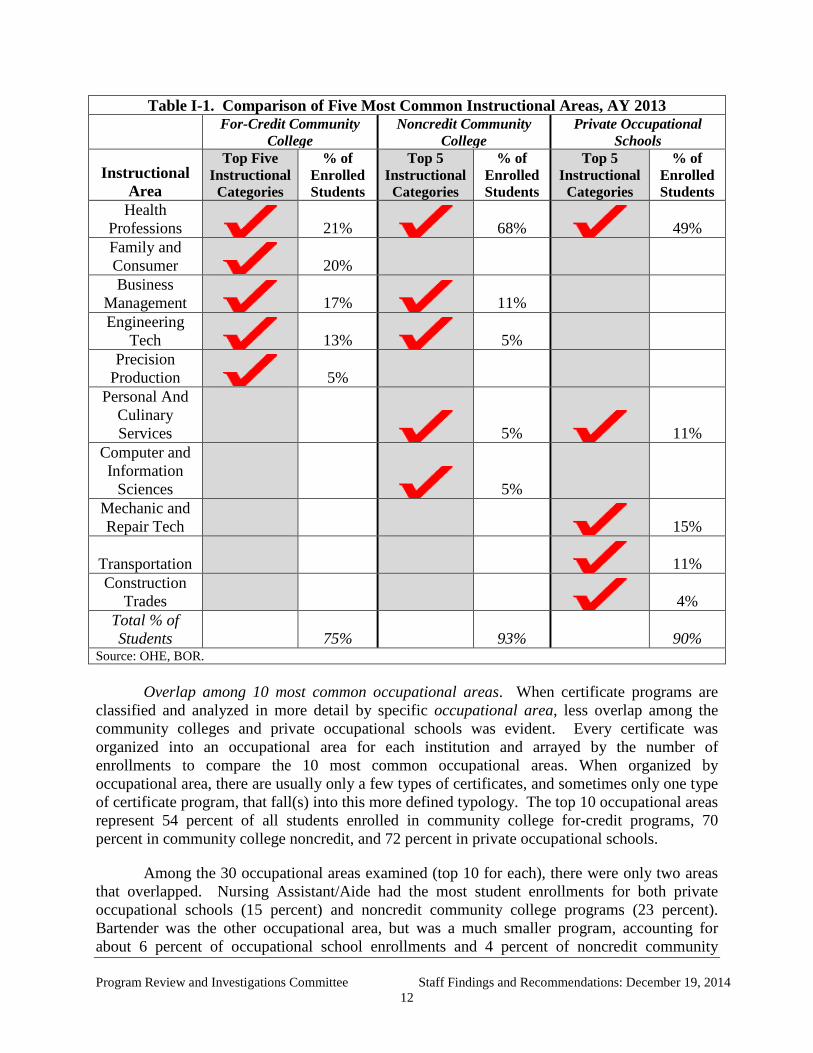
Table I-1. Comparison of Five Most Common Instructional Areas, AY 2013
For-Credit Community
College Noncredit Community
College Private Occupational
Schools
Instructional Area
Top Five Instructional
Categories
% of Enrolled Students
Top 5 Instructional Categories
% of Enrolled Students
Top 5 Instructional
Categories
% of Enrolled Students
Health Professions 21% 68% 49% Family and Consumer 20% Business
Management 17% 11% Engineering
Tech 13% 5% Precision
Production 5% Personal And
Culinary Services 5% 11%
Computer and Information
Sciences 5% Mechanic and Repair Tech 15%
Transportation 11% Construction
Trades 4% Total % of Students 75% 93% 90%
Source: OHE, BOR. Overlap among 10 most common occupational areas. When certificate programs are
classified and analyzed in more detail by specific occupational area, less overlap among the community colleges and private occupational schools was evident. Every certificate was organized into an occupational area for each institution and arrayed by the number of enrollments to compare the 10 most common occupational areas. When organized by occupational area, there are usually only a few types of certificates, and sometimes only one type of certificate program, that fall(s) into this more defined typology. The top 10 occupational areas represent 54 percent of all students enrolled in community college for-credit programs, 70 percent in community college noncredit, and 72 percent in private occupational schools.
Among the 30 occupational areas examined (top 10 for each), there were only two areas that overlapped. Nursing Assistant/Aide had the most student enrollments for both private occupational schools (15 percent) and noncredit community college programs (23 percent). Bartender was the other occupational area, but was a much smaller program, accounting for about 6 percent of occupational school enrollments and 4 percent of noncredit community Program Review and Investigations Committee Staff Findings and Recommendations: December 19, 2014
12
college enrollments. There was no overlap among the 10 most common occupational areas between the for-credit programs and those of the other institutions. Of course, there are other certificate programs that overlap among these schools and colleges but they are much smaller and are not among the top program enrollments. (See Figures 1-14 and I-22, and Table I-15.)
Program length. Further differentiation of certificate programs among the community colleges and private occupational schools can be seen when the length of certificate programs is examined. (Private occupational school programs and noncredit programs contact hours were converted to credit hours to make the comparison.)9 Most private occupational school programs are shorter than community college programs. Table I-2 shows the percent of approved certificate programs for private occupational schools and student enrollments in community colleges by credit range.
Table I-2. Certificate Programs and Student Enrollments by Credit Length, AY 2013 Equivalent
Credit Length* Private
Occupational School For-Credit
Community College Noncredit
Community College Less than 15 credits 65% 5% 21% 15 to 29 credits 5% 91% 29% 30 or more credits 30% 4% 50% Source: OHE, BOR. (*Contact hours for private occupational schools and noncredit community college programs were converted to equivalent credits for purposes of comparison. One credit is equivalent to 15 contact hours.)
The table indicates that most of the private occupational schools programs are less than 15 equivalent credits (or one college semester). In contrast, only 5 percent of for-credit community college students and 21 percent of noncredit community college students are enrolled in these short programs. The most popular programs for-credit community college programs are between 15 and 29 credits (i.e., six months to one year) and the most popular for-credit programs are over 30 or more credits (i.e., one year or more).
Tuition range. Table I-3 compares the range of tuition costs and the average cost per credit for certificate programs by equivalent credit length among the private occupational schools and the community colleges. The costs are for tuition only, and additional fees may apply at different schools. The ranges and average costs per credit are highly variable among the POS and noncredit community college programs, whereas the for-credit program ranges are linear because they have a standard in-state tuition cost in 2014 of $143 per credit.
In general, the average cost per credit is higher among the private occupational schools. However, these schools do have some programs that have a lower overall tuition compared to the community colleges. For example, the lowest priced programs for the private occupational schools in the less than 15 credit hour category are less than the for-credit and noncredit community college programs. However, private occupational schools also have the highest costs at the high end of the ranges in each category. It should also be noted that in any tuition comparison, the state provides a subsidy to the community colleges that the private occupational schools do not get. The table also shows that the average per credit cost in noncredit programs is higher in each category than for-credit programs in the community colleges.
9 A three credit college course typically meets for three hours per week for 15 weeks and totals 45 hours. Program Review and Investigations Committee Staff Findings and Recommendations: December 19, 2014
13
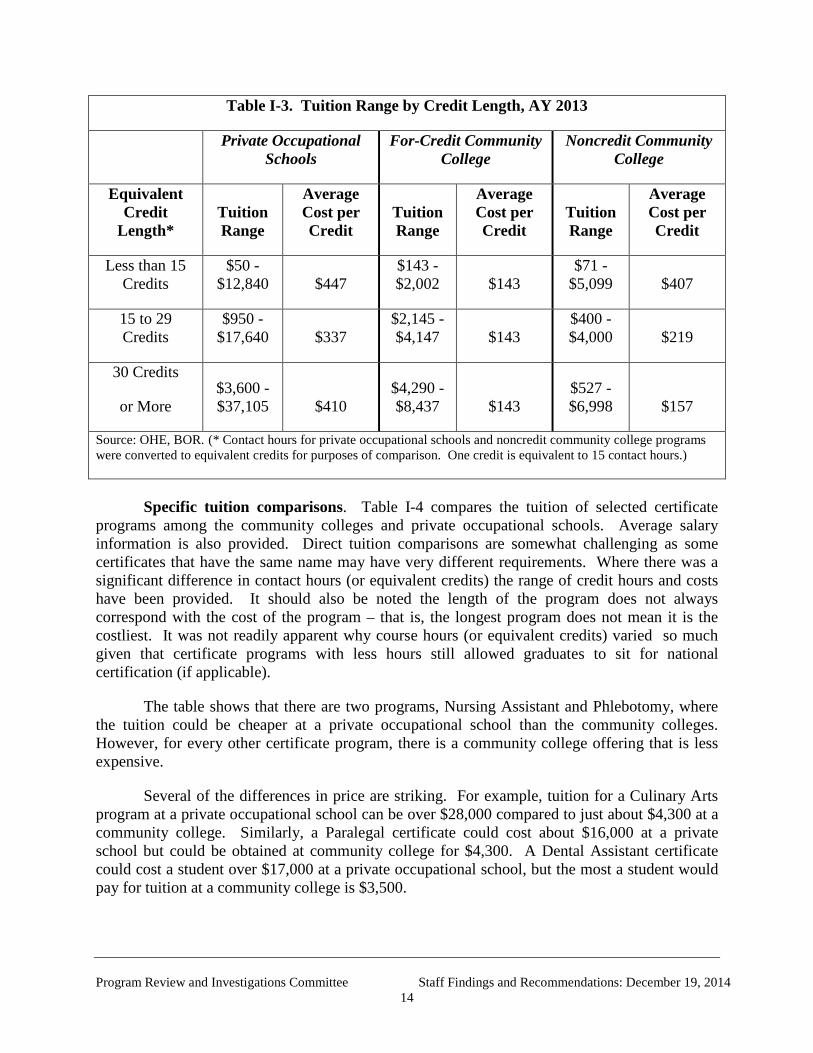
Table I-3. Tuition Range by Credit Length, AY 2013
Private Occupational
Schools For-Credit Community
College Noncredit Community
College
Equivalent Credit
Length* Tuition Range
Average Cost per Credit
Tuition Range
Average Cost per Credit
Tuition Range
Average Cost per Credit
Less than 15 Credits
$50 - $12,840 $447
$143 - $2,002 $143
$71 - $5,099 $407
15 to 29 Credits
$950 - $17,640 $337
$2,145 - $4,147 $143
$400 - $4,000 $219
30 Credits
or More $3,600 - $37,105 $410
$4,290 - $8,437 $143
$527 - $6,998 $157
Source: OHE, BOR. (* Contact hours for private occupational schools and noncredit community college programs were converted to equivalent credits for purposes of comparison. One credit is equivalent to 15 contact hours.)
Specific tuition comparisons. Table I-4 compares the tuition of selected certificate
programs among the community colleges and private occupational schools. Average salary information is also provided. Direct tuition comparisons are somewhat challenging as some certificates that have the same name may have very different requirements. Where there was a significant difference in contact hours (or equivalent credits) the range of credit hours and costs have been provided. It should also be noted the length of the program does not always correspond with the cost of the program – that is, the longest program does not mean it is the costliest. It was not readily apparent why course hours (or equivalent credits) varied so much given that certificate programs with less hours still allowed graduates to sit for national certification (if applicable).
The table shows that there are two programs, Nursing Assistant and Phlebotomy, where the tuition could be cheaper at a private occupational school than the community colleges. However, for every other certificate program, there is a community college offering that is less expensive.
Several of the differences in price are striking. For example, tuition for a Culinary Arts program at a private occupational school can be over $28,000 compared to just about $4,300 at a community college. Similarly, a Paralegal certificate could cost about $16,000 at a private school but could be obtained at community college for $4,300. A Dental Assistant certificate could cost a student over $17,000 at a private occupational school, but the most a student would pay for tuition at a community college is $3,500.
Program Review and Investigations Committee Staff Findings and Recommendations: December 19, 2014
14
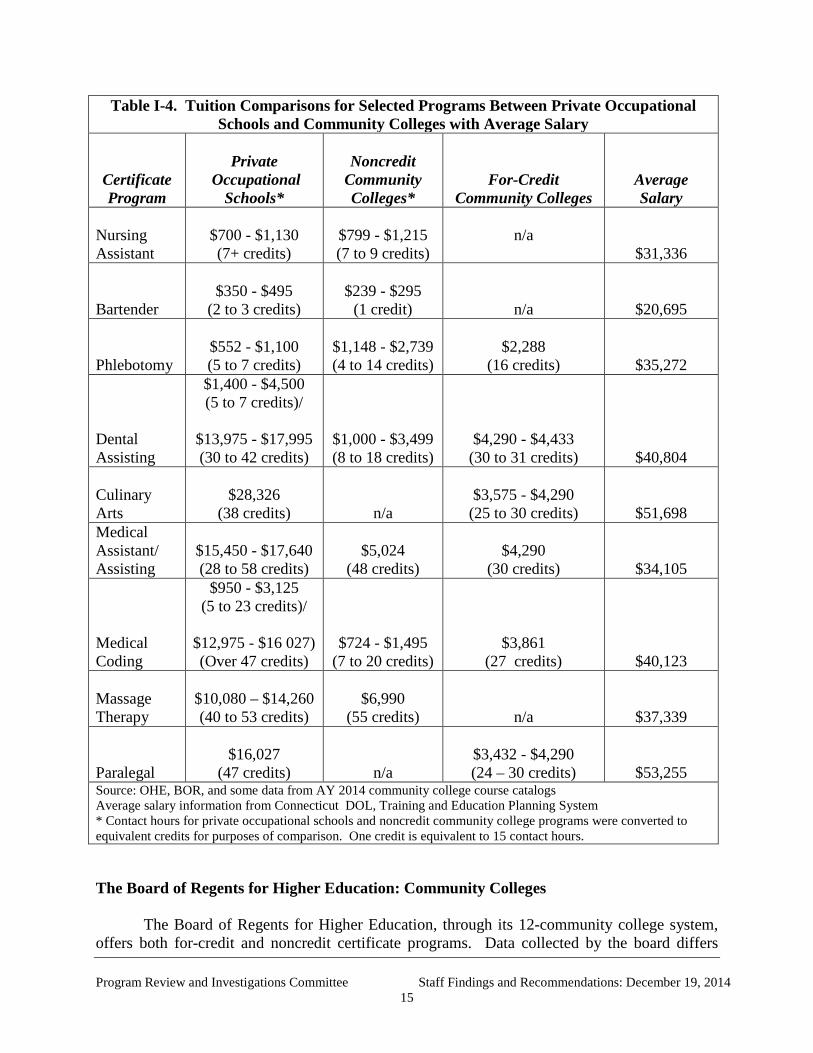
Table I-4. Tuition Comparisons for Selected Programs Between Private Occupational Schools and Community Colleges with Average Salary
Certificate Program
Private
Occupational Schools*
Noncredit
Community Colleges*
For-Credit
Community Colleges Average Salary
Nursing Assistant
$700 - $1,130 (7+ credits)
$799 - $1,215 (7 to 9 credits)
n/a $31,336
Bartender
$350 - $495
(2 to 3 credits) $239 - $295
(1 credit) n/a $20,695
Phlebotomy
$552 - $1,100 (5 to 7 credits)
$1,148 - $2,739 (4 to 14 credits)
$2,288 (16 credits) $35,272
Dental Assisting
$1,400 - $4,500 (5 to 7 credits)/
$13,975 - $17,995 (30 to 42 credits)
$1,000 - $3,499 (8 to 18 credits)
$4,290 - $4,433 (30 to 31 credits) $40,804
Culinary Arts
$28,326
(38 credits) n/a
$3,575 - $4,290
(25 to 30 credits) $51,698 Medical Assistant/ Assisting
$15,450 - $17,640 (28 to 58 credits)
$5,024 (48 credits)
$4,290 (30 credits) $34,105
Medical Coding
$950 - $3,125 (5 to 23 credits)/
$12,975 - $16 027) (Over 47 credits)
$724 - $1,495 (7 to 20 credits)
$3,861 (27 credits) $40,123
Massage Therapy
$10,080 – $14,260 (40 to 53 credits)
$6,990 (55 credits) n/a $37,339
Paralegal
$16,027
(47 credits) n/a $3,432 - $4,290 (24 – 30 credits) $53,255
Source: OHE, BOR, and some data from AY 2014 community college course catalogs Average salary information from Connecticut DOL, Training and Education Planning System * Contact hours for private occupational schools and noncredit community college programs were converted to equivalent credits for purposes of comparison. One credit is equivalent to 15 contact hours.
The Board of Regents for Higher Education: Community Colleges
The Board of Regents for Higher Education, through its 12-community college system, offers both for-credit and noncredit certificate programs. Data collected by the board differs Program Review and Investigations Committee Staff Findings and Recommendations: December 19, 2014
15
between the two types of programs, with the board’s data system capturing associate’s degree and certificate programs on for-credit programs, while much of the noncredit data is located at the individual college level and it is not aggregated by the board. Thus, although PRI staff developed profiles on for-credit and noncredit programs, the information that the board was able to provide to PRI staff differs in some respects between the two types of programs. For example, gender and age information was available for students enrolled in for-credit programs, but was not available for those enrolled in noncredit programs.
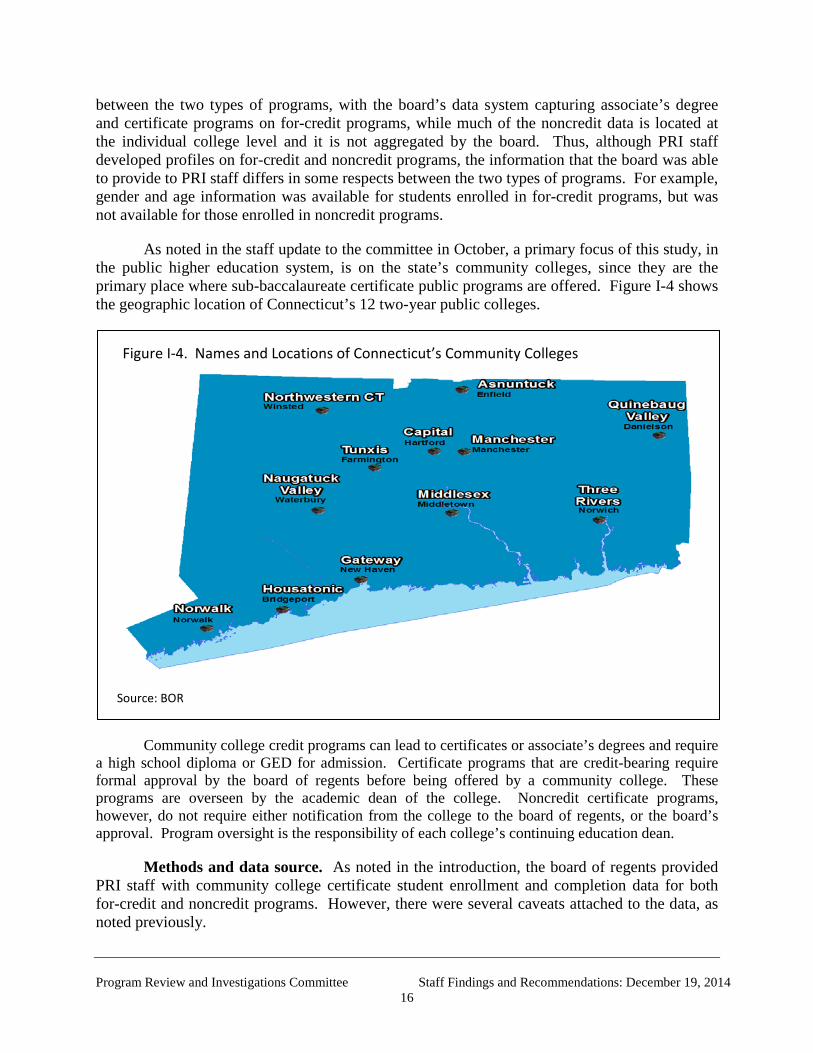
As noted in the staff update to the committee in October, a primary focus of this study, in the public higher education system, is on the state’s community colleges, since they are the primary place where sub-baccalaureate certificate public programs are offered. Figure I-4 shows the geographic location of Connecticut’s 12 two-year public colleges.
Community college credit programs can lead to certificates or associate’s degrees and require a high school diploma or GED for admission. Certificate programs that are credit-bearing require formal approval by the board of regents before being offered by a community college. These programs are overseen by the academic dean of the college. Noncredit certificate programs, however, do not require either notification from the college to the board of regents, or the board’s approval. Program oversight is the responsibility of each college’s continuing education dean.
Methods and data source. As noted in the introduction, the board of regents provided PRI staff with community college certificate student enrollment and completion data for both for-credit and noncredit programs. However, there were several caveats attached to the data, as noted previously.
Figure I-4. Names and Locations of Connecticut’s Community Colleges
Source: BOR
Program Review and Investigations Committee Staff Findings and Recommendations: December 19, 2014
16
While collecting data for PRI staff, the board found that many noncredit student enrollments were not accounted for in its data system, nor were the total number of noncredit awards granted. As a result, the board indicated that the numbers reported to PRI staff likely underrepresent the noncredit certificate program activity that actually occurred at any given community college. The board indicated to PRI staff that it is working to correct this flaw in the system and expect to have more complete data by next year.
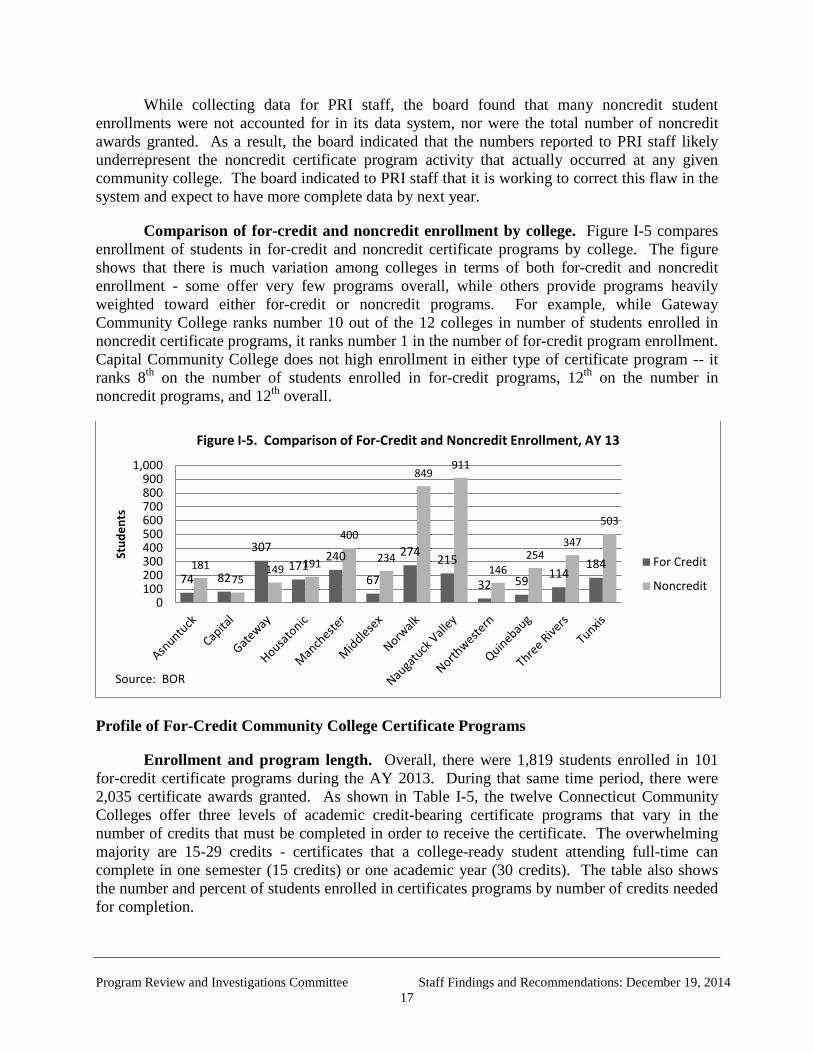
Comparison of for-credit and noncredit enrollment by college. Figure I-5 compares enrollment of students in for-credit and noncredit certificate programs by college. The figure shows that there is much variation among colleges in terms of both for-credit and noncredit enrollment - some offer very few programs overall, while others provide programs heavily weighted toward either for-credit or noncredit programs. For example, while Gateway Community College ranks number 10 out of the 12 colleges in number of students enrolled in noncredit certificate programs, it ranks number 1 in the number of for-credit program enrollment. Capital Community College does not high enrollment in either type of certificate program -- it ranks 8th on the number of students enrolled in for-credit programs, 12th on the number in noncredit programs, and 12th overall.
Profile of For-Credit Community College Certificate Programs
Enrollment and program length. Overall, there were 1,819 students enrolled in 101 for-credit certificate programs during the AY 2013. During that same time period, there were 2,035 certificate awards granted. As shown in Table I-5, the twelve Connecticut Community Colleges offer three levels of academic credit-bearing certificate programs that vary in the number of credits that must be completed in order to receive the certificate. The overwhelming majority are 15-29 credits - certificates that a college-ready student attending full-time can complete in one semester (15 credits) or one academic year (30 credits). The table also shows the number and percent of students enrolled in certificates programs by number of credits needed for completion.
74 82
307 171
240
67
274 215
32 59 114 184 181
75 149 191
400
234
849 911
146 254
347
503
0100200300400500600700800900
1,000
Stud
ents
Figure I-5. Comparison of For-Credit and Noncredit Enrollment, AY 13
For Credit
Noncredit
Source: BOR
Program Review and Investigations Committee Staff Findings and Recommendations: December 19, 2014
17
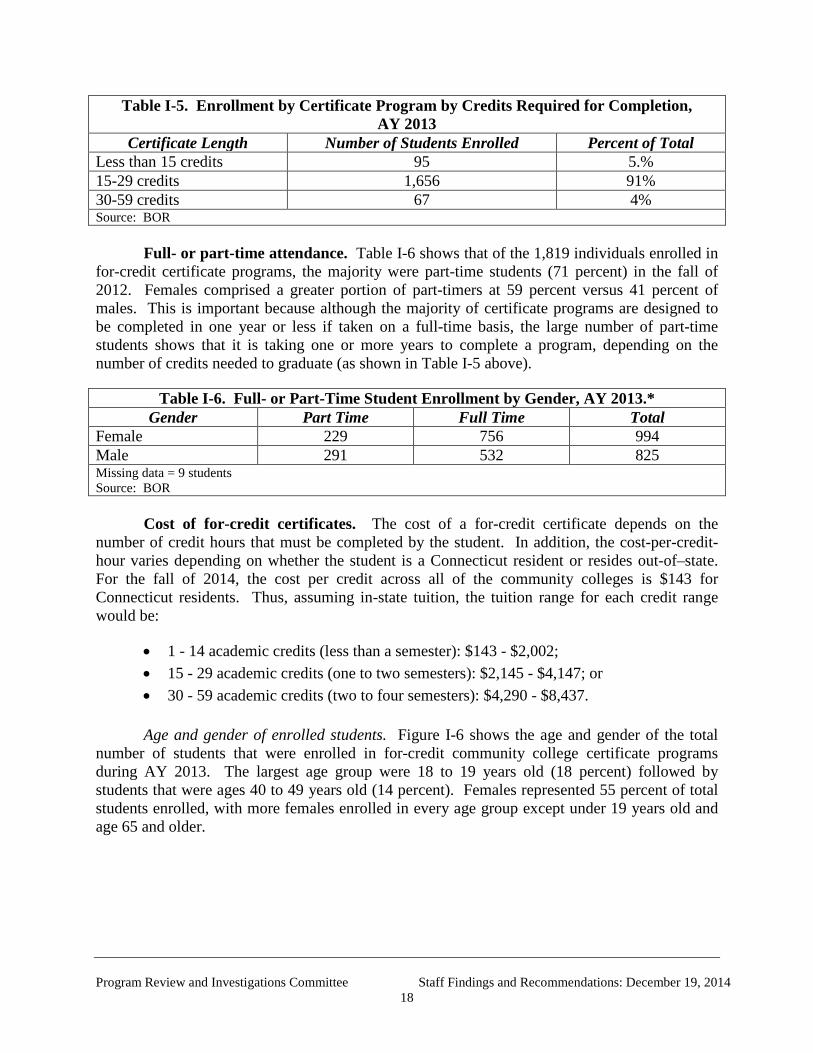
Table I-5. Enrollment by Certificate Program by Credits Required for Completion, AY 2013
Certificate Length Number of Students Enrolled Percent of Total Less than 15 credits 95 5.% 15-29 credits 1,656 91% 30-59 credits 67 4% Source: BOR
Full- or part-time attendance. Table I-6 shows that of the 1,819 individuals enrolled in for-credit certificate programs, the majority were part-time students (71 percent) in the fall of 2012. Females comprised a greater portion of part-timers at 59 percent versus 41 percent of males. This is important because although the majority of certificate programs are designed to be completed in one year or less if taken on a full-time basis, the large number of part-time students shows that it is taking one or more years to complete a program, depending on the number of credits needed to graduate (as shown in Table I-5 above).
Table I-6. Full- or Part-Time Student Enrollment by Gender, AY 2013.* Gender Part Time Full Time Total
Female 229 756 994 Male 291 532 825 Missing data = 9 students Source: BOR
Cost of for-credit certificates. The cost of a for-credit certificate depends on the
number of credit hours that must be completed by the student. In addition, the cost-per-credit-hour varies depending on whether the student is a Connecticut resident or resides out-of–state. For the fall of 2014, the cost per credit across all of the community colleges is $143 for Connecticut residents. Thus, assuming in-state tuition, the tuition range for each credit range would be:
• 1 - 14 academic credits (less than a semester): $143 - $2,002; • 15 - 29 academic credits (one to two semesters): $2,145 - $4,147; or • 30 - 59 academic credits (two to four semesters): $4,290 - $8,437. Age and gender of enrolled students. Figure I-6 shows the age and gender of the total
number of students that were enrolled in for-credit community college certificate programs during AY 2013. The largest age group were 18 to 19 years old (18 percent) followed by students that were ages 40 to 49 years old (14 percent). Females represented 55 percent of total students enrolled, with more females enrolled in every age group except under 19 years old and age 65 and older.
Program Review and Investigations Committee Staff Findings and Recommendations: December 19, 2014
18
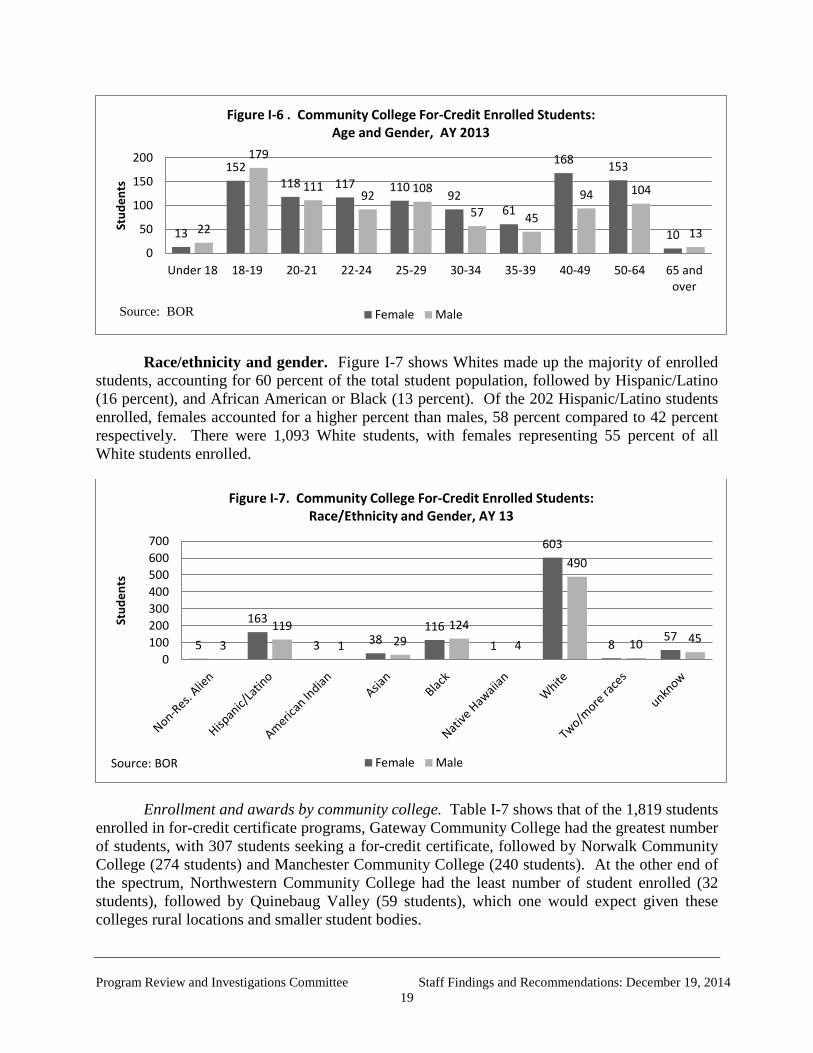
Race/ethnicity and gender. Figure I-7 shows Whites made up the majority of enrolled students, accounting for 60 percent of the total student population, followed by Hispanic/Latino (16 percent), and African American or Black (13 percent). Of the 202 Hispanic/Latino students enrolled, females accounted for a higher percent than males, 58 percent compared to 42 percent respectively. There were 1,093 White students, with females representing 55 percent of all White students enrolled.
Enrollment and awards by community college. Table I-7 shows that of the 1,819 students enrolled in for-credit certificate programs, Gateway Community College had the greatest number of students, with 307 students seeking a for-credit certificate, followed by Norwalk Community College (274 students) and Manchester Community College (240 students). At the other end of the spectrum, Northwestern Community College had the least number of student enrolled (32 students), followed by Quinebaug Valley (59 students), which one would expect given these colleges rural locations and smaller student bodies.
13
152 118 117 110
92 61
168 153
10 22
179
111 92 108
57 45
94 104
13 0
50
100
150
200
Under 18 18-19 20-21 22-24 25-29 30-34 35-39 40-49 50-64 65 andover
Stud
ents
Figure I-6 . Community College For-Credit Enrolled Students:
Age and Gender, AY 2013
Female Male
5
163
3 38 116
1
603
8 57 3
119 1 29
124 4
490
10 45
0100200300400500600700
Stud
ents
Figure I-7. Community College For-Credit Enrolled Students: Race/Ethnicity and Gender, AY 13
Female MaleSource: BOR
Source: BOR
Program Review and Investigations Committee Staff Findings and Recommendations: December 19, 2014
19
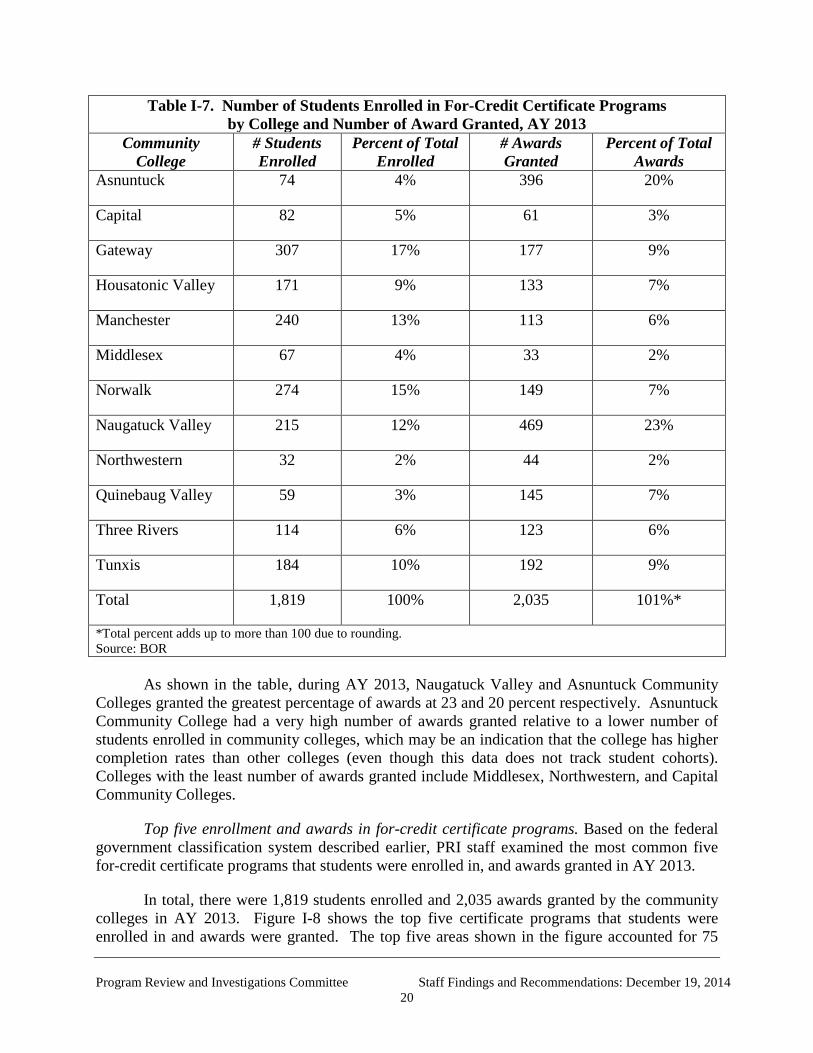
Table I-7. Number of Students Enrolled in For-Credit Certificate Programs by College and Number of Award Granted, AY 2013
Community College
# Students Enrolled
Percent of Total Enrolled
# Awards Granted
Percent of Total Awards
Asnuntuck 74 4% 396 20%
Capital 82 5% 61 3%
Gateway 307 17% 177 9%
Housatonic Valley 171 9% 133 7%
Manchester 240 13% 113 6%
Middlesex 67 4% 33 2%
Norwalk 274 15% 149 7%
Naugatuck Valley 215 12% 469 23%
Northwestern 32 2% 44 2%
Quinebaug Valley 59 3% 145 7%
Three Rivers 114 6% 123 6%
Tunxis 184 10% 192 9%
Total 1,819 100% 2,035 101%*
*Total percent adds up to more than 100 due to rounding. Source: BOR
As shown in the table, during AY 2013, Naugatuck Valley and Asnuntuck Community
Colleges granted the greatest percentage of awards at 23 and 20 percent respectively. Asnuntuck Community College had a very high number of awards granted relative to a lower number of students enrolled in community colleges, which may be an indication that the college has higher completion rates than other colleges (even though this data does not track student cohorts). Colleges with the least number of awards granted include Middlesex, Northwestern, and Capital Community Colleges.
Top five enrollment and awards in for-credit certificate programs. Based on the federal government classification system described earlier, PRI staff examined the most common five for-credit certificate programs that students were enrolled in, and awards granted in AY 2013.
In total, there were 1,819 students enrolled and 2,035 awards granted by the community colleges in AY 2013. Figure I-8 shows the top five certificate programs that students were enrolled in and awards were granted. The top five areas shown in the figure accounted for 75
Program Review and Investigations Committee Staff Findings and Recommendations: December 19, 2014
20
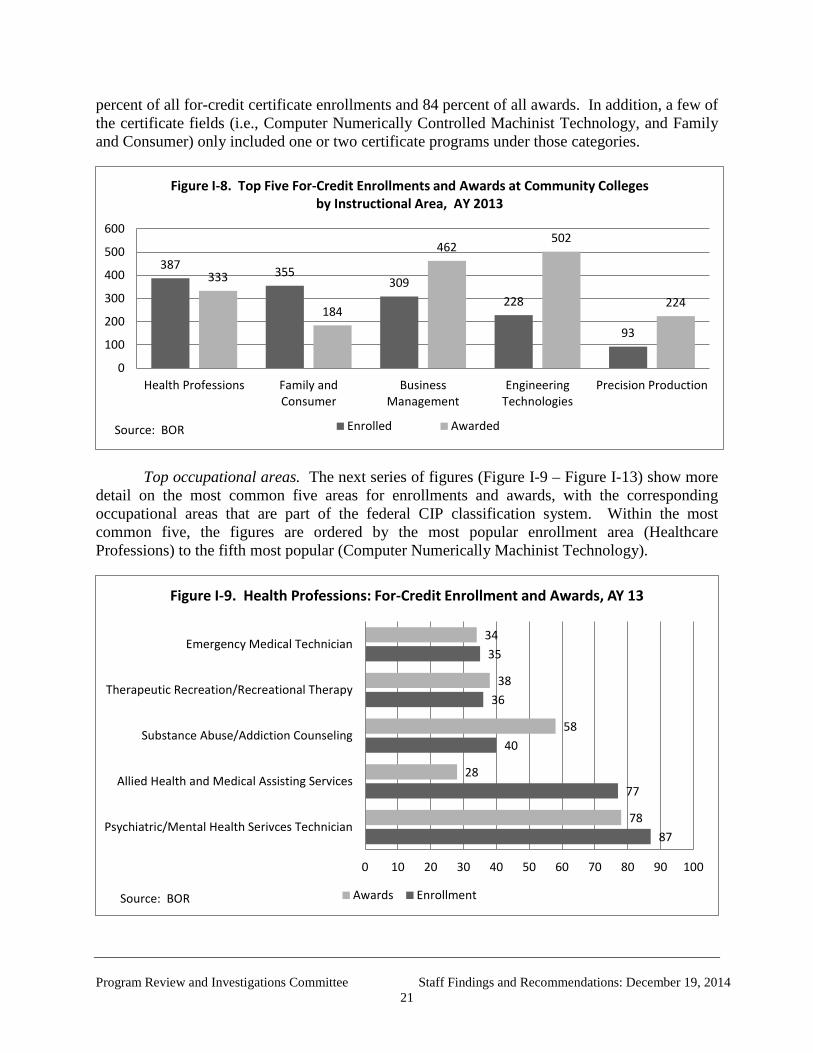
percent of all for-credit certificate enrollments and 84 percent of all awards. In addition, a few of the certificate fields (i.e., Computer Numerically Controlled Machinist Technology, and Family and Consumer) only included one or two certificate programs under those categories.
Top occupational areas. The next series of figures (Figure I-9 – Figure I-13) show more detail on the most common five areas for enrollments and awards, with the corresponding occupational areas that are part of the federal CIP classification system. Within the most common five, the figures are ordered by the most popular enrollment area (Healthcare Professions) to the fifth most popular (Computer Numerically Machinist Technology).
387 355 309
228
93
333
184
462 502
224
0
100
200
300
400
500
600
Health Professions Family andConsumer
BusinessManagement
EngineeringTechnologies
Precision Production
Figure I-8. Top Five For-Credit Enrollments and Awards at Community Colleges by Instructional Area, AY 2013
Enrolled Awarded
87
77
40
36
35
78
28
58
38
34
0 10 20 30 40 50 60 70 80 90 100
Psychiatric/Mental Health Serivces Technician
Allied Health and Medical Assisting Services
Substance Abuse/Addiction Counseling
Therapeutic Recreation/Recreational Therapy
Emergency Medical Technician
Figure I-9. Health Professions: For-Credit Enrollment and Awards, AY 13
Awards Enrollment
Source: BOR
Source: BOR
Program Review and Investigations Committee Staff Findings and Recommendations: December 19, 2014
21
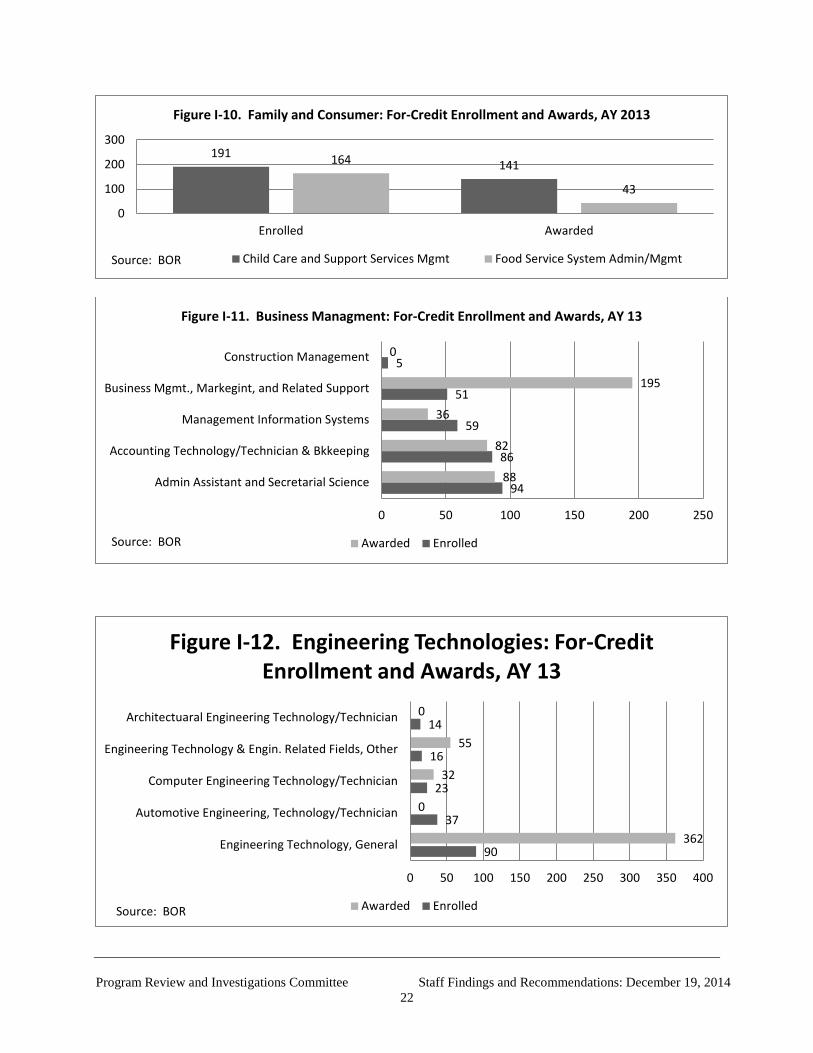
191 141 164
43
0
100
200
300
Enrolled Awarded
Figure I-10. Family and Consumer: For-Credit Enrollment and Awards, AY 2013
Child Care and Support Services Mgmt Food Service System Admin/Mgmt
94
86
59
51
5
88
82
36
195
0
0 50 100 150 200 250
Admin Assistant and Secretarial Science
Accounting Technology/Technician & Bkkeeping
Management Information Systems
Business Mgmt., Markegint, and Related Support
Construction Management
Figure I-11. Business Managment: For-Credit Enrollment and Awards, AY 13
Awarded Enrolled
90
37
23
16
14
362
0
32
55
0
0 50 100 150 200 250 300 350 400
Engineering Technology, General
Automotive Engineering, Technology/Technician
Computer Engineering Technology/Technician
Engineering Technology & Engin. Related Fields, Other
Architectuaral Engineering Technology/Technician
Figure I-12. Engineering Technologies: For-Credit Enrollment and Awards, AY 13
Awarded Enrolled
Source: BOR
Source: BOR
Source: BOR
Program Review and Investigations Committee Staff Findings and Recommendations: December 19, 2014
22
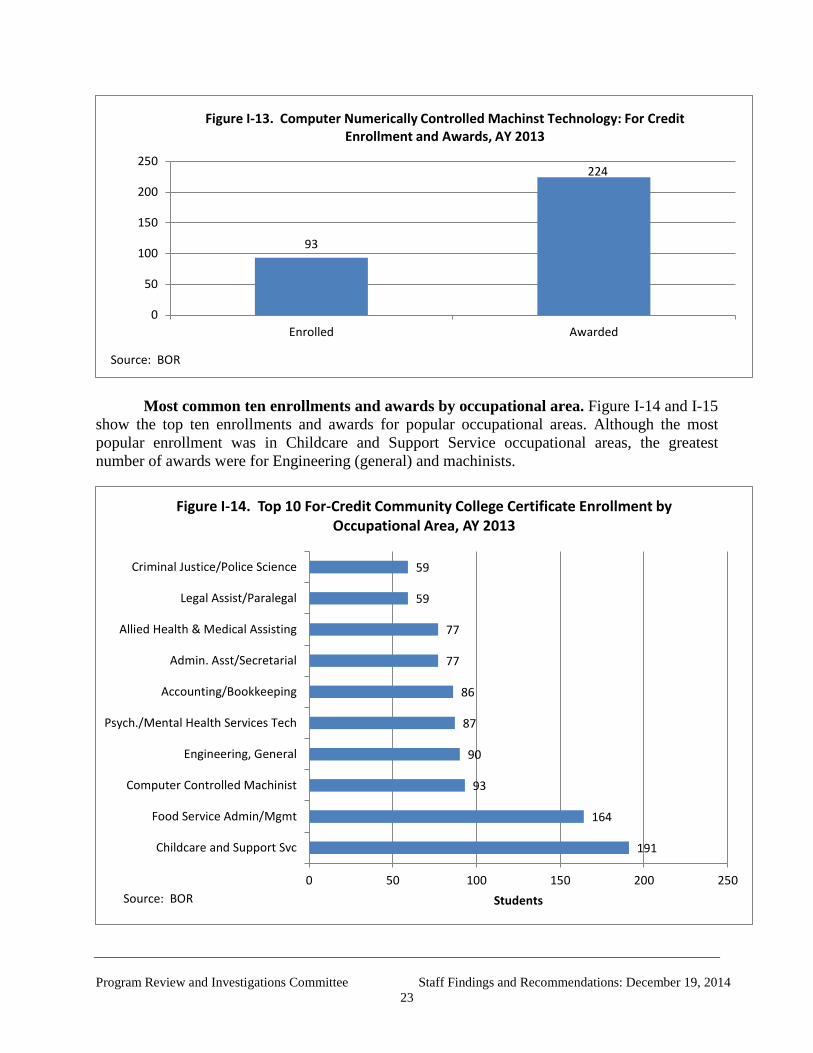
Most common ten enrollments and awards by occupational area. Figure I-14 and I-15 show the top ten enrollments and awards for popular occupational areas. Although the most popular enrollment was in Childcare and Support Service occupational areas, the greatest number of awards were for Engineering (general) and machinists.
93
224
0
50
100
150
200
250
Enrolled Awarded
Figure I-13. Computer Numerically Controlled Machinst Technology: For Credit Enrollment and Awards, AY 2013
191
164
93
90
87
86
77
77
59
59
0 50 100 150 200 250
Childcare and Support Svc
Food Service Admin/Mgmt
Computer Controlled Machinist
Engineering, General
Psych./Mental Health Services Tech
Accounting/Bookkeeping
Admin. Asst/Secretarial
Allied Health & Medical Assisting
Legal Assist/Paralegal
Criminal Justice/Police Science
Students
Figure I-14. Top 10 For-Credit Community College Certificate Enrollment by Occupational Area, AY 2013
Source: BOR
Source: BOR
Program Review and Investigations Committee Staff Findings and Recommendations: December 19, 2014
23
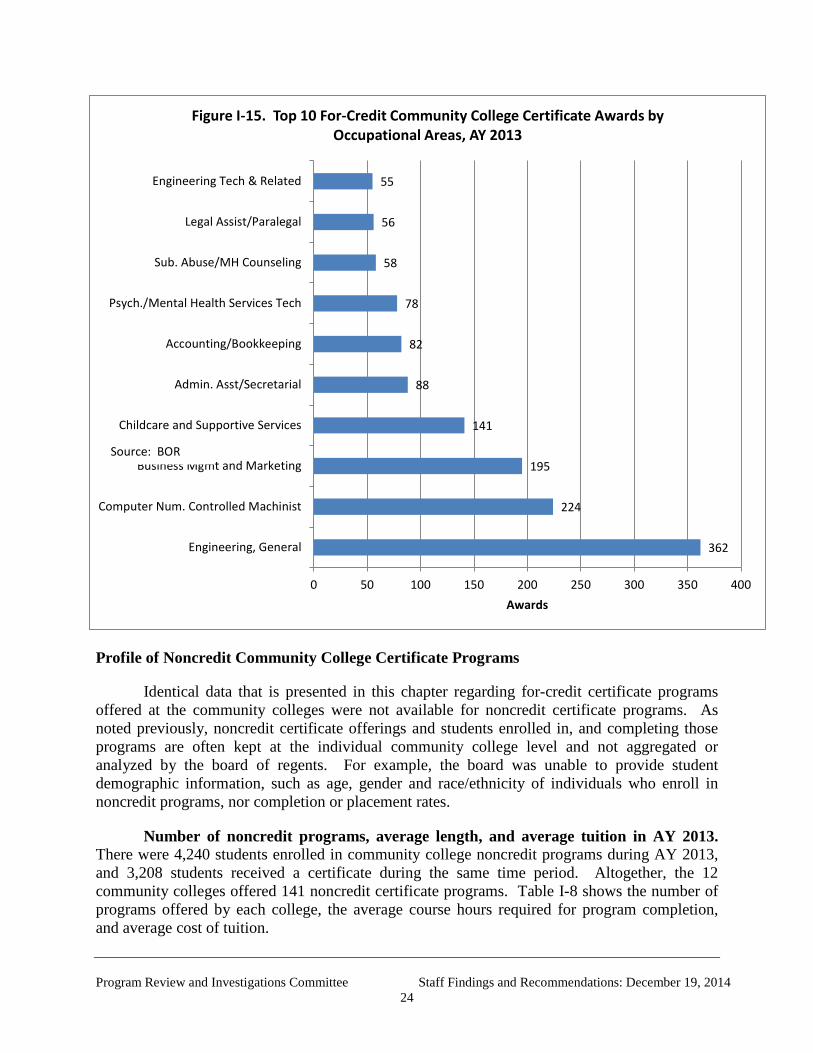
Profile of Noncredit Community College Certificate Programs
Identical data that is presented in this chapter regarding for-credit certificate programs offered at the community colleges were not available for noncredit certificate programs. As noted previously, noncredit certificate offerings and students enrolled in, and completing those programs are often kept at the individual community college level and not aggregated or analyzed by the board of regents. For example, the board was unable to provide student demographic information, such as age, gender and race/ethnicity of individuals who enroll in noncredit programs, nor completion or placement rates.
Number of noncredit programs, average length, and average tuition in AY 2013. There were 4,240 students enrolled in community college noncredit programs during AY 2013, and 3,208 students received a certificate during the same time period. Altogether, the 12 community colleges offered 141 noncredit certificate programs. Table I-8 shows the number of programs offered by each college, the average course hours required for program completion, and average cost of tuition.
362
224
195
141
88
82
78
58
56
55
0 50 100 150 200 250 300 350 400
Engineering, General
Computer Num. Controlled Machinist
Business Mgmt and Marketing
Childcare and Supportive Services
Admin. Asst/Secretarial
Accounting/Bookkeeping
Psych./Mental Health Services Tech
Sub. Abuse/MH Counseling
Legal Assist/Paralegal
Engineering Tech & Related
Awards
Figure I-15. Top 10 For-Credit Community College Certificate Awards by Occupational Areas, AY 2013
Source: BOR
Program Review and Investigations Committee Staff Findings and Recommendations: December 19, 2014
24
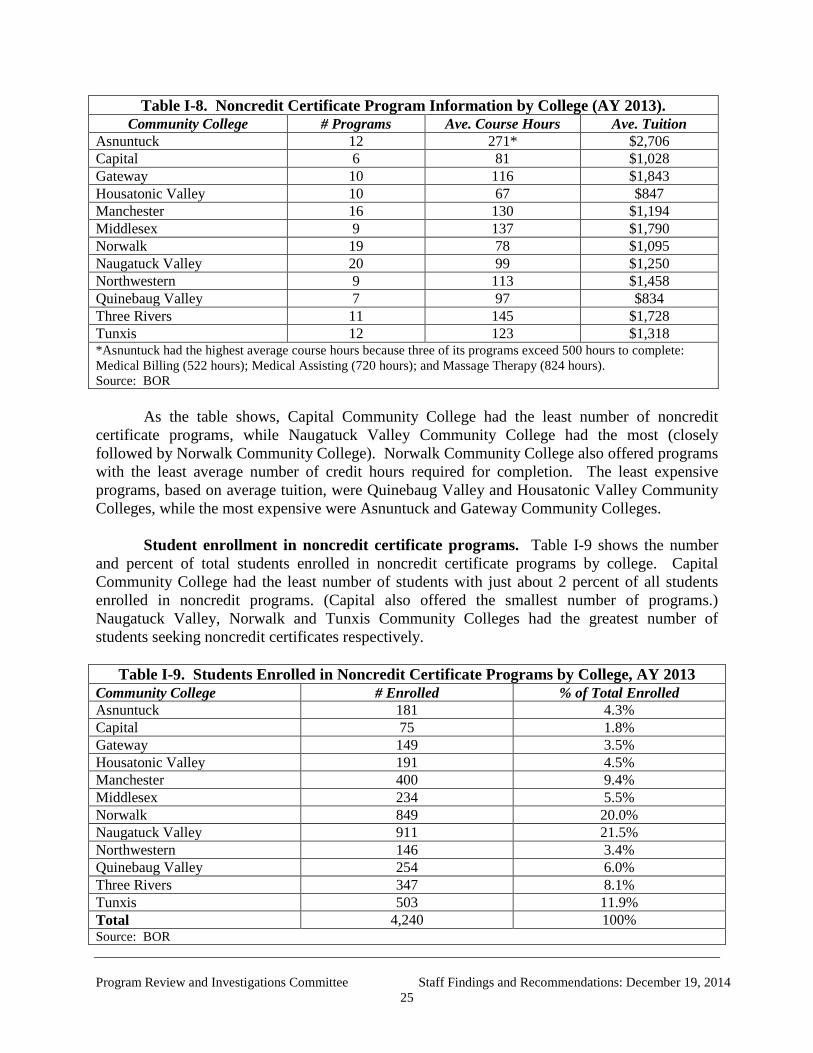
Table I-8. Noncredit Certificate Program Information by College (AY 2013). Community College # Programs Ave. Course Hours Ave. Tuition
Asnuntuck 12 271* $2,706 Capital 6 81 $1,028 Gateway 10 116 $1,843 Housatonic Valley 10 67 $847 Manchester 16 130 $1,194 Middlesex 9 137 $1,790 Norwalk 19 78 $1,095 Naugatuck Valley 20 99 $1,250 Northwestern 9 113 $1,458 Quinebaug Valley 7 97 $834 Three Rivers 11 145 $1,728 Tunxis 12 123 $1,318 *Asnuntuck had the highest average course hours because three of its programs exceed 500 hours to complete: Medical Billing (522 hours); Medical Assisting (720 hours); and Massage Therapy (824 hours). Source: BOR
As the table shows, Capital Community College had the least number of noncredit certificate programs, while Naugatuck Valley Community College had the most (closely followed by Norwalk Community College). Norwalk Community College also offered programs with the least average number of credit hours required for completion. The least expensive programs, based on average tuition, were Quinebaug Valley and Housatonic Valley Community Colleges, while the most expensive were Asnuntuck and Gateway Community Colleges.
Student enrollment in noncredit certificate programs. Table I-9 shows the number
and percent of total students enrolled in noncredit certificate programs by college. Capital Community College had the least number of students with just about 2 percent of all students enrolled in noncredit programs. (Capital also offered the smallest number of programs.) Naugatuck Valley, Norwalk and Tunxis Community Colleges had the greatest number of students seeking noncredit certificates respectively.
Table I-9. Students Enrolled in Noncredit Certificate Programs by College, AY 2013
Community College # Enrolled % of Total Enrolled Asnuntuck 181 4.3% Capital 75 1.8% Gateway 149 3.5% Housatonic Valley 191 4.5% Manchester 400 9.4% Middlesex 234 5.5% Norwalk 849 20.0% Naugatuck Valley 911 21.5% Northwestern 146 3.4% Quinebaug Valley 254 6.0% Three Rivers 347 8.1% Tunxis 503 11.9% Total 4,240 100% Source: BOR
Program Review and Investigations Committee Staff Findings and Recommendations: December 19, 2014
25
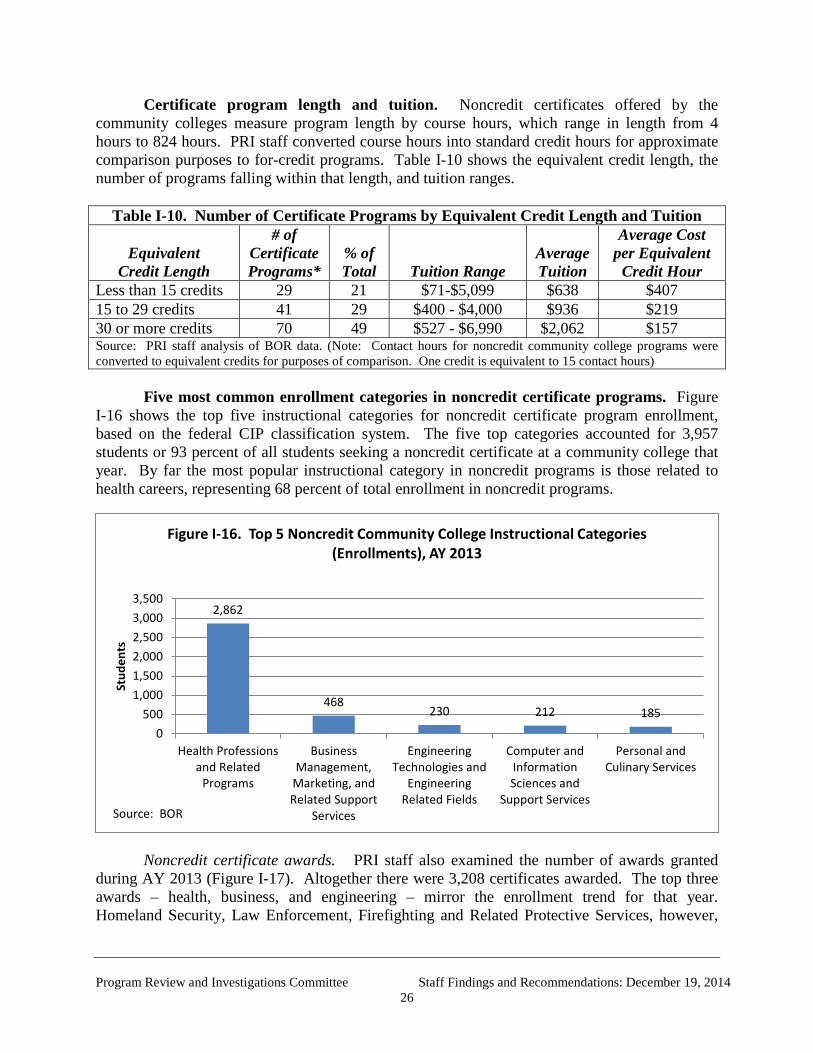
Certificate program length and tuition. Noncredit certificates offered by the community colleges measure program length by course hours, which range in length from 4 hours to 824 hours. PRI staff converted course hours into standard credit hours for approximate comparison purposes to for-credit programs. Table I-10 shows the equivalent credit length, the number of programs falling within that length, and tuition ranges.
Table I-10. Number of Certificate Programs by Equivalent Credit Length and Tuition
Equivalent
Credit Length
# of Certificate Programs*
% of Total
Tuition Range
Average Tuition
Average Cost per Equivalent
Credit Hour Less than 15 credits 29 21 $71-$5,099 $638 $407 15 to 29 credits 41 29 $400 - $4,000 $936 $219 30 or more credits 70 49 $527 - $6,990 $2,062 $157 Source: PRI staff analysis of BOR data. (Note: Contact hours for noncredit community college programs were converted to equivalent credits for purposes of comparison. One credit is equivalent to 15 contact hours)
Five most common enrollment categories in noncredit certificate programs. Figure
I-16 shows the top five instructional categories for noncredit certificate program enrollment, based on the federal CIP classification system. The five top categories accounted for 3,957 students or 93 percent of all students seeking a noncredit certificate at a community college that year. By far the most popular instructional category in noncredit programs is those related to health careers, representing 68 percent of total enrollment in noncredit programs.
Noncredit certificate awards. PRI staff also examined the number of awards granted during AY 2013 (Figure I-17). Altogether there were 3,208 certificates awarded. The top three awards – health, business, and engineering – mirror the enrollment trend for that year. Homeland Security, Law Enforcement, Firefighting and Related Protective Services, however,
2,862
468 230 212 185
0500
1,0001,5002,0002,5003,0003,500
Health Professionsand Related
Programs
BusinessManagement,
Marketing, andRelated Support
Services
EngineeringTechnologies and
EngineeringRelated Fields
Computer andInformationSciences and
Support Services
Personal andCulinary Services
Stud
ents
Figure I-16. Top 5 Noncredit Community College Instructional Categories (Enrollments), AY 2013
Source: BOR
Program Review and Investigations Committee Staff Findings and Recommendations: December 19, 2014
26
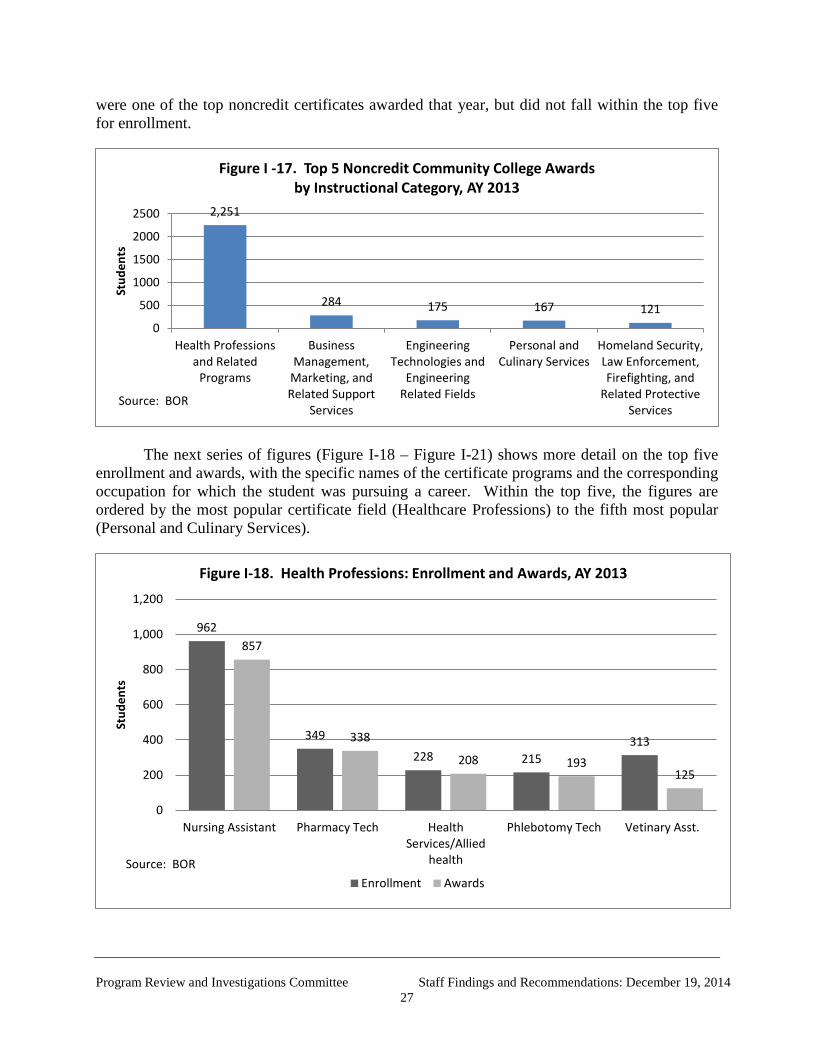
were one of the top noncredit certificates awarded that year, but did not fall within the top five for enrollment.
The next series of figures (Figure I-18 – Figure I-21) shows more detail on the top five enrollment and awards, with the specific names of the certificate programs and the corresponding occupation for which the student was pursuing a career. Within the top five, the figures are ordered by the most popular certificate field (Healthcare Professions) to the fifth most popular (Personal and Culinary Services).
2,251
284 175 167 121 0
500
1000
1500
2000
2500
Health Professionsand Related
Programs
BusinessManagement,
Marketing, andRelated Support
Services
EngineeringTechnologies and
EngineeringRelated Fields
Personal andCulinary Services
Homeland Security,Law Enforcement,Firefighting, and
Related ProtectiveServices
Stud
ents
Figure I -17. Top 5 Noncredit Community College Awards by Instructional Category, AY 2013
962
349
228 215 313
857
338
208 193 125
0
200
400
600
800
1,000
1,200
Nursing Assistant Pharmacy Tech HealthServices/Allied
health
Phlebotomy Tech Vetinary Asst.
Stud
ents
Figure I-18. Health Professions: Enrollment and Awards, AY 2013
Enrollment Awards
Source: BOR
Source: BOR
Program Review and Investigations Committee Staff Findings and Recommendations: December 19, 2014
27

Ten most common enrollments and awards by occupational area. Figure I-22 and I-23 show the top ten enrollments and awards in noncredit certificate programs by occupational areas. The most popular occupational areas, in terms of enrollments and awards, were Patient Care Technicians and Nursing Assistants (CNAs). Similar to enrollments, the majority of the top ten awards were granted in health care occupations, with awards for the Nursing Assistant/Aide
301
118
35 5 4 4
243
31 0 3 4 3
0
100
200
300
400
Real Estate Accounting &Bookkeeping
Tourism andTravel
Admin Assistant General Office &Clerical
Receptionist
Stud
ents
Figure I-19. Business Professions: Enrollment and Awards, AY 2013
Enrollment Awards
164
23
10
9
6
48
22
8
6
6
0 50 100 150 200
Data Processing
Data Entry/Microcomputer Applications
Computer Software & Media Applications
Computer Programming
Computer/IT Admin & Mgmt
Figure I-20. Computer and Information Science: Enrollment and Awards, AY 2013
Awards Enrollment
154 138
31 29
0
100
200
Enrollment Awards
Figure I-21. Personal and Culinary Services: Enrollment and Awards, AY 2013
Bartending Institutional Food Workers
Source: BOR
Source: BOR
Source: BOR
Program Review and Investigations Committee Staff Findings and Recommendations: December 19, 2014
28
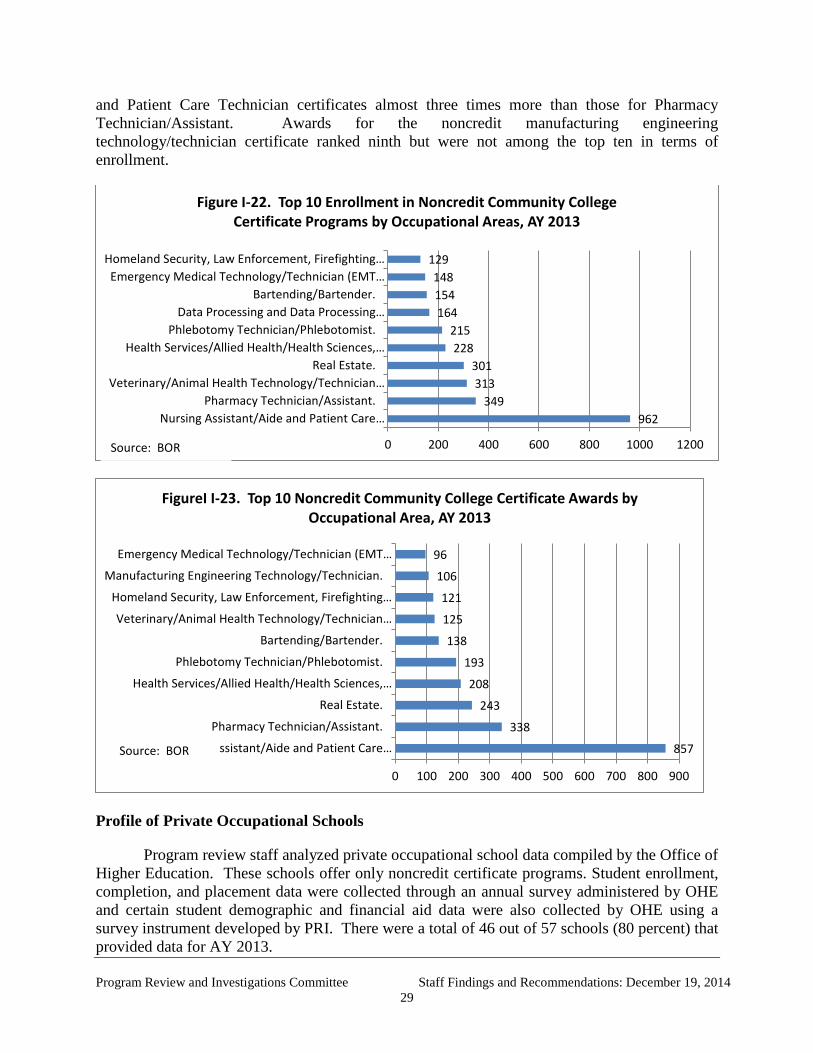
and Patient Care Technician certificates almost three times more than those for Pharmacy Technician/Assistant. Awards for the noncredit manufacturing engineering technology/technician certificate ranked ninth but were not among the top ten in terms of enrollment.
Profile of Private Occupational Schools
Program review staff analyzed private occupational school data compiled by the Office of Higher Education. These schools offer only noncredit certificate programs. Student enrollment, completion, and placement data were collected through an annual survey administered by OHE and certain student demographic and financial aid data were also collected by OHE using a survey instrument developed by PRI. There were a total of 46 out of 57 schools (80 percent) that provided data for AY 2013.
962 349
313 301
228 215
164 154 148
129
0 200 400 600 800 1000 1200
Nursing Assistant/Aide and Patient Care…Pharmacy Technician/Assistant.
Veterinary/Animal Health Technology/Technician…Real Estate.
Health Services/Allied Health/Health Sciences,…Phlebotomy Technician/Phlebotomist.
Data Processing and Data Processing…Bartending/Bartender.
Emergency Medical Technology/Technician (EMT…Homeland Security, Law Enforcement, Firefighting…
Figure I-22. Top 10 Enrollment in Noncredit Community College Certificate Programs by Occupational Areas, AY 2013
857
338
243
208
193
138
125
121
106
96
0 100 200 300 400 500 600 700 800 900
Nursing Assistant/Aide and Patient Care…
Pharmacy Technician/Assistant.
Real Estate.
Health Services/Allied Health/Health Sciences,…
Phlebotomy Technician/Phlebotomist.
Bartending/Bartender.
Veterinary/Animal Health Technology/Technician…
Homeland Security, Law Enforcement, Firefighting…
Manufacturing Engineering Technology/Technician.
Emergency Medical Technology/Technician (EMT…
FigureI I-23. Top 10 Noncredit Community College Certificate Awards by Occupational Area, AY 2013
Source: BOR
Source: BOR
Program Review and Investigations Committee Staff Findings and Recommendations: December 19, 2014
29
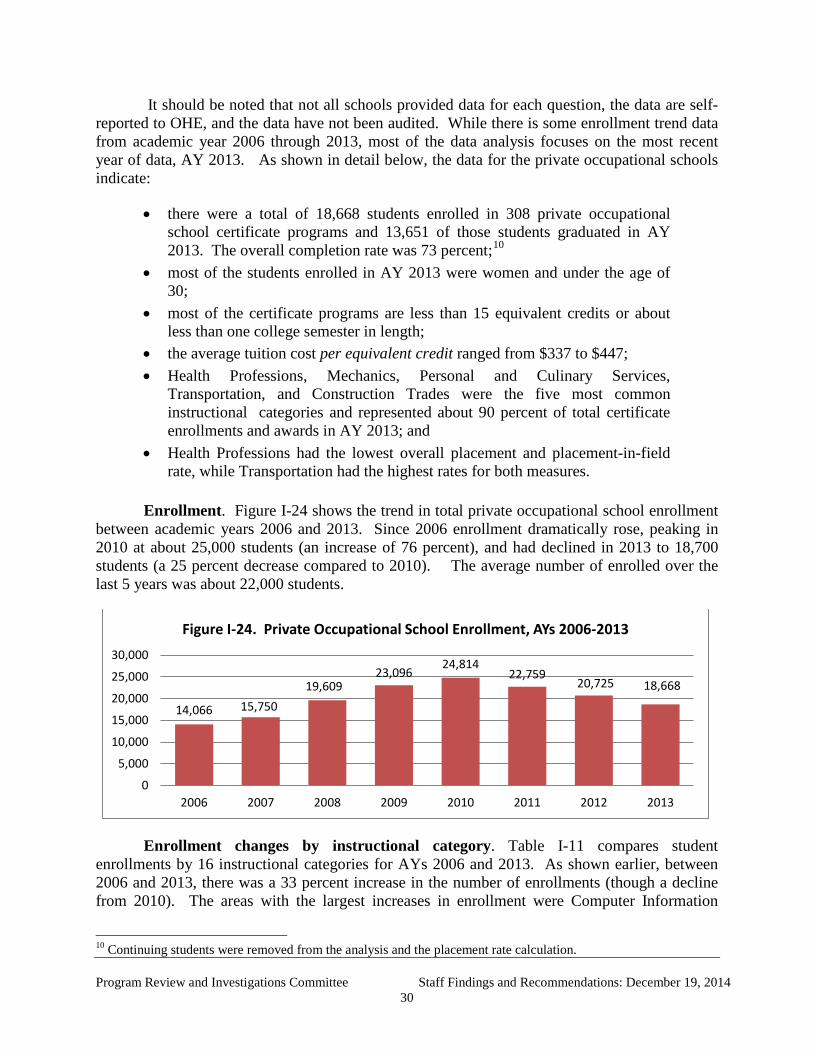
It should be noted that not all schools provided data for each question, the data are self-reported to OHE, and the data have not been audited. While there is some enrollment trend data from academic year 2006 through 2013, most of the data analysis focuses on the most recent year of data, AY 2013. As shown in detail below, the data for the private occupational schools indicate:
• there were a total of 18,668 students enrolled in 308 private occupational school certificate programs and 13,651 of those students graduated in AY 2013. The overall completion rate was 73 percent;10
• most of the students enrolled in AY 2013 were women and under the age of 30;
• most of the certificate programs are less than 15 equivalent credits or about less than one college semester in length;
• the average tuition cost per equivalent credit ranged from $337 to $447; • Health Professions, Mechanics, Personal and Culinary Services,
Transportation, and Construction Trades were the five most common instructional categories and represented about 90 percent of total certificate enrollments and awards in AY 2013; and
• Health Professions had the lowest overall placement and placement-in-field rate, while Transportation had the highest rates for both measures.
Enrollment. Figure I-24 shows the trend in total private occupational school enrollment
between academic years 2006 and 2013. Since 2006 enrollment dramatically rose, peaking in 2010 at about 25,000 students (an increase of 76 percent), and had declined in 2013 to 18,700 students (a 25 percent decrease compared to 2010). The average number of enrolled over the last 5 years was about 22,000 students.
Enrollment changes by instructional category. Table I-11 compares student enrollments by 16 instructional categories for AYs 2006 and 2013. As shown earlier, between 2006 and 2013, there was a 33 percent increase in the number of enrollments (though a decline from 2010). The areas with the largest increases in enrollment were Computer Information
10 Continuing students were removed from the analysis and the placement rate calculation.
14,066 15,750 19,609
23,096 24,814
22,759 20,725 18,668
0
5,000
10,000
15,000
20,000
25,000
30,000
2006 2007 2008 2009 2010 2011 2012 2013
Figure I-24. Private Occupational School Enrollment, AYs 2006-2013
Program Review and Investigations Committee Staff Findings and Recommendations: December 19, 2014
30
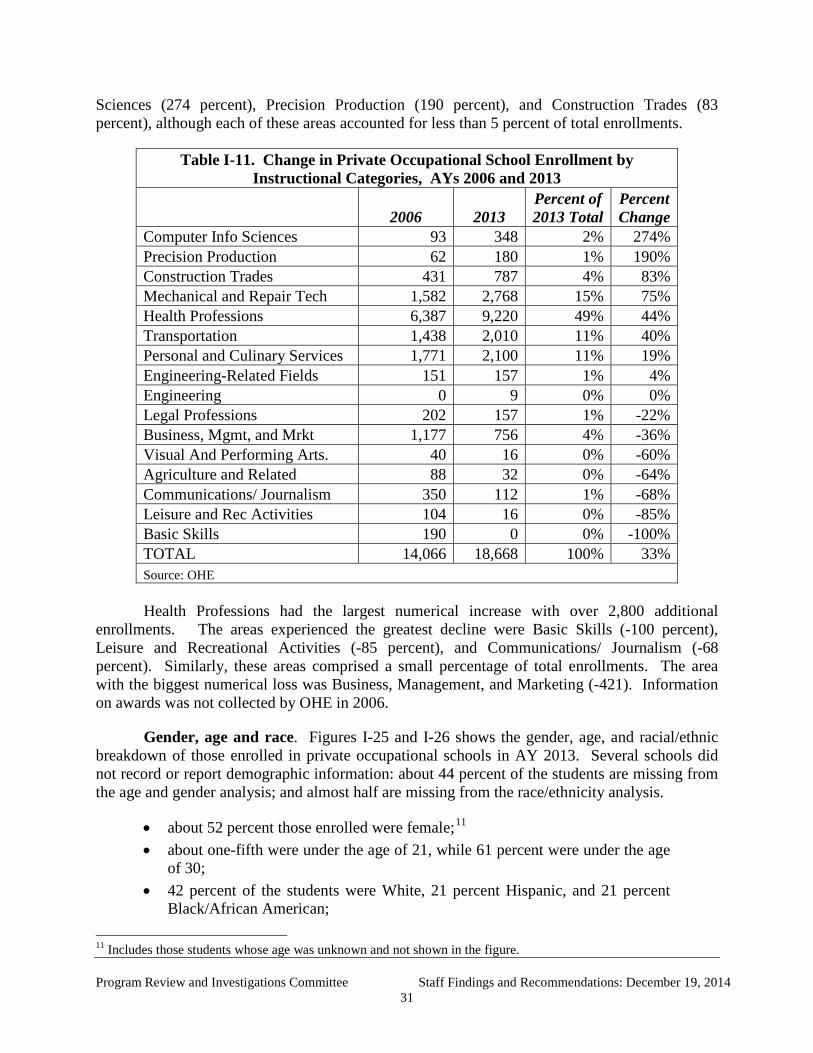
Sciences (274 percent), Precision Production (190 percent), and Construction Trades (83 percent), although each of these areas accounted for less than 5 percent of total enrollments.
Table I-11. Change in Private Occupational School Enrollment by Instructional Categories, AYs 2006 and 2013
2006 2013
Percent of 2013 Total
Percent Change
Computer Info Sciences 93 348 2% 274% Precision Production 62 180 1% 190% Construction Trades 431 787 4% 83% Mechanical and Repair Tech 1,582 2,768 15% 75% Health Professions 6,387 9,220 49% 44% Transportation 1,438 2,010 11% 40% Personal and Culinary Services 1,771 2,100 11% 19% Engineering-Related Fields 151 157 1% 4% Engineering 0 9 0% 0% Legal Professions 202 157 1% -22% Business, Mgmt, and Mrkt 1,177 756 4% -36% Visual And Performing Arts. 40 16 0% -60% Agriculture and Related 88 32 0% -64% Communications/ Journalism 350 112 1% -68% Leisure and Rec Activities 104 16 0% -85% Basic Skills 190 0 0% -100% TOTAL 14,066 18,668 100% 33% Source: OHE Health Professions had the largest numerical increase with over 2,800 additional
enrollments. The areas experienced the greatest decline were Basic Skills (-100 percent), Leisure and Recreational Activities (-85 percent), and Communications/ Journalism (-68 percent). Similarly, these areas comprised a small percentage of total enrollments. The area with the biggest numerical loss was Business, Management, and Marketing (-421). Information on awards was not collected by OHE in 2006.
Gender, age and race. Figures I-25 and I-26 shows the gender, age, and racial/ethnic breakdown of those enrolled in private occupational schools in AY 2013. Several schools did not record or report demographic information: about 44 percent of the students are missing from the age and gender analysis; and almost half are missing from the race/ethnicity analysis.
• about 52 percent those enrolled were female;11 • about one-fifth were under the age of 21, while 61 percent were under the age
of 30; • 42 percent of the students were White, 21 percent Hispanic, and 21 percent
Black/African American;
11 Includes those students whose age was unknown and not shown in the figure. Program Review and Investigations Committee Staff Findings and Recommendations: December 19, 2014
31

• White males (24 percent) were the single largest demographic group; and • about 14 percent of enrolled students were estimated to already hold an
associate’s degree or higher.
Certificate program length. Private occupational schools measure program length in a number of different ways, including clock hours, credit hours, quarter credit hours, lessons, and weeks. Program review staff obtained information on all 722 certificate programs that can be offered by the private occupational schools and are approved by OHE. The various program formats were converted into standard credit hours for approximate comparison purposes. It should be noted that only a portion of the 722 programs are offered at any given time. (In AY 2013, for example, 308 certificate programs were offered). As Table I-12 shows, most of the
0% 2% 8% 10% 10%
6% 4% 6% 3%
0% 0% 2%
9% 9% 10%
7%
4% 5%
3%
0% 0%
5%
10%
15%
20%
25%
0%
5%
10%
15%
20%
25%
Under 18 18-19 20-21 22-24 25-29 30-34 35-39 40-49 50-64 65 andover
Source: OHE
Figure I-25. Private Occupational Schools Enrolled Students by Age/Gender, AY 2013
Female Male
0% 11% 0% 2%
11% 18%
0% 5% 2% 0%
10%
0%
1%
10%
24%
0%
3% 2% 0%
10%
20%
30%
40%
50%
0%
10%
20%
30%
40%
50%
Non-Res.Alien
Black AmerIndian
Asian Hispanic White NativeHawaiian
unknown Two/moreraces
Source: OHE
Figure I-26. Private Occupational Schools Enrolled Students by Race/Ethnicity and Gender, AY 2013
Female Male
Program Review and Investigations Committee Staff Findings and Recommendations: December 19, 2014
32
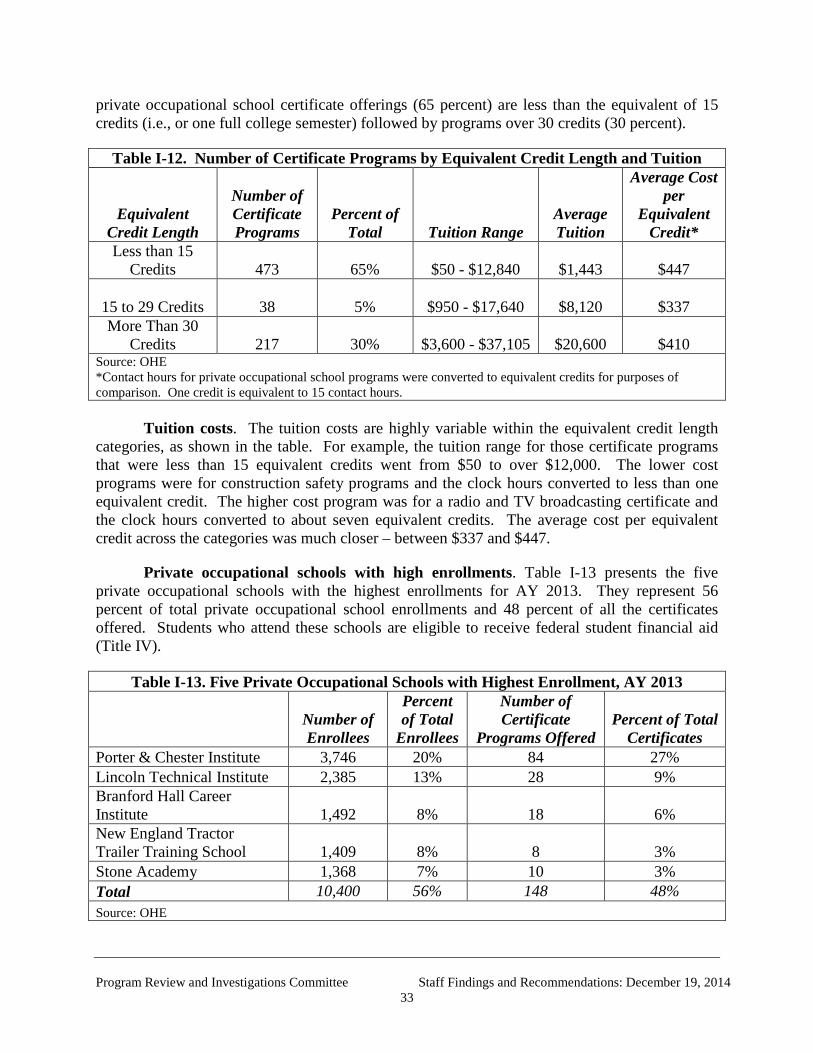
private occupational school certificate offerings (65 percent) are less than the equivalent of 15 credits (i.e., or one full college semester) followed by programs over 30 credits (30 percent).
Table I-12. Number of Certificate Programs by Equivalent Credit Length and Tuition
Equivalent Credit Length
Number of Certificate Programs
Percent of Total Tuition Range
Average Tuition
Average Cost per
Equivalent Credit*
Less than 15 Credits 473 65% $50 - $12,840 $1,443 $447
15 to 29 Credits 38 5% $950 - $17,640 $8,120 $337 More Than 30
Credits 217 30% $3,600 - $37,105 $20,600 $410 Source: OHE *Contact hours for private occupational school programs were converted to equivalent credits for purposes of comparison. One credit is equivalent to 15 contact hours.
Tuition costs. The tuition costs are highly variable within the equivalent credit length categories, as shown in the table. For example, the tuition range for those certificate programs that were less than 15 equivalent credits went from $50 to over $12,000. The lower cost programs were for construction safety programs and the clock hours converted to less than one equivalent credit. The higher cost program was for a radio and TV broadcasting certificate and the clock hours converted to about seven equivalent credits. The average cost per equivalent credit across the categories was much closer – between $337 and $447.
Private occupational schools with high enrollments. Table I-13 presents the five private occupational schools with the highest enrollments for AY 2013. They represent 56 percent of total private occupational school enrollments and 48 percent of all the certificates offered. Students who attend these schools are eligible to receive federal student financial aid (Title IV).
Table I-13. Five Private Occupational Schools with Highest Enrollment, AY 2013
Number of Enrollees
Percent of Total
Enrollees
Number of Certificate
Programs Offered Percent of Total
Certificates Porter & Chester Institute 3,746 20% 84 27% Lincoln Technical Institute 2,385 13% 28 9% Branford Hall Career Institute 1,492 8% 18 6% New England Tractor Trailer Training School 1,409 8% 8 3% Stone Academy 1,368 7% 10 3% Total 10,400 56% 148 48% Source: OHE
Program Review and Investigations Committee Staff Findings and Recommendations: December 19, 2014
33
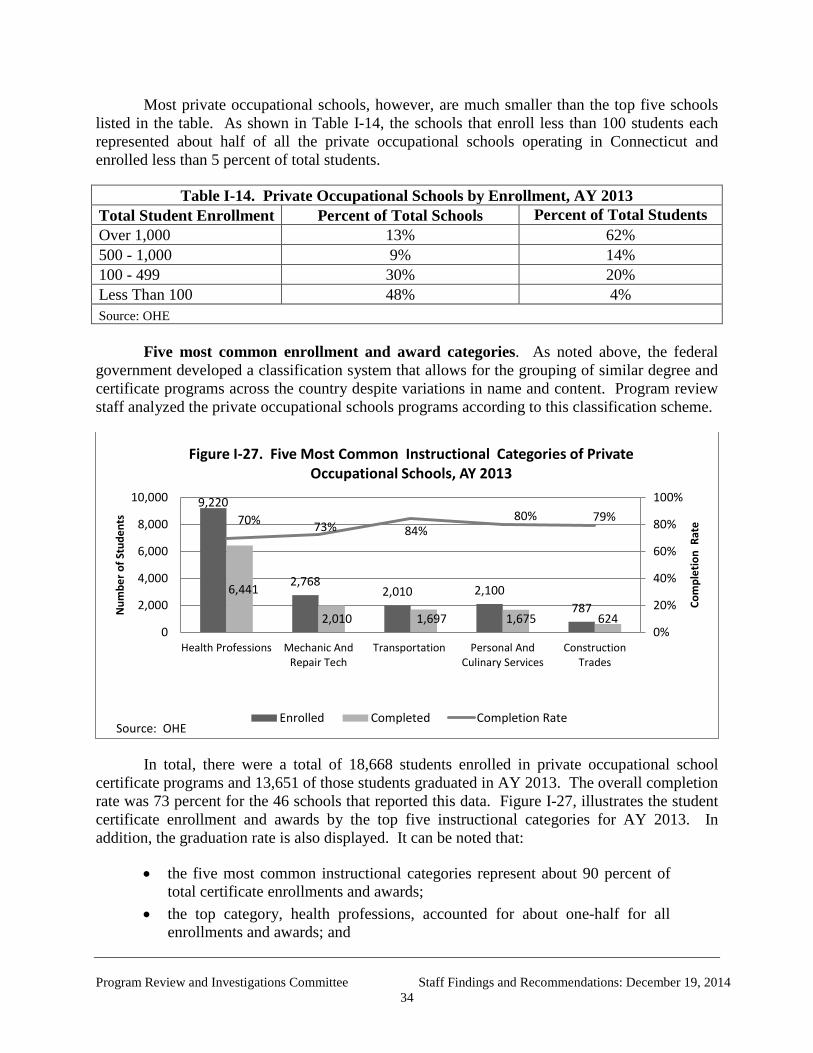
Most private occupational schools, however, are much smaller than the top five schools listed in the table. As shown in Table I-14, the schools that enroll less than 100 students each represented about half of all the private occupational schools operating in Connecticut and enrolled less than 5 percent of total students.
Table I-14. Private Occupational Schools by Enrollment, AY 2013 Total Student Enrollment Percent of Total Schools Percent of Total Students Over 1,000 13% 62% 500 - 1,000 9% 14% 100 - 499 30% 20% Less Than 100 48% 4% Source: OHE
Five most common enrollment and award categories. As noted above, the federal
government developed a classification system that allows for the grouping of similar degree and certificate programs across the country despite variations in name and content. Program review staff analyzed the private occupational schools programs according to this classification scheme.
In total, there were a total of 18,668 students enrolled in private occupational school certificate programs and 13,651 of those students graduated in AY 2013. The overall completion rate was 73 percent for the 46 schools that reported this data. Figure I-27, illustrates the student certificate enrollment and awards by the top five instructional categories for AY 2013. In addition, the graduation rate is also displayed. It can be noted that:
• the five most common instructional categories represent about 90 percent of total certificate enrollments and awards;
• the top category, health professions, accounted for about one-half for all enrollments and awards; and
9,220
2,768 2,010 2,100
787 6,441
2,010 1,697 1,675 624
70% 73% 84% 80% 79%
0%
20%
40%
60%
80%
100%
0
2,000
4,000
6,000
8,000
10,000
Health Professions Mechanic AndRepair Tech
Transportation Personal AndCulinary Services
ConstructionTrades
Com
plet
ion
Rat
e
Num
ber o
f Stu
dent
s
Source: OHE
Figure I-27. Five Most Common Instructional Categories of Private Occupational Schools, AY 2013
Enrolled Completed Completion Rate
Program Review and Investigations Committee Staff Findings and Recommendations: December 19, 2014
34
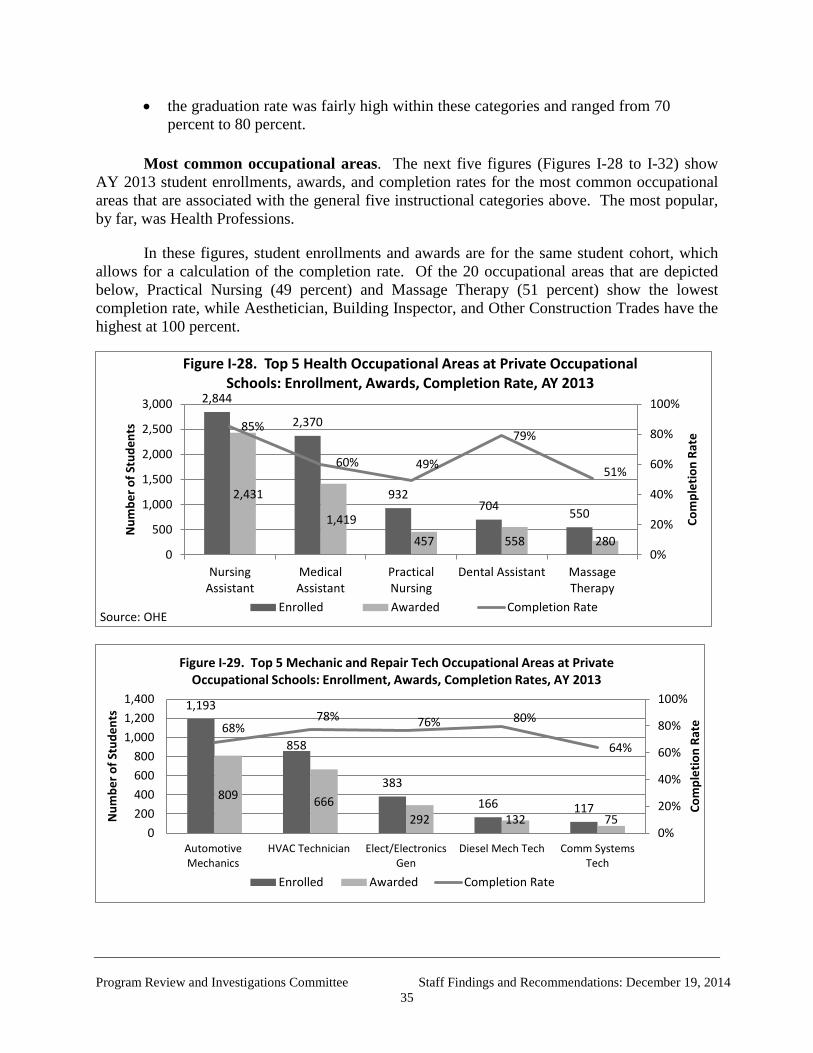
• the graduation rate was fairly high within these categories and ranged from 70 percent to 80 percent.
Most common occupational areas. The next five figures (Figures I-28 to I-32) show
AY 2013 student enrollments, awards, and completion rates for the most common occupational areas that are associated with the general five instructional categories above. The most popular, by far, was Health Professions.
In these figures, student enrollments and awards are for the same student cohort, which allows for a calculation of the completion rate. Of the 20 occupational areas that are depicted below, Practical Nursing (49 percent) and Massage Therapy (51 percent) show the lowest completion rate, while Aesthetician, Building Inspector, and Other Construction Trades have the highest at 100 percent.
2,844
2,370
932 704 550
2,431
1,419
457 558 280
85%
60% 49%
79%
51%
0%
20%
40%
60%
80%
100%
0
500
1,000
1,500
2,000
2,500
3,000
NursingAssistant
MedicalAssistant
PracticalNursing
Dental Assistant MassageTherapy
Com
plet
ion
Rate
Num
ber o
f Stu
dent
s
Source: OHE
Figure I-28. Top 5 Health Occupational Areas at Private Occupational Schools: Enrollment, Awards, Completion Rate, AY 2013
Enrolled Awarded Completion Rate
1,193
858
383 166 117
809 666 292 132 75
68% 78% 76% 80%
64%
0%
20%
40%
60%
80%
100%
0200400600800
1,0001,2001,400
AutomotiveMechanics
HVAC Technician Elect/ElectronicsGen
Diesel Mech Tech Comm SystemsTech
Com
plet
ion
Rate
Num
ber o
f Stu
dent
s
Figure I-29. Top 5 Mechanic and Repair Tech Occupational Areas at Private Occupational Schools: Enrollment, Awards, Completion Rates, AY 2013
Enrolled Awarded Completion Rate
Program Review and Investigations Committee Staff Findings and Recommendations: December 19, 2014
35
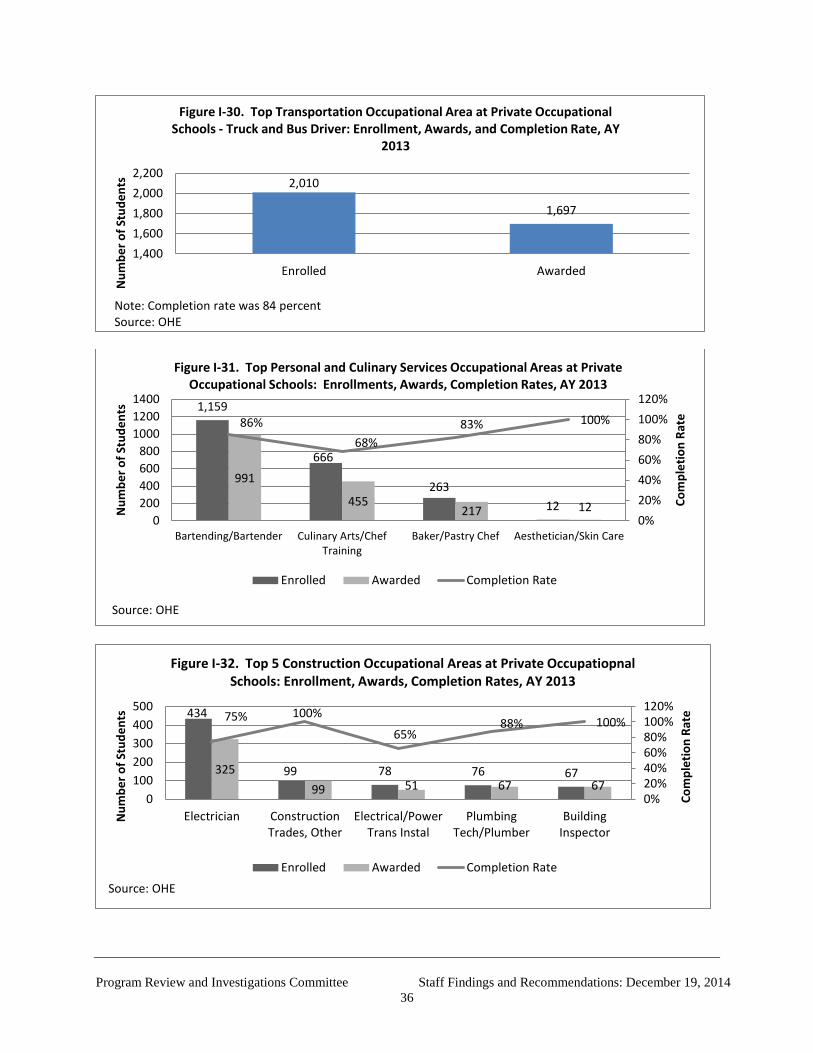
2,010
1,697
1,4001,6001,8002,0002,200
Enrolled Awarded
Num
ber o
f Stu
dent
s
Note: Completion rate was 84 percent Source: OHE
Figure I-30. Top Transportation Occupational Area at Private Occupational Schools - Truck and Bus Driver: Enrollment, Awards, and Completion Rate, AY
2013
1,159
666
263 12
991
455 217 12
86% 68%
83% 100%
0%20%40%60%80%100%120%
0200400600800
100012001400
Bartending/Bartender Culinary Arts/ChefTraining
Baker/Pastry Chef Aesthetician/Skin Care
Com
plet
ion
Rate
Num
ber o
f Stu
dent
s
Source: OHE
Figure I-31. Top Personal and Culinary Services Occupational Areas at Private Occupational Schools: Enrollments, Awards, Completion Rates, AY 2013
Enrolled Awarded Completion Rate
434
99 78 76 67 325 99 51 67 67
75% 100%
65% 88% 100%
0%20%40%60%80%100%120%
0100200300400500
Electrician ConstructionTrades, Other
Electrical/PowerTrans Instal
PlumbingTech/Plumber
BuildingInspector
Com
plet
ion
Rate
Num
ber o
f Stu
dent
s
Source: OHE
Figure I-32. Top 5 Construction Occupational Areas at Private Occupatiopnal Schools: Enrollment, Awards, Completion Rates, AY 2013
Enrolled Awarded Completion Rate
Program Review and Investigations Committee Staff Findings and Recommendations: December 19, 2014
36
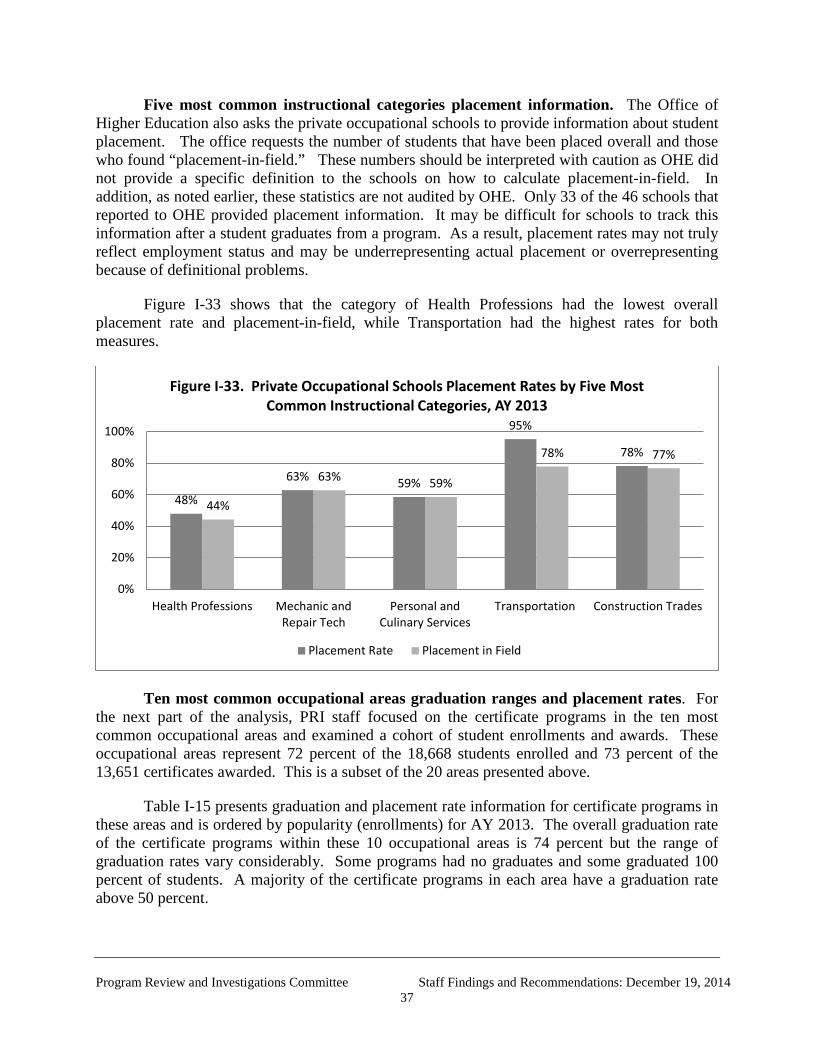
Five most common instructional categories placement information. The Office of Higher Education also asks the private occupational schools to provide information about student placement. The office requests the number of students that have been placed overall and those who found “placement-in-field.” These numbers should be interpreted with caution as OHE did not provide a specific definition to the schools on how to calculate placement-in-field. In addition, as noted earlier, these statistics are not audited by OHE. Only 33 of the 46 schools that reported to OHE provided placement information. It may be difficult for schools to track this information after a student graduates from a program. As a result, placement rates may not truly reflect employment status and may be underrepresenting actual placement or overrepresenting because of definitional problems.
Figure I-33 shows that the category of Health Professions had the lowest overall placement rate and placement-in-field, while Transportation had the highest rates for both measures.
Ten most common occupational areas graduation ranges and placement rates. For the next part of the analysis, PRI staff focused on the certificate programs in the ten most common occupational areas and examined a cohort of student enrollments and awards. These occupational areas represent 72 percent of the 18,668 students enrolled and 73 percent of the 13,651 certificates awarded. This is a subset of the 20 areas presented above.
Table I-15 presents graduation and placement rate information for certificate programs in these areas and is ordered by popularity (enrollments) for AY 2013. The overall graduation rate of the certificate programs within these 10 occupational areas is 74 percent but the range of graduation rates vary considerably. Some programs had no graduates and some graduated 100 percent of students. A majority of the certificate programs in each area have a graduation rate above 50 percent.
48%
63% 59%
95%
78%
44%
63% 59%
78% 77%
0%
20%
40%
60%
80%
100%
Health Professions Mechanic andRepair Tech
Personal andCulinary Services
Transportation Construction Trades
Figure I-33. Private Occupational Schools Placement Rates by Five Most Common Instructional Categories, AY 2013
Placement Rate Placement in Field
Program Review and Investigations Committee Staff Findings and Recommendations: December 19, 2014
37
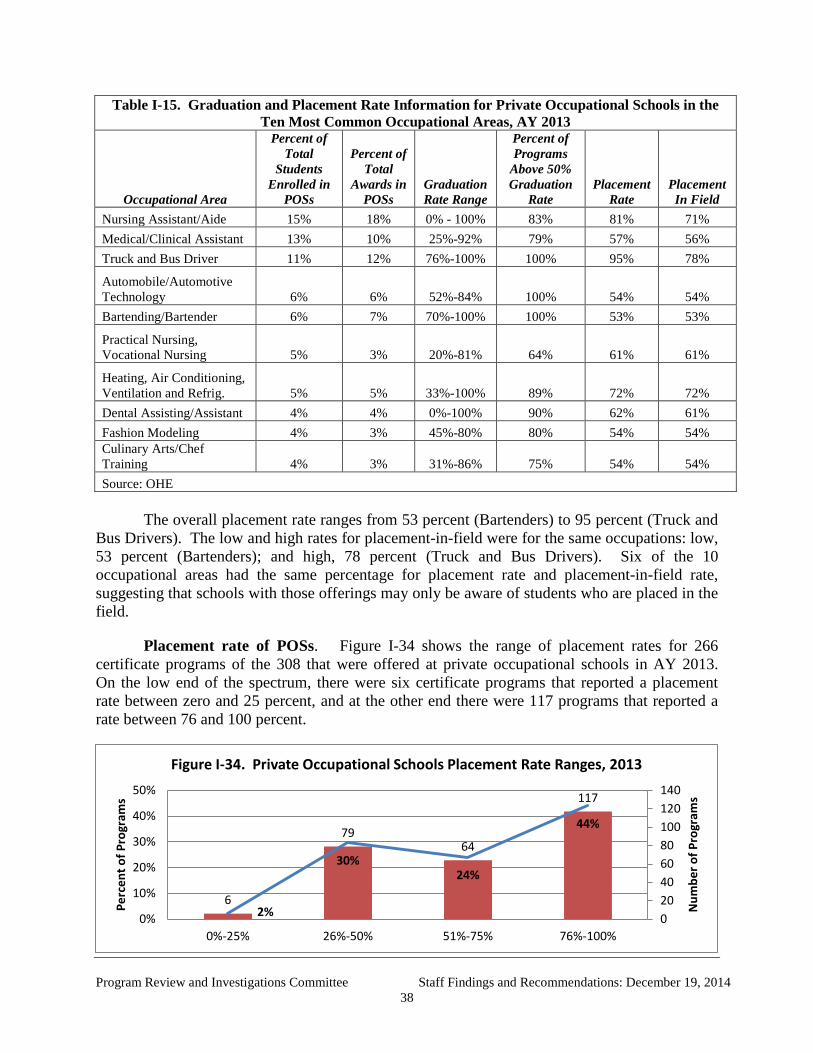
Table I-15. Graduation and Placement Rate Information for Private Occupational Schools in the Ten Most Common Occupational Areas, AY 2013
Occupational Area
Percent of Total
Students Enrolled in
POSs
Percent of Total
Awards in POSs
Graduation Rate Range
Percent of Programs
Above 50% Graduation
Rate Placement
Rate Placement In Field
Nursing Assistant/Aide 15% 18% 0% - 100% 83% 81% 71% Medical/Clinical Assistant 13% 10% 25%-92% 79% 57% 56% Truck and Bus Driver 11% 12% 76%-100% 100% 95% 78%
Automobile/Automotive Technology 6% 6% 52%-84% 100% 54% 54% Bartending/Bartender 6% 7% 70%-100% 100% 53% 53%
Practical Nursing, Vocational Nursing 5% 3% 20%-81% 64% 61% 61%
Heating, Air Conditioning, Ventilation and Refrig. 5% 5% 33%-100% 89% 72% 72% Dental Assisting/Assistant 4% 4% 0%-100% 90% 62% 61% Fashion Modeling 4% 3% 45%-80% 80% 54% 54% Culinary Arts/Chef Training 4% 3% 31%-86% 75% 54% 54% Source: OHE
The overall placement rate ranges from 53 percent (Bartenders) to 95 percent (Truck and
Bus Drivers). The low and high rates for placement-in-field were for the same occupations: low, 53 percent (Bartenders); and high, 78 percent (Truck and Bus Drivers). Six of the 10 occupational areas had the same percentage for placement rate and placement-in-field rate, suggesting that schools with those offerings may only be aware of students who are placed in the field.
Placement rate of POSs. Figure I-34 shows the range of placement rates for 266 certificate programs of the 308 that were offered at private occupational schools in AY 2013. On the low end of the spectrum, there were six certificate programs that reported a placement rate between zero and 25 percent, and at the other end there were 117 programs that reported a rate between 76 and 100 percent.
6
79 64
117
2%
30% 24%
44%
020406080100120140
0%
10%
20%
30%
40%
50%
0%-25% 26%-50% 51%-75% 76%-100%
Num
ber o
f Pro
gram
s
Perc
ent o
f Pro
gram
s
Figure I-34. Private Occupational Schools Placement Rate Ranges, 2013
Program Review and Investigations Committee Staff Findings and Recommendations: December 19, 2014
38
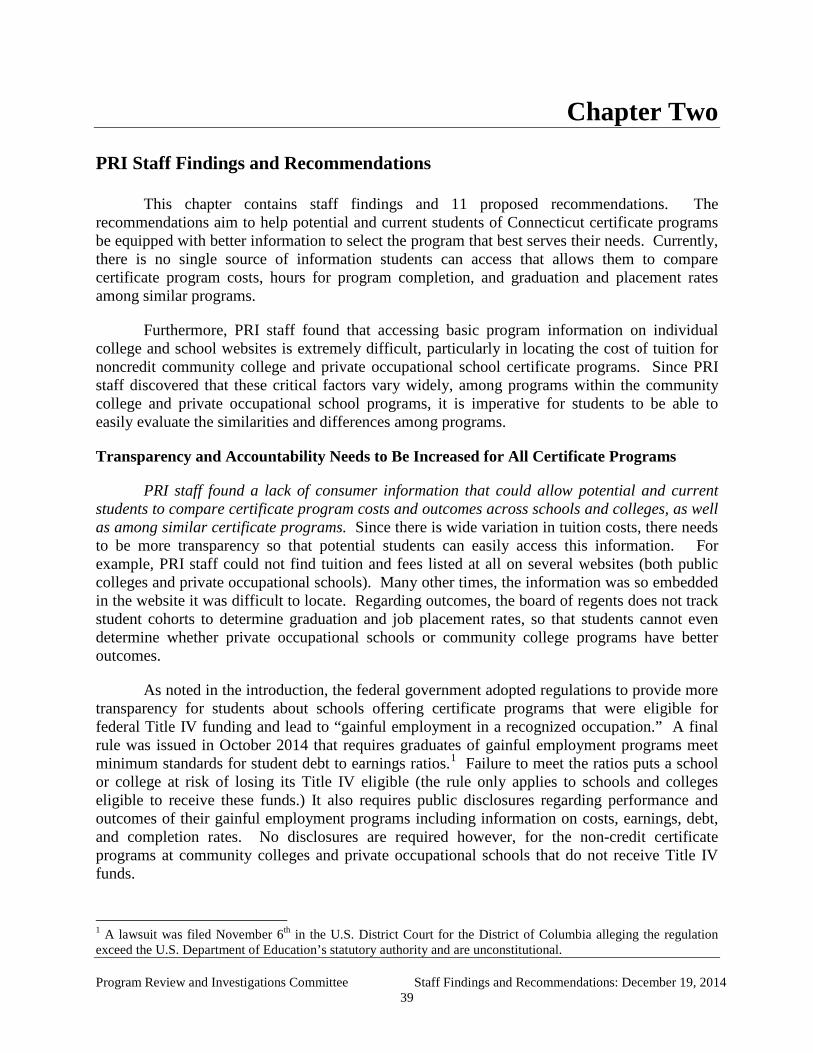
Chapter Two
PRI Staff Findings and Recommendations
This chapter contains staff findings and 11 proposed recommendations. The recommendations aim to help potential and current students of Connecticut certificate programs be equipped with better information to select the program that best serves their needs. Currently, there is no single source of information students can access that allows them to compare certificate program costs, hours for program completion, and graduation and placement rates among similar programs.
Furthermore, PRI staff found that accessing basic program information on individual college and school websites is extremely difficult, particularly in locating the cost of tuition for noncredit community college and private occupational school certificate programs. Since PRI staff discovered that these critical factors vary widely, among programs within the community college and private occupational school programs, it is imperative for students to be able to easily evaluate the similarities and differences among programs.
Transparency and Accountability Needs to Be Increased for All Certificate Programs
PRI staff found a lack of consumer information that could allow potential and current students to compare certificate program costs and outcomes across schools and colleges, as well as among similar certificate programs. Since there is wide variation in tuition costs, there needs to be more transparency so that potential students can easily access this information. For example, PRI staff could not find tuition and fees listed at all on several websites (both public colleges and private occupational schools). Many other times, the information was so embedded in the website it was difficult to locate. Regarding outcomes, the board of regents does not track student cohorts to determine graduation and job placement rates, so that students cannot even determine whether private occupational schools or community college programs have better outcomes.
As noted in the introduction, the federal government adopted regulations to provide more transparency for students about schools offering certificate programs that were eligible for federal Title IV funding and lead to “gainful employment in a recognized occupation.” A final rule was issued in October 2014 that requires graduates of gainful employment programs meet minimum standards for student debt to earnings ratios.1 Failure to meet the ratios puts a school or college at risk of losing its Title IV eligible (the rule only applies to schools and colleges eligible to receive these funds.) It also requires public disclosures regarding performance and outcomes of their gainful employment programs including information on costs, earnings, debt, and completion rates. No disclosures are required however, for the non-credit certificate programs at community colleges and private occupational schools that do not receive Title IV funds.
1 A lawsuit was filed November 6th in the U.S. District Court for the District of Columbia alleging the regulation exceed the U.S. Department of Education’s statutory authority and are unconstitutional. Program Review and Investigations Committee Staff Findings and Recommendations: December 19, 2014
39
The reason the federal government adopted regulations governing what must be disclosed to students and penalizing those schools with poor performance is a belief that a number of students were receiving financial aid for gainful employment programs that:
• were not adequately training students in skills to obtain and maintain jobs; • were providing training for low wage occupations that do not justify program
costs; • had high student withdrawal rates which were leading to high loan default
rates; and • left students with high loan debt, compared to earnings after graduation.
PRI staff believes similar information that may be required under the federal “Gainful
Employment in a Recognized Occupation” regulation should be available to potential and current students regardless of whether an institution is Title IV eligible. Fully 40 percent of students enrolled in private occupational schools in Connecticut in AY 2012 did not fall under federal gainful employment regulations. On the community college side, there were 4,240 students enrolled in noncredit certificate programs in AY 2013, with no aggregated system that allows for program, tuition, and/or outcome comparisons.
Ensuring that students can be easily aware of the costs and outcomes of various programs would serve an important consumer protection function by providing potential students with better information before selecting a certificate program that is offered by multiple colleges or schools. The first step toward accomplishing this is to establish a single website that publishes basic comparative information by type of certificate program. Therefore, PRI staff recommends:
1. The Office of Higher Education shall develop and maintain a cost and
outcome reporting system to provide information about all certificates awarded by public, private, and nonprofit institutions. Each entity shall provide the required data annually, to the office in a uniform format developed by the office. The office shall publish the data provided on its website that allows for basic comparisons to be made among similar types of certificate programs, as well as more detailed program information in a format determined by the office. The detailed profile shall include the following:
a. tuition and fees for a student completing within the normal amount of time based on program length and full- or part-time attendance;
b. typical costs for books and supplies (unless a part of tuition and fees) and the cost of room and board, if applicable;
c. median loan debt incurred by students who completed a for-credit certificate program (separately by Title IV loans and
Program Review and Investigations Committee Staff Findings and Recommendations: December 19, 2014
40
other education debt, including private and institutional loans) and for students completing a noncredit program, if available;
d. enrollments and awards by year;
e. basic demographic information (gender, age, and race/ethnicity);
f. graduation rates for student cohorts completing the program;
g. average time to complete program;
h. job placement rates for students completing the program;
i. entry level starting salary, based on Connecticut DOL statistics;
j. average salary, based on Connecticut DOL statistics;
k. annual/cohort national certification pass rate, (if applicable); and
l. state licensure pass rate, (if applicable).
It is further recommended by PRI staff:
Each college or private occupational school that offers a certificate program shall publish this information on its website as prominently as the certificate program description.
Although some of this information is already available to potential and current students on the National Center for Education Statistics (under the U.S. Department of Education website), it is limited to Title IV funded schools and programs.2 In addition, the national webpage might not be known by students who are interested or enrolled in for-credit programs. The national webpage also has no information for noncredit community college certificate programs and private occupational schools that do not receive Title IV funds.
To ensure the fullest possible disclosure for individuals considering enrolling in a certificate program, information should be available to them at the time they request additional program information and/or an application packet. Therefore, PRI staff also recommends that:
2. Each college or private occupational school shall develop a one-page fact sheet for each certificate program offered that provides basic information to the potential applicant. At a minimum, the fact sheet
2 U.S. Department of Education, National Center for Education Statistics, CollegeNavigator, http://nces.ed.gov/collegenavigator/ Program Review and Investigations Committee Staff Findings and Recommendations: December 19, 2014
41
should include tuition, fees, books and supplies, as well as graduation and placement rates, and average student debt.
PRI staff believes the recommendation directing OHE to develop and maintain a system that provides comparative information across the public and the private system would be a valuable addition to increasing student awareness and promoting informed choice.
BOR’s Process for Collecting and Reporting Certain Data about For-Credit and Noncredit Certificates is Unreliable and Not Comprehensive
Staff found several deficiencies related to the accurate reporting of community college certificate programs offered, student enrollments and completions, as well as certain financial aid and credit accumulation information. These problems were discovered through PRI staff review of various student data for BOR for both for-credit and noncredit certificate programs offered within the community college system. Specific data problems are noted below.
Noncredit Certificates
• A complete dataset of student enrollment and completion for these programs could not be provided due to inconsistencies in how data are entered by the 12 colleges in the board’s administrative system. The board provided information for a portion of its certificate programs -- 141 noncredit programs -- for which an audit trail could be verified. The board could not determine the total number of certificate programs offered in any given year or the total number of students who enrolled and completed noncredit certificate programs.
• For those noncredit programs that could be identified, BOR could not track a cohort of students enrolled in noncredit certificate programs at any college to determine completion rates or the length of time it took students to complete noncredit certificate programs.
• Data could not be provided on overall amounts of financial aid distributed for
noncredit certificate programs by type of aid.3 • BOR does track some information on the number of noncredit certificate
students who take national certification or state licensing examinations and the number who pass these exams. These are important outcome measures. However, PRI staff found that this information was not consistent across colleges. For example, according to data provided by BOR, the same certificate offered at different community colleges qualified students in some colleges to sit for a certification exam and in others colleges it did not. In addition, BOR could not track a cohort of students so that the number who
3 Noncredit programs are not eligible for federal financial aid under Title IV but are eligible for other types of aid. Program Review and Investigations Committee Staff Findings and Recommendations: December 19, 2014
42
took a certification or licensing exam could be compared to the number that passed. Thus, a passing rate could not be calculated.
For-Credit Certificates • The board of regents was reluctant to provide specific data regarding the
completion rates of for-credit certificate programs because it felt the data would be skewed. It is the board’s view that many students who complete a certificate are enrolled in degree programs and meet the requirements for a certificate along the way. Some of these students may not have been formally enrolled in the certificate program and may receive a certificate and degree simultaneously. The board’s data systems are not robust enough to identify these students or untangle this web of information. No data was offered on how many students may actually fall into this situation or regarding the completion rates for students who only obtain a for-credit certificate.
• Although BOR does collect some information on the number of noncredit
certificate students who take national certification or state licensing examinations and the number who pass these exams, it does not attempt to do so with regard to for-credit certificate awardees. Similarly, placement rates of for-credit awardees are not tracked.
• BOR could not identify excess credits obtained by for-credit certificate
students. Concerns are raised about student cost and system efficiency when students accumulate an excessive amount of credits for a certificate or degree program. Part of the difficulty is attributed by BOR to a sizeable portion of students working on an Associate’s Degree and completing a certificate along the way. Credits may be earned in excess of the amount needed for a certificate but are necessary for a degree. However, many studies have been conducted that identify these excess credits among college students and various methodologies exist to measure this phenomenon. In addition, no data was offered that measures excess accumulation of credits for those who register for and only obtain a for-credit certificate.
BOR should be able to identify which and how many students are enrolled in certificate
programs, the financial aid that is expended for them, and the program completion rates. Having an accurate understanding of program activities and outcomes is essential for good management of any enterprise.
Appropriate administrative systems allow management to monitor the performance of the
organization, evaluate any deviations for expected or desired results, identify any necessary improvements, and implement corrective actions in a timely manner. A consequence of an ineffective data management system is that decision makers at all levels fail to accurately understand BOR’s operations and the degree to which certificate programs are meeting the needs of students and the business community. Therefore, the program review staff recommends:
Program Review and Investigations Committee Staff Findings and Recommendations: December 19, 2014
43
3. The board of regents should modify its current administrative systems and practices to permit an accurate accounting, tracking, and reporting of:
a. the number of students enrolled and awarded certificates on a for-credit and noncredit basis, as well as completion rates by certificate program on a cohort basis;
b. the amount of financial aid received by students in certificate programs;
c. an indication of the number of students accumulating excess credits in pursuit of a certificate;
d. the length of time to completion for all students awarded certificates;
e. the number of students who took certification and state licensing examinations, and the pass rates; and
f. placement rates of certificate awardees to the extent possible through using the state’s longitudinal student tracking system (P20 WIN).
Similar Noncredit Certificate Programs Vary Considerably by Community College
PRI staff found considerable variation both across and within for-credit and noncredit community college certificate programs in terms of identical program names but differences in the number of courses required for completion, prerequisites, activities that could be performed upon graduation, and tuition costs. Specifically:
• some community colleges offer certain certificate programs on a for-credit basis, while others offer the same program only as noncredit;
• different community colleges had different tuition for the same noncredit certificate programs, even though many had the same number of course hours for completion;
• the number of hours or classes required for completion also varied for some of the same programs;
• some colleges included the price of text books, uniforms, and/or the cost of sitting for a national certification exam (if one exists) in program tuition, while others do not;
• certificate programs with the same name had different prerequisites for admission; and
• some programs with the same name had different course hours for completion that qualified graduates to perform different tasks and to sit for different national certification exams.
Program Review and Investigations Committee Staff Findings and Recommendations: December 19, 2014
44
Here are some precise examples addressing the issues identified above:4
• A 23 for-credit (seven courses) Computer Programming certificate is offered by Manchester Community College. All of the credits can be applied toward an Associate’s Degree if the student wishes to pursue further education. (Tuition for the sever for-credit courses was $1,001.) On the other hand, Norwalk Community College also offers a Computer Programming certificate, but it is only offered as a noncredit program and so there are no credits can be applied toward a degree. It consists of three noncredit courses and tuition is $1,047.
• Eleven colleges offer a Pharmacy Technician certificate. Most are 60 course hours, but some have additional hours. The cost for the certificate ranges from $775 at Middlesex Community College (60 course hours) to $1,474 at Asnuntuck Community College (72 course hours).
• The cost to sit for the national Pharmacy Technician certification exam ($129)
is included in tuition for the Pharmacy Technician certificate program at Housatonic Valley, while at Three Rivers, tuition covers only the course and the book, and at Tunxis Community College only the coursework is covered.
• A Patient Care Technician certificate was offered by 11 community colleges;
one offers it as a for-credit program and the others as noncredit. In order to be admitted to the Patient Care Technician program at Capital Community College, the applicant must already be a certified nurse aide (CNA) and the program cost is $999. However, at Norwalk Community College, becoming a CNA is part of its Patient Care Technician certification program, along with having the student complete phlebotomy and EKG course and practica and a “customer service for health care professional” course, with tuition of $2,546. Upon completion of the program, students are eligible for phlebotomy and EKG national certification and state-certification as a CNA.
• Gateway Community College has a Patient Care Technician certificate
program with tuition costs of $2,250. Four national certifications can be earned upon successful completion of the three classes in this program: CNA State License; EKG National License; Phlebotomy National License; and the National License for Patient Care Technician.
• At Norwalk Community College the Phlebotomy Technician certificate
program is 75 hours (45 hours of classroom and 30 hours of clinical internship), with tuition of $999. It prepares students to sit for the national certification exam. Tunxis Community College also offers a Phlebotomy
4 The examples were taken directly from spring 2014, fall 2014, and spring 2015 community college program catalogues, and spring 2015 individual college websites, as well as databases provided by BOR. Program Review and Investigations Committee Staff Findings and Recommendations: December 19, 2014
45
Technician certificate program which prepares students to take the national certification exam, but the program is 150 hours and costs $1,850 – double the hours of the Norwalk program and tuition is almost twice as much.
While PRI staff understands that the community colleges need and are designed to have
flexibility to shape noncredit certificate programs to employer need in their region, staff believes this variation creates problems for potential, current, and former students, as well as employers, for several reasons. First, when individuals are considering enrolling in a program, they should be aware that the cost and hours for completion for similarly named certificate programs may be different depending on the college they select. Second, students that graduate from one program in the state and another student that graduates from a program identically named but granted from a different college might have two very different sets of qualifications. Third, employers may not recognize these differences. They therefore might not understand that a certificate from one college does not necessarily mean the qualifications are the same as a certification from another community college. This is particularly true if the job applicant pool can be drawn from graduates of more than one community college in the employers’ region.
PRI staff found the price variation among noncredit certificate programs that provide graduates with the same qualification can be significant. PRI staff believes that when there are critical differences among similarly named certificate programs, students and area employers, should be aware of these differences prior to enrollment. Therefore, PRI staff recommends:
4. The Board of Regents for Higher Education shall appoint a workgroup composed of continuing education deans from the community colleges to undertake a review of all community college noncredit certificate programs. The workgroup’s goal should be to design a uniform naming convention to easily distinguish between noncredit certificate programs with similar and different requirements within the same field of study. Programs that vary should be distinguished using a Level I, Level II (or similar) approach so that enhanced certificate program requirements and qualifications earned are recognized and naming of programs is uniform.
In addition, tuition of similarly named certificate programs leading to the same qualifications should be periodically reviewed to determine if the cost variations are reasonable.
Cost of similar noncredit programs. Since noncredit community college programs are maintained by each college, students most likely find it difficult to identify the differences among similarly named programs offered by different colleges. PRI staff found that trying to locate even just the cost of enrolling in a noncredit certificate program was very difficult. Some colleges do not provide cost information on their websites but requesting the potential applicants telephone the school for more information. When staff did locate the certificate program cost on a community college website, it was often several layers or “clicks” into it, making it difficult to find. Furthermore, a potential student looking to enroll in a certificate program would need to examine each individual college website in order to compare the cost and hours needed for
Program Review and Investigations Committee Staff Findings and Recommendations: December 19, 2014
46
graduation because there is no aggregated information available by the board of regents on noncredit programs.
PRI staff did find a few good examples of easily located information on noncredit certificate costs and requirements. Housatonic Valley Community College has links that show costs of each noncredit program in a single place and can be easily found on the website. Similar to the recommendation made for private occupational schools, PRI staff recommends:
5. The board of regents should ensure the 12 community college websites’ easily identify noncredit certificate program costs.
Another issue that was discussed in interviews held by PRI staff with continuing education deans was that many students enroll in certificate programs that have a national certification examination. Students may only sit for the exam upon completion of the coursework. However the deans noted that one barrier to obtaining the national certification is that students often cannot afford to pay the fee to sit for the exam. According to the deans, the longer a student postpones taking the exam, the higher the rate of exam failure. Some colleges, like Housatonic Valley, include the cost of taking the national exam in the overall noncredit program costs so that students are eligible to sit immediately after coursework is completed, and potentially maximum exam performance. PRI staff believes that this is a best practice and should be replicated across programs requiring a national certification in order for the graduate to secure employment, and therefore recommends:
6. Community colleges should consider including the cost of sitting for a national certification, if applicable, as part of the noncredit tuition and fees for the certificate program.
Other barriers. There are several other strategies that are either being discussed or have been endorsed by the Connecticut Employment and Training Commission (CETC) that will increase the number of students completing certificate programs in order to fill the skills gap that is projected to exist by 2018.5 These strategies are aimed at accelerating a student’s path from education to employment. Current work by CETC has included:
• promoting programs that incorporate a contextualized learning component (i.e, the concept of relating subject matter content to meaningful situations that are relevant to students’ lives.);
• encouraging partnerships between high schools and community colleges so that students can dually obtain a certificate upon graduation from high school or shortly thereafter; and
5 A prominent workforce study has indicated that in Connecticut 65 percent of all jobs will require some type of postsecondary education beyond high school by 2018. The most recent figures indicate Connecticut’s postsecondary education attainment level is about 56 percent. (Anthony Carnevale, Nicole Smith, and Jeff Strohl. 2010. Help Wanted: Projections of Jobs and Education Requirements Through 2018. Washington, D.C.: Georgetown University Center on Education and the Workforce). Program Review and Investigations Committee Staff Findings and Recommendations: December 19, 2014
47
• endorsement of funding for technical career certificate programs that lead to an industry recognized credential upon passage of a state, regional, or national certification or licensure.
Although beyond the scope of this study, PRI staff recognizes that these strategies incorporate best practices and are aimed at ensuring “middle-skill” workers are available to meet workforce demands. Therefore, PRI staff endorses the efforts of CETC to examine and recommend strategies and programs that effectively address barriers to career advance that lead to high-paying jobs.
Approval Process for New Noncredit Certificate Programs Varies Among the Community Colleges
The Board of Regents must formally approve new for-credit certificate programs on forms submitted by a community college when a college is seeking to offer a new program or discontinue a program. For-credit certificate programs, like these and associate degree programs, originate from local campus curriculum development efforts in consultation with local advisory committees whose members include representatives from local business and industry. New programs and modifications undergo a rigorous licensing and accreditation approval process that begins with local campus governance structures. That step is followed by a review by academic leaders across the system, a review and recommendation by the Academic and Student Affairs Committee of the Board of Regents, and finally a review and recommendation by the full board.
For noncredit certificate programs, however, each individual community college determines whether to offer a new program, sets graduation requirements, develops curricula to be used, and establishes cost of tuition and fees. This gives the college more flexibility to quickly offer new programs without having a formal BOR approval process and helps to keep tuition rates low since accreditation and other requirements do not need to be met.
PRI staff believes the authority to approve new noncredit certificate programs should remain at the community college level. There are several benefits to allowing each college to determine the need for and the design of noncredit certificate programs, including creating programs that respond to regional employer need. But PRI staff also believes that uniformity among colleges on the types of information that is examined before approving a new noncredit certificate program should be similar from college to college by standardizing the type of information that is reviewed at the time the program is being developed and the criteria used for approval.
Manchester Community College staff provided PRI with a form that must be completed by each relevant department within the college when it proposes a new noncredit certificate program. Similar to the academic approval questions that must be answered by the college before BOR will approve a new program, the continuing education dean reviews a variety of factors prior to approving a new noncredit program to ensure program enrollment will be adequate to cover the costs of the instructor, and that there is sufficient employer demand for graduates.
Program Review and Investigations Committee Staff Findings and Recommendations: December 19, 2014
48
While the twelve community colleges in the state likely gather this information prior to approving a new noncredit certificate program, PRI staff believes it should be collected in a consistent manner so that each college applies similar criteria prior to program approval.
A review like that used by the Manchester Community College Continuing Education Department could be adopted across the community colleges to help them determine whether a new noncredit certificate program should be offered. To facilitate this discussion, program review committee staff recommends:
7. The Dean of Continuing Education of each of the community colleges, or his or her designee, should establish a workgroup to design a standard form that can be used, internally, by each of the community colleges in reviewing new noncredit programs to determine if the certificate should be approved. The review form should include, but not be limited to the following:
• number of courses needed for completion; • course tuition and fees; • minimum/maximum number of students to make course
economically viable; • labor market information that confirms demand, including
supporting Connecticut Department of Labor data on employment demand;
• community college advisory board recommendations; • names of local employers contacted and responses, with a
requirement to contact at least three employers; • availability of similar programs, including location, tuition, and
enrollment numbers; • how the program will be marketed to students; • source of curriculum and how the department will ensure it is up-
to-date and relevant to the certificate program; • the proposed credentials of potential instructors and how
recruitment will be handled; and • any other considerations.
BOR Does Not Have a Definition of Certificates
Program review staff found that the board of regents does not have an official written definition or clearly defined purpose of certificates that can be communicated to all college deans and academic administrators. This appears to be an oversight. The board of regents does have written procedures that guide certain aspects of the certificate approval process, they the procedures do not actually define a certificate or its purpose.
Program Review and Investigations Committee Staff Findings and Recommendations: December 19, 2014
49
In interviews with BOR staff, certificate programs were generally described as having a defined group or sequence of courses that focus on an area of specialized knowledge and have a career or occupational focus. As noted earlier, certificates commonly emphasize acquisition of specific skills and knowledge that can be readily transferred to the workforce.
Definitions are important because they enable an organization to have a common understanding of a word or subject. They allow all involved to be on the same page when discussing an issue or in this case in developing and offering certificate programs.
Faulty or confusion about definitions can lead to business problems. Business processes are operated by individuals. Without direction, individuals can act in a subjective manner and be prone to interpretation and assumption when complete information is lacking.
Properly defining certificates and their purpose influences the potential success of educational certificates. This is because the process involves determining what is and is not included as a component of a certificate, the value they will provide, who will benefit, how BOR will know if they are successful, and an appropriate approval process. Therefore, program review staff recommends that:
8. The board of regents should develop a written definition and defined purpose of for-credit and noncredit educational certificates.
BOR Has No Comprehensive, Coordinated Marketing Plan for Certificate Programs
A persistent question asked by many is why potential students would select a relatively higher cost private occupational school certificate program over the same generally lower cost community college program? Many of the community college administrators interviewed by PRI staff believe that part of the answer lies in the fact that many students are not aware of the options offered at community colleges. Program review staff found marketing efforts for certificate programs are not comprehensive and not coordinated among the state’s 12 community colleges. There is no board of regent’s plan.
Administrators at three community colleges described their marketing tactics for the noncredit certificate programs based largely on ad hoc or historical approaches. Certificate programs have been often grouped with information about the larger continuing education offerings. The use of mail flyers, newspaper ads, and website updates were the most commonly cited techniques. Most administrators thought the newspaper advertisements and mail flyers were the most effective for noncredit certificate programs.
No specific formal marketing strategies for certificate programs had been developed among those colleges interviewed but one dean did state that she was thinking of developing a more comprehensive and strategic marketing plan. The amount expended for marketing efforts on behalf of the certificate programs at these colleges was not readily available. There was not any comparative information among different colleges to know what strategies were being used or any metrics to know how successful they were.
Higher education is a very competitive arena with robust private sector players, including for-profit providers. The increasing variety of approaches to learning, combined with an array of Program Review and Investigations Committee Staff Findings and Recommendations: December 19, 2014
50
student preferences, means institutions must be able to clearly and quickly convey how their programs align with student needs. The for-profit providers are major competitors for the community colleges. A recent report regarding the for-profit higher education industry, issued by the U.S. Senate Committee on Health, Education, Labor, and Pensions, determined that the 30 companies examined in the report spent less on student instruction than on marketing and advertising. On average, the for-profit colleges analyzed spent almost 23 percent of all revenue on marketing and advertising, far more than most public institutions, the report said, while spending 17 percent on instruction - an average of about $2,050 per student.6
A major purpose of a coordinated marketing plan is to establish a specific direction in marketing and have it synchronized among the 12 community colleges. The goals of marketing should align with the community colleges’ broader strategic objectives. For example, student enrollment at the community colleges has been declining over the last several years. Gaining a larger share of the educational market, increasing awareness among potential students, and building favorable attitudes should be common objectives of any marketing plan. Some assumptions about how to best reach potential students may need to be tested. Though generally declining, the use of postcards and mailings may have their place among certain segments of potential students. However, a more data-driven approach that includes the strategic use of social media and mobile-based applications should be considered. Therefore, Program review staff recommends that:
9. The board of regents should consider developing a more comprehensive approach to make potential students aware of certificate offerings by developing a marketing plan for certificate programs for the 12 community college system. The plan should provide enough direction to ensure alignment with the board’s strategic goals for the system as a whole but flexible enough to recognize the unique market segments which each colleges serves.
OHE Does Not Audit Certain Student Data
The Office of Higher Education (OHE) provides consumer protection for students and potential students at private occupational schools, hospital-based schools, and barber/hairdresser schools in Connecticut. As part of its general oversight responsibility, the office collects student enrollment, graduation, and placement data, as well as certain financial information from private occupational schools. Program review staff obtained this student data to perform a portion of its occupational school analysis. These data are self-reported and PRI staff noted earlier that OHE does not audit or confirm the accuracy of this student data beyond a basic cursory review.
Program review staff are also recommending (see previous recommendation) that additional student and institutional data be collected and combined in a reporting system that would provide comprehensive information about the institutions that offer certificate programs. This type of data provides important information to: consumers that can influence student choice; policymakers about how this aspect of the postsecondary education system is operating;
6 U.S. Senate Committee on Health, Education, Labor and Pensions, For Profit Higher Education: The Failure to Safeguard the Federal Investment and Ensure Student Success, July 30, 2012. Program Review and Investigations Committee Staff Findings and Recommendations: December 19, 2014
51
and institutions themselves for competitive comparison purposes. The integrity of this data effort must be ensured through a verification process.
Auditing would provide an independent check on the accuracy of the numbers provided by the schools and colleges required to provide data. An official examination and verification of student data would help to ensure the accuracy of what is reported to OHE. Inaccurate data leads to misunderstandings about school and college operations. Therefore, the program review staff recommends that:
10. The Office of Higher Education shall develop a program to audit at least a sample of student data from sub-baccalaureate certificate programs of private occupational schools, schools of hairdressing, hospitals-based schools, and the independent colleges and universities on an annual basis.7
OHE Curriculum Evaluators Are Not Paid
OHE’s regulatory oversight responsibilities include the authorization of private occupational schools to operate in Connecticut as well as approval over those schools’ program modifications. The authorization review process includes an examination of various financial, property, employee, and academic information. A critical component of this review is an evaluation of the curriculum for each certificate program. This includes a detailed assessment of courses to be offered, course outlines and syllabi, methods of course delivery, length of courses and overall program, and the qualifications of instructors.
Program review staff found that OHE relies on volunteers to provide expertise in performing curriculum assessments. The range of subject matter that OHE must review can be very technical, ranging from mechanical and information technologies to medical specialties. Having in-house staff to perform reviews requiring such a varied skill set would not be practical or even desirable. However, there is no budget to pay evaluators. OHE may call upon other state agencies to assist in the reviews where possible. For example, an employee from the Department of Motor Vehicles may review tractor trailer schools and an employee from the Department of Public Health may assist with curriculum for Certified Nursing Assistants.
The office performs approximately 25 to 30 curriculum reviews annually. While OHE reports that it has always eventually been able to find someone to assist, there are areas where it struggles to find appropriate evaluators. This struggle has been particularly true in the medical and information technology certificate fields and construction fields (tradesman). The reviews can be demanding requiring several hours of reviewing numerous documents and includes site evaluations. OHE has stated that they rely on individuals taking time off from work or getting permission from employers to perform reviews. At times, reviews have been delayed because of the evaluator’s full-time job demands. Concerns have also been voiced regarding the use of retirees, one of the strategies the office uses. These individuals may not always be up to date on current technology or trends in a given field.
7 The independent colleges and universities include the nonprofit and for-profit institutions of higher education that operate in Connecticut. It does not include public or federal institutions. Program Review and Investigations Committee Staff Findings and Recommendations: December 19, 2014
52
Not having the right person perform these curriculum assessments invites the potential risk of inappropriate course content being taught by unqualified personnel. This could result in graduates with the wrong skill set for the marketplace that would be not only a loss to the student in time and money but, in sufficient volume, a loss to the wider Connecticut economy. Therefore, program review staff recommends that:
11. The Office of Higher Education should develop a cost estimate to fund curriculum evaluators, where needed, and submit such an estimate to the committees of the General Assembly that have cognizance over postsecondary education and appropriations. The office should explore the possibility of using of the private occupational school student protection account to fund this request.8
8 The private occupational school student protection account is funded by an assessment on occupational school’s tuition revenue. The account allows any student enrolled in such a school who is unable to complete a course or unit of instruction at a school because of the insolvency or cessation of operation of the school to apply to the Office of Higher Education for a refund of tuition from the account (C.G.S. Sec. 10a-22u). Program Review and Investigations Committee Staff Findings and Recommendations: December 19, 2014
53

Program Review and Investigations Committee Staff Findings and Recommendations: December 19, 2014
54
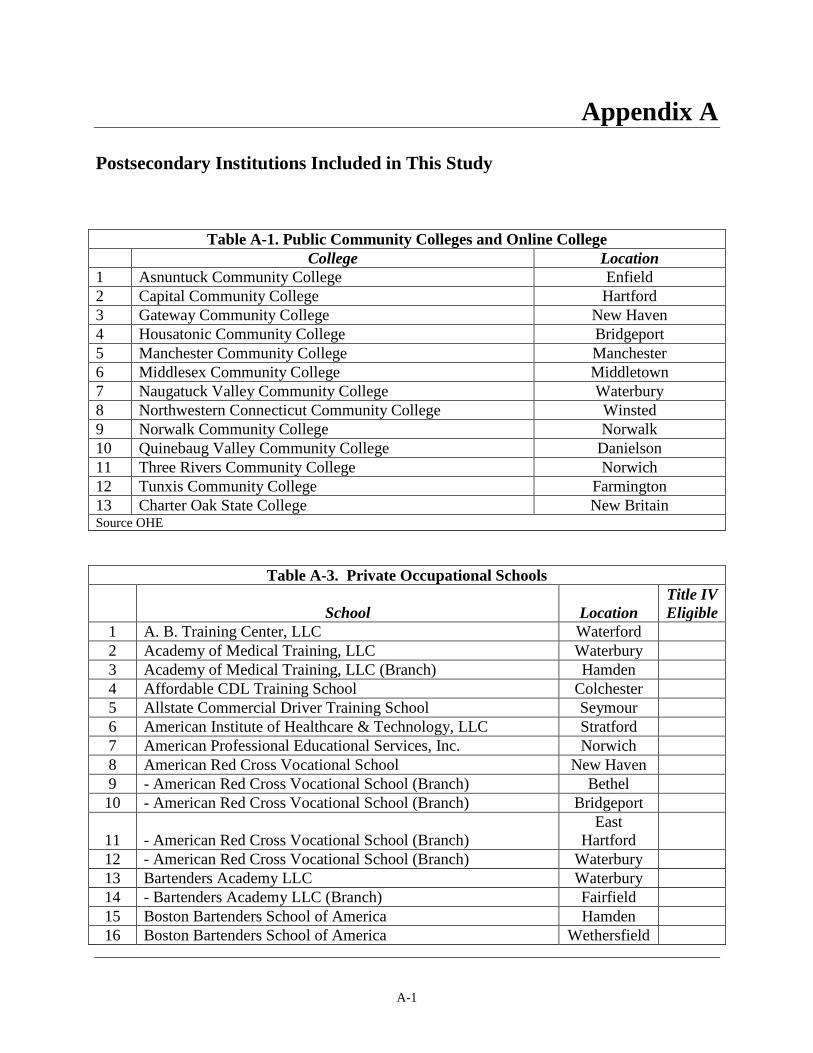
Appendix A
Postsecondary Institutions Included in This Study
Table A-1. Public Community Colleges and Online College College Location
1 Asnuntuck Community College Enfield 2 Capital Community College Hartford 3 Gateway Community College New Haven 4 Housatonic Community College Bridgeport 5 Manchester Community College Manchester 6 Middlesex Community College Middletown 7 Naugatuck Valley Community College Waterbury 8 Northwestern Connecticut Community College Winsted 9 Norwalk Community College Norwalk 10 Quinebaug Valley Community College Danielson 11 Three Rivers Community College Norwich 12 Tunxis Community College Farmington 13 Charter Oak State College New Britain Source OHE
Table A-3. Private Occupational Schools
School Location Title IV Eligible
1 A. B. Training Center, LLC Waterford 2 Academy of Medical Training, LLC Waterbury 3 Academy of Medical Training, LLC (Branch) Hamden 4 Affordable CDL Training School Colchester 5 Allstate Commercial Driver Training School Seymour 6 American Institute of Healthcare & Technology, LLC Stratford 7 American Professional Educational Services, Inc. Norwich 8 American Red Cross Vocational School New Haven 9 - American Red Cross Vocational School (Branch) Bethel 10 - American Red Cross Vocational School (Branch) Bridgeport
11 - American Red Cross Vocational School (Branch) East
Hartford 12 - American Red Cross Vocational School (Branch) Waterbury 13 Bartenders Academy LLC Waterbury 14 - Bartenders Academy LLC (Branch) Fairfield 15 Boston Bartenders School of America Hamden 16 Boston Bartenders School of America Wethersfield
A-1
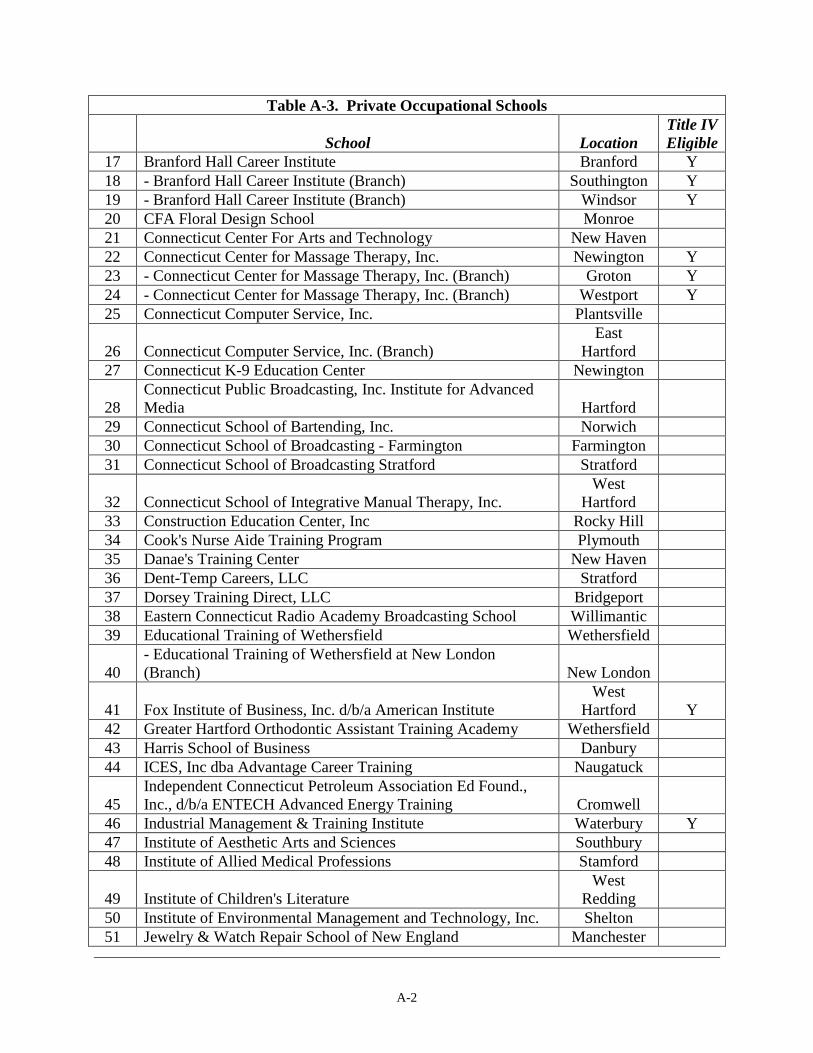
Table A-3. Private Occupational Schools
School Location Title IV Eligible
17 Branford Hall Career Institute Branford Y 18 - Branford Hall Career Institute (Branch) Southington Y 19 - Branford Hall Career Institute (Branch) Windsor Y 20 CFA Floral Design School Monroe 21 Connecticut Center For Arts and Technology New Haven 22 Connecticut Center for Massage Therapy, Inc. Newington Y 23 - Connecticut Center for Massage Therapy, Inc. (Branch) Groton Y 24 - Connecticut Center for Massage Therapy, Inc. (Branch) Westport Y 25 Connecticut Computer Service, Inc. Plantsville
26 Connecticut Computer Service, Inc. (Branch) East
Hartford 27 Connecticut K-9 Education Center Newington
28 Connecticut Public Broadcasting, Inc. Institute for Advanced Media Hartford
29 Connecticut School of Bartending, Inc. Norwich 30 Connecticut School of Broadcasting - Farmington Farmington 31 Connecticut School of Broadcasting Stratford Stratford
32 Connecticut School of Integrative Manual Therapy, Inc. West
Hartford 33 Construction Education Center, Inc Rocky Hill 34 Cook's Nurse Aide Training Program Plymouth 35 Danae's Training Center New Haven 36 Dent-Temp Careers, LLC Stratford 37 Dorsey Training Direct, LLC Bridgeport 38 Eastern Connecticut Radio Academy Broadcasting School Willimantic 39 Educational Training of Wethersfield Wethersfield
40 - Educational Training of Wethersfield at New London (Branch) New London
41 Fox Institute of Business, Inc. d/b/a American Institute West
Hartford Y 42 Greater Hartford Orthodontic Assistant Training Academy Wethersfield 43 Harris School of Business Danbury 44 ICES, Inc dba Advantage Career Training Naugatuck
45 Independent Connecticut Petroleum Association Ed Found., Inc., d/b/a ENTECH Advanced Energy Training Cromwell
46 Industrial Management & Training Institute Waterbury Y 47 Institute of Aesthetic Arts and Sciences Southbury 48 Institute of Allied Medical Professions Stamford
49 Institute of Children's Literature West
Redding 50 Institute of Environmental Management and Technology, Inc. Shelton 51 Jewelry & Watch Repair School of New England Manchester
A-2
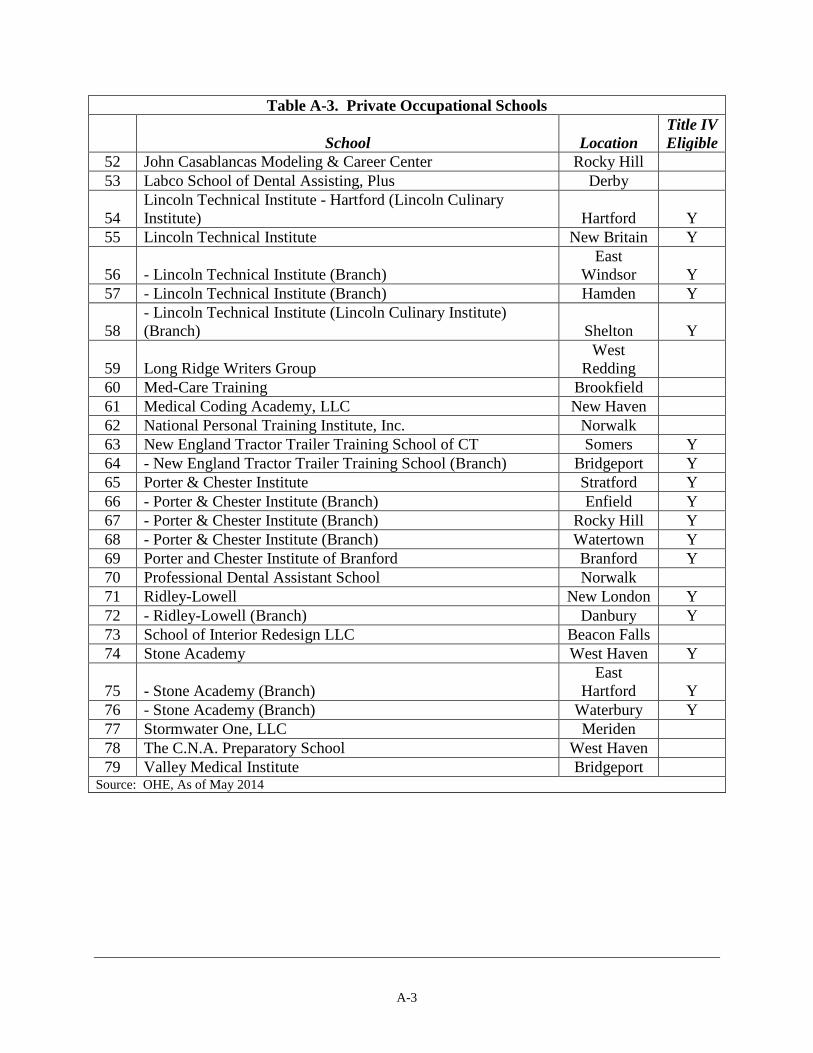
Table A-3. Private Occupational Schools
School Location Title IV Eligible
52 John Casablancas Modeling & Career Center Rocky Hill 53 Labco School of Dental Assisting, Plus Derby
54 Lincoln Technical Institute - Hartford (Lincoln Culinary Institute) Hartford Y
55 Lincoln Technical Institute New Britain Y
56 - Lincoln Technical Institute (Branch) East
Windsor Y 57 - Lincoln Technical Institute (Branch) Hamden Y
58 - Lincoln Technical Institute (Lincoln Culinary Institute) (Branch) Shelton Y
59 Long Ridge Writers Group West
Redding 60 Med-Care Training Brookfield 61 Medical Coding Academy, LLC New Haven 62 National Personal Training Institute, Inc. Norwalk 63 New England Tractor Trailer Training School of CT Somers Y 64 - New England Tractor Trailer Training School (Branch) Bridgeport Y 65 Porter & Chester Institute Stratford Y 66 - Porter & Chester Institute (Branch) Enfield Y 67 - Porter & Chester Institute (Branch) Rocky Hill Y 68 - Porter & Chester Institute (Branch) Watertown Y 69 Porter and Chester Institute of Branford Branford Y 70 Professional Dental Assistant School Norwalk 71 Ridley-Lowell New London Y 72 - Ridley-Lowell (Branch) Danbury Y 73 School of Interior Redesign LLC Beacon Falls 74 Stone Academy West Haven Y
75 - Stone Academy (Branch) East
Hartford Y 76 - Stone Academy (Branch) Waterbury Y 77 Stormwater One, LLC Meriden 78 The C.N.A. Preparatory School West Haven 79 Valley Medical Institute Bridgeport
Source: OHE, As of May 2014
A-3

Appendix B
Outcomes for Community College For-Credit Certificate Graduates
In this appendix, PRI staff present information on certain outcomes for community college for-credit certificate completers. PRI staff requested data from both BOR and DOL to examine employment and wage outcomes of students completing certificates by type of academic program from AYs 2010 through 2014. The purpose was to understand whether education certificate programs were successful in moving individuals into employment in Connecticut and to know in what industries the students were working post-completion. Upon PRI’s request and using the state’s longitudinal student data system (Preschool through 20 and Workforce Information Network, known as P20 WIN), BOR submitted student level data to DOL for matching to employment, wage and industry data. DOL aggregated the data and provided it to PRI analysts. In addition to only releasing aggregated data to PRI, an additional safeguard was followed in that no outcome was reported if it applied to less than six students, to protect the confidentiality of individuals.
It should be noted that the for-credit community college certificate completers represent only about 11 percent of all certificate completers for that time period. Both noncredit community college and private occupational school certificate outcomes could not be analyzed because social security numbers are not collected for those students completing these types of certificate programs. In addition, the private occupational schools are not members of the P20 WIN system.
The analysis below is limited due to the level of data that was provided and time constraints, because, although PRI staff requested the data in August, it was not received until December, just a few days before the report was to be given to the committee. PRI staff attempted to obtain data on the occupational level (i.e., 6-digit CIP code)1 which would be the most detailed information but the data was suppressed due to the limited number of students that would fall into each category. Even for the higher instruction level data that are presented below (i.e., 2-digit CIP code), there was significant suppression of data. The most recent data from AYs 2012 and 2013 are presented below. Data for AY 2014 were incomplete and was not included.
Data Results in Brief
The six types of employment outcomes for community college for-credit certificate completers for AYs 2012 and 2103 are presented in Figure B-1. In general, the data show:
• less than one percent of completers were unemployed both before and after completing a certificate program;
1 The federal government developed a classification system (called the Classification of Instructional Programs, commonly referred to as CIP) that allows for the grouping of similar degree and certificate programs across the country despite variations in name and content. The classification methodology allows for groupings by broad instructional study areas, as well as groupings related to specific occupations.
B-1
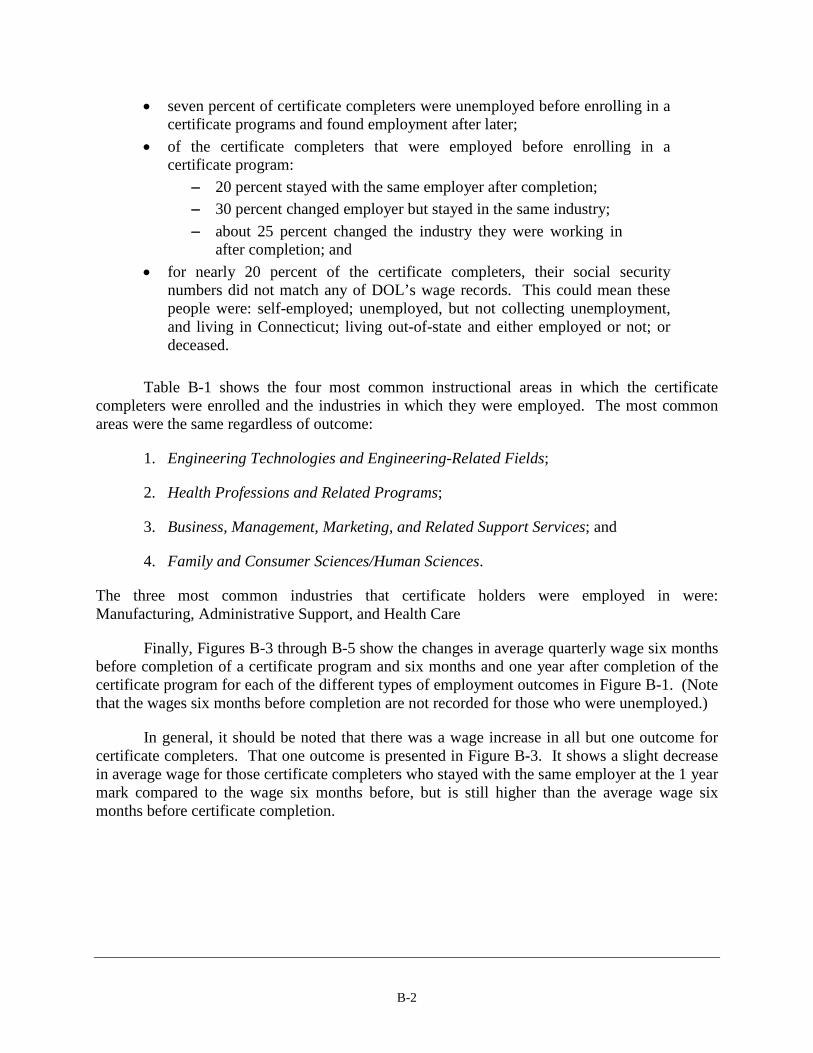
• seven percent of certificate completers were unemployed before enrolling in a certificate programs and found employment after later;
• of the certificate completers that were employed before enrolling in a certificate program:
− 20 percent stayed with the same employer after completion; − 30 percent changed employer but stayed in the same industry; − about 25 percent changed the industry they were working in
after completion; and • for nearly 20 percent of the certificate completers, their social security
numbers did not match any of DOL’s wage records. This could mean these people were: self-employed; unemployed, but not collecting unemployment, and living in Connecticut; living out-of-state and either employed or not; or deceased.
Table B-1 shows the four most common instructional areas in which the certificate
completers were enrolled and the industries in which they were employed. The most common areas were the same regardless of outcome:
1. Engineering Technologies and Engineering-Related Fields;
2. Health Professions and Related Programs;
3. Business, Management, Marketing, and Related Support Services; and
4. Family and Consumer Sciences/Human Sciences.
The three most common industries that certificate holders were employed in were: Manufacturing, Administrative Support, and Health Care
Finally, Figures B-3 through B-5 show the changes in average quarterly wage six months before completion of a certificate program and six months and one year after completion of the certificate program for each of the different types of employment outcomes in Figure B-1. (Note that the wages six months before completion are not recorded for those who were unemployed.)
In general, it should be noted that there was a wage increase in all but one outcome for certificate completers. That one outcome is presented in Figure B-3. It shows a slight decrease in average wage for those certificate completers who stayed with the same employer at the 1 year mark compared to the wage six months before, but is still higher than the average wage six months before certificate completion.
B-2
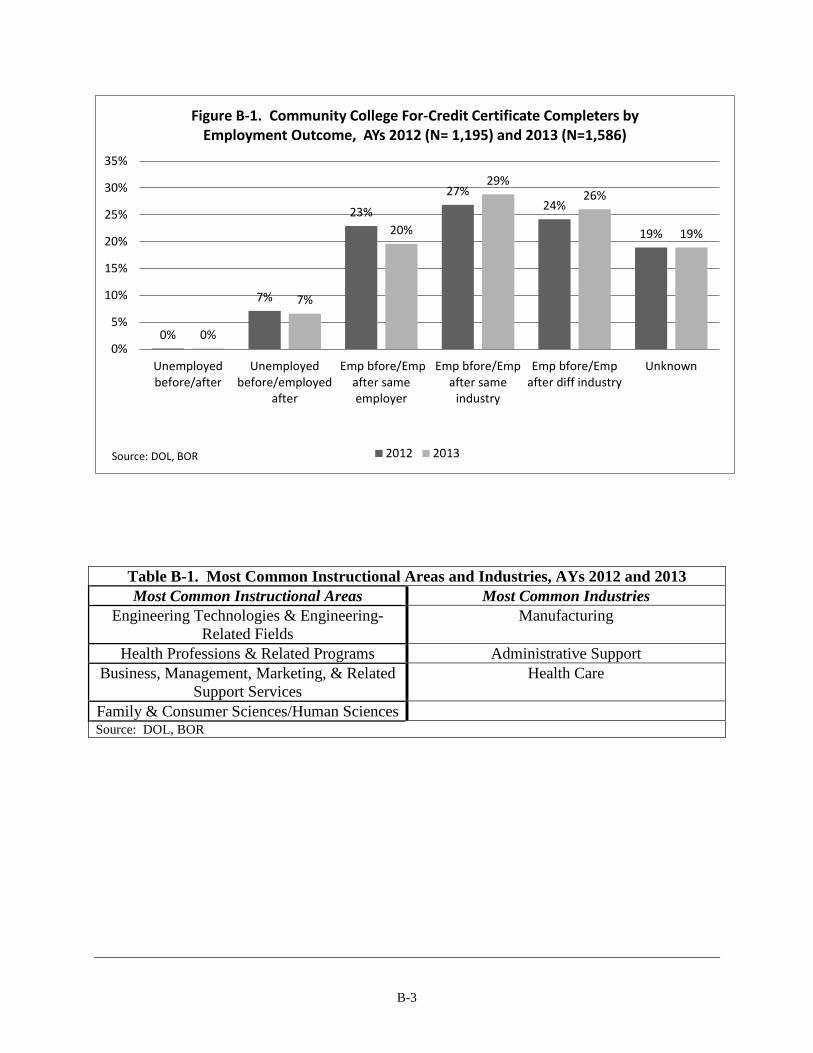
Table B-1. Most Common Instructional Areas and Industries, AYs 2012 and 2013 Most Common Instructional Areas Most Common Industries
Engineering Technologies & Engineering-Related Fields
Manufacturing
Health Professions & Related Programs Administrative Support Business, Management, Marketing, & Related
Support Services Health Care
Family & Consumer Sciences/Human Sciences Source: DOL, BOR
0%
7%
23%
27% 24%
19%
0%
7%
20%
29% 26%
19%
0%
5%
10%
15%
20%
25%
30%
35%
Unemployedbefore/after
Unemployedbefore/employed
after
Emp bfore/Empafter sameemployer
Emp bfore/Empafter same
industry
Emp bfore/Empafter diff industry
Unknown
Source: DOL, BOR
Figure B-1. Community College For-Credit Certificate Completers by Employment Outcome, AYs 2012 (N= 1,195) and 2013 (N=1,586)
2012 2013
B-3
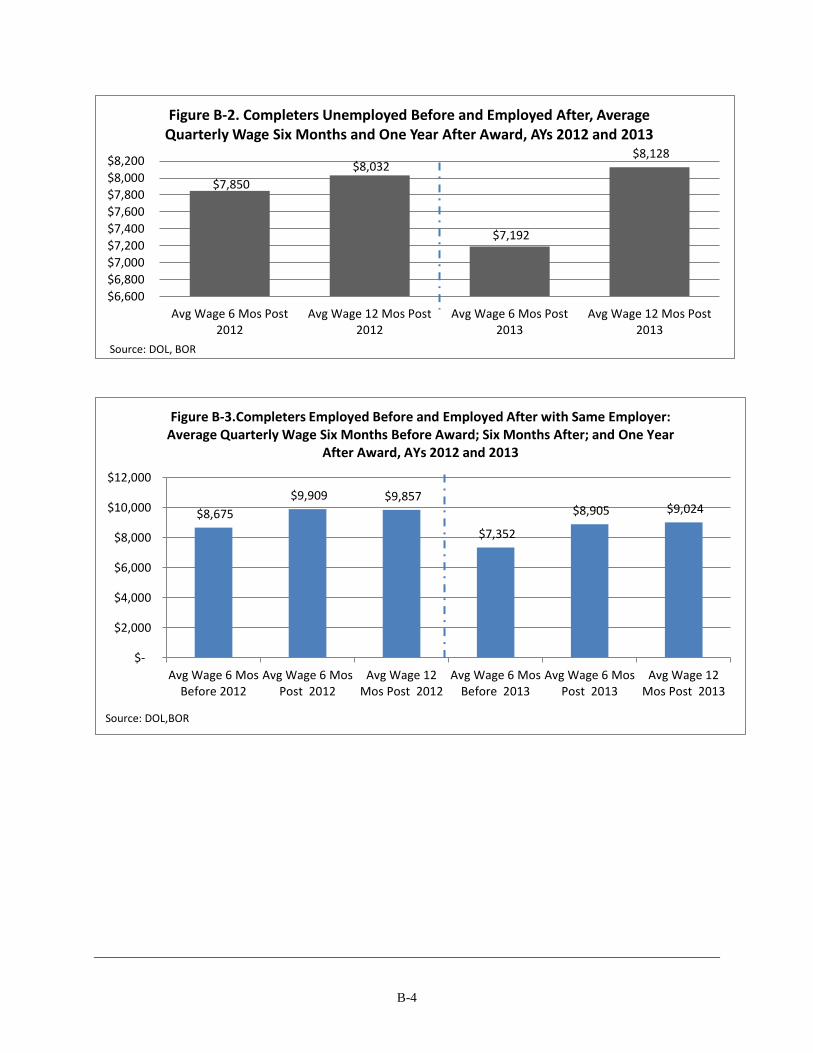
$7,850 $8,032
$7,192
$8,128
$6,600 $6,800 $7,000 $7,200 $7,400 $7,600 $7,800 $8,000 $8,200
Avg Wage 6 Mos Post2012
Avg Wage 12 Mos Post2012
Avg Wage 6 Mos Post2013
Avg Wage 12 Mos Post2013
Source: DOL, BOR
Figure B-2. Completers Unemployed Before and Employed After, Average Quarterly Wage Six Months and One Year After Award, AYs 2012 and 2013
$8,675 $9,909 $9,857
$7,352
$8,905 $9,024
$-
$2,000
$4,000
$6,000
$8,000
$10,000
$12,000
Avg Wage 6 MosBefore 2012
Avg Wage 6 MosPost 2012
Avg Wage 12Mos Post 2012
Avg Wage 6 MosBefore 2013
Avg Wage 6 MosPost 2013
Avg Wage 12Mos Post 2013
Source: DOL,BOR
Figure B-3.Completers Employed Before and Employed After with Same Employer: Average Quarterly Wage Six Months Before Award; Six Months After; and One Year
After Award, AYs 2012 and 2013
B-4
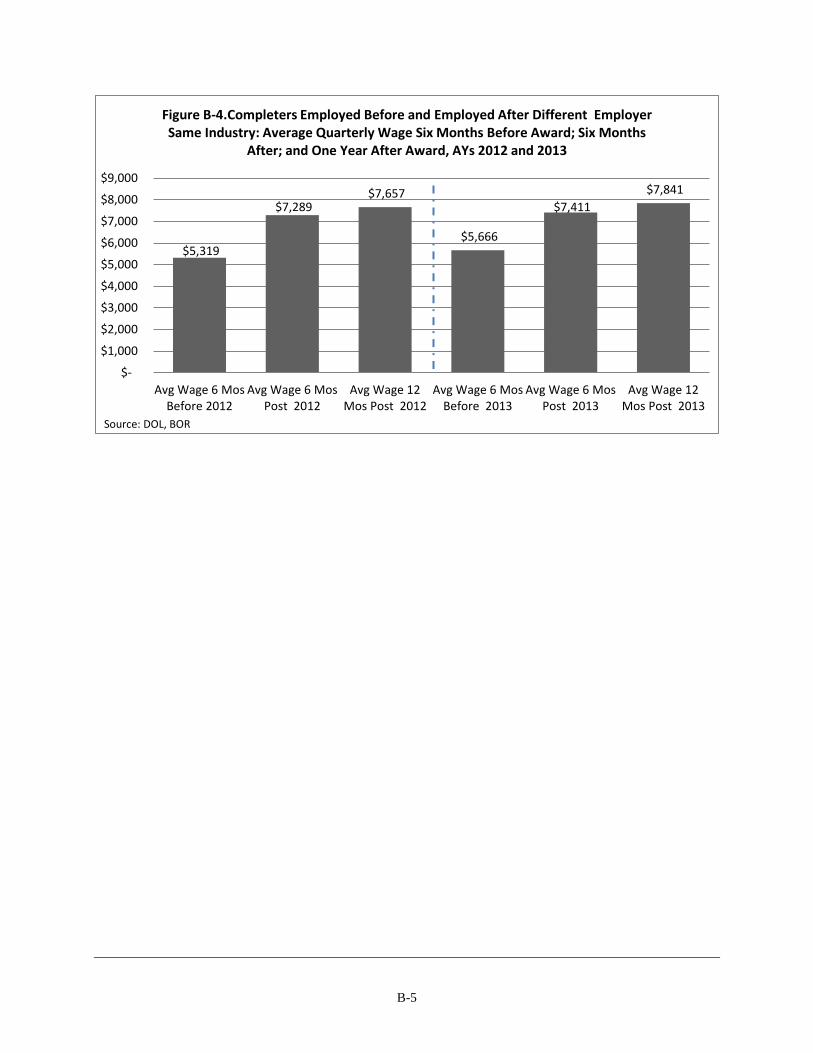
$5,319
$7,289 $7,657
$5,666
$7,411 $7,841
$-
$1,000
$2,000
$3,000
$4,000
$5,000
$6,000
$7,000
$8,000
$9,000
Avg Wage 6 MosBefore 2012
Avg Wage 6 MosPost 2012
Avg Wage 12Mos Post 2012
Avg Wage 6 MosBefore 2013
Avg Wage 6 MosPost 2013
Avg Wage 12Mos Post 2013
Source: DOL, BOR
Figure B-4.Completers Employed Before and Employed After Different Employer Same Industry: Average Quarterly Wage Six Months Before Award; Six Months
After; and One Year After Award, AYs 2012 and 2013
B-5