Embed Size (px)
Citation preview

Background Briefing
HIGHER EDUCATION
Kyle I. Jen, Deputy Director
December 2011
The fiscal information in this background briefing is based on data through December 31, 2011.

House Fiscal Agency: December 2011 2
Higher Education
Article VIII of the State Constitution:
Section 4: Requires Legislature to appropriate funds to maintain Michigan’s 15 public universities.
Section 5: Provides for elected boards of control for University of Michigan, Michigan State, and Wayne State.
Section 6: Provides for appointed boards of control for remaining universities. Sections 5 and 6: Grants each university board control and direction of all
expenditures from institution’s funds.
Beginning in FY 2011-12, the Higher Education budget is included in the compiled School Aid Act, rather than a standard one-year budget bill.

Higher Education: Gross AppropriationsFY 2011-12 Higher Education appropriations are $480.7 million lowerthan they were in FY 2002-03 (26.1 percent, not adjusting for inflation).
Note: Delayed payments in 2004 and 2007 shown in original year funds
were appropriated.$1,845
$1,697 $1,680 $1,734 $1,749 $1,748 $1,754
$1,612 $1,578
$1,364
FY 2003 FY 2004 FY 2005 FY 2006 FY 2007 FY 2008 FY 2009 FY 2010 FY 2011 FY 2012
Mill
ions
Gross
GF/GP
3House Fiscal Agency: December 2011

Higher Education Share of State GF/GP
FY 2011-12 GF/GP Total = $8,626,998,900
Community Health$2,961,974,600
34.3%
Corrections$1,874,836,200
21.7%
Higher Education$1,065,632,500
12.4%
Community Colleges
$88,000,000 1.0%
Human Services$1,024,639,400
11.9%
Other$964,156,100
11.2%
Debt Service$382,284,100
4.4%
State Police$265,476,000
3.1%
Higher Education makes up 12.4% of the total state GF/GP budget
4House Fiscal Agency: December 2011

Higher Education Share of School Aid Fund
School Aid$10,887,098,700
96.5% Higher Education$200,019,500
1.8%
Community Colleges
$195,880,500 1.7%
House Fiscal Agency: December 2011 5
The Higher Education budget receives 1.8% of the total state School Aid Fund (SAF)
FY 2011-12 SAF Total = $11,282,998,700

SOURCES OF FUNDING

Higher Education Funding Sources
State Restricted$200,219,500
14.7%
State GF/GP$1,065,632,500
78.1%
Federal$98,326,400
7.2%
FY 2011-12 Higher Education Budget = $1,364,178,400
In FY 2011-12, School Aid Fund revenue is being utilized to replace$200.0 million in GF/GP funding for public universities. Federal TANF funds
have replaced state funds for major financial aid programs.
7House Fiscal Agency: December 2011

HIGHER EDUCATIONAPPROPRIATIONS

Higher Education Appropriations
The Higher Education budget contains:
• Operational support to the state’s 15 public universities
• Support for the Agricultural Experiment Station and Cooperative Extension Service operated by Michigan State University
• Funding for financial aid programs for students attending either public or private colleges/universities in Michigan
• Funding for various smaller higher education-related budget items
All but 7.5% of FY 2009-10 Higher Education funding is appropriated to the 15 public universities for operations or other purposes (Ag Experiment/Extension).
9House Fiscal Agency: December 2011

Higher Education Appropriations
FY 2011-12 Higher Education Budget = $1,364,178,400
10House Fiscal Agency: December 2011
University Operations$1,207,234,700
88.5%
Financial Aid$99,526,400
7.3% Ag Experiment/ Coop Extension
$52,625,800 3.9%
Other$2,891,500
0.2%
One-Time Funding$1,900,000
0.1%

MAJOR BUDGET ISSUES

Public Universities
University Abbreviation FoundedCentral Michigan University CMU 1892Eastern Michigan University EMU 1849Ferris State University FSU 1884Grand Valley State University GVSU 1960Lake Superior State University LSSU 1946Michigan State University MSU 1855Michigan Tech. University MTU 1885Northern Michigan University NMU 1899Oakland University OU 1957Saginaw Valley State University SVSU 1963University of Michigan – Ann Arbor UMAA 1817University of Michigan – Dearborn UMD 1959University of Michigan – Flint UMF 1956Wayne State University WSU 1868Western Michigan University WMU 1903
12House Fiscal Agency: December 2011

FY 2011-12 University Operations Grants
$10.8 $17.8 $21.0 $23.6$38.4 $40.7 $41.3 $43.1
$52.7$64.6 $68.1
$93.2
$182.0
$241.1
$268.8
LSSU UMF UMD SVSU NMU MTU FSU OU GVSU EMU CMU WMU WSU MSU UMAA
Mill
ions
Appropriations to Michigan State, UM-Ann Arbor,and Wayne State make up 57.3% of total stateoperational support to the 15 public universities.
13House Fiscal Agency: December 2011

University Operations Funding
No constitutional or statutory provisions exist to govern distribution of funding to public universities. Decisions made on a year-to-year basis by the Legislature.
Appropriations often calculated on a per-student basis to control for varying enrollments of universities. Calculation based on fiscal year equated students (FYES):– FYES = credit hours divided by 30 (at undergraduate level)– Calculation usually made using total FYES (undergraduates + graduates;
residents + nonresidents)
Methods used over last decade to determine funding changes have included:– Across-the-board adjustments– Per-FYES funding floor– Allocations based on various activity/outcome measures: enrollment, degree
completions, research funds, Pell Grant recipients
FY 2011-12 budget act includes language stating legislative intent to allocate university operations funding using a performance incentive formula (yet to be developed) beginning in FY 2012-13.
14House Fiscal Agency: December 2011

University Appropriations per Student
FY 2011-12 appropriations per FY 2010-11 FYES vary from $2,351 to $7,341.
$0
$1,500
$3,000
$4,500
$6,000
$7,500
GVSU SVSU UMF OU CMU UMD FSU EMU WMU NMU LSSU MSU MTU UMAA WSU
15House Fiscal Agency: December 2011

Historical University Appropriations per StudentTotal FY 2011-12 university appropriations per FYES are 33.4 percent lower than they were in FY 2000-01―or 48.6 percent lower on an inflation-adjusted basis.
$0
$2,000
$4,000
$6,000
$8,000
FY 1987
FY 1988
FY 1989
FY 1990
FY 1991
FY 1992
FY 1993
FY 1994
FY 1995
FY 1996
FY 1997
FY 1998
FY 1999
FY 2000
FY 2001
FY 2002
FY 2003
FY 2004
FY 2005
FY 2006
FY 2007
FY 2008
FY 2009
FY 2010
FY 2011
FY 2012
Nominal CPI-Adjusted
16House Fiscal Agency: December 2011

Tuition Restraint Incentive
FY 2011-12 budget adjustments for university operations:– 15.0% across-the-board reduction ($213.1 million)– From remaining amounts, between 5.1% and 9.8% of each
university’s appropriation (based on average tuition increase over previous 5 years) was made contingency on compliance with tuition restraint provisions ($83.0 million total)
Tuition restraint provisions (resident undergraduate rates only):– Universities could not raise tuition for FY 2010-11 after February
1, 2011– Universities had to limit tuition increases for FY 2011-12 to 7.1%
(statewide 5-year average)
State budget director determined that all 15 universities complied with requirements and will receive tuition restraint incentive funds. In two cases (MSU/WSU), tuition increases were calculated based on higher summer semester rates in FY 2010-11.
17House Fiscal Agency: December 2011
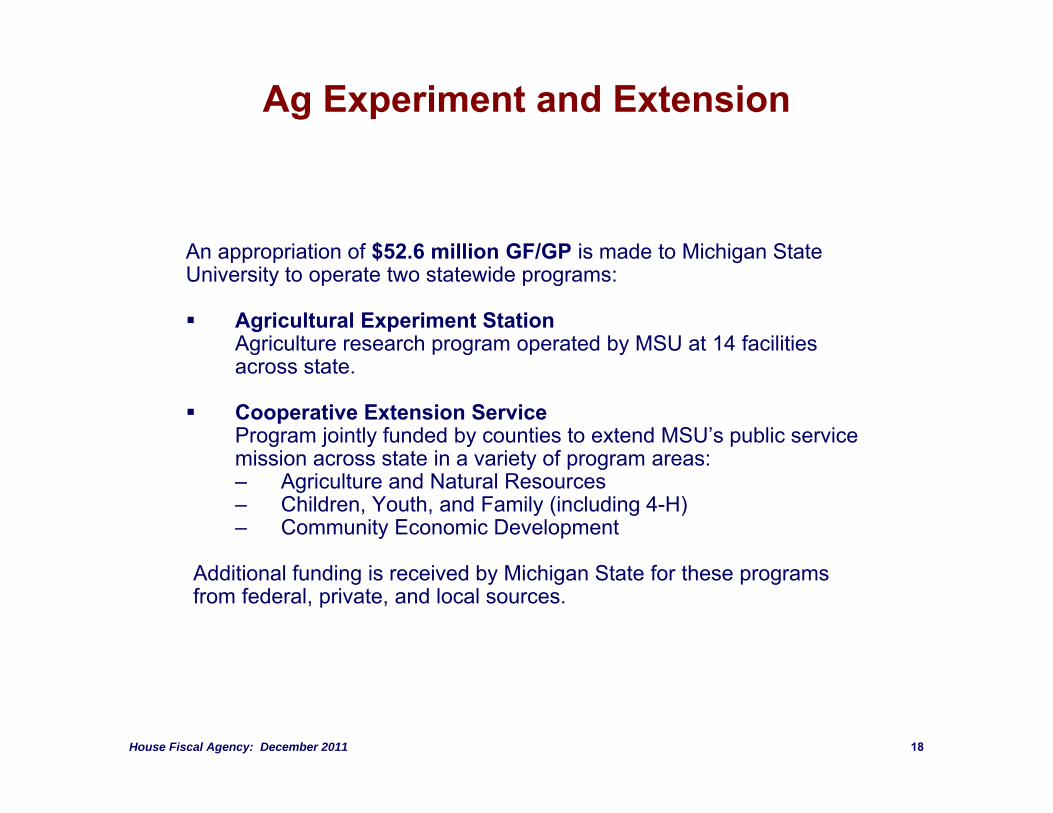
Ag Experiment and Extension
An appropriation of $52.6 million GF/GP is made to Michigan State University to operate two statewide programs:
Agricultural Experiment StationAgriculture research program operated by MSU at 14 facilities across state.
Cooperative Extension ServiceProgram jointly funded by counties to extend MSU’s public service mission across state in a variety of program areas:– Agriculture and Natural Resources– Children, Youth, and Family (including 4-H)– Community Economic Development
Additional funding is received by Michigan State for these programs from federal, private, and local sources.
18House Fiscal Agency: December 2011

Financial Aid Programs
Tuition GrantsNeed-based awards to students attending independent colleges ($1,512 maximum award for FY 2011-12; $3.0 million cap for Baker College and Davenport University).
State Competitive ScholarshipsAwards to students with both qualifying ACT score and financial need ($575 maximum award for FY 2011-12).
Tuition Incentive ProgramPayment of associate’s degree tuition costs and up to $2,000 for bachelor’s degree for students eligible for Medicaid in middle/high school.
Project GEAR UPFederally-funded awards targeted to students in urban school districts.
Robert C. Byrd Honors Scholarship ProgramFederally-funded awards to outstanding high school graduates.
Children of Veterans Tuition Grant and Officer’s Survivor Tuition ProgramsGrants to (1) children of deceased or disabled veterans and (2) children of police officers and firefighters killed in the line of duty.
In recent years, federal Temporary Assistance to Needy Families (TANF) funding has been used in place of state funding for financial aid as part of TANF maintenance-of-effort plan.
19House Fiscal Agency: December 2011

Financial Aid Funding
Other$4,200,000
4.2%Tuition Incentive
Program$43,800,000
44.0%
Tuition Grants$31,664,700
31.8%
State Competitive Scholarships$19,861,700
20.0%
FY 2011-12 Total = $99,526,400
20House Fiscal Agency: December 2011

Changes in State-Funded Financial Aid by Category
$0
$50
$100
$150
$200
$250
$300
FY 1
997
FY 1
998
FY 1
999
FY 2
000
FY 2
001
FY 2
002
FY 2
003
FY 2
004
FY 2
005
FY 2
006
FY 2
007
FY 2
008
FY 2
009
FY 2
010
FY 2
011
FY 2
012
Millions Merit-Based Need-Based
Note: Excludes federally-funded programs
21House Fiscal Agency: December 2011

Tuition Incentive Program (TIP)
Established in FY 1986-87 as incentive for low-income students to complete high school and enroll in college. Student’s family must be Medicaid eligible for 24 months in a 36-month period to enroll in program.
Program has two phases:– Phase I: Associate’s degree tuition costs (limited to average community college
tuition rate for students at private institutions)– Phase II: Up to $2,000 total toward completion of bachelor’s degree
Large potential pool of participants: Department of Treasury sends out nearly 200,000 letters to eligible students each year.
Over 75% of Phase I students enrolled at community colleges. Number of students claiming Phase II awards much smaller.
Because of increasing participation rates, program costs have increased from $5.0 million in FY 2000-01 to $43.8 million in FY 2011-12. Currently, over 16,000 students are receiving TIP assistance.
22House Fiscal Agency: December 2011

TIP Participation/Expenditure Growth
$0
$10
$20
$30
$40
0
5,000
10,000
15,000
20,000
FY 2001
FY 2002
FY 2003
FY 2004
FY 2005
FY 2006
FY 2007
FY 2008
FY 2009
FY 2010
FY 2011
FY 2012 (Approp)
Mill
ions
$
Participants (Left Axis)
Total Payments (Right Axis)
23House Fiscal Agency: December 2011

Other Higher Education Programs
King-Chavez-Parks: $2.7 million GF/GPGrant programs to increase participation of academically or economically disadvantaged students in postsecondary education. Additional funds allocated from public university base appropriations.
Higher Education Database: $105,000 GF/GPMaintenance of Higher Education Institutional Data Inventory (HEIDI), to which public universities submit enrollment/finance data annually.
Midwestern Higher Education Compact: $95,000 GF/GPDues for interstate compact to realize economies of scale and provide other higher education-related assistance.
24House Fiscal Agency: December 2011

One-Time Appropriations
Three appropriations totaling $1.9 million GF/GP are included in FY 2011-12 boilerplate language on a “one-time basis only”:
$500,000 GF/GP for the Autism Collaborative Center at Eastern Michigan University
$1.2 million for the Facility for Rare Isotope Beams at Michigan State University
$200,000 GF/GP for economic development and commercialization at Western Michigan University
25House Fiscal Agency: December 2011

PUBLIC UNIVERSITY DATA

Key Data Definitions
Pursuant to statutory and budget act requirements, the 15 public universities annually submit enrollment, finance, and other institutional data to the state’s Higher Education Institutional Data Inventory (HEIDI).
Enrollment definitions:
– Student Headcount: Number of individual students enrolled for at least one class at a university.
– Fiscal Year Equated Students (FYES): Calculated equivalent of the number of full-time students enrolled at a university.
Finance definitions:
– Current Fund: All revenue/expenditures for current operations―including auxiliary operations, such as hospitals and dormitories, and operations funded from restricted sources, such as research grants.
– General Fund: Subset of current fund revenue/expenditures for instruction and related activities; nearly all general fund revenue received through state appropriations and student tuition/fees.
27House Fiscal Agency: December 2011

FY 2010-11 Public University Enrollments
0
10,000
20,000
30,000
40,000
50,000
CMU EMU FSU GVSU LSSU MSU MTU NMU OU SVSU UMAA UMD UMF WSU WMU
Headcount FYES
28House Fiscal Agency: December 2011

Public University Enrollment History
0
25,000
50,000
75,000
100,000
125,000
150,000
175,000
200,000
225,000FY
197
7
FY 1
979
FY 1
981
FY 1
983
FY 1
985
FY 1
987
FY 1
989
FY 1
991
FY 1
993
FY 1
995
FY 1
997
FY 1
999
FY 2
001
FY 2
003
FY 2
005
FY 2
007
FY 2
009
FY 2
011
Undergraduate FYES
Graduate FYES
29House Fiscal Agency: December 2011

University Enrollment GrowthFY 2000-01 to FY 2010-11
(20.0)
0.0
20.0
40.0
LSSU
WM
U
EMU
WSU
MSU
UM
-D
CM
U
MTU
UM
-AA
NM
U
FSU
UM
-F OU
SVSU
GVS
U
% C
hang
e
Note: Changes based on total Fiscal Year Equated Students (FYES)
30House Fiscal Agency: December 2011

Public University General Fund Revenue
FY 2009-10 Total = $5.4 Billion
Student Tuition/Fees
$3,591,738,300 66.0%
State Appropriations$1,420,344,900
26.1%
Other$426,942,181
7.8%
31House Fiscal Agency: December 2011

Public University General Fund Revenue Source History
% o
f Tot
al G
F R
even
ue
0%
25%
50%
75%FY
197
7FY
197
8FY
197
9FY
198
0FY
198
1FY
198
2FY
198
3FY
198
4FY
198
5FY
198
6FY
198
7FY
198
8FY
198
9FY
199
0FY
199
1FY
199
2FY
199
3FY
199
4FY
199
5FY
199
6FY
199
7FY
199
8FY
199
9FY
200
0FY
200
1FY
200
2FY
200
3FY
200
4FY
200
5FY
200
6FY
200
7FY
200
8FY
200
9FY
201
0FY
201
1FY
201
2
Other
State Appropriations
Tuition and Fees
Note: FY 2011-12 amounts are estimates
32House Fiscal Agency: December 2011

Public University General FundRevenue per FYES: FY 2010-11
$0
$10,000
$20,000
$30,000
CMU EMU FSU GVSU LSSU MSU MTU NMU OU SVSU UMAA UMD UMF WSU WMU
State Appropropriation Tuition Other
33House Fiscal Agency: December 2011

Average Resident UndergraduateTuition and Fee Rate
$0
$5,000
$10,000
$15,000FY
199
2
FY 1
993
FY 1
994
FY 1
995
FY 1
996
FY 1
997
FY 1
998
FY 1
999
FY 2
000
FY 2
001
FY 2
001
FY 2
003
FY 2
004
FY 2
005
FY 2
006
FY 2
007
FY 2
008
FY 2
009
FY 2
010
FY 2
011
FY 2
012
UM-Ann Arbor
Michigan State
Average:15 Universities
Saginaw Valley
34House Fiscal Agency: December 2011

Tuition Rates and State Funding
-15%
-10%
-5%
0%
5%
10%
15%FY
199
1
FY 1
992
FY 1
993
FY 1
994
FY 1
995
FY 1
996
FY 1
997
FY 1
998
FY 1
999
FY 2
000
FY 2
001
FY 2
001
FY 2
003
FY 2
004
FY 2
005
FY 2
006
FY 2
007
FY 2
008
FY 2
009
FY 2
010
FY 2
011
FY 2
012
% C
hang
e Fr
om P
rior Y
ear
Average Resident UndergraduateTuition/Fee Rate
State Funding/FYES
Note: FY 2011-12 basedon FY 2010-11 FYES
35House Fiscal Agency: December 2011

Public University GeneralFund Expenditures
0%
20%
40%
60%
80%
100%FY
199
5
FY 1
996
FY 1
997
FY 1
998
FY 1
999
FY 2
000
FY 2
001
FY 2
002
FY 2
003
FY 2
004
FY 2
005
FY 2
006
FY 2
007
FY 2
008
FY 2
009
FY 2
010
FY 2
011
% o
f Tot
al E
xpen
ditu
res Financial Aid
TransfersAux EnterprisesPlant Ops & MaintInst SupportPublic ServiceResearchStudent ServicesAcademic SupportInstruction
36House Fiscal Agency: December 2011

Total Public University General Fund Expenditures per FYES
$0
$5,000
$10,000
$15,000
$20,000FY
199
1
FY 1
992
FY 1
993
FY 1
994
FY 1
995
FY 1
996
FY 1
997
FY 1
998
FY 1
999
FY 2
000
FY 2
001
FY 2
001
FY 2
003
FY 2
004
FY 2
005
FY 2
006
FY 2
007
FY 2
008
FY 2
009
FY 2
010
FY 2
011
Expe
nditu
res/
FYES
Nominal Expends/FYES Adjusted for US CPI Adjusted for Higher Ed Price Index
37House Fiscal Agency: December 2011

Degree Completions at Public Universities
0
20,000
40,000
60,000
FY 1
990
FY 1
991
FY 1
992
FY 1
993
FY 1
994
FY 1
995
FY 1
996
FY 1
997
FY 1
998
FY 1
999
FY 2
000
FY 2
001
FY 2
001
FY 2
003
FY 2
004
FY 2
005
FY 2
006
FY 2
007
FY 2
008
FY 2
009
FY 2
010
FY 2
011
Professional
Doctoral
Master's
Bachelor's
Associate's
38House Fiscal Agency: December 2011

Major Public University Bachelor’s Degree Program Areas
0 2,000 4,000 6,000 8,000
English Language/Literature
Visual/Performing Arts
Biology/Biomedical
Communications/Journalism
Psychology
Engineering
Education
Social Sciences
Health Professions
Business/Management
FY 2003-04 Completions FY 2010-11 Completions
7-Year% Change
102.0
26.6
2.4
(15.3)
19.9
38.9
13.1
(7.7)
(33.5)
11.8
39House Fiscal Agency: December 2011

For more information about the Higher Education budget, contact:
Kyle I. [email protected]
(517) 373-8080