Embed Size (px)
Citation preview

DRAFT FOR DISCUSSION – DO NOT CITE
Higher Education and Skills for the Labor Market in Cambodia
HRINC
Email: [email protected]
January, 2010

2
Table of Contents Table of Contents .............................................................................................................................2 List of Figures...................................................................................................................................4 List of Tables ....................................................................................................................................4 List of Boxes.....................................................................................................................................5 Executive Summary .........................................................................................................................6 Chapter 1: Introduction.................................................................................................................10
1.1 Structure and performance of Cambodian economy ........................................................10 1.2 Employment......................................................................................................................11 1.3 Opportunities and challenges ...........................................................................................13 1.4 Government strategy ........................................................................................................13
Chapter 2: Supply Side ..................................................................................................................15 2.1 Higher education coverage...............................................................................................15 2.2 Types of higher education institutes .................................................................................17
2.2.1 Universities ................................................................................................................................. 18 2.2.2 Institutes or Technical institutes.................................................................................................. 19 2.2.3 Royal Academy of Cambodia ..................................................................................................... 19
2.3 Type of higher education degrees ....................................................................................19 2.4 Enrolment by discipline/field of study................................................................................20 2.5 Future growth prospect of enrolments and graduates ......................................................23 2.6 School infrastructure.........................................................................................................28 2.7 Research capacities .........................................................................................................28 2.8 Teaching methodology .....................................................................................................29 2.9 Teacher quality .................................................................................................................30 2.10 Case Study of Innovation/Adaptation in Vocational Training............................................32
2.10.1 E-learning ................................................................................................................................ 32 2.10.2 Giving Online Access to Learning (GOAL) Project ................................................................. 33
2.11 Public and private fees for higher education.....................................................................34 2.12 Main Governance Features ..............................................................................................35
2.12.1 Background ............................................................................................................................. 35 2.12.2 Higher Education Governance Structure ................................................................................ 36 2.12.3 Quality and Accreditation ........................................................................................................ 37 2.12.4 Autonomy and Decentralization .............................................................................................. 37 2.12.5 Private Sector Collaboration ................................................................................................... 38 2.12.6 Labor Market Information ........................................................................................................ 38
2.13 Main Financing Features ..................................................................................................39 Chapter 3: Demand Side................................................................................................................41
3.1 Returns from higher education .........................................................................................41 3.1.1 Previous studies.......................................................................................................................... 41 3.1.2 Some practical scenarios for returns to education in Cambodia ................................................ 42
3.2 Labor market demand – by economic sector and field of study .......................................45 3.2.1 Importance of matching demand and supply for higher-level skills ............................................ 45 3.2.2 Possible approaches to estimating labor market demand.......................................................... 47 3.2.3 Estimating labor market demand in Cambodia: the challenges ................................................. 48 3.2.4 Estimating labor market demand in Cambodia: approach & methodology ................................ 48

3
3.2.5 Estimating labor market demand in Cambodia: results .............................................................. 51 3.3.3.1 Employment of persons with higher education .............................................................................51 3.3.3.2 Annual demand for all graduates..................................................................................................52 3.3.3.3 Annual demand for graduates (all sectors), by field of study ........................................................53 3.3.3.4 Annual demand for graduates (all fields of study), by sector ........................................................55 3.3.3.5 Annual demand for graduates, by field of study & sector .............................................................56
3.3 Mismatch between demand and supply ...........................................................................60 3.3.1 Mismatches based on labor market projections ......................................................................... 60 3.3.2 Mismatches based on current salaries ....................................................................................... 64 3.3.3 Mismatches in the IT labor market: a survey by CIST................................................................ 64
3.3.3.1 Labor market demand – by specific skills and attributes ..............................................................65 3.3.3.2 Overall skills adequacy .................................................................................................................65 3.3.3.3 Types of skills ...............................................................................................................................66 3.3.3.4 Specific skills and attributes – their importance and availability....................................................66
Chapter 4: Conclusions, Key Themes & Recommendations .....................................................71 4.1 Conclusions ......................................................................................................................71 4.2 Proposed recommendations.............................................................................................72
Appendix .........................................................................................................................................74 5.1 Research Methodology.....................................................................................................74 5.2 Reference Materials..........................................................................................................75 5.3 Sector Activities and Definitions .......................................................................................76 5.4 Graduate demand and supply projections, 2009-2014.....................................................77 5.5 Skills & attributes that are most important ........................................................................80 5.6 Skills & attributes that are most difficult to find .................................................................80
4
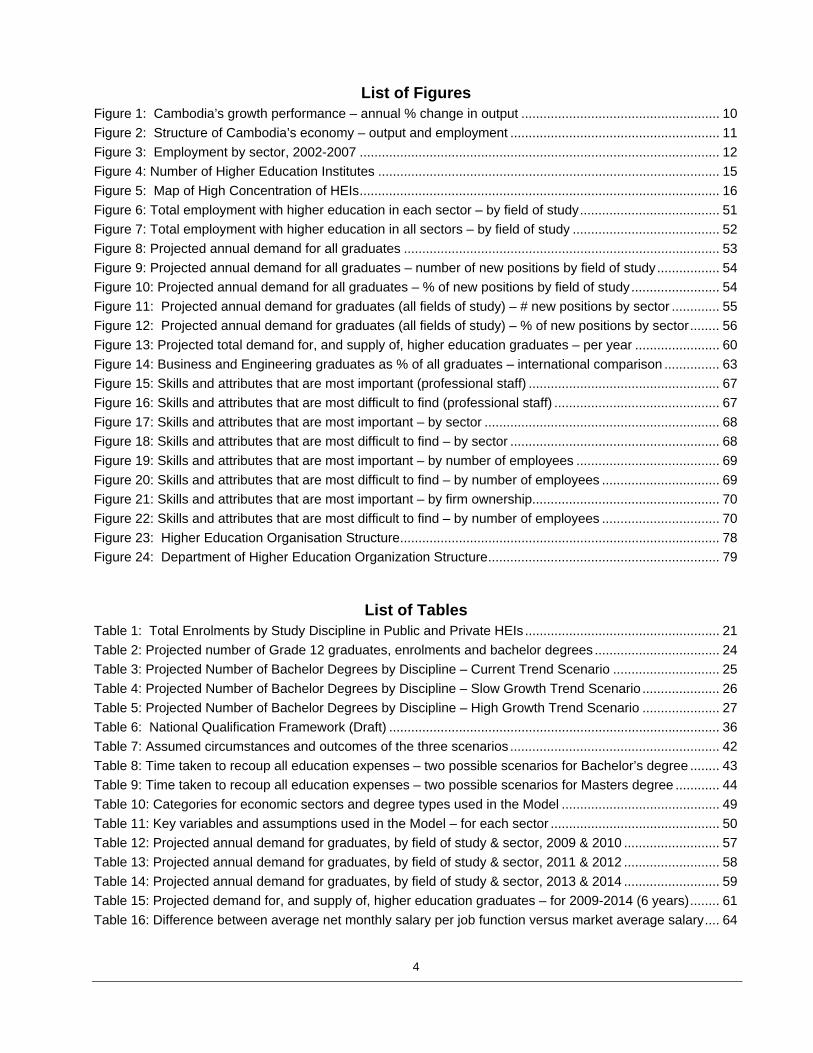
List of Figures Figure 1: Cambodia’s growth performance – annual % change in output ...................................................... 10 Figure 2: Structure of Cambodia’s economy – output and employment ......................................................... 11 Figure 3: Employment by sector, 2002-2007 .................................................................................................. 12 Figure 4: Number of Higher Education Institutes ............................................................................................. 15 Figure 5: Map of High Concentration of HEIs.................................................................................................. 16 Figure 6: Total employment with higher education in each sector – by field of study...................................... 51 Figure 7: Total employment with higher education in all sectors – by field of study ........................................ 52 Figure 8: Projected annual demand for all graduates ...................................................................................... 53 Figure 9: Projected annual demand for all graduates – number of new positions by field of study................. 54 Figure 10: Projected annual demand for all graduates – % of new positions by field of study........................ 54 Figure 11: Projected annual demand for graduates (all fields of study) – # new positions by sector ............. 55 Figure 12: Projected annual demand for graduates (all fields of study) – % of new positions by sector........ 56 Figure 13: Projected total demand for, and supply of, higher education graduates – per year ....................... 60 Figure 14: Business and Engineering graduates as % of all graduates – international comparison ............... 63 Figure 15: Skills and attributes that are most important (professional staff) .................................................... 67 Figure 16: Skills and attributes that are most difficult to find (professional staff) ............................................. 67 Figure 17: Skills and attributes that are most important – by sector ................................................................ 68 Figure 18: Skills and attributes that are most difficult to find – by sector ......................................................... 68 Figure 19: Skills and attributes that are most important – by number of employees ....................................... 69 Figure 20: Skills and attributes that are most difficult to find – by number of employees ................................ 69 Figure 21: Skills and attributes that are most important – by firm ownership................................................... 70 Figure 22: Skills and attributes that are most difficult to find – by number of employees ................................ 70 Figure 23: Higher Education Organisation Structure....................................................................................... 78 Figure 24: Department of Higher Education Organization Structure............................................................... 79
List of Tables Table 1: Total Enrolments by Study Discipline in Public and Private HEIs ..................................................... 21 Table 2: Projected number of Grade 12 graduates, enrolments and bachelor degrees .................................. 24 Table 3: Projected Number of Bachelor Degrees by Discipline – Current Trend Scenario ............................. 25 Table 4: Projected Number of Bachelor Degrees by Discipline – Slow Growth Trend Scenario ..................... 26 Table 5: Projected Number of Bachelor Degrees by Discipline – High Growth Trend Scenario ..................... 27 Table 6: National Qualification Framework (Draft) .......................................................................................... 36 Table 7: Assumed circumstances and outcomes of the three scenarios ......................................................... 42 Table 8: Time taken to recoup all education expenses – two possible scenarios for Bachelor’s degree ........ 43 Table 9: Time taken to recoup all education expenses – two possible scenarios for Masters degree ............ 44 Table 10: Categories for economic sectors and degree types used in the Model ........................................... 49 Table 11: Key variables and assumptions used in the Model – for each sector .............................................. 50 Table 12: Projected annual demand for graduates, by field of study & sector, 2009 & 2010 .......................... 57 Table 13: Projected annual demand for graduates, by field of study & sector, 2011 & 2012 .......................... 58 Table 14: Projected annual demand for graduates, by field of study & sector, 2013 & 2014 .......................... 59 Table 15: Projected demand for, and supply of, higher education graduates – for 2009-2014 (6 years)........ 61 Table 16: Difference between average net monthly salary per job function versus market average salary.... 64

5
List of Boxes Box 1: Centre for Information System Training (CIST) Case Study in Cambodia .......................................... 32 Box 2: Challenges in Finding a Good Job Case Study ................................................................................... 46

6
Executive Summary Cambodia has achieved very strong rates of economic growth over the past decade. Employment has also grown relatively quickly over the past decade, with many of the new jobs being in the Industry and Services sectors. While Agriculture is still far by the largest employer, its share is steadily diminishing because much of the output growth has been driven by productivity gains, rather than employment growth. In the Services sector, the biggest share of employment comes from Trade, followed by Transport & Communications, Public Administration & Defense, and Education. In terms of job creation, employment in Trade has grown fairly quickly. Other smaller employers, including Tourism and Finance, have grown very quickly off relatively low bases.
The country still faces many challenges on the economic front over the next decade. A major challenge is for the economy to absorb the large numbers of young job seekers entering the labor market. It is estimated that around 250,000 new job seekers enter the Cambodian labor market each year. The Government, development partners and other stakeholders recognize that Cambodia will need to diversify its economic base if it is to sustain high rates of economic growth over the next decade. The need for economic diversification has important implications for Cambodia’s education system and its labor market, in terms of the supply and demand of the right skills needed to take Cambodia forward. Diversification will require a more relevant and responsive higher education system, where institutions offer courses in disciplines that are demanded by employers and provide curricula that equip students with the specific skills needed to become productive members of the workforce.
While economic growth and employment have undergone rapid transformation, higher education system has also grown rapidly in recent years in terms of number of HEIs and student enrolments with high concentration in the capital city and main provinces. Total enrolment in both public and private HEIs has grown rapidly over the past decade, from a little over 10,000 in 1992 to 137,253 in 2009. Approximately 59% of enrolments are in private institutions. This rapid growth raises challenges regarding the capacity of the system to absorb such large numbers while at the same time improve the quality of education. Despite this progress, only 5% of the tertiary-age population is enrolled in tertiary education which is quite low in comparison with an average of East Asia and the Pacific region. However, this figure is anticipated to increase significantly over the next several years.
Public and private institutions are in many ways alike in terms of operation. Public institutions have been granted partial autonomy in curriculum design, recruiting teaching staff and charging tuition fees from students in order to significantly cover operation costs and ensure long term sustainability. The private institutions generally have greater autonomy, especially in staff recruitment and financial management. Both types of institutions are indirectly operating under Department of Higher Education of Ministry of Education, Youth and Sports (MoEYS) which plays a key role in: (i) developing policy and strategy for the higher education sector; (ii) licensing HEIs for their operations; (iii) assisting HEIs to develop academic programs and management tools needed to help meet accreditation standards; and (iv) improving the quality and efficiency of higher education nationwide.
Cambodia’s higher education system consists of universities, institutes or technical institutes, and a Royal academy. These institutions offer associate degrees, bachelor degrees, master degrees and doctors of philosophy degrees based on the field of expertise of each education provider. Surprisingly, no less than nine government ministries and agencies are providing higher education services in Cambodia, making it difficult to coordinate among government agencies in terms of scope of work, administration overlap and information sharing.
Higher education fees appear to be affordable by majority of Grade 12 graduate students. The average annual unit cost of a Cambodia student is below Cambodia’s GDP per capita which is on the low side among least developed countries, leading to limited educational services. With regard to expenditure, the share of the GDP dedicated to public expenditure for high education in 2008 is far below the world average of 1%, in 2008, the share can be estimated at 0.13% of GDP. Importantly, it appears that the

7
emphasis has been weighted too strongly towards expanding the system (coverage and quantity), with insufficient regard for improving the system (quality and labor market responsiveness).
Approximate 11% of Grade 12 pass students are on scholarships. The remaining 89% pay fees for their education, which means they have freedom to enroll in the field of studies based on their own interests and ambitions. Most students appear to base this decision on the advice of their family or their interest in a subject, rather than on any understanding of the labor market. As a result, approximately 65,734 students (or 48% of total students) are currently enrolled in business-related courses in 2009. However, there is a growing perception that there are too many students studying these business-related courses, with supply of graduates outstripping demand. Less than 4% of total students are enrolled in the field of Agriculture and Rural Development and only 2% of students are enrolled in Mathematics, Chemistry, Physics, and Biology. Computer science and Health science account for 8% and 5% respectively. Only around 3% of all students are enrolled in the Engineering and Mechanic discipline. Part of the reason is parents and students themselves do not highly value these skills and do not want to work at a construction site.
Using information available and recent enrolment trends, this report attempts to forecast the total number of enrolments and graduates in three scenarios: (1) Current Trend Scenario; (2) Slow Growth Trend Scenario; and (3) High Growth Trend Scenario. The Current Trend Scenario is the most likely outcome over the next few years. It is estimated that between 2009 and 2014, around 227,000 students are likely to graduate with Bachelor Degrees. This would indicate that the number of Bachelor Degrees will increase on average by around 7% each year from 2009 to 2012, thereafter accelerating sharply from 2013 onwards as a result of large numbers of Grade 12 graduates entering HEIs in 2010. However, in a rapidly evolving higher education system and labor market such as Cambodia, it is hard to make accurate projections. It depends on many unpredictable variables, including how much focus is placed on quality versus quantity (by the Government, accreditation agencies and the HEIs themselves) and labor market demand for university graduates.
It appears that higher education providers in Cambodia suffer from a lack of physical infrastructure to be able to deliver high quality teaching. Good progress has been made in recent years in supplying more buildings to meet the enrolment demand. However, laboratories for experiments and technical equipment for some fields of studies is badly needed. Generally, research capacity is at a very young stage of development and there is still a long way to go for both public and private HEIs. Up to now, there are no known instances where applied research by Cambodian higher education providers has produced high quality research findings that have translated into innovation for Cambodia’s productive sector.
In connection to teaching staff, there is 8,169 staff teaching bachelor degrees at public and private HEIs in Cambodia. Of this total, 7% hold a PhD degree, 53% hold a master degree and the remaining 40% possess a bachelor degree only, suggesting that only a small proportion of students studying bachelor degrees have a chance to study with teachers who hold a PhD degree. With a few exceptions for some institutions, access to qualified teachers with practical experiences is a challenge and HEIs cannot offer competitive compensation to attract and retain experienced and qualified teaching staff to devote full time and energy for the sake of quality of education. The quality of many courses is inadequate – inadequate infrastructure and teaching resources, large number of students in classroom, out-dated teaching methodologies, general low standards, uncompetitive compensation packages resulting in teachers taking on too many teaching hours.
With regard to return to education, the return to an additional year of university education is 10.6% for males and 11.7% for females. Interestingly, the annualized returns for males aged 22-30 (18.8%) is much higher than for males aged above 30 (9.1%). In contrast, the returns for younger females (9.8%) is much lower than for older females (16.5%). This could suggest that there is a shortage of younger better educated males, or young graduates. While these returns to higher education are quite high, it does not necessarily follow that the high returns indicate a current or persisting shortage of graduates. It needs to

8
be remembered the returns are based on sample population data in 2007, and therefore do not fully incorporate the rapid growth in university enrolments over the past few years. The full impact of the large increase in enrolments over the past few years is only now beginning to be felt in the labour market and it will be some years before this shows up in the kinds of returns analysis studies.
On the demand side, there is little doubt of the importance of estimating labor market demand for higher education graduates in Cambodia. Equally, however, there is little doubt of the difficulties involved in attempting this exercise. The study team has made what we believe to be the first attempt in Cambodia at estimating labor market demand for graduates, by sector and by field of study. As such, it should be seen as the first step – not the final step – in building a comprehensive labor market information system for Cambodia.
Total demand for graduates is projected to be relatively low in 2009, with just over 5,000 new positions. This reflects the pronounced slowdown in the Cambodian economy through 2008 and 2009, particularly in the Garment, Construction and Tourism sectors. Demand for graduates is projected to pick up in 2010 as the Cambodian economy begins to recover, with a total of around 10,000 new positions. As the economy returns to something approaching trend growth in 2011, demand for graduates is projected to increase to around 14,000 new positions. In subsequent years, demand is projected to increase by around 15% per annum, reaching more than 21,000 new positions in 2014.
In relation to mismatches based on labor market projections, the projections highlight that there is likely to be a significant oversupply of graduates in 2009 and 2010, with relatively low demand by employers. As employment picks up in 2011 and 2012, this oversupply is expected to narrow slightly. However, supply is expected to far outstrip demand in 2013 and 2014 due to rapid growth in the number of graduates entering the labor market. Over the six years from 2009 to 2014, the higher education system is projected to supply around 220,000 bachelor degrees. In contrast, the labor market is projected to absorb around 86,000 graduates. It should be noted that the supply projections refer to the number of degrees, rather than the number of graduating students. Since some students complete more than one degree, the actual number of graduates would be less than 220,000. However, even if one quarter of students complete double degrees, this would still produce around 190,000 graduates – which is more than double the projected demand.
While there is little hard data available, there appears to be a growing oversupply of university graduates – there are too many graduates competing for too few jobs. This conclusion is based on the results of the workforce projection model developed for this research project, as well as anecdotal evidence, interviews with relevant stakeholders and a research study of the IT jobs market in Cambodia. The growing oversupply of graduates is likely to lead to high rates of graduate unemployment, with many graduates unlikely to get a sufficient return on their significant investment in education. This trend is likely to get worse over the next few years. As a result, earlier studies which have shown relatively high returns to higher education in the past may not be replicated in future studies.
Students are enrolled in the wrong study disciplines – too many are enrolled in business-related courses and law while too few are enrolled in engineering. Even within study disciplines, graduating students do not have the right skills for the labor market. Course curricula and teaching methodologies focus too much on theory and not enough on practical workplace skills (analysis, problem-solving, decision-making).
Any assessment of Cambodia’s labor market for graduates – including the conclusions reached in this report – will be open to debate and contention while there remains a lack of information about labor market demand and graduate employment. Developing more effective information systems, which help inform Government, policymakers, donors, universities and other stakeholders about current and future labor conditions, is crucial to enabling an effective and responsive higher education system. This report also highlights some possible recommendations which can provide useful information for government

9
agencies, public and private higher institutions, policy makers, development partners and other stakeholders working to promote higher education sector.

10
Chapter 1: Introduction
1.1 Structure and performance of Cambodian economy Cambodia has achieved very strong rates of economic growth over the past decade. Not only has economic growth been rapid, but the structure of the economy – in terms of value added and employment by sector – has changed dramatically. These changes have been well-documented in many previous reports1, and so only a brief summary is presented below.
In the decade to 2007, Cambodia achieved average economic growth of 9.8% per annum, including growth in excess of 10% in each year from 2004 to 20072. This performance was driven by high rates of growth in the Industry (predominantly Garments and Construction) and Services (predominantly Tourism) sectors. Growth in what was Cambodia’s largest sector, Agriculture, was much more modest. These sectoral performances are highlighted in the figure below.
Figure 1: Cambodia’s growth performance – annual % change in output
-5%
0%
5%
10%
15%
20%
25%
30%
35%
1998 1999 2000 2001 2002 2003 2004 2005 2006 2007
AgricultureIndustryServicesGDP
Source: Key indicators for Asia and the Pacific: Cambodia, ADB Statistics, www.adb.org/statistics
As a result of these sectoral growth rates, the structure of the Cambodian economy, in terms of output and employment, has undergone dramatic change over the period. The figure below highlights the diminishing – but still significant – role of Agriculture in the Cambodian economy. By 2007, Agriculture’s share of total output had fallen to 29%, placing it behind the Services (40%) and Industry (30%) sectors. Agriculture’s share of total employment has also declined, but the sector remains the dominant employer, accounting for 59% of total employment in 2007.
1 See, for example, Sustaining Rapid Growth in a Challenging Environment, Cambodia Country Economic Memorandum, World Bank, January 2009 2 Sustaining Rapid Growth in a Challenging Environment, Cambodia Country Economic Memorandum, World Bank, January 2009, p.5.

11
Figure 2: Structure of Cambodia’s economy – output and employment
Share of GDP (%) Share of Employment (%)
Source: Sustaining Rapid Growth in a Challenging Environment, Cambodia Country Economic Memorandum, World Bank, January 2009, p.5
As has been well-documented, Cambodia’s economic growth has been driven by four key sectors: Garments, Construction, Tourism and Agriculture. This relatively narrow economic base has left the economy vulnerable to external shocks, which emerged in the second half of 2008 and continued into 2009. The Garment sector has been hit hard by the global economic recession as well as increasing competition from Vietnam and China. Construction has slowed dramatically in response to a perceived real estate bubble and the drying up of foreign investment (particularly from South Korea). Tourism has also been hurt by the global recession, as the number of foreign visitors – particularly from high-spending countries – has dropped. Only Agriculture has continued to generate stable, albeit modest, growth.
As a result of these economic headwinds, Cambodia’s economic growth slowed to just 5.5% in 2008 and is forecast to be flat or slightly negative in 2009.
1.2 Employment Employment has grown relatively quickly over the past decade, with many of the new jobs being in the Industry and Services sectors. While Agriculture is still far by the largest employer, its share is steadily diminishing because much of the output growth has been driven by productivity gains, rather than employment growth. In contrast, employment growth has accounted for a larger share of value added in the Industry and Services sectors.
According to recent estimates, in the years 1998-2007, the Industry and Services sectors each created around 100,000 jobs per year (on average). The much larger Agriculture sector is estimated to have added around 80,000 jobs per year (on average).3
Most of the employment in the industry sector is in Garment production and Construction. Both of these industries grew quickly in the years up to 2007, absorbing many unskilled and low-skilled workers from rural areas into urban areas.
In the Services sector, the biggest share of employment comes from Trade, followed by Transport & Communications (of which Communications represents around 10%), Public Administration & Defense, and Education. In terms of job creation, employment in Trade has grown fairly quickly. Other smaller employers, including Tourism and Finance, have grown very quickly off relatively low bases.
3 Sustaining Rapid Growth in a Challenging Environment, Cambodia Country Economic Memorandum, World Bank, January 2009, p.7 & p.9.

12
The figure below shows the growth in employment from 2002 to 2007 in each sector, showing sub-sector components.4
Figure 3: Employment by sector, 2002-2007
Agriculture, forestry & fisheries
0
1,000,000
2,000,000
3,000,000
4,000,000
5,000,000
2002 2003 2004 2005 2006 2007
Forestry
Fisheries
Agriculture
Services
0
500,000
1,000,000
1,500,000
2,000,000
2,500,000
2002 2003 2004 2005 2006 2007
Other
Real estate & business
Financial intermediation
Health & social w ork
Hotels & restaurants
Other social services
Education
Public admin & defense
Transport & comm.
Trade
Industry
0
200,000
400,000
600,000
800,000
1,000,000
1,200,000
1,400,000
2002 2003 2004 2005 2006 2007
Utilities
Mining
Construction
Manufacturing
Source: NIS, National Accounts
Over the period 2002 to 2007, a total of 1.7 million new jobs were created to bring Cambodia’s workforce to around 8.4 million people (representing an increase of 27%)5. In terms of absolute
4 Sustaining Rapid Growth in a Challenging Environment, Cambodia Country Economic Memorandum, World Bank, January 2009, p.7 & p.9.

13
numbers, the industries that created the most new jobs were Trade (440,000 or 58% growth), Manufacturing (343,000 or 57% growth), Construction (179,000 or 149% growth), Agriculture (144,000 or 4% growth) and Fisheries (94,000 or 32% growth).
Several industries experienced rapid jobs growth, but the number of jobs created was relatively low due to the small size of these industries. For example, employment in Hotels & Restaurants surged by 258%, but this translated into only 62,000 new jobs. Similarly, employment in Financial Intermediation increased by 256%, but this translated into just 23,000 new jobs. This highlights that while some smaller, high-profile industries may experience rapid jobs growth, this does not necessarily have a large impact on the overall employment situation in Cambodia.
1.3 Opportunities and challenges For much of the past decade, Cambodia has been able to sustain high rates of economic growth. This has created many new jobs and significantly boosted income per capita – from $285 in 1997 to $593 in 2007.6 During that time, industries such as Manufacturing, Construction and Tourism emerged as important contributors to employment and income generation, while “newer” industries such as Finance and Communications emerged as being potential major contributors in the years ahead.
Despite this progress, Cambodia still faces many challenges on the economic front over the next decade. A major challenge is for the economy to absorb the large numbers of young job seekers entering the labor market. Cambodia experienced a sharp rebound in its birth rate in the 1980s, which means that since 2000, these baby boomers have been entering the labor market in large numbers. Between 2000 and 2006, Cambodia’s labor force grew by 53%, which is more than twice as fast as the next-fastest ASEAN country.7 It is estimated that around 250,000 new job seekers enter the Cambodian labor market each year.8 Another study estimated that the number of new full-time jobs created in 2008 was expected to be enough to absorb only 44% of new job seekers, down from 71% absorption in 2007.9
Cambodia will need to sustain high rates of economic growth if it is to have any chance of absorbing these new entrants into the labor market. To date, economic growth and has been narrowly focused on a few key industries – some of which are highly cyclical and/or vulnerable to external shocks. The Government, development partners and other stakeholders recognise that Cambodia will need to diversify its economic base if it is to sustain high rates of economic growth over the next decade.
The need for economic diversification has important implications for Cambodia’s education system and its labor market, in terms of the supply and demand of the right skills needed to take Cambodia forward. Diversification will require a more relevant and responsive higher education system, where institutions offer courses in disciplines that are demanded by employers and provide curricula that equip students with the specific skills needed to become productive members of the workforce.
1.4 Government strategy This need for economic diversification is recognized by the Royal Government of Cambodia and is reflected in its Rectangular Strategy and its National Strategic Development Plan (which elaborates on the goals and policy priorities set out in the Rectangular Strategy).
5 Note that these numbers are based on Cambodia’s National Accounts produced by the National Institute of Statistics (NIS). However, as a result of Cambodia’s population estimate being revised downwards in the 2008 national census, Cambodia’s official employment estimate has been similarly revised downwards to 6.9 million in 2008. 6 Sustaining Rapid Growth in a Challenging Environment, Cambodia Country Economic Memorandum, World Bank, January 2009, p.(i). 7 Labor and Social Trends in ASEAN 2007, Integration, Challenges and Opportunities, Bangkok, ILO, 2007, p.77. 8 Sustaining Rapid Growth in a Challenging Environment, Cambodia Country Economic Memorandum, World Bank, January 2009, p.1. 9 Cambodia Economic Watch, Economic Institute of Cambodia (EIC), April 2009, p.34.

14
The Rectangular Strategy Phase II has four key elements:
− Enhancement of agricultural sector
− Further rehabilitation and construction of physical infrastructure
− Private sector development and employment generation
− Capacity building and human resource development.
The last two elements of the Strategy are of particular relevance to Cambodia’s labor market and higher education system. The Ministry of Education, Youth and Sport (MoEYS) has a key role to play with respect to capacity building and human resource development. The Ministry’s vision is to establish and development human resources of the highest quality. Its stated aim is to continue to provide and expand access to higher education while at the same time safeguarding quality. It undertakes to give some priority to students enrolling for “less market-oriented and more socially beneficial programs”, which it believes to be in education, health, agriculture, science and mathematics.10
The strategy of MoEYS touches upon a number of important themes that are directly relevant to this study:
− To what extent is it feasible to expand access to higher education while strengthening its quality at the same time? Should the focus be on quantity or quality, or can it be on both?
− Is the aim of expanding access to higher education consistent with a market-responsive approach to student enrolment numbers?
− Which programs are “market-oriented”, in the sense of being demanded by employers – both now and in the future?
These themes are covered in detail in the remaining chapters of this report.
10 Education Sector Support Program 2006-2010, MoEYS, December 2005, p.12.

15
Chapter 2: Supply Side
2.1 Higher education coverage
Cambodia’s higher education system has been growing rapidly in terms of the number of higher education institutions (HEIs), especially private universities. Between 2001 and 2008, the number of private universities increased from just two to 46, while at the same time the number of public universities doubled from 13 to 26 (see figure below). The main reasons for this increase were the policy of public and private partnership for higher education as well as strong demand for higher education resulting from high numbers of students completing high school. By the end of 2008, there were 72 HEIs in Cambodia.
Figure 4: Number of Higher Education Institutes
13 15 15 17 20 2226 26
210
2328
3338 40
46
15
25
3845
5360
6672
0
10
20
30
40
50
60
70
80
2001 2002 2003 2004 2005 2006 2007 2008
# of
Edu
catio
n Pr
ovid
ers
Public Private Total
Note: This figure does not include Branches that exist in the provinces
Source: Department of Higher Education, 2008
Coverage areas for higher education have increased significantly in both Phnom Penh and major provinces in recent years. The majority of public and private HEIs are still concentrated in the capital city, where they account for 75% of total enrolment in 2009. This concentration makes it difficult for Phnom Penh-based institutions to expand their physical infrastructure and is reflected in the fact that most institutions, especially private universities, occupy limited space. The remaining HEIs are mostly located in the major provinces (Battambang, Siem Reap, and Kampong Cham) where economic activity is reasonably high and student demand is also strong (compared to other provinces). Other provinces with low economic activities have very few HEIs, which might reflect low student demand in those provinces so that there is no incentive for HEIs to expand their operations into those provinces. (See figure below for details.)

16
Figure 5: Map of High Concentration of HEIs
Total enrolment in both public and private HEIs has grown rapidly over the past decade, from a little over 10,000 in 1992 to 137,253 in 2009. Approximately 59% of enrolments are in private institutions.11 While Cambodia has made good progress in expanding enrolments and coverage areas, this rapid growth raises challenges regarding the capacity of the system to absorb such large numbers while at the same time improve the quality of education. This is a key concern of all stakeholders working to promote this sector with the view to producing a skilled labor force able to meet the demands of the labor market, and thereby contribute to improving country competitiveness and long-term economic growth in a fast-changing environment.
The limited quality of higher education is one of biggest problems and greatest challenges facing Cambodia’s higher education system today. A recent World Bank document identified four key challenges in improving and sustaining quality and efficiency: the need to improve the quality of the accreditation process; the shortage of skilled, well qualified, and experienced professors at a time of rapidly increasing enrolments; the questionable quality and relevance of many courses; and the need to strengthen the research capacity at many HEIs.12
The same document also highlights some key challenges in building strong institutional capacity: the shortage of skilled local professionals to offer leadership in critical fields, such as the sciences, mathematics, technology-based disciplines, agriculture, and education; inadequate financing of higher education; the need to strengthen the higher education financial mechanism to enhance efficiency and transparency; and underdeveloped governance arrangements in higher education.
11 Department of Higher Education. 2009. Statistics of students in academic year 2008-2009 12 World Bank. 2009. Cambodia – Higher education quality and capacity improvement project, project information document, p.2.

17
Gross enrolment ratios by gender and region: The Gross Enrolment Ratio (GER) for higher education shows total enrolment in higher education as a percentage of the “tertiary-age” population. GERs are widely used to show the general level of participation in higher education. A high GER indicates a high degree of participation.
The latest data for Cambodia from the United Nations Educational, Scientific and Cultural Organization (UNESCO) indicates that only 5% of the tertiary-age population is enrolled in tertiary education, with 7% for males and 4% for females. These GERs are quite low in comparison with other countries in the region, as highlighted in the figure below. The average GER for other countries in East Asia and the Pacific is 26%, with relatively high rates in Thailand (especially for females) and China.
Figure 6: Selected GERs in Tertiary Education by Sex
Source: UNESCO Institute for Statistics, 2009
Both private and public HEIs charge fees and living expenses and these can have a discouraging effect on enrolments of poor, female, and rural students. Therefore, an access and equity issue is a challenge which also requires attention. While Cambodia’s GER in higher education is relatively low, this figure is expected to increase over the next several years as large numbers of Grade 12 graduates are expected to enroll in higher education.
2.2 Types of higher education institutes For the purposes of this report, the term “Higher Education Institution” refers to those institutions offering associate degree, bachelor degree, master degree and doctor of philosophy degree under relevant government agencies concerned and the MoEYS.
Public and private institutions are in many ways alike in terms of operation. Public institutions have been granted partial autonomy in curriculum design, recruiting teaching staff and charging tuition fees from students in order to significantly cover operation costs and ensure long term sustainability. The private institutions generally have greater autonomy, especially in staff recruitment and financial management.
For both types of institutions, the Department of Higher Education of Ministry of Education, Youth and Sports (MoEYS) plays a key role in: (i) developing policy and strategy for the higher education sector; (ii) licensing HEIs for their operations; (iii) assisting HEIs to develop academic programs and management tools needed to help meet accreditation standards; and (iv) improving the quality and efficiency of higher education nationwide.13
13 World Bank, Cambodia summary of higher education sheet.
713
1723
44
26
410
1723
55
26
512
1723
50
26
0
10
20
30
40
50
60
Cambodia Laos Indonesia China Thailand RegionalAverage
GER
(%)
Male Female Both

18
Cambodia’s higher education system consists of universities, institutes or technical institutes, and a Royal academy. These institutions offer associate degrees, bachelor degrees, master degrees and doctors of philosophy degrees based on the field of expertise of each education provider. For students who successfully complete Grade 12 in upper secondary school or higher, they can pursue their study at university or an institute for a bachelor degree. For those who do not pass Grade 12 examination, they also have an opportunity to further their education at HEIs for an associate degree and they can go beyond associate degree upon completion. Additional training courses are also provided to students, especially computer skills and foreign language skills.
Surprisingly, no less than nine government ministries and agencies are providing higher education services in Cambodia, making it difficult to coordinate among government agencies in terms of scope of work, administration overlap and information sharing.
2.2.1 Universities Universities are typically the largest higher education providers in Cambodia, consisting of several faculties offering a wide range of fields of studies to students. Under the current regulation, the Government makes a distinction between a university and other types of higher education institutions based on the following minimum characteristics of a university:14
− Offering multi-disciplinary fields of study from bachelor degrees onward, with several faculties
− Offering a foundation study program
− Offering teaching and research activities using modern methodologies
− Having sufficient teaching staff with competency and experience
− Having adequate library, laboratory, materials and other facilities to carry out study and research
− Having space and classrooms compliant with pedagogical norms
− Having three mandatory faculties, namely i) Arts, Humanities and Language; ii) Mathematics and Science; iii) Social Science, and at least two additional faculties.
For example, Royal University of Phnom Penh is a leading public university in the country. It comprises many faculties which are Social Sciences and Humanities, Faculty of Science and Institute of Foreign Language. Within the faculty of Social Sciences and Humanities, there are several departments including History, Khmer Literature, Philosophy, Psychology, Tourism, and Geography and Land Management.15
Another example from the private university, Build Bright University, a leading private university in Cambodia, has six faculties which are Faculty of Business Management, Faculty of Tourism and Hospitality, Faculty of Science and Technology, Faculty of Engineering and Architecture, Faculty of Education and Languages, and Faculty of Law and Social Science. Each faculty offers many fields of specialty. For example, students who enroll in the Faculty of Business Management can choose a major in General Management, Marketing, Accounting and Finance, Banking and Finance, or Hospitality Business Management. However, students studying in these majors take similar courses throughout four academic years.
Generally speaking, universities tend to be larger than other higher education institutions in Cambodia. However, it should be noted that several private universities are small in terms of number of students and size of operations and appear to struggle to meet the requirements highlighted above. Therefore, it is necessary to look behind the label “university” to consider the nature of operation of each university.
14 Sub-degree No. 54, Criteria for establishment of university, 13, June, 2002 15 Royal University of Phnom Penh Handbook 2007-2011

19
2.2.2 Institutes or Technical institutes Institutes mainly carry out training in a particular field but do not offer a wide range of research or training in multi-disciplinary subjects. There are a few technical institutes that offer higher education degrees in Cambodia. The main difference between a university and a technical institute is that technical institutes tend to include a larger practical component to their studies, especially field work and on-the-job training. For example, the National Polytechnic Institute has developed a new and modern curriculum with a greater emphasis on practice (70%) rather than theory (30%).
Also, whereas most universities focus mainly on management, accounting, economics and other business-related disciplines, technical institutes (as the term implies) tend to have a greater focus on technical training in the areas of civil engineering, electrical engineering, electronic engineering, information and communication engineering, mechanical and industry engineering. There is a growing recognition that Cambodia is suffering from a lack of qualified engineers to serve the development needs of the country, especially in the construction and manufacturing sectors. Up to now, there are small numbers of graduates in the field of engineering compared with business administration and economics. This issue is covered in Chapter 3 of this report.
2.2.3 Royal Academy of Cambodia The institution is assigned to undertake research to fulfill a think tank role for the nation. The Royal Academy of Cambodia (RAC) is under supervision of the Office of the Council of Ministers. Although the Academy was created for research purposes, the RAC provides advanced degree programs. The training available at the RAC aims to form qualified research teams of various specializations for the RAC itself. Training programs range from master to doctoral degrees16.
2.3 Type of higher education degrees Cambodia’s higher education system is based on a credits system, where students are required to complete a specified number of credits to be awarded a degree. This type of system facilitates part time study and also the transfer of completed credits from one higher education institution to another. Curriculum based on credits is classified into three types – theories, practicalities and on-the-job training (or internships).
HEIs can award several types of degree17, based on the minimum number of credits and the period of full-time study as required by the ACC:
− Bachelor Degree: requires 120 credits over four years (including Foundation Year)
− Masters Degree: requires 45 credits over two years
− Doctor of Philosophy Degree (PhD): requires 45 credits and research over at least three years.
In practice, many universities appear to impose their own credit requirements for bachelor degrees, which are usually slightly higher than ACC’s minimum requirements. However, in order to produce high quality students equipped with necessary skills to enter competitive labor market, HEIs should prepare students beyond credit requirements for degrees and need to make sure that curriculum, teaching method, class size, teaching and learning materials, assessment and feedback are appropriately organized to create enabling inputs for improving quality of education.
In each type of degree, students specialize (or “major”) in a particular discipline. For example, students awarded a bachelor degree will have a major in a discipline such as Accounting, Tourism, Civil Engineering or Information Technology.
16 UNESCO. 2006. Higher Education in South-East Asia, 2006 17 Associate Degree: requires approximately 75 to 85 credits over two years

20
2.4 Enrolment by discipline/field of study Recent developments in the higher education sector make it possible for large numbers of completed Grade 12 students to enroll into higher education institutions, both public and private. Approximate 11% of Grade 12 pass students are on scholarships. The remaining 89% pay fees for their education, which means they have freedom to enroll in the field of studies based on their own interests and ambitions. Most students appear to base this decision on the advice of their family or their interest in a subject, rather than on any understanding of the labor market.18 Part of the reason is because formal labor market information is scarce.
As shown in the table below, approximately 65,734 students (or 48% of total students) are currently enrolled in business-related courses in 2009. These fields of specialty are widely recognized as the most popular among students in both public and private institutions. Both students and their parents seem to place a high value on business studies, in the expectation that they will find a good job in a nice office, with all the associated prestige and financial benefits. In response to this student-driven demand, the majority of higher education providers in Cambodia focus on business-related courses. However, there is a growing perception that there are too many students studying these business-related courses, with supply of graduates outstripping demand.
This perception is supported by the analysis presented in Chapter 3 of this report.
18 In a recent survey, only 20% of high school students said they will base their decision about higher education on the job market (with 70% relying on the advice of their parents). In the same survey, 33% of university and vocational training students said they chose their field of study because of market need (with 59% choosing it because they liked the subject). See Youth and Employment: Bridging the Gap (July 2008), Cambodian Federation of Employers & Business Associations (CAMFEBA), pp.40-42.

Review of Higher Education: Cambodia Page 21 of 82
Table 1: Total Enrolments by Study Discipline in Public and Private HEIs
Study Discipline 2006-2007 % 2007-2008 % 2008-2009 % Three-Year
Average (%) (2007-2009)
Mathematic, Chemistry, Physics, Biology 1,679 1.8% 2,562 2.3% 3,073 2.2% 2.1%
Foundation Year 2,038 2.2% 4,707 4.3% 4,561 3.3% 3.3%
Computer Science 8,149 8.8% 8,769 8.0% 9,523 6.9% 7.9%
Sociology, Humanity and Arts 5,172 5.6% 6,968 6.3% 8,685 6.3% 6.1%
Tourism 3,361 3.6% 3,190 2.9% 2,999 2.2% 2.9%
Foreign Languages 15,200 16.5% 15,797 14.3% 17,370 12.7% 14.5%
Law 4,554 4.9% 5,718 5.2% 7,484 5.5% 5.2%
Health Science 5,341 5.8% 5,411 4.9% 7,817 5.7% 5.5%
Agriculture and Rural Development 3,745 4.1% 3,713 3.4% 5,288 3.9% 3.8%
Engineering and Mechanic 2,870 3.1% 3,349 3.0% 4,719 3.4% 3.2%
Sub-Total (1) 52,109 56% 60,184 55% 71,519 52% 54%
Business Management
- Business 7,265 7.9% 7,669 7.0% 10,846 7.9% 7.6%
- Marketing 842 0.9% 1,329 1.2% 1,610 1.2% 1.1%
- Management 13,445 14.6% 13,657 12.4% 16,768 12.2% 13.1%
- Banking and Finance 1,122 1.2% 1,575 1.4% 3,541 2.6% 1.7%
- Economics 5,653 6.1% 6,262 5.7% 8,729 6.4% 6.1%
- Accounting 8,163 8.8% 12,161 11.0% 15,482 11.3% 10.4%
- Finance 3,741 4.1% 7,253 6.6% 8,758 6.4% 5.7%
Sub-Total (2) 40,231 44% 49,906 45% 65,734 48% 46%
Grand Total (1) + (2) 92,340 100% 110,090 100% 137,253 100% 100%
Source: MoEYS, Department of Higher Education, 2009 and author calculation.

Review of Higher Education: Cambodia Page 22 of 82
Less than 4% of total students are enrolled in the field of Agriculture and Rural Development. This is despite the Agriculture sector contributing 29% of the country’s GDP and supporting the livelihood of 59% of the population. One of the reasons that might explain this situation is that many students view Agriculture as consisting mainly of subsistence farmers, with few opportunities for higher skilled jobs. Foreign Direct Investment and Local Investment in the Agriculture sector have been low over the last decade in comparison to Garments, Tourism and Construction. This has resulted in low employment opportunities in the Agriculture sector which require university graduates to contribute to modernize the sector.
It is important to note that in the past, most graduates from the Royal University of Agriculture were recruited to work for Ministry of Agriculture, Forestry and Fisheries. However, the nature of employment has changed in the last five years. Recently, the majority of graduates in this discipline have been recruited to work for International Organizations (such as Food and Agriculture Organization) and Non-Governmental Organizations working to develop and modernize the Agriculture sector in the country. Up to now, the private sector has not been a large employer of Agriculture graduates due to low investment and development in this sector. This may change over time with the likely emergence of large agribusinesses.
The study of Foreign Languages represents 14% of total enrolments. This number is not surprising given the perceived importance of being able to read and write English – both to study English textbooks in higher education institutions as well as to prepare themselves for jobs. Many Foreign Languages students also study a second discipline, such as management.
Also of note is that only 2% of students are enrolled in Mathematics, Chemistry, Physics, and Biology. Computer science and Health science account for 8% and 5% respectively.
Developing countries like Cambodia typically need plenty of engineers for construction, infrastructure and manufacturing jobs. Despite this, only around 3% of all students are enrolled in the Engineering and Mechanic discipline. Part of the reason is parents and students themselves do not highly value these skills and do not want to work at a construction site.

Review of Higher Education: Cambodia Page 23 of 82
2.5 Future growth prospect of enrolments and graduates As mentioned earlier, student enrolments in both public and private HEIs have grown rapidly over the last decade and show no sign of slowing. With continuing high numbers of first-year students, total enrolments are projected to keep increasing sharply for several coming years. In the absence of a good recording system, it is hard to provide an accurate assessment of future trend of students entering and graduating from HEIs. However, using information available and recent enrolment trends, this report attempts to forecast the total number of enrolments and graduates in three scenarios: (1) Current Trend Scenario; (2) Slow Growth Trend Scenario; and (3) High Growth Trend Scenario.
1. Current Trend Scenario: This assumes that 80% of Grade 12 graduate students enter HEIs and 70% of enrolment students will graduate with a Bachelor Degree. This trend is based mainly on the latest data available and consultations with the heads of HEIs. This trend is likely to continue for a few coming years because HEIs continue to be a popular place for Grade 12 graduate students and school fees appear to be affordable for most students.
2. Slow Growth Trend Scenario: This assumes that 60% of Grade 12 graduate students enter HEIs and 60% of enrolment students will graduate with a Bachelor Degree. This trend is based mainly on the following assumptions: (i) MoEYS, the Accreditation Committee of Cambodia and the HEIs themselves will require higher standards to improve the quality of education; (ii) Anticipated high rates of unemployment among university graduates will force prospective students to consider alternatives to higher education; and (iii) Slightly higher tuition fees will result in lower enrolment in HEIs.
3. High Growth Scenario: This assumes that 85% of Grade 12 graduate students enter HEIs and 80% of enrolment students will graduate with a Bachelor Degree. This trend is based mainly on the following assumptions: (i) Higher education fees will be affordable for most students completing Grade 12; (ii) Neither MoEYS, the Accreditation Committee of Cambodia nor the HEIs themselves will require higher standards than current situation. Therefore, the drop out rate will keep decreasing while pass rate keeps going upwards; and (iii) HEIs will remain a popular place for Grade 12 graduate students.

Review of Higher Education: Cambodia Page 24 of 82
Table 2: Projected number of Grade 12 graduates, enrolments and bachelor degrees
Current Trend Scenario Slow Growth Trend Scenario High Growth Trend Scenario
Year Projected # of
Grade 12 Graduates
Projected 80% of Students Enter HEIs
70% of Enrolment
Student Graduate Bac.
Deg.
Projected 60% of Students Enter HEIs
60% of Enrolment
Student Graduate Bac.
Deg.
Projected 85% of
Students Enter HEIs
80% of Enrolment
Student Graduate Bac.
Deg. 2,006 34,174 * 28,871* - 28,871* - 28,871* - 2,007 43,064 * 34,783* 13,676* 34,783* 13,676* 34,783* 13,676* 2,008 41,964 * 39,305* 16,645* 39,305* 16,645* 39,305* 16,645* 2,009 55,178 * 40,906* 22,929 40,906* 22,929 40,906* 22,929 2,010 97,350 77,880 24,348 58,410 20,870 82,748 27,826 2,011 123,850 99,080 27,514 74,310 23,583 105,273 31,444 2,012 161,440 129,152 28,634 96,864 24,544 137,224 32,725 2,013 158,750 127,000 54,516 95,250 35,046 134,938 66,198 2,014 180,480 144,384 69,356 108,288 44,586 153,408 84,218
Total (2009-2014) 777,048 618,402 227,297 474,028 171,557 654,496 265,340
Notes: * Actual data from MoEYS.
Projected # of Grade 12 graduates from 2010 to 2014 is based on MoEYS, Nov. 2007 projection.
Consultations with several management staff of public and private universities suggest that the Current Trend Scenario is the most likely outcome over the next few years. Based on this Current Trend Scenario, it is estimated that between 2009 and 2014, around 227,000 students are likely to graduate with Bachelor Degrees (see table above).19 This would indicate that the number of Bachelor Degrees will increase on average by around 7% each year from 2009 to 2012, thereafter accelerating sharply from 2013 onwards as a result of large numbers of Grade 12 graduates entering HEIs in 2010.20
However, in a rapidly evolving higher education system and labor market such as Cambodia, it is hard to make accurate projections. It depends on many unpredictable variables, including how much focus is placed on quality versus quantity (by the Government, accreditation agencies and the HEIs themselves) and labor market demand for university graduates.
In terms of Bachelor Degrees by study discipline, under the Current Trend Scenario, it is estimated that from 2009 to 2014, there will be around 104,000 degrees (or 46% of total Bachelor Degrees) in the business related disciplines, especially Management and Accounting. Around
19 It is important to note that projected figures represents the total number of degrees and not the total number of graduates. This is because substantial numbers of students study two bachelor degrees at the same time. 20 The projected number does not include Associate Degree. In 2008, 5,647 students finished associate degree covering a wide range of disciplines. If the total number of Associate Degrees and Bachelor Degrees add up together, it makes the total number of graduates significantly higher.

Review of Higher Education: Cambodia Page 25 of 82
20,000 degrees (or nearly 8% of the total) will be in Computer Science and 33,000 (or 14%) will be in Foreign Languages (predominantly English).
The three tables below provide detailed projections by study discipline for the three trend scenarios.
Table 3: Projected Number of Bachelor Degrees by Discipline – Current Trend Scenario
Bachelor Degree by Discipline Three-Year
Average (%)(2007-2009)
2009 2010 2011 2012 2013 2014 Total
Mathematic, Chemistry, Physics, Biology 2.1% 482 511 578 601 1,145 1,456 4,773 Unspecified Disciplines21 3.3% 749 795 899 935 1,781 2,266 7,425 Computer Science 7.9% 1,811 1,923 2,174 2,262 4,307 5,479 17,956 Sociology, Humanity and Arts 6.1% 1,391 1,477 1,669 1,737 3,307 4,208 13,789 Tourism 2.9% 665 706 798 830 1,581 2,011 6,592 Foreign Languages 14.5% 3,325 3,530 3,989 4,152 7,905 10,057 32,958 Law 5.2% 1,192 1,266 1,431 1,489 2,835 3,607 11,819 Health Science 5.5% 1,253 1,331 1,504 1,565 2,980 3,791 12,426 Agriculture and Rural Development 3.8% 871 925 1,046 1,088 2,072 2,636 8,637 Engineering and Mechanic 3.2% 726 771 871 907 1,726 2,196 7,198
Sub-Total (1) 54.4% 12,466 13,237 14,958 15,567 29,639 37,707 123,574 Business Management - - - - - - - - Business 7.6% 1,743 1,850 2,091 2,176 4,143 5,271 17,275 - Marketing 1.1% 252 268 303 315 600 763 2,500 - Management 13.1% 2,996 3,181 3,595 3,742 7,123 9,063 29,700 - Banking and Finance 1.7% 397 422 477 496 945 1,202 3,940 - Economics 6.1% 1,391 1,477 1,669 1,737 3,307 4,208 13,789 - Accounting 10.4% 2,377 2,524 2,852 2,968 5,651 7,190 23,563 - Finance 5.7% 1,307 1,388 1,568 1,632 3,107 3,953 12,956
Sub-Total (2) 45.6% 10,463 11,111 12,555 13,067 24,877 31,649 103,723 Grand Total (1) + (2) 100.0% 22,929 24,348 27,514 28,634 54,516 69,356 227,297
21 Due to limited data, it is not possible to make clear classification of unspecified disciplines. In this context, unspecified discipline graduates refer to the number of graduates who specialize in one of the following disciplines: Engineering and Mechanic, Business Management, Agriculture and Rural Development, Health Science, Law Foreign Languages, Tourism, Sociology, Humanity and Arts, Computer Science, Mathematic, Chemistry, Physics, Biology.

Review of Higher Education: Cambodia Page 26 of 82
Table 4: Projected Number of Bachelor Degrees by Discipline – Slow Growth Trend Scenario
Bachelor Degree by Discipline Three-Year
Average (%)(2007-2009)
2009 2010 2011 2012 2013 2014 Total
Mathematic, Chemistry, Physics, Biology 2.1% 482 438 495 515 736 936 3,603 Unspecified Disciplines22 3.3% 749 682 770 802 1,145 1,456 5,604 Computer Science 7.9% 1,811 1,649 1,863 1,939 2,769 3,522 13,553 Sociology, Humanity and Arts 6.1% 1,391 1,266 1,431 1,489 2,126 2,705 10,408 Tourism 2.9% 665 605 684 712 1,016 1,293 4,975 Foreign Languages 14.5% 3,325 3,026 3,420 3,559 5,082 6,465 24,876 Law 5.2% 1,192 1,085 1,226 1,276 1,822 2,318 8,921 Health Science 5.5% 1,253 1,141 1,289 1,342 1,916 2,437 9,378 Agriculture and Rural Development 3.8% 871 793 896 933 1,332 1,694 6,519 Engineering and Mechanic 3.2% 726 661 747 777 1,110 1,412 5,433
Sub-Total (1) 54.4% 12,466 11,346 12,821 13,344 19,053 24,240 93,270 Business Management - - - - - - - - Business 7.6% 1,743 1,586 1,792 1,865 2,663 3,389 13,038 - Marketing 1.1% 252 230 259 270 386 490 1,887 - Management 13.1% 2,996 2,727 3,082 3,207 4,579 5,826 22,417 - Banking and Finance 1.7% 397 362 409 425 607 773 2,974 - Economics 6.1% 1,391 1,266 1,431 1,489 2,126 2,705 10,408 - Accounting 10.4% 2,377 2,164 2,445 2,544 3,633 4,622 17,785 - Finance 5.7% 1,307 1,190 1,344 1,399 1,998 2,541 9,779
Sub-Total (2) 45.6% 10,463 9,524 10,762 11,200 15,993 20,346 78,287 Grand Total (1) + (2) 100.0% 22,929 20,870 23,583 24,544 35,046 44,586 171,557
22 Due to limited data, it is not possible to make clear classification of unspecified disciplines. In this context, unspecified discipline graduates refer to the number of graduates who specialize in one of the following disciplines: Engineering and Mechanic, Business Management, Agriculture and Rural Development, Health Science, Law Foreign Languages, Tourism, Sociology, Humanity and Arts, Computer Science, Mathematic, Chemistry, Physics, Biology.

Review of Higher Education: Cambodia Page 27 of 82
Table 5: Projected Number of Bachelor Degrees by Discipline – High Growth Trend Scenario
Bachelor Degree by Discipline Three-Year
Average (%)(2007-2009)
2009 2010 2011 2012 2013 2014 Total
Mathematic, Chemistry, Physics, Biology 2.1% 482 584 660 687 1,390 1,769 5,572 Unspecified Disciplines23 3.3% 749 909 1,027 1,069 2,162 2,751 8,668 Computer Science 7.9% 1,811 2,198 2,484 2,585 5,230 6,653 20,962 Sociology, Humanity and Arts 6.1% 1,391 1,688 1,908 1,985 4,016 5,109 16,097 Tourism 2.9% 665 807 912 949 1,920 2,442 7,695 Foreign Languages 14.5% 3,325 4,035 4,559 4,745 9,599 12,212 38,474 Law 5.2% 1,192 1,447 1,635 1,702 3,442 4,379 13,798 Health Science 5.5% 1,253 1,521 1,719 1,789 3,619 4,604 14,505 Agriculture and Rural Development 3.8% 871 1,057 1,195 1,244 2,516 3,200 10,083 Engineering and Mechanic 3.2% 726 881 996 1,036 2,096 2,667 8,402
Sub-Total (1) 54.4% 12,466 15,128 17,095 17,791 35,990 45,787 144,257 Business Management - - - - - - - - Business 7.6% 1,743 2,115 2,390 2,487 5,031 6,401 20,166 - Marketing 1.1% 252 306 346 360 728 926 2,919 - Management 13.1% 2,996 3,636 4,109 4,276 8,650 11,004 34,671 - Banking and Finance 1.7% 397 482 545 567 1,147 1,460 4,599 - Economics 6.1% 1,391 1,688 1,908 1,985 4,016 5,109 16,097 - Accounting 10.4% 2,377 2,885 3,260 3,392 6,863 8,731 27,507 - Finance 5.7% 1,307 1,586 1,792 1,865 3,773 4,800 15,124
Sub-Total (2) 45.6% 10,463 12,698 14,349 14,933 30,208 38,431 121,084 Grand Total (1) + (2) 100.0% 22,929 27,826 31,444 32,725 66,198 84,218 265,340
23 Due to limited data, it is not possible to make clear classification of unspecified disciplines. In this context, unspecified discipline graduates refer to the number of graduates who specialize in one of the following disciplines: Engineering and Mechanic, Business Management, Agriculture and Rural Development, Health Science, Law Foreign Languages, Tourism, Sociology, Humanity and Arts, Computer Science, Mathematic, Chemistry, Physics, Biology.

Review of Higher Education: Cambodia Page 28 of 82
2.6 School infrastructure The school and classroom conditions are an essential part of teaching quality. Adequate infrastructure and good working conditions improve teaching performance and enable students to study effectively. Articles 29-36 of Prakas 1435 (On the Establishment of Higher Education Institutions) set out the infrastructure requirements for certification as an HEI, including adequate land and space for buildings and classrooms, modern learning materials and equipment, a library, computer facilities and access to the internet.
Based on interviews with students, staff and field observation at public and private universities, it appears that higher education providers in Cambodia suffer from a lack of physical infrastructure to be able to deliver high quality teaching. Good progress has been made in recent years in supplying more buildings to meet the enrolment demand. However, laboratories for experiments and technical equipment for some fields of studies is badly needed.
With a few exceptions, public universities have more space than private universities and inherited the property from the Government. Consequently, they tend to occupy enough land to provide adequate space for administration buildings, classrooms, library, canteen, parking, sitting and recreational areas, and sporting facilities. They tend not to suffer from overcrowding problems. In contrast, private universities in Phnom Penh normally occupy a smaller land area in the centre of the city. As such, it can be difficult to expand the campus due to high land prices and construction costs. Overcrowding is a common problem in private universities.
Within private universities, there is a big difference in infrastructure between the top, well-funded private universities and smaller private universities. The top ones have good access to textbooks, publications, computers, etc., while the smaller ones often lack adequate access. This contributes to big differences in the quality of education between top private universities and the other private universities.
2.7 Research capacities Research undertaken by Cambodian HEIs is very limited. The government budget allocated for research activities in public HEIs is virtually non-existent. Research activities in some leading public universities, such as the Royal University of Phnom Penh and Royal University of Agriculture, are possible only through assistance from foreign donors and partners; research is virtually absent in private HEIs. A recent study of five top HEIs in Cambodia found that “only 6% of lecturers hold PhD degree and about 85% never published any papers”.24
Similarly, another report found that: “Research programs and the relevant training in methodology is confined to a few institutions leaving most institutions without one of the principal drivers of program relevance and academic quality. As a result the majority of theses presented in the award of post-graduate degree are of poor quality.”25
We refer to research as Applied Research or Basic Research. HEIs should pay more attention to basic and applied research aiming at updating curriculum and producing Market Research Papers and Social Issues Papers. Without basic research, both teachers and students do not know how to conduct simple search. For example agriculture research could allow researchers can use a good seed in other country and conduct applied research to make sure that that seed is adaptive to Cambodia’s soil and climate before they can recommend a seed type to farmers to grow. The term research here is does not mean discovery research which HEIs should invest in discovery research attempting to produce a ground breakthrough finding. It is likely impossible to achieve in the medium term.
24 Chen, Ching-Yaw; Sok, Phyra; Sok, Keomony. 2007. Benchmarking Potential Factors Leading to Education Quality: A Study of Cambodian Higher Education in Quality Assurance in Education: An International Perspective, v15 n2, pp.128-148, 2007 25 Vision, Strategy & Human Resources Development Plan for MoEYS Higher Education, Consultant’s Report, Dr. Vin McNamara, 2008, pp. 28.

Review of Higher Education: Cambodia Page 29 of 82
Generally, research capacity is at a very young stage of development and there is still a long way to go for both public and private HEIs. This may not only result from the inadequacy of research budgets and qualified researchers, but also from the lack of supporting infrastructure, such as research facilities, laboratories and copyright regulations.26 Until recently, leading public higher education providers in collaboration with International Organizations and Universities abroad have been conducting applied research to address some social issues in the country. Examples of research projects include27 (1) Migration, rural poverty, and natural resource management; (2) Industrial skills development in Cambodia; (3) Capacity building for gender, poverty and mobility analysis; (4) Study of financial access to health service for the poor; and (5) Community needs and attitudes to the impact of growth and development in Phnom Penh. This form of collaboration provides technical and financial supports to assist leading higher education providers to build up their capacity in order to be able to deliver applied research in the future. However, up to now, there are no known instances where applied research by Cambodian higher education providers has produced high quality research findings that have translated into innovation for Cambodia’s productive sector.
Despite the weakness of research at the university level, MoEYS has put some efforts into promoting research and development by establishing two research departments: the Scientific Research Department and the Pedagogical Department. Although these two departments have very limited capacity and scope, their existence shows the importance placed by Cambodian policy makers on promoting research activity. However, achievement in doing research is still limited and needs great improvement in order to serve the needs for sustaining economic growth and society as a whole.
2.8 Teaching methodology Teachers play a critical role in encouraging the learning process in the classroom and the ability of students to absorb knowledge from teachers is largely influenced by teaching methodology. Based on consultations with teachers and students, it appears that Cambodian teachers usually adopt a teacher-centered approach delivering instruction by face to face interaction. This approach allows teachers to talk most of the teaching time in the classroom while the students listen to what the teacher instructs to them. Some persons would compare this teaching method to the process of transferring knowledge from the tea pot to the tea cup. This implies that students only learn what their teachers teach or instruct them. As one report commented: “There are also few staff with the knowledge of modern theories of activity learning so that “chalk and talk”, supplemented by course notes prepared by the professor, tend to be the principal media of instruction.”28
The teacher-centered approach is generally viewed as an ineffective method for higher education level, compared to a student-centered approach where students play an active role in the learning process as well as classroom activities. This is because students learning at higher institutions need to learn independently by reading various textbooks, analyzing case studies and solving problems on their own. According to consultations with a number of students, only a small percentage of students can learn independently with little supervision from teachers and students themselves need to demonstrate their commitment to learn and consult with teachers in assisting the learning process with the view of self development.
Transforming the teaching methodology from a teacher-centered approach into a student-centered approach is not an easy task. For a student-centered approach to be effective, there needs to be limited numbers of students in the classroom, an appropriate curriculum, adequate campus facilities, and students who are genuinely committed to the learning process. Generally speaking, Cambodia’s HEIs suffer from a lack of qualified teachers, teaching materials, buildings and experiment equipment due to the legacy of destruction of the Pol Pot era and the early stage of development of this sector. Up to now,
26 C. Chealy. 2009. The Political Economy of Educational Reforms and Capacity Development in Southeast Asia: Higher Education in Cambodia, pp. 161, Springer. 27 RUPP, Master of Arts in Development Studies: Information Handbook, 2009-2011, pp. 10 28 Vision, Strategy & Human Resources Development Plan for MoEYS Higher Education, Consultant’s Report, Dr. Vin McNamara, 2008, pp. 28.

Review of Higher Education: Cambodia Page 30 of 82
significant progress has been made in improving teaching materials and classroom conditions. However, much remains to be done to cope with a rapid changing learning environment to meet the needs of the labor market.
Given that the average number of students per classroom tends to be around 40 to 60 students in a limited classroom space, it is difficult for teachers to instruct students in a style that encourages students to express their ideas and interact with other students. Large numbers of students in the classroom also make it impossible for teachers to organize the students in several groups, get them to share their viewpoints and make presentations to other students in the classroom. This learning process is very useful in encouraging students to read the textbooks and building up the confidence of students over a period of time.
Teaching materials is another important tool in promoting the learning process. Student access to things like LCDs, computers, up-to-date textbooks and experiment materials would create a better learning environment and thereby improve the quality of higher education.
Apart from teaching methodology, teachers are also required to impose stricter measures for class examination and group assignment since these are part of classroom requirements. HEIs in Cambodia cannot afford to allow students to rely on other students for examination and group assignment without putting best efforts in preparation while they can enjoy receiving the same grade as students studying hard in the classroom. This would discourage students studying hard in the classroom due to unfair treatment and yield negative effect on the quality of education resulting from inability to judge student’s performance from transcript standpoint.
HR Manager Interview: “If I refer to the people who I have met during the interview, I would say the quality is limited. However, if I look at the overall higher education at the moment, I think it improves significantly in term of accessibility to international school which adapts the international standard. Nevertheless, this kind of education is quite expensive.”
2.9 Teacher quality Teacher quality is vital to enhance the learning process and has a profound impact on a student’s performance. However, access to qualified teachers is often identified as one of the main challenges facing HEIs in Cambodia today, especially teachers holding a doctor degree with practical experience.
This highlights the importance of teacher recruitment and remuneration processes.
In general, HEIs recruit teaching staff in the same way as any other organization – by announcing job vacancies, screening applicants and interviewing the best candidates. In addition, sometimes candidates are required to teach a class to demonstrate their ability in the classroom. The most highly sought after candidates are those with substantial teaching experiences and who graduated from a recognized university abroad. However, it is not uncommon for HEIs to recruit as teachers their own fresh graduates, leading to the complaint that many teachers have no practical work experience at all.
In terms of remuneration, the ability of HEIs to recruit highly qualified teaching staff is largely depended on how much they can afford to pay. This has led to the situation in which leading HEIs with strong financial positions can recruit experienced and qualified teachers easily in comparison to HEIs with limited budgets.
Based on the MoEYS regulation, teaching staff at HEIs need to hold a higher certificate than the level at which they are teaching – unless they have at least three years professional experience. In general, teaching staff holding a master degree can instruct students attending a bachelor degree program, and teaching staff possessing a doctor degree can instruct students attending a master degree program.
Despite this regulation, it appears that many students studying bachelor degrees are actually being taught by teachers who possess the same level of degree. In total, there are 8,169 staff teaching bachelor degrees at public and private HEIs in Cambodia. Of this total, 7% hold a PhD degree, 53% hold a master degree and the remaining 40% possess a bachelor degree only. These figures suggest that only a small proportion of students studying bachelor degrees have a chance to study with teachers

Review of Higher Education: Cambodia Page 31 of 82
who hold a PhD degree. Also, the proportion of female teachers is very low in comparison with male teachers, accounting for only 10% of total teaching staff for bachelor degree. See the figure and table below for details.
Figure 7: Number of Teaching Staff Holding PhD, Master and Bachelor
Bachelor, 3295, 40%
Master, 4264, 53%
PhD., 610, 7%
Source: Compiled from Department of Higher Education: Statistics of Students in Academic Year 2008-2009
Table 6: Teaching Staff for Bachelor Degree in Public and Private HEIs
National Teachers Foreign Teachers Type
Bachelor Master PhD. Bachelor Master PhD. Total % of Female
Teachers
Public Institutions 1,385 1,465 205 51 137 42 3,285 12% Private Institutions 1,712 2,502 313 147 160 50 4,884 8%
Total 3,097 3,967 518 198 297 92 8,169 10%
Source: Compiled from Department of Higher Education: Statistics of Students in Academic Year 2008-2009
The maximum teaching hours per week is 24 hours and teachers cannot teach more than three courses per semester and teacher and student ratio is 1/30.
Compared to 10 years ago, the number of qualified teaching staff has increased over time. In part, this is due to developed countries offering around 100 scholarships annually to students to pursue a master degree in their countries. Each year, many of these scholarship students return with their master degree from abroad and teach at HEIs in Cambodia, mostly in Phnom Penh. Similarly, more and more teachers pursue their master degree domestically to upgrade their capacity and skills. As a result, most teachers who are teaching bachelor degree programs now hold a master degree, whether obtained domestically or internationally.
Public and private HEIs recruit both part time and full time teaching staff. It is not easy to make a clear distinction between full time and part time teachers because teacher salaries are paid based on teaching hours. Under usual circumstance, full time teacher refers to those who teach during the daytime or working hours while part time teacher refers to those who teach evening or weekend classes. In most cases, part time teachers already have a primary occupation and use part time teaching to supplement their income.
There are pros and cons for part time teachers. On the positive side, they can share with students their practical experiences from their work, which gives students a better understanding of real work. On the negative side, part time teachers themselves do not have sufficient time to conduct research or prepare teaching materials, and often consider the teaching job as a secondary job for supplementary income.
In connection to teacher compensation in public HEIs, it is estimated that teachers receive an average monthly salary of $100 from the Government by teaching 12 hours per week or about

Review of Higher Education: Cambodia Page 32 of 82
$2 per hour. Supplementary hours are paid at a significantly higher level. Typically – but not in all cases – a teacher with a master degree, teaching students enrolled in a bachelor program at a reasonably well-funded university, can earn around $12 per hour. In order to earn $400 per month, teachers need to teach about 25 supplementary hours per month. In the event that teachers teach more than 25 supplementary hours per month, their income keeps increasing. For leading private universities, it is estimated that teachers receives around $800 per month29 by teaching many hours, which in itself can be a concern for the quality of education.
2.10 Case Study of Innovation/Adaptation in Vocational Training
Box 1: Centre for Information System Training (CIST) Case Study in Cambodia Case Study on E-learning and Giving Online Access to Learning (GOAL) Project
Centre for Information Systems Training (CIST) is a not-for profit vocational training centre in Cambodia working toward bringing digital opportunities to disadvantaged young people. CIST provides two-year Information Technology (IT) courses to poor students in areas such as Systems and Networks Administration, and Programming. In addition to these courses, CIST recently launched an innovative concept called E-learning and also plans to launch another project called Giving Online Access to Learning (GOAL).
2.10.1 E-learning At CIST, E-learning is another tool for students to learn in addition to the physical classroom (face-to-face) study environment. The E-learning system developed at CIST is free and easy to use. CIST students can access a database from which they can retrieve class lessons, other documents and quizzes. Students can also chat with their teachers if they have any questions and if they are on-line.
Currently, CIST’s E-learning is a pilot project with plans for three modules – Company Knowledge, General/Social Knowledge and Professional Life. Commencing in October 2009, this pilot project lasts for approximately 280 hours and will finish in March 2010. For example, one of the Professional Life lessons that involves studying negotiation and debating skills has already been completed. The development of E-learning includes the following five main elements:
a. Instructional Design
Instructional design refers to the design of the content, so that the look and feel of the course on the database makes it easy for students to understand the content while learning alone. Pictures and diagrams are used to retain student interest and attract them to learn. At this stage, the student evaluation management including quiz, mid-term and final exam is also defined.
b. Technology
E-learning needs to use the IT system as the term implied. The technical assistance includes learning management system (database management), authoring tool (content management), computer types and speed, quiz and exam tool design and interactivity.
c. Concept Development
This is the transformation stage from the traditional content management into the sophisticated one. Reviewing content and understanding the context is necessary before coming to the design in this modern authoring tool. Added value such as multimedia, animation, picture, and diagram are really important and indispensable in this content design.
d. Course Management
Course management refers to the structure or organization of the E-learning class, including agenda of the class without and with trainer (face-to-face discussion session), quiz and other training material development,
29 This figure is based on interview with lecturers teaching at HEIs

Review of Higher Education: Cambodia Page 33 of 82
agenda of chatting system and forum, preparation of instruction document and presentation. Also, this is very important that the objectives of the course are achieved in the end.
e. Monitoring and Evaluation
This is the evaluation of the tool development. It is done to assess the effectiveness and the adaptation of the E-learning tool from different points of view including learners, trainers and organizations. All possible improvement is followed by the result of this evaluation.
To sum up, the E-learning developed by CIST is another tool to help and encourage their students to learn. The aim is that students find E-learning to be an interesting and effective way to complement their face-to-face class activities. If successful, this concept could be expanded by CIST and perhaps other training centres, schools or universities.
2.10.2 Giving Online Access to Learning (GOAL) Project The GOAL project is another innovative distance learning project that is new to Cambodia’s education system. This project is being developed by CIST in conjunction with another NGO called Connected Schools. Other NGOs are also involved in the project, including Don Bosco (a vocational training centre in Cambodia and in others countries). The project is also assisted and sponsored by Smart Mobile, a telecom operator in Cambodia in providing communication network. The purpose of the GOAL project is to help rural students of vocational training centres to have access to the content and courses that are not provided locally by the teachers and to help the teachers in these rural vocational training centers to make their skills grow. To put this idea and design into sustainable practices, Connected Schools and CIST are in the phase of seeking supporters or partners from a fundraising perspective.
The content will be delivered by two complementary methods:
1. Off-line: Teachers and students will have access to the different types of content and other learning materials stored in a database located in Phnom Penh through the computer from their classroom (provided by the GOAL project).
2. On-line: In an online classroom session, a teacher located in Phnom Penh is equipped with a laptop, a microphone and an interactive whiteboard which he can write on. The remote classroom located outside Phnom Penh is also equipped with laptop, beamer, microphone and speakers. The students in the rural schools are able to follow the lecture as if they were in Phnom Penh – looking at the “same” whiteboard, listening to the teacher, and asking and answering questions.
The courses of the distance learning will include professional trainings, basic computer skills, business life, English language and other academic subjects like geography, physic, chemistry, and mathematics.
The GOAL project is planned to be implemented in five provinces including Battambang, Takeo, Stoeung Treng, Kampot and Svay Rieng. The selection of these locations is based on the indication of the Ministry of Labor and Vocational Training and the availability of the communication network that Smart Mobile has. The fixed set-up costs to equip a remote classroom range from US$ 1,500 – 3,000 depending on the need to provide electricity via a solar panel.

Review of Higher Education: Cambodia Page 34 of 82
2.11 Public and private fees for higher education Public resources are allocated to public HEIs only. For public universities operating under MoEYS, the top public universities receive public subsidies of around $110 per student, while the smaller universities receive public subsidies of around $163 per student. Public universities that operate under line ministries have the highest public contribution per student, of $37830. This high level of public funding is due to the fact that three of them, the Royal University of Agriculture, the Royal University of Fine Arts and the National University of Defense, have been relatively unsuccessful in attracting fee-paying students, leading to a much lower student/teacher ratio and higher unit costs.
Even for public HEIs, private fees represent their largest source of funding, accounting for $313 for top public universities in Phnom Penh, $81 for provincial universities and $353 for line ministry universities. This last figure is surprisingly high because the public contribution to this group is already the highest. This is due to the role of the University of Health Science, which is quite popular, and charges among the highest fees in the country ($469 on average).
Private universities charge an average of $365, with universities in Phnom Penh charging slightly higher than universities in the provinces. Total unit costs per student appear to be higher in public institutions ($460 on average, including both public and private sources) than in private institutions ($365 on average).31
Figure 8: Average annual higher education fees
365
460408
0
100
200
300
400
500
Private University(Private Source Only)
Public University(Public & Private
Sources)
Cambodia
Source: Francois Orive: Financing higher education in Cambodia, Prepared for the World Bank, March, 2009
The fact that more than 80% of completed Grade 12 students enroll into higher education suggests that these fees are affordable – at least for those who have had the opportunity to complete Grade 12. However, it also suggests that the low fees offered by some HEIs is likely to lead to limited education services causing concerns about quality of education.
The average annual unit cost of a Cambodian student is equal to $408, which is equal to 58% of Cambodia’s GDP per capita. This figure is on the low side among least developed countries, where unit costs tend to be higher than GDP per capita, sometimes 3 to 4 times GDP per capita32. A previous study indicated that the unit cost in Cambodia was above GDP per capita (somewhere between 1.3 and 1.6 times GDP per capita) in late 1990s, and fees were higher than today. The real cost of higher education is declining, which is likely the outcome of fierce competition between HEIs to attract
30 Francois Orivel. 2009. Financing higher education in Cambodia, March 2009. pp.86 31 Francois Orivel. 2009. Financing higher education in Cambodia, March 2009. pp. 86 32 Francois Orivel. 2009. Financing higher education in Cambodia, March 2009.

Review of Higher Education: Cambodia Page 35 of 82
students. Some HEIs are known for charging very low fees, possibly to the detriment of education quality.
2.12 Main Governance Features
2.12.1 Background Higher Education governance falls under the mandate of the Ministry of Education, Youth and Sport (MoEYs). This ministry is primarily responsible for the primary, secondary and higher education overall in Cambodia. All aspects of higher education management whether administration or licensing fall under the responsibility of the Department of Higher Education. To ensure a focus on quality, the Accreditation Committee of Cambodia was established (ACC), which is an independent body under the Council of Ministers working in close collaboration with MoEYs to monitor and ensure the quality of higher education.
Prior to the third legislature of the Royal Government of Cambodia, the Ministry of Education Youth and Sport managed Technical Vocational training. The management structure at the time was complicated and ineffective resulting in the TVET education system not addressing the needs of the market. During the 3rd legislature, technical vocational training The Ministry of Labor and Vocational training was created under which Technical Vocational training was moved. Although this aimed to improve the quality of vocational training and address a number of challenges relating to the importance of technical vocational training, several new and challenges are emerging as to the need for collaboration of higher education and TVET systems.
Given the lack of labor market information systems, the challenges in matching supply and demand of skills in the market and ensuring that education systems overall meet the needs of the labor market, it is important to take a step back and consider and understand the overall education system and its development in Cambodia.
Today, the governance of training and education falls under 2 separate ministries:
1. The Ministry of Education, Youth and Sports (MOEYS) is responsible for primary, secondary and higher education and
2. The Ministry of Labor and Vocational Training (MOLVT) is responsible for the implementation of technical vocational education and training programmes (TVET) through the Directorate General of Technical Vocational Education and Training (DGTVET)
As presented in the table below, the General Education system (primary and secondary school) are governed by the MoEYs. The Ministry of Education is currently developing “technical vocational options” for Upper Secondary students that allows them to select from a list of practical training courses (IT and Tourism are currently under development) which allow students to gain practical skills that will allow them to enter the labor force immediately after high school, if they are unable to undertake further education. The MOEYs Department of Pedagogy Research is currently producing such practical trainings in collaboration with private sector and other inputs. The MoLVT is also developing such technical vocational training programmes which can be undertaken by youth today in a variety of different skills under the provincial training departments. It is not clear whether or not MoLVT training programmes are or will be incorporated into the General Education system. Already it is clear that closer collaboration between the two Ministries is required and interviews with government and private sector during the course of this study identify the need for the two ministries to cooperate closer, whether on curriculum development, data collection or sharing of market related information. Post the General Education which is mandatory for all Cambodians, youth can elect to enter technical vocational training or the Higher Education system. For both types of education, the higher education and TVET system provides of intend to provide bachelor, master and PhD degrees.

Review of Higher Education: Cambodia Page 36 of 82
Table 6: National Qualification Framework (Draft)
MoEYS MoLVT MoEYS
Level General Education System TVET System Higher Education System
7 PhD in Technology / Business
PhD (Specialisation)
6 Master Degree in Technology / Business
Master Degree (Specialisation)
5 Bachelor Degree in Technology / Business
Bachelor Degree (Specialisation)
4
Higher Diploma of Technology
Higher Diploma of Business
Associate degree
3 Technical Vocational Diploma Level III
2 Technical Vocational Diploma Level II
1
Upper Secondary School Certificate
Technical Vocational Diploma Level I
Entry Lower Secondary School Certificate Vocational Training Certificate
Source: the ‘Labor Market and Youth Employment’, 2008; MoLVT.
2.12.2 Higher Education Governance Structure The overall governance structure of the MOEYS is broken into 5 General Directorates including: (1) Directorate General of Administration and Finance (2) Directorate General of Education (primary and second school education) (3) Directorate General of Higher Education (4) Directorate General of Youth and Sport (5) Inspectorate General
The strategy and development of higher education falls under the Department of Higher Education (DHE) within the Ministry of Education, Youth and Sports (MOEYS) however, a variety of other ministries and agencies, 8 in total, are involved in providing higher education services and accessing public education budgets.
The Directorate of Higher Education has 2 main departments: (1) The Department of Higher Education and (2) the Department of Science Research. The Department of Higher Education is led by a director in charge supported by 4 Vice directors in charge of 5 offices; (1) The Academic Coordination Office, (2) the Statistical Information Office, (3) the Policy Office, (4) the Inspection Office and (5) the Administration office. Financial matters relating to Higher Education take place in the Directorate General of Administration and Finance. A total of 64 staff are employed by the Department of Higher Education, of which 18 are female staff members. These functions are not housed within the Ministry of Education, Youth and Sport, however, located in a different building. The Department of Science Research is responsible for research and development for Higher Education sector. Financing and accounting matters and Human Resources fall under the Directorate General of Administration and Finance. An overall organization chart is provided in the Appendix. Staffing of the various higher education departments was raised as a key challenge and constraint for senior staff members. Personnel with appropriate skills and experience as well as challenges related to attendance, commitment were the main issues surfacing during interviews. Senior personnel often have too much work and not sufficient support to enable effective development, strategic planning and attention to being proactive to address the importance of higher education. Human Resource planning

Review of Higher Education: Cambodia Page 37 of 82
and development overall require attention to ensure that staff are receiving relevant training needed, and not training assumed to be needed. Clarity of roles and responsibilities, clear job descriptions and performance criteria, and overall a clear HR strategy for the Department of Higher Education and assessment of the capacity, skills in place and skills needed, need to be addressed. This is also confirmed in a recent study stating “staff utilization and development is quite wasteful due to lack of experience of and knowledge of basic organizational procedures by the majority of staff. ….Unnecessary procedural routines that overload managers and distract them from their primary responsibilities.”33 Although in general, infrastructure is available for implementing work a lack of computers and IT infrastructure were noted as the most important needs of various departments. Overall, there is need for a detailed review of skills and resources required to be able to function effectively.
2.12.3 Quality and Accreditation The quality of Higher Education is a sensitive topic and ambiguous given the complexity of registration and the availability of information or understanding of relevant rules and regulations. The recent establishment of the Accreditation Committee of Cambodia which is an independent body housed within the Council of Administrative Reform, is a move to address the need of quality HE. The ACC has established so far, only the requirements for accreditation for the foundation year courses or associate degree and in process of developing new frameworks for accrediting bachelor degree programs. To date, ACC representatives have not had any challenges regarding implementation of processes and procedures. Personnel note a lack of resources and knowledge and skills for further strengthening of the ACC and its role overall. Higher education licensing is a “complex and contradictory” topic which has evolved over 29 year of accumulated policy decisions on HE, relevant to a specific time, but not in a coherent and strategic manner. Further challenges arise in the historical organization of TVET training initially under MoEYS and now under MoLVT and the politics involved. As noted by personnel interviewed in this study and documented in recent World Bank Studies, many institutions calling themselves HEIs are not deserving nor meet the criteria of HEIs. Overall, licensing requires a thorough assessment and clearly articulated policies that align with a government HE vision and vision for the Cambodian workforce. With an increasing number of youth coming out of school with dreams of obtaining degrees from universities and prosperous jobs to build their future, accreditation is an important aspect in the eyes of youth to ensure the government endorses the quality of the institution.
2.12.4 Autonomy and Decentralization HEIs are responsible for the development of their own curricula and are provided little inputs from the DHE. HEIs have a significant amount of flexibility to develop and implement curriculums however, very often lack the required resources, to ensure curricula is appropriate and meeting the needs of the labor market. This is one of the key challenges of HE overall. Cambodia’s leading universities have better resources to address curriculum development, however, during this study noted that additional support is needed from the ministry to ensure that curricula meet the needs of the market.
Links with employment market or private sector in building curricula is the responsibility of the university. Universities may have key informants or advisors to help them, however, little of no guidance is provided from the DHE itself. Growing sectors such as tourism my spur the creation of hospitality degrees which will in turn be ‘copied’ by smaller universities who lack the resources to do a thorough investigation on market needs. Without a labor market information system which can inform universities proactively as to future skills needed, development and implementation is often reactive to address the needs of the market as they arise.
Both private and public universities have varying degrees of autonomy in their operations. Public universities are undergoing a transformation into more decentralized management, including taking in fee paying students, to build the capacity and revenue streams of the university. Government financing 33 Vision, strategy & HR development Plan for MoEYS Higher Education, Dr. Vin Macnamara, Page 19

Review of Higher Education: Cambodia Page 38 of 82
is managed through standard government reporting and budgets however, the “control” of additional revenues is an issue raised by MOEYs as a challenge to control and monitor as it is difficult to get transparent information. Private universities are independent and autonomous in their operations, financing and curricula development overall.
2.12.5 Private Sector Collaboration The collaboration with with private sector or rather, the employment market is becoming one of the key issues to address in ensuring that HE meets the demands of the labor market. “Education is a business, not an education” is often a phrase that employers use when discussing HE challenges.
As mentioned above briefly, government does not have working group with private sector on labor market needs, rather, it is left to the university to make these relevant links. Some universities may consult with private sector regarding their curriculum however most university will have a “curriculum review committee” that will look to update curriculums based on market knowledge, government reports, and the ‘general feeling and perception” of the labor market. Detailed studies nor broader consultations with private sector are used to inform ‘overall HE curriculum development”.
It is only recently, that attention has been drawn to the quality of HE. It is easy enough for private sector to make links with universities or technical institutes, however, resources and the challenges with developing workforces overall have industries such as the garment sector and hotel sector, focusing on setting up national training centers to address their basic skills needs.
While independent links with universities may exist and a company may advise a university, a cohesive strategy to address the needs of industry, collect its inputs, forecast in labor needs and skills does not exists in any productive or constructive manner yet. Employers tend to focus more on the development of skills (TVET type training) and address the quality and/or skills short falls in HE through internal training programs to develop and groom managers for the future.
2.12.6 Labor Market Information A labor market system does not exist in the market yet. This study attempts to map out future needs of HE needs in the market, however, requires further refinement in its assumptions and development as to the skills that are required, within the industries and study fields it addresses.
The MoLVT will establish a labor market information system (LMIS) through ADB funding. Given the historical challenges in coordination and collaboration between MoLVT and MOEYS, it is important that a collaborative approach be taken if a LMIS is to be successful and inform education systems overall. Detailed information on the proposed system does not exist.
Lack of information and access to information remains a key challenge for youth today in finding employment. A study conducted by CAMFEBA34 in 2008 documents these challenges clearly for youth. CAMFEBA has a Youth Employment programme, addressing these needs through training programs, quick reference guides and an information centre to help youth prepare for the work place.
34 Cambodian Federation of Employers and Business Associations: Cambodian umbrella employers association.

Review of Higher Education: Cambodia Page 39 of 82
2.13 Main Financing Features The needs related to financing and governance are best captured in the work of Dr. Vin Maknamara:
“With the development of fee funded private universities from 1997, the public faculties followed the private fee charging model and had themselves re-designated by Government as Universities or Institutes of Higher Education, so increasing, in the competition for market share with the numerous private “universities” appearing on the scene, the attractiveness of their institutional name to fee-paying students.
As the initiators, deciders of, collectors and managers of fees, the HEIs were de facto decentralized, but without the necessary models of complementary central policy framework/support and of institution level governance and FM processes. Government attempted to address this problem by providing model sub-decrees for the establishment of public HEIs as autonomous Public Administrative Institutions
However in the absence of any training, and therefore of adequate concepts and accepted models of governance and FM at either central or HEI levels, the PAI decrees are honored more in the breach than in the observance. Central agencies make decisions that should be made by the HEIs (e.g. the signing of diplomas and degrees by the Minister) & HEIs often depend on this official legitimatization of their degrees rather than take the necessary responsibility and initiatives to qualify for the accreditation of their own unique program by the Accreditation Committee of Cambodia (ACC).
As a result there is much confusion as to the complementary roles of the two levels of HE governance and FM and considerable inefficiency and waste in the planning and management of scarce resources (see Ministry supervision of HEI examinations, the award of HEI degrees, and the licensing of HEIs.
Clearly there is a priority need for a long term capacity development program in institutional governance and FM, supported by complementary capacity development of the DHE’s HEI support offices.
There is a need for managers of central guidance and support to HEIs, and for HEI managers of devolved responsibilities, to understand and apply the concepts, models and procedures of the Governance and FM of a coordinated system of autonomous HEIs, each capable of servicing some aspect of national needs for intellectual leaders and professional staff. HE central agencies need the conceptual development and the capacity to advise Government on the establishment of a policy framework to strengthen de-concentrated management of HEIs and to implement that framework in close consultation with their HEI clients. HEI managers need complementary concepts of the opportunities for management freedom, institutional and manager responsibility, the accompanying accountability, and the capacity to manage proactively at institutional level. Ideally some managers at the two interdependent levels (central HE and HEI management) need to get practical experience so as to understand better the functions and roles of the complementary level (e.g. by secondments of a year or more).
Universities lack the infrastructure and systems to manage and coordinate administration and financial matters effectively. The majority universities use simple excel tracking tools while very few, have a formal system that can be considered as a comprehensive management system for Higher education. A rapid assessment of the TVET and HE sector in late 2008 by HRINC documents the challenges that universities face in managing administrative matters.
Public expenditure for Tertiary Education Higher education financing is relatively complex in so far as data is not consolidated, nor sufficiently detailed in that which is presented publicly, and a significant portion of the budget is found in the line items of several other ministries. The budget for the ACC is under the direct control of the Council of Ministers.
None the less, the overall budget for MOEYS HE in 2007, amounted to US$4,578,313 and 2008 a decrease to US$4,253, 012. The budget consists of two components, a recurrent budget which amounts to 86% and 83% of the total budget respectively and includes salaries, utilities, water, others and total non salary expenditure. The second component of the budget is called “programme budget”

Review of Higher Education: Cambodia Page 40 of 82
which accounts for 14% and 17% respectively for the years 2007 and 2008. The program budget covers 3 subcomponents, teachers, students and the institution itself. Program budgets are noted to be difficult to manage due to their inflexibility and procedures which no longer in accordance with current practices35. For example, hourly rates paid by the program budgets are significantly lower than the real practice.
When including the budget lines for HE spending in other ministries the overall public spending on HE in 2008 (only available data), the overall budget almost doubles to US$10,971,751. MOEYS (US$4.2million), Ministry of Health (US$1.9 million) and Ministry of Defense (1.3million) and Others (US$2million). Ministry of Culture and Ministry of Agriculture share a similar budget of US$628 thousand. The Ministry of Economy and Finance and Ministry US$172 thousand and the ACC US$47 thousand.
The share of the GDP dedicated to public expenditure for high education in 2008 is far below the world average of 1%, in 2008, the share can be estimated at 0.13% of GDP36.
Private funding of higher education Fees that HEI charge are not regulated and each university sets its own level of fee. Competition amongst HEIs is high, however, with the increasing number of high school students entering the market provides universities with the flexibility to be able to control the increase in fees to remain attractive. Fees can range from anywhere from 200 per year to 750 per year depending on the degree. Smaller, poorly funded universities in the market may even charge as little as US$100 per year. Similar challenges to public sector funding exist in that synthesized data does not exist to enable answering whether or not funding is spent in right areas, or how it can be better spent. The study on financing of higher education in 2009 estimates total private funding of higher education amounted to approximately 42.36 million in 2007-8. Government, university and private sector representatives interviewed note that the biggest challenges universities face and require funding for include infrastructure development including experimental laboratories, more teacher and student facilities e.g research centers, laboratories, libraries, computers, etc. technical resources on matters such as curriculum development an need for universities to collaborate more closely overall to ensure HE meets the needs of the labor market.
35 Financing of HE in Cambodia, Francois Orivel, March 2009 36 Financing of HE in Cambodia, Francois Orivel, March 2009

Review of Higher Education: Cambodia Page 41 of 82
Chapter 3: Demand Side
The previous chapter looked at issues relating to the supply of higher-level skills in Cambodia, focusing on the country’s higher education system. This chapter considers the other side of the same coin – the demand for higher-level skills from employers.
Section 3.1 examines the financial returns from higher education. Section 3.2 estimates employers’ current and future demand for university graduates, by sector and by field of study. Section 3.3 compares this labor market demand with the anticipated supply of university graduates, with a view to identifying key demand-supply mismatches. Finally, section 3.4 examines the specific types of skills that are needed in the workplace.
3.1 Returns from higher education
3.1.1 Previous studies Two recent studies conducted detailed analyses of the returns to education in Cambodia:
• Demand for Skills, Supply of Skills and Returns to Schooling in Cambodia, by Chris Sakellariou, Economic Growth Centre, Nanyang Technological University, Singapore, Working Paper No. 2008/05
• Returns to Education in Cambodia: Results from the 2007 Socio�Economic Survey, Nov 2008, by Ashish Lall, Asia Competitiveness Institute, LKY School of Public Policy, National University of Singapore.
Each of these studies applies conventional econometric techniques to estimate returns to education, including Ordinary Least Squares (OLS) and Instrumental Variable (IV) estimation. Sakellariou (2008) uses data from Cambodia’s socio-economic surveys of 1997 and 2004, whereas Lall (2008) uses more recent data from the 2007 socio-economic survey. In very basic terms, each of these studies conducts regression analysis on the Cambodian data, with earnings as the dependent variable and years of education as one of the independent variables.
Using 2004 data, Sakellariou (2008) finds that the higher the education level, the higher the wage. In terms of hourly wages, university degree holders earned on average 1.8 times more than those with upper secondary qualifications. The same study also estimates the annualised returns to education.37 It estimates that the return to an additional year of university education is 11% for males and 17.3% for females.
Using 2007 data, Lall (2008) estimates that the return to an additional year of university education is 10.6% for males and 11.7% for females.38 (Note that the former study covers the 18-65 age group whereas the latter covers those aged 22-65.) Interestingly, the annualized returns for males aged 22-30 (18.8%) is much higher than for males aged above 30 (9.1%). In contrast, the returns for younger females (9.8%) is much lower than for older females (16.5%). Lall (2008) speculates that: “This could suggest that there is a shortage of younger better educated males, or young graduates.”
While these returns to higher education are quite high, it does not necessarily follow that the high returns indicate a current or persisting shortage of graduates. It needs to be remembered the returns are based on sample population data in 2007, and therefore do not fully incorporate the rapid growth in university enrolments over the past few years. The full impact of the large increase in enrolments over the past few years is only now beginning to be felt in the labor market and it will be some years before this shows up in the kinds of returns analysis studies undertaken above. 37 Annualised returns to education take the difference between the returns to two consecutive levels of attainment (for example, university and upper secondary) and annualises the difference using the difference (in years) between the two consecutive levels. 38 Note that Sakellariou (2008) covers the 18-65 age group whereas Lall (2008) relates to the 22-65 age group.

Review of Higher Education: Cambodia Page 42 of 82
3.1.2 Some practical scenarios for returns to education in Cambodia The two studies above provide a detailed and rigorous examination of the returns to higher education in Cambodia. However, in practical terms, they do not answer a simple, but very important, question: how long will it take a typical university graduate to recoup their education costs? In other words, how many years will it take for a graduate to be in the same net financial position as somebody who entered the workforce directly after completing Grade 12? This is essentially applying breakeven analysis to the investment in a university degree.
There are three key variables to be estimated in this analysis:
− Direct education costs – including tuition fees, textbooks and transport.
− Foregone earnings – which is the salary the person could have earned if they had entered the workforce directly after completing Grade 12.
− Earnings – which is the salary the person is expected to earn having completed a bachelor’s degree at university.
It is important to note that the analysis below does not attempt to estimate the “average” or “expected” outcome for all Cambodian university graduates. The reason for not calculating an average for the entire population of graduates is that the potential outcomes for all graduates in Cambodia differ to such an extent, in terms of their geographic location, tuition fees, quality of education, employment prospects and earnings potential, that such an average would be rather meaningless.
Bachelor’s degree The analysis below considers two hypothetical university Bachelor graduates (a “typical” graduate and a “top-tier” graduate) and compares their potential outcomes to those of a person who enters the labor market directly after completing Grade 12.
The assumed circumstances and outcomes of each individual are outlined in the table below.
Table 7: Assumed circumstances and outcomes of the three scenarios
Grade 12 graduate Typical university graduate
Top-tier university graduate
Main qualification Grade 12 4-year bachelor’s degree in Accounting from a good university
4-year bachelor’s degree in Accounting from a good university
Annual direct education costs
Nil $600 $600
Ability & employability Typical for somebody completing Grade 12; neither weak nor outstanding.
Achieves solid grades; fairly typical for a university graduate in terms of ability, ambition and employability.
Achieves excellent grades; well ahead of most university graduates in terms of ability, ambition and employability.
Time taken to find work after entering workforce
9 months 3 months 3 months
Starting monthly salary $80 $120 $180
Salary progression Relatively slow Moderate Rapid

Review of Higher Education: Cambodia Page 43 of 82
It is assumed that the direct education costs for the two university graduates are approximately $600 per year (all figures are in 2009 dollars). This is based partly on the results of the 2007 socio-economic survey, which estimated annual education costs for university students at approximately $456 per year.39 This figure seems too low for a student attending one of the better universities in Phnom Penh, since annual tuition fees alone tend to range from $400 to $450.40 Taking this into account, and adjusting for inflation since 2007, we have revised the survey figure upwards to $600 per year.
Estimates of starting monthly salaries (in 2009 dollars) and salary progressions are based on the research team’s own in-depth understanding of salaries in the Cambodian labor market.41
The table below shows how long it would take a university graduate to achieve breakeven, in terms of recouping all education expenses and foregone earnings. The “gain” from completing higher education is the difference between the salary they can expect to earn having completed university minus the salary they could have expected to be earning had they entered the workforce immediately after completing Grade 12.
The table assumes that the individuals complete Grade 12 in 2005. If they choose to commence their bachelor’s degree in 2006, then the total education costs for 2006 would be $600 in direct expenses (such as tuition fees) plus $480 in foregone earnings (assuming they could have entered the labor market and found work after nine months, starting on $80 per month).
So, at the end of their four years of study, they would have total education costs of $6,960, of which $2,400 is four years of direct education expenses and the other $4,560 is what they could have earned had they been in the labor market for the past four years. Once the graduate enters the labor market in 2010, their annual “gain” or “clawback” is their annual earnings minus the earnings they would have been earning in their fifth year in the labor market (directly after Grade 12).
As the table below shows, a “typical” student, who could expect to start on a salary of $120 per month in 2010, would recoup all their education expenses (including foregone earnings) towards the end of their sixth year in the labor market, in late 2015. A “top-tier student”, who starts on a higher salary of $180 per month and in subsequent years enjoys a higher salary than their typical counterpart, would recoup all their education expenses early in their fifth year in the labor market, in the first half of 2014. Table 8: Time taken to recoup all education expenses – two possible scenarios for Bachelor’s degree
Study Employment 2006 2007 2008 2009 2010 2011 2012 2013 2014 2015Education costs Direct education 600 600 600 600 Foregone annual 480 1,200 1,320 1,560 1,599 1,639 1,680 1,722 1,765 1,809Total annual cost 1,080 1,800 1,920 2,160 1,599 1,639 1,680 1,722 1,765 1,809Typical student Annual earnings 0 0 0 0 1,080 1,800 2,400 3,000 4,200 5,400Annual gain / loss - - - - -519 161 720 1,278 2,435 3,591Cumulative gain / loss - - - - - - - - - 706Top-tier student Annual earnings 0 0 0 0 1,620 2,640 3,240 4,200 6,000 6,300Annual gain / loss - - - - 21 1,001 1,560 2,478 4,235 4,491Cumulative gain / loss - - - - - - - - 2,335 6,826 39 Ministry of Planning. 2009. National Institute of Statistics: Education 2007 Report based on Socio-Economic Survey 2007, August 2009 40 There is a wide disparity in fees charged by universities in Cambodia, which is one of the reasons why we are presenting scenarios rather than averages. 41 HRINC Cambodia is a leading recruitment consultant in Cambodia and also conducts annual private sector salary surveys.

Review of Higher Education: Cambodia Page 44 of 82
Master’s degree Using the same approach, we can extend the analysis to look at the potential outcomes of two hypothetical “top tier” students who, after completing their 4-year Bachelor’s degree in Accounting, go on to complete a Master’s degree – one in Cambodia and the other on a scholarship in Thailand or France.
For the local Master’s degree, it is assumed that the student enters the labor market immediately after completing their Bachelor’s degree and undertakes the Master’s degree in the evenings or on weekends over two years. The annual education expenses are assumed to be $1,000 for the Master’s degree..
For the abroad Master’s degree, it is assumed that the student studies abroad on a full scholarship to a university in either Thailand or France over two years. Education expenses incurred by the student are assumed to be zero.
It is assumed that both students commence their studies in 2004, so that the local Master’s graduate enters the workforce in 2008 (after completing their Bachelor’s degree) while the abroad Master’s graduate enters the workforce in 2010.
The table below shows how long it would take these Master’s graduates to achieve breakeven, in terms of recouping all education expenses and foregone earnings compared to a person entering the workforce immediately after Grade 12.
Table 9: Time taken to recoup all education expenses – two possible scenarios for Masters degree
2004 2005 2006 2007 2008 2009 2010 2011 2012 2013 2014
LOCAL MASTERS
Education costs
Direct education expenses 600 600 600 600 1,000 1,000
Foregone annual earnings 480 1,200 1,320 1,560 1,599 1,639 1,680 1,722 1,765 1,809
Total annual cost 1,080 1,800 1,920 2,160 2,599 2,639 1,680 1,722 1,765 1,809
Annual earnings 0 0 0 0 1,620 2,640 3,960 4,560 6,000 7,200
Annual gain / loss -1,080 -1,800 -1,920 -2,160 -979 1 2,280 2,838 4,235 5,391
Cumulative gain / loss -1,080 -2,880 -4,800 -6,960 -7,939 -7,938 -5,658 -2,820 1,415 6,806
ABROAD MASTERS
Education costs
Direct education expenses 600 600 600 600 0 0
Foregone annual earnings 480 1,200 1,320 1,560 1,599 1,639 1,680 1,722 1,765 1,809
Total annual cost 1,080 1,800 1,920 2,160 1,599 1,639 1,680 1,722 1,765 1,809
Annual earnings 0 0 0 0 0 0 2,700 4,560 5,400 7,200 9,000
Annual gain / loss -1,080 -1,800 -1,920 -2,160 -1,599 -1,639 1,020 2,838 3,635 5,391 7,146 Cumulative gain / loss -1,080 -2,880 -4,800 -6,960 -8,559 -10,198 -9,178 -6,340 -2,705 2,686 9,832

Review of Higher Education: Cambodia Page 45 of 82
The local Master’s graduate is assumed to enter the workforce in 2008 at the same starting salary as the top-tier Bachelor’s graduate in the earlier analysis. It is only in their third year in the workforce – upon completing their Master’s degree – that their salary rise faster than the top-tier Bachelor’s graduate.
The abroad Master’s graduate enters the workforce only upon completing their Master’s degree, after which time their salary progression is faster than the local Master’s graduate – recognizing the higher value attached to an overseas Master’s degree.
As the shaded cells in the above table highlight, local Master’s graduate are expected to recoup all their expenses during their fifth year in the labor market, while oversea Master’s graduate are anticipated to recoup all their expenses during their fourth year in the labor market.
In summary, these scenarios outlined above may come as a surprise to those who assume that the payoff from higher education is much faster and that they will “be in front” within a year or two of graduating. Such an optimistic assumption presumably fails to take account of the significant impact of foregone earnings – which represent the biggest cost to somebody pursuing a university degree. Naturally, if foregone earnings are excluded from the calculations, then the length of time for graduates to recoup their direct education expenses is much shorter.
As stressed earlier, these projections are not intended to represent an average for all university students in Cambodia. They merely present some possible scenarios to give an idea of how long it would take a “successful” student – that is, one who is able to find graduate-level work once they complete their degree – to recoup all the costs of their education. In contrast, for the significant numbers of students who attend a university with a poor reputation, and who major in a discipline that is not in high demand by employers, their poor employment prospects might mean that they never fully recover the costs of their higher education – or at least only in the very long term. Therefore, the scenarios outlined above are likely to over-estimate the expected pay-off for any given person considering a university education.
3.2 Labor market demand – by economic sector and field of study
3.2.1 Importance of matching demand and supply for higher-level skills The fundamental aim of a higher education system is to produce graduates who have the skills that are demanded by employers in the labor market. In other words, a higher education system aims to match the supply and demand of higher-level skills in the labor market.
A system that fails to match supply and demand for higher-level skills can have high economic and social costs. In terms of economic costs, a mismatch can lead to high structural unemployment, where there exists a pool of university graduates seeking employment but who do not possess the skills needed to find employment (that is, the skills demanded by employers). It also constrains productivity and economic growth, as employers are forced either to fill positions with poorly qualified (and less productive) workers or else to scale back their growth ambitions because they simply cannot grow their labor force as quickly as they would like. In addition, it can hinder a developing country’s attempt to diversify away from a narrow economic base (focused on low-skilled labor) into industries that require a labor force with higher-level skills.
On the social front, supply-demand mismatches result in high rates of graduate unemployment, which foster disillusionment and a sense of having failed to live up to the hopes and expectations of one’s family. In the long term, this can have damaging consequences for the individual, their family and the society as a whole.
Understandably, it is very difficult for a higher education system to respond to the demands of the labor market if there is little or no information available on what types of higher-level skills are demanded by employers – and what types of skills are likely to be demanded in the future.
In Cambodia, the higher education system essentially operates in an information vacuum when it comes to demand for higher-level skills. There are no labor market information systems that survey or estimate labor market demand – either for all jobs or for jobs requiring higher-level skills. There are no estimates

Review of Higher Education: Cambodia Page 46 of 82
of current or future demand for university graduates – neither overall demand, nor demand by sector or field of study. In addition, there is no reliable tracking of the employment outcomes of recent university graduates.
Consequently, there has been no attempt (until now) to quantify the extent of any mismatch in the supply and demand of higher-level skills in Cambodia. There is nothing other than personal anecdotes and general impressions, where employers, educators, government officials and recruitment consultants talk in general terms about the problem of graduate unemployment and skilled labor shortages in particular industries or professions.
This lack of information makes it difficult for government officials and educators to make Cambodia’s higher education system more responsive to the current and future needs of the labor market. It also makes it difficult for students and employers to make informed decisions regarding their futures.
In this section, we attempt to estimate current and future demand for university graduates, in terms of overall numbers of graduates, as well as numbers by economic sector and field of study. The hope is that this information will enable:
− Policy makers and educators to make better informed decisions about the number and type of graduates that can be absorbed by the labor market
− Students and their families to base their educational choices on realistic employment prospects
− Employers to identify and plan for emerging and future skills shortages
− Vocational training providers, NGOs and donor agencies to possibly focus their energies on skills where labor market demand is not being met by the higher education system.
Box 2: Challenges in Finding a Good Job Case Study
From a University Students and Back to Work at Home
Reasey and a few of his close friends came to Phnom Penh to pursue a Bachelor’s Degree in Business Management at a university in Cambodia. When selecting the study major, he did not know much about it and he even did not think much about it. His career objective is to be a manager in a hotel in Cambodia.
Having spent four years at the university, Reasey graduated in late 2009. He also did a short-time internship at HRINC Cambodia, a leading HR consulting firm, to meet the credit requirement of the university. At HRINC, Reasey worked with the company research team on a couple of projects. He demonstrated a good communication and team work during his internship. After finishing his internship and graduation, Reasey tried to find work for some time, but he was not able to get a job.
Reasey later decided to return home to help his family business. His family is running a small-medium size restaurant in Kampong Chhnang province. He is very interested in this business as to some extent he can apply his management skills from university to manage the restaurant. He said, “I feel very good with this family business as I somehow can use my knowledge from university.” Reasey’s perspective initially was very ambitious as he wanted to expand another branch in the provincial town. However, his ambition has faded since the economic crisis has led to less passengers stopping by his restaurant. Another reason that Reasey needs to help the family business is because of the lack of people to assist the business. He has two older sisters working as chef and his widowed mother is old.
By supported the family business, he can relieve some of the burdens from his family and also strive to improve the business. Nowadays, when asked if he would work for a company or an organization, he said he would not accept the work if the starting monthly salary was only US$ 150-200. This is because in his opinion, his contributions to the family restaurant business are worth more than that since he can better manage the expenses and income, better control and lead staff, better design and improve hygiene of the restaurant and of course bring more income. Reasey continued, “I can earn more in my family business comparing to the job that earned USD 150-200. The same time I also balance the experience gaining through work in an organization; however still I need and choose to assist my family business.” He says that in the next few years, he would only consider a job that pays very well: “If one day a company manager comes into

Review of Higher Education: Cambodia Page 47 of 82
my restaurant and s/he sees my personality and ability in management, and offers me a job earning from USD 400-500, I will go.”
It is not uncommon in Cambodia that fresh graduates return back home to help their family work/business because they either need to support their family or cannot find a job.
3.2.2 Possible approaches to estimating labor market demand There are two types of approaches to estimating labor market demand:
1) Workforce projections:
Workforce projections are used to provide longer-term estimates of labor market demand. They typically require estimates of the following key variables:
− Rates of economic growth in each economic sector
− Rates of employment growth that are consistent with these rates of sectoral economic growth
− Distribution of occupations (or fields of study) within each sector.
While this approach has the advantage of being practical and straightforward, it is heavily dependant on the quality and robustness of the estimates that feed into the model. As pointed out by the Canadian Council on Learning:
“There are many issues that can jeopardize the reliability of this method. To begin, the estimates are only as good as the ‘plausible assumptions’ on which they are based. Unfortunately, there are many unforeseeable factors that may affect the economic growth of a country and the labor needs this growth produces… The labor market, as noted above, will find many ways to adjust to a skills shortage, which may eliminate the need for certain jobs. Because of these variables, the quality of the forecasts decreases with the length of the forecasting period.” 42
2) Labor market analysis (signaling):
Labor market analysis tends to focus on “signals” that provide information about existing shortages or surpluses in the labor market. Possible sources of information that feed into this analysis include:
− Job advertisements (print and online)
− Growth rates of salaries in particular sectors or for particular occupations
− Interviews with, or surveys of, key employers who are in a good position to know about growth prospects and skill requirements in their particular sector
− Tracer studies, where universities track the employment outcomes of their graduates in terms of the length of time it took them to find work, the sector in which they found work, whether they needed to relocate and their starting salary
− Unemployment rates in particular sectors and for particular occupations.
This type of labor market analysis can provide valuable information on shortages or surpluses in today’s labor market. It can also complement the analysis undertaken in longer-term workforce projections. Moreover, it has the advantage of relying on less assumptions and uncertainties than workforce projections analysis. However, given its short-term focus, it is not a substitute for the longer-term analysis. It does not provide a complete picture to policy makers, educators and prospective university students in terms of seeking to match supply with demand in three, four or five years time.
42 Is it Possible to Accurately Forecast Labor Market Needs? (January 2007), Prepared by Canadian Council on Learning for British Columbia Ministry of Advanced Education, Canada, pp.9.

Review of Higher Education: Cambodia Page 48 of 82
3.2.3 Estimating labor market demand in Cambodia: the challenges Even in developed economies with mature education sectors, relatively stable labor markets and detailed information on employment structures and unemployment rates within economic sectors, it is difficult to forecast labor market demand with any degree of certainty.
In Cambodia, the challenges are far greater.
In terms of longer-term workforce projections, there is no detailed, comprehensive data on existing employment structures within each sector, in terms of the percentage of the sector’s workforce that is university educated and their field of study. In addition, Cambodia’s economy is undergoing rapid and dramatic structural change, making it difficult to predict economic and employment growth rates for particular sectors and for the economy as a whole. Moreover, employment structures within each sector are not stable but rather are still evolving. In other words, the percentage of a sector’s workforce that is university educated, and their field of study, is likely to be very different in 2009 than it was in 2004 – and it may be very different again in 2014.
In terms of short-term labor market analysis (signaling), there is no systematic analysis of job vacancies or job advertisements in Cambodia. Existing salary surveys conducted by HRINC Cambodia, while providing some insights into labor surpluses and shortages in a limited number of sectors, analyse salaries in terms of the job performed – rather than the individual’s education qualifications. There is no up-to-date data on unemployment rates for Cambodia as a whole, let alone for particular sectors or for people with university degrees. Finally, no university conducts reliable tracer studies of the employment outcomes of their past students.
In summary, there is little doubt of the importance of estimating labor market demand for higher education graduates in Cambodia. Equally, however, there is little doubt of the difficulties involved in attempting this exercise. In this study, we have made what we believe to be the first attempt in Cambodia at estimating labor market demand for graduates, by sector and by field of study. As such, it should be seen as the first step – not the final step – in building a comprehensive labor market information system for Cambodia.
Given the data limitations outlined above, the results should be interpreted with considerable caution. Nevertheless, some broad conclusions can be drawn from the results in terms of matching labor market demand with supply. These conclusions have important implications for all stakeholders, including policy makers, educators and employers.
It is worth noting that the Cambodian Government has plans to develop a Labor Market Information System. However, at this early stage, it is still not clear what this system will look like, in terms of what sort of information is collected, how it is analysed and how the findings will be used.
3.2.4 Estimating labor market demand in Cambodia: approach & methodology To estimate demand for graduates in Cambodia, the main tool used in this study is a workforce projection model constructed by the research team (hereby referred to as “the Model”). Later in this chapter, we also draw on other available sources of information that may provide additional insights or complement the results of the model. These information sources include HRINC Cambodia’s salary surveys, discussions with HRINC Cambodia’s recruitment consultants, a recent survey of the labor market for jobs in Information Technology, and interviews with employers, universities and donor agencies.
The Model provides forecasts, for each year from 2009 to 2014, and for each sector of the economy, of the number of new graduate positions – by degree type – that will be demanded by employers.
Categories for economic sectors and degree types (fields of study) are outlined in the table below.

Review of Higher Education: Cambodia Page 49 of 82
Table 10: Categories for economic sectors and degree types used in the Model
Economic sector (alphabetical order)43 Degree type (field of study - alpha order) Agriculture Accounting Communications Agriculture and Rural Development Construction Banking, Finance and Economics Education Business, Management, Human Resources & Administration
Finance (Banks, Microfinance and Insurance) Engineering
Garment Foreign Languages Health Health Science (Medicine, Nursing, etc.) Other Information Technology (IT) Other Manufacturing (includes Mining and Utilities)
Law
Other Social Services Marketing Public Administration and Defense Other Science (Chemistry, Mathematics, etc.) Real Estate and Business Services Sociology, Humanity and Arts Tourism Tourism Trade Transport
The generation of forecasts for annual graduate demand requires estimates for a number of key variables. The table below presents these key variables and the assumptions that underpin the estimates.
43 Definitions of these sectors are contained in an appendix.

Review of Higher Education: Cambodia Page 50 of 82
Table 11: Key variables and assumptions used in the Model – for each sector
Key variable Estimation method & assumptions
Total sector employment Total employment in each sector is based primarily on the latest official statistics from the 2008 population census. It is important to note that these estimates are significantly lower than earlier official estimates, largely as a result of the census revealing Cambodia’s population was lower than previous estimates.
As a result, total employment for 2008 is estimated at around 6.9 million people, whereas previous estimates had total employment in 2007 at more than 8 million.
Sector employment with higher education (that is, the proportion of the sector’s workforce that has completed higher education)
There is no single, comprehensive data source that provides the percentage of total employees in each sector who have completed higher education. As a result, a variety of estimation methods is used, depending on the information that is available for each sector. The main sources of information are:
− 2007 socio-economic survey
− Detailed employment data from HRINC Cambodia’s salary surveys
− Discussions with employers and university administrators
− Discussions with relevant staff at the World Bank
− Labor force surveys from other countries in the region.
Distribution by degree type of sector employment with higher education degree
The proportion of each sector’s workforce that has completed higher education is distributed among the various degree types (fields of study). Again, there is no available data that provides estimates of these distributions for each sector. A variety of methods is used to produce the estimates used in the model.
In some sectors, distributions are estimated based on data from HRINC Cambodia’s sector salary surveys. In other sectors (such as Agriculture) the distribution is dominated by a single field of study. Estimates of distributions in some sectors are based on interviews with leading employers in those sectors.
Annual growth (%) of total sector employment
For each year, from 2009 to 2014, the Model contains estimates of employment growth (or contraction) for all jobs in a sector. These estimates are based on:
− The sector’s historical employment growth rates
− The sector’s size and stage of maturity (recognizing that employment growth in a small sector may be very high before gradually easing as the sector matures)
− The sector’s prospects, based on discussions with relevant staff at the World Bank
− Overall outlook for the Cambodian economy (assuming overall employment in Cambodia will be flat or slightly negative in 2009, grow moderately in 2010 and then move closer to trend growth in 2011 onwards).
Annual growth (%) of sector employment with higher education
The Model assumes that in most sectors, demand for higher-level positions (that is, those requiring a university degree) will grow faster than demand for all job positions. This reflects the ongoing development / sophistication of the Cambodian economy, as well as the likelihood that, over time, the proportion of expatriates working in sectors will decline as more Cambodian graduates can perform those roles.

Review of Higher Education: Cambodia Page 51 of 82
3.2.5 Estimating labor market demand in Cambodia: results
3.3.3.1 Employment of persons with higher education To make it easier to interpret the Model’s projections for annual demand for higher education graduates, this section begins by presenting the Model’s estimates of the number of existing higher education graduates already in the economy. The figure below shows the estimated number of existing higher education graduates in each sector of the economy, by field of study (degree). These estimates are based on the assumptions outlined above.
It is clear from the figure that in many sectors, most existing graduates have business-related backgrounds, with degrees in Accounting, Banking, Finance, Economics, Business, Management or Marketing. Sectors where other degrees are represented in significant numbers include Agriculture, Construction, Tourism, Public Administration & Defense, Education and Health.
Figure 6: Total employment with higher education in each sector – by field of study
0
5,000
10,000
15,000
20,000
25,000
30,000
35,000
40,000
45,000
50,000
Agricu
lture
Garmen
ts
Other M
anufa
cturin
g
Constr
uctio
n
Touri
sm
Finan
ce
Trans
port
Commun
icatio
ns
Real E
state
& Bus
iness
Public
Admin
& Defe
nse
Educa
tion
Health
Trade
Other S
ocial
Service
sOthe
r
Agriculture & Rural Development
Other Science
Health Science
IT
Engineering
Foreign Languages
Sociology, Humanity & Arts
Tourism
Law
Business-related
Note: "Business-related" includes: Accounting; Banking, Finance & Economics; Business & Management; Marketing.
The figure below shows the estimated number of higher education graduates employed across all sectors by their field of study. It is estimated that around 153,000 workers have higher education degrees. Around 82,000 of them (or 55%) are estimated to have business-related degrees.

Review of Higher Education: Cambodia Page 52 of 82
Figure 7: Total employment with higher education in all sectors – by field of study
Below, we present our projections for annual demand for higher education graduates. We present this information:
− Aggregated across all sectors and all fields of study (all graduates)
− Aggregated across all sectors for each field of study
− Aggregated across all fields of study for each sector.
3.3.3.2 Annual demand for all graduates The figure below shows the projected demand for all graduates (across all sectors and all fields of study) for each year from 2009 to 2014.
Total demand for graduates is projected to be relatively low in 2009, with just over 5,000 new positions. This reflects the pronounced slowdown in the Cambodian economy through 2008 and 2009, particularly in the Garment, Construction and Tourism sectors. Demand for graduates is projected to pick up in 2010 as the Cambodian economy begins to recover, with a total of around 10,000 new positions. As the economy returns to something approaching trend growth in 2011, demand for graduates is projected to increase to around 14,000 new positions. In subsequent years, demand is projected to increase by around 15% per annum, reaching more than 21,000 new positions in 2014.
IT5,0363%
Other Science1,8731%
Sociology, Humanity & Arts3,7122%
Tourism3,4372%
Law3,3972%
Foreign Languages6,4444%
Engineering15,22710%
Health Science17,27512%
Agriculture & Rural Development
14,2499% Business-related
82,46355%

Review of Higher Education: Cambodia Page 53 of 82
Figure 8: Projected annual demand for all graduates
5,225
9,907
14,420
16,045
18,502
21,507
-
5,000
10,000
15,000
20,000
25,000
2009 2010 2011 2012 2013 2014
3.3.3.3 Annual demand for graduates (all sectors), by field of study The two figures below show the projected annual demand for graduates, across all sectors, by the field of study. The first figure shows the actual number of new positions in each field of study, while the second figure shows the new positions in each field of study as a percentage of all new positions.
There are several key points to note from these figures:
− Demand for positions with business-related degrees (Accounting; Banking, Finance & Economics; Business Management; Marketing) is projected to account for between 39-56% of all new positions each year.
− Demand for positions with science-related degrees (Engineering; IT; Health Science; Other Science) is projected to account for between 29-40% of all new positions each year.
− Demand for positions with other degrees (Law; Tourism; Sociology, Humanity & Arts; Foreign Languages; Agriculture) is projected to account for between 15-21% of all new positions each year.

Review of Higher Education: Cambodia Page 54 of 82
Figure 9: Projected annual demand for all graduates – number of new positions by field of study
0
2,500
5,000
7,500
10,000
12,500
15,000
17,500
20,000
22,500
2009 2010 2011 2012 2013 2014
Agriculture & Rural DevelopmentOther ScienceHealth Science
ITEngineering
Foreign LanguagesSociology, Humanity & Arts
TourismLaw
MarketingBusiness & Management
Banking, Finance & EconomicsAccounting
Figure 10: Projected annual demand for all graduates – % of new positions by field of study
0%
10%
20%
30%
40%
50%
60%
70%
80%
90%
100%
2009 2010 2011 2012 2013 2014
Agriculture & Rural Development
Other Science
Health ScienceIT
Engineering
Foreign Languages
Sociology, Humanity & ArtsTourism
Law
MarketingBusiness & Management
Banking, Finance & Economics
Accounting

Review of Higher Education: Cambodia Page 55 of 82
3.3.3.4 Annual demand for graduates (all fields of study), by sector The two figures below show the projected annual demand for graduates, across all fields of study, by sector. The first figure shows the actual number of new positions in each sector, while the second figure shows the new positions in each sector as a percentage of all new positions.
There are several key points to note from these figures:
− In 2009, graduate employment in Garments, Other Manufacturing and Construction is projected to decline as a result of the particularly difficult economic conditions facing those sectors. Employment in Tourism, Transport and Real Estate & Business Services is projected to be flat. Most of the new graduate jobs are projected to be in Health Services, Education, Public Administration & Defense, and Finance.
− In 2010, employment in Garments and Construction is projected to be flat. The main drivers of graduate employment are projected to be Finance, Health Services, Education, and Public Administration & Defense.
− From 2011 onwards, the following sectors are projected to create significant numbers of new graduate positions: Finance, Trade, Health Services, Education, Public Administration & Defense, Construction, Tourism, and Real Estate & Business Services.
Figure 11: Projected annual demand for graduates (all fields of study) – # new positions by sector
-2,500
0
2,500
5,000
7,500
10,000
12,500
15,000
17,500
20,000
22,500
2009 2010 2011 2012 2013 2014
Other
Other social servicesTrade
Health services
Education
Public admin & defenseReal estate & business services
Communication
TransportFinance
Tourism
Construction
Other manufacturingGarments
Agriculture

Review of Higher Education: Cambodia Page 56 of 82
Figure 12: Projected annual demand for graduates (all fields of study) – % of new positions by sector
-10%
0%
10%
20%
30%
40%
50%
60%
70%
80%
90%
100%
2009 2010 2011 2012 2013 2014
Other
Other social servicesTrade
Health services
Education
Public admin & defenseReal estate & business services
Communication
TransportFinance
Tourism
Construction
Other manufacturingGarments
Agriculture
3.3.3.5 Annual demand for graduates, by field of study & sector The three tables below present full details of the Model’s demand projections. The tables show the annual projected number of new jobs created in each sector by the field of study. It needs to be stressed that these projections are based on many assumptions and estimates, often in the absence of reliable data. Accordingly, the projections should be used to highlight broad themes and trends, which may point to areas requiring further analysis and investigation.

Review of Higher Education: Cambodia Page 57 of 82
Table 12: Projected annual demand for graduates, by field of study & sector, 2009 & 2010
Agric Garm Other Man Constr Tourism Finance Transport CommsReal Est &
BusPA &
Defense Education Health TradeOther Soc Services Other TOTAL
Accounting 3 -109 0 -14 0 49 0 65 0 170 114 50 57 62 13 460Banking, Finance & Economics 0 0 0 0 0 625 0 0 0 114 57 0 38 0 7 840Business & Management 2 -144 0 -18 0 25 0 44 0 432 57 50 111 31 16 606Marketing 0 -164 -1 -9 0 48 0 110 0 0 57 0 94 0 16 153Law 0 0 0 0 0 3 0 0 0 45 57 0 2 9 0 116Tourism 0 0 0 0 0 0 0 0 0 0 57 0 0 0 0 57Sociology, Humanity & Arts 0 0 0 0 0 0 0 0 0 0 171 0 0 37 0 208Foreign Languages 0 0 0 0 0 0 0 0 0 0 284 0 4 12 7 307Engineering 5 -58 -1 -133 0 0 0 170 0 170 57 0 19 31 3 264IT 0 -12 0 -2 0 23 0 46 0 34 57 0 15 6 3 170Agriculture & Rural Development 78 0 0 0 0 0 0 0 0 170 57 0 38 62 0 406Health Science 0 -44 0 0 0 0 0 0 0 0 57 1,500 0 59 0 1,572Other Science 12 0 -1 -2 0 0 0 0 0 0 57 0 0 0 0 67Total Higher Education 100 -531 -3 -177 0 773 0 434 0 1,136 1,137 1,600 377 312 66 5,225
Accounting 8 0 1 0 129 157 35 77 55 210 149 55 115 28 14 1,032Banking, Finance & Economics 0 0 0 0 0 1,989 0 0 18 140 75 0 77 0 7 2,305Business & Management 5 0 0 0 27 81 38 52 69 531 75 55 227 14 17 1,192Marketing 0 0 1 0 75 159 17 131 73 0 75 0 192 0 17 740Law 0 0 0 0 0 9 1 0 18 56 75 0 4 4 0 167Tourism 0 0 0 0 285 0 0 0 0 0 75 0 0 0 0 360Sociology, Humanity & Arts 0 0 0 0 0 0 0 0 0 0 224 0 0 17 0 241Foreign Languages 0 0 0 0 15 0 0 0 18 0 373 0 8 6 7 426Engineering 13 0 1 0 22 0 17 202 55 210 75 0 38 14 3 650IT 0 0 0 0 0 73 6 55 55 42 75 0 31 3 3 342Agriculture & Rural Development 199 0 0 0 0 0 0 0 0 210 75 0 77 28 0 589Health Science 0 0 0 0 0 0 0 0 0 0 75 1,650 0 27 0 1,751Other Science 31 0 1 0 0 0 1 0 4 0 75 0 0 0 0 111Total Higher Education 256 0 4 0 554 2,468 117 516 364 1,397 1,493 1,760 769 140 68 9,907
2009
2010

Review of Higher Education: Cambodia Page 58 of 82
Table 13: Projected annual demand for graduates, by field of study & sector, 2011 & 2012
Agric Garm Other Man Constr Tourism Finance Transport CommsReal Est &
BusPA &
Defense Education Health TradeOther Soc Services Other TOTAL
Accounting 13 61 2 81 145 190 90 87 96 216 159 73 300 29 14 1,555Banking, Finance & Economics 0 0 0 0 0 2,358 0 0 32 144 79 0 200 0 7 2,821Business & Management 9 80 1 101 30 104 99 59 122 547 79 73 590 15 18 1,927Marketing 0 92 2 50 84 206 45 147 128 0 79 0 500 0 18 1,353Law 0 0 0 0 0 12 3 0 32 58 79 0 10 4 0 199Tourism 0 0 0 0 321 0 0 0 0 0 79 0 0 0 0 400Sociology, Humanity & Arts 0 0 0 0 0 ` 0 0 0 0 238 0 0 18 0 256Foreign Languages 0 0 0 0 17 0 0 0 32 0 397 0 20 6 7 478Engineering 21 33 3 756 25 0 45 228 96 216 79 0 100 15 4 1,620IT 0 7 1 10 0 91 15 62 96 43 79 0 80 3 4 490Agriculture & Rural Development 335 0 0 0 0 0 0 0 0 216 79 0 200 29 0 860Health Science 0 25 0 0 0 0 0 0 0 0 79 2,178 0 28 0 2,310Other Science 52 0 2 10 0 0 3 0 6 0 79 0 0 0 0 153Total Higher Education 430 297 11 1,008 622 2,962 300 582 641 1,439 1,586 2,323 2,001 147 71 14,420
Accounting 14 63 3 70 163 212 97 97 111 222 169 81 396 31 15 1,743Banking, Finance & Economics 0 0 0 0 0 2,674 0 0 37 148 84 0 264 0 7 3,215Business & Management 9 84 2 87 34 111 106 65 141 563 84 81 779 15 18 2,182Marketing 0 95 3 44 95 220 48 164 149 0 84 0 660 0 18 1,582Law 0 0 0 0 0 12 3 0 37 59 84 0 13 5 0 214Tourism 0 0 0 0 361 0 0 0 0 0 84 0 0 0 0 445Sociology, Humanity & Arts 0 0 0 0 0 0 0 0 0 0 253 0 0 19 0 271Foreign Languages 0 0 0 0 19 0 0 0 37 0 421 0 26 6 7 517Engineering 23 34 4 655 28 0 48 254 111 222 84 0 132 15 4 1,615IT 0 7 2 9 0 100 16 69 111 44 84 0 106 3 4 555Agriculture & Rural Development 362 0 0 0 0 0 0 0 0 222 84 0 264 31 0 963Health Science 0 26 0 0 0 0 0 0 0 0 84 2,439 0 29 0 2,579Other Science 56 0 4 9 0 0 3 0 7 0 84 0 0 0 0 163Total Higher Education 464 309 17 874 699 3,329 323 648 743 1,482 1,685 2,602 2,641 155 74 16,045
2011
2012

Review of Higher Education: Cambodia Page 59 of 82
Table 14: Projected annual demand for graduates, by field of study & sector, 2013 & 2014
Agric Garm Other Man Constr Tourism Finance Transport CommsReal Est &
BusPA &
Defense Education Health TradeOther Soc Services Other TOTAL
Accounting 15 66 3 84 220 242 104 106 129 229 179 91 518 33 15 2,034Banking, Finance & Economics 0 0 0 0 0 3,077 0 0 43 153 90 0 345 0 8 3,716Business & Management 10 87 2 105 46 125 114 72 164 580 90 91 1,018 16 19 2,539Marketing 0 99 4 52 128 251 52 181 172 0 90 0 863 0 19 1,911Law 0 0 0 0 0 14 3 0 43 61 90 0 17 5 0 233Tourism 0 0 0 0 486 0 0 0 0 0 90 0 0 0 0 576Sociology, Humanity & Arts 0 0 0 0 0 0 0 0 0 0 269 0 0 20 0 288Foreign Languages 0 0 0 0 25 0 0 0 43 0 448 0 35 7 8 565Engineering 25 35 4 786 38 0 52 279 129 229 90 0 173 16 4 1,860IT 0 8 2 10 0 115 17 76 129 46 90 0 138 3 4 637Agriculture & Rural Development 391 0 0 0 0 0 0 0 0 229 90 0 345 33 0 1,087Health Science 0 27 0 0 0 0 0 0 0 0 90 2,732 0 31 0 2,879Other Science 60 0 4 10 0 0 3 0 9 0 90 0 0 0 0 176Total Higher Education 501 321 19 1,048 943 3,825 347 714 862 1,527 1,790 2,914 3,451 163 77 18,502
Accounting 16 68 3 101 316 280 93 116 150 236 190 102 674 34 16 2,396Banking, Finance & Economics 0 0 0 0 0 3,560 0 0 50 157 95 0 450 0 8 4,320Business & Management 11 90 2 126 66 145 102 78 190 598 95 102 1,326 17 20 2,968Marketing 0 103 4 63 183 292 47 197 200 0 95 0 1,124 0 20 2,328Law 0 0 0 0 0 16 3 0 50 63 95 0 22 5 0 255Tourism 0 0 0 0 699 0 0 0 0 0 95 0 0 0 0 794Sociology, Humanity & Arts 0 0 0 0 0 0 0 0 0 0 285 0 0 20 0 306Foreign Languages 0 0 0 0 36 0 0 0 50 0 476 0 45 7 8 622Engineering 27 37 5 943 54 0 47 304 150 236 95 0 225 17 4 2,144IT 0 8 2 13 0 133 16 82 150 47 95 0 180 3 4 733Agriculture & Rural Development 422 0 0 0 0 0 0 0 0 236 95 0 450 34 0 1,237Health Science 0 28 0 0 0 0 0 0 0 0 95 3,060 0 32 0 3,215Other Science 65 0 5 13 0 0 3 0 10 0 95 0 0 0 0 191Total Higher Education 541 334 22 1,258 1,354 4,426 311 776 1,000 1,573 1,902 3,264 4,496 171 80 21,507
2013
2014

Review of Higher Education: Cambodia Page 60 of 82
3.3 Mismatch between demand and supply
3.3.1 Mismatches based on labor market projections By comparing the demand projections in section 3.2 with the number of students projected to graduate from universities, we can identify potential demand-supply mismatches – both in aggregate and by field of study.
Chapter 2 contains detailed projections of the number of bachelor degrees expected to be completed in each year, from 2009 to 2015. The projections are based on a number of variables, including the percentage of high school students who complete Grade 12 and the percentage of these Grade 12 graduates who enroll in higher education.
Here in Chapter 3, we present a summary of these supply projections. (See Chapter 2 for details.)
The figure below shows the projected labor market demand and supply of university graduates for each year from 2009 to 2014. It is clear from these projections that the supply of university graduates is likely to exceed the number of available jobs for these graduates. In other words, the Cambodian economy is unlikely to be able to absorb all of the students who will complete their university degrees over the next six years.
The projections highlight that there is likely to be a significant oversupply of graduates in 2009 and 2010, with relatively low demand by employers. As employment picks up in 2011 and 2012, this oversupply is expected to narrow slightly. However, supply is expected to far outstrip demand in 2013 and 2014 due to rapid growth in the number of graduates entering the labor market.
Figure 13: Projected total demand for, and supply of, higher education graduates – per year
0
10,000
20,000
30,000
40,000
50,000
60,000
70,000
2009 2010 2011 2012 2013 2014
Demand Supply
Over the six years from 2009 to 2014, the higher education system is projected to supply around 220,000 bachelor degrees.44 In contrast, the labor market is projected to absorb around 86,000 graduates.
Note that the supply projections refer to the number of degrees, rather than the number of graduating students. Since some students complete more than one degree, the actual number of graduates would
44 Supply of 220,000 excludes “unspecified disciplines”, which in Chapter 2 amounted to 7,145 degrees over the six-year period.

Review of Higher Education: Cambodia Page 61 of 82
be less than 220,000. However, even if one quarter of students complete double degrees, this would still produce around 190,000 graduates – which is more than double the projected demand.
While there may be grounds for debating some of the assumptions and estimates underlying these projections, the Model predicts there will be a significant mismatch between the demand and supply of university graduates. As a result, many thousands of university graduates may be unable to find work commensurate with their level of education.
On the other hand, it needs to be kept in mind that there is huge variability in the quality and employability of graduates being supplied by Cambodia’s 72 universities. Unfortunately, it is possible that graduates from some of the small, poorly-funded universities that offer courses with weak curricula and poor teaching methods may not be at a standard suitable for employment in a graduate-level role. This means that even if the supply of graduates was slightly higher than demand, employers could still find it difficult to fill positions with “employable” graduates. This issue is discussed further in section 3.3.3 in the context of the labor demand and supply in the IT sector.
Just as important as the overall demand-supply imbalance are the potential imbalances by field of study. The table below shows the projected demand and supply of graduates for the six years from 2009 to 2014, by field of study. The fields of study are ranked from largest surplus of supply (in absolute numbers) to biggest shortage.
In interpreting these imbalances, it should be kept in mind that some degrees provide a relatively flexible set of skills that can be applied in a variety of occupations – at least for students who show the necessary levels of dynamism and adaptability. For example, a capable graduate in Law, Marketing or even Foreign Languages may be able to find employment in a position that would ordinarily be filled by a Finance graduate. As a result, in reality there may be more “blending” of the imbalances than the table below suggests. Nevertheless, the overall story is unlikely to be different. Table 15: Projected demand for, and supply of, higher education graduates – for 2009-2014 (6 years)
Field of study Demand Supply Excess Supply
Supply as % of Demand
Business & Management 11,414 46,974 35,560 412%Foreign Languages 2,916 32,958 30,042 1130%IT 2,928 17,956 15,028 613%Accounting 9,220 23,562 14,342 256%Banking, Finance & Economics 17,215 30,683 13,468 178%Sociology, Humanity & Arts 1,570 13,789 12,219 878%Law 1,184 11,820 10,636 998%Tourism 2,632 6,591 3,959 250%Other Science 860 4,773 3,913 555%Agriculture & Rural Development 5,141 8,638 3,497 168%Engineering 8,153 7,197 -956 88%Health Science 14,307 12,424 -1,883 87%Marketing 8,066 2,501 -5,565 31%Total 85,606 219,866 134,260 257%Note: Total Supply here excludes “Unspecified Disciplines” of 7,425 degrees over the six-year period.

Review of Higher Education: Cambodia Page 62 of 82
Business-related degrees:
In reality, Business & Management graduates will compete with graduates in Banking, Finance & Economics, as well as Accounting. Taking all these groups together, there is projected to be approximately 100,000 degree holders competing for less than 40,000 new jobs.
Foreign Languages:
The table projects a huge surplus of graduates in Foreign Languages. However, this may overstate the problem, given that many Foreign Languages students also complete second degrees and would look for employment in that second specialty. Moreover, even Foreign Languages graduates without a second degree may be able to find employment in a wide variety of other occupations, particularly if their spoken and written English is of a high quality. Therefore, while there appears to be too many students studying Foreign Languages, the projections may overstate this oversupply.
Information Technology (IT):
Information, communications and technology are highly visible and fast-growing sectors of the global and Cambodian economies. There is little doubt that over the coming years, Cambodian employers will demand more web designers, computer programmers, IT technicians and network administrators. However, the sheer numbers of students projected to graduate with IT degrees vastly exceeds the likely demand for these graduates. This finding is supported by a recent study on the IT jobs market by the Centre for Information System Training (CIST), which concludes that: “It is obvious that the number of [IT] graduates [between 2009 and 2012] will be much higher than the number of jobs available.” See section 3.3.3 for further details of this study.45
Sociology, Humanity & Arts:
As in other countries, some students choose to study Humanities and the Arts for reasons other than employment. They may simply have a strong passion for a particular field or activity. Consequently, it is not surprising that the projected supply of these graduates greatly exceeds the likely demand. Nevertheless, there is something wrong when a developing country like Cambodia is projected to supply similar numbers of Sociology, Humanity & Arts graduates and health professionals, and many more than either engineers or agriculture specialists.
Law:
There are very large numbers of students enrolled in Law degrees, possibly due to the high prestige and financial rewards associated with being a successful lawyer. A small percentage
of these students will be able to find jobs as lawyers in law firms, other large corporations, some NGOs and the public sector. Other Law graduates may find jobs where some legal training is beneficial, such as in regulatory affairs. However, the total demand for Law graduates is projected to be small relative to the number of people studying Law.
Tourism:
Even in a fast-growing sector like Tourism, there appears to be significantly more students than available positions.
Other Science:
At present, the demand for science graduates is relatively low. There is an expectation that in the coming years, Cambodia will need more workers with expertise in fields such as mathematics, physics and chemistry. This is likely to be the case, however the actual numbers involved are projected to be small relative to the supply of science graduates.
45 2009 Cambodia Professional IT Market Study, Centre for Information System Training (CIST), 2009.

Review of Higher Education: Cambodia Page 63 of 82
Agriculture:
The supply of Agriculture students is expected to outstrip demand, although the magnitude of the oversupply is not particularly high in percentage terms (relative to the degrees mentioned above).
Engineering, Health Sciences, and Marketing:
Demand for Engineering, Health Sciences and Marketing students is projected to be relatively strong over the next six years. The Model predicts there may be labor market shortages in these areas – although in the case of Marketing, some of these positions may be filled from the oversupply of Business and Foreign Languages graduates. In the case of Engineering, most of the jobs will be found in the Construction and Telecommunications sectors.
The projections presented above are consistent with the anecdotal evidence and views expressed by many employers and recruitment agents: Cambodia seems to be producing too many business graduates and too few engineering and other technical graduates. This does not mean that there will be more engineering jobs than business-related jobs created over the next few years; indeed, business-related jobs will dominate. Rather, it reflects that very large numbers of students studying business-related degrees compared to those studying engineering degrees.
The supply projections estimate that from 2009-2014, almost half of all graduates will have business-related degrees (Accounting; Business & Management; Banking, Finance & Economics). This figure rises to over 50% if Marketing and Law are also included. In contrast, only 3% of graduates will have Engineering degrees. It is interesting to compare these percentages to those in other countries. The figure below shows business and engineering graduates, each as a percentage of all graduates, for a selection of 11 countries (randomly selected to represent both developed and developing economies). It is interesting to note that none of the 10 other countries have a higher percentage of business graduates, or a lower percentage of engineering graduates. While each country has its own unique labor market needs, there is no compelling reason why Cambodia should be so out-of-step with countries ranging from the USA, Japan, Malaysia and Laos.
Figure 14: Business and Engineering graduates as % of all graduates – international comparison
0%
10%
20%
30%
40%
50%
60%
Business Engineering
AustraliaNew Zealand
United KingdomUSA
GermanyJapan
Hong KongMalaysiaVietnam
Lao PDRAverage
Cambodia
"Business" here is defined to include Accounting, Banking, Finance, Economics, Marketing & Law. "Engineering" here is defined to include Engineering, Manufacturing & Construction.Estmates for Cambodia based on internal projections for 2009. Estimates for other countries based on UNESCO data for 2006 or 2007 (latest available).

Review of Higher Education: Cambodia Page 64 of 82
3.3.2 Mismatches based on current salaries The primary method used in this study to identify labor market mismatches is to make long-term projections of graduate supply and employer demand. As discussed earlier, however, there are a range of shorter-term indicators that may provide clues about current mismatches in the labor market. One of these indicators is to compare market salaries for different types of job functions.
HRINC Cambodia’s Private Sector Salary Survey 2008-09 analyses the salaries of more than 10,000 employees from 59 private sector companies. The participating companies are from a broad range of sectors, including Manufacturing, Construction, Tourism, Finance, Communications and Business Services.
In this survey, each employee is categorized by job function (such as Accounting or Engineering) and by job level – ranging from level 10 (most junior) up to level 1 (most senior). These 10 job levels are based on the nature of the position, rather than specifically on the educational qualifications required for the position. In general, however, job levels 6 through to 3 represent professional staff who are performing jobs that require higher-level skills (and in most cases require a university degree).
Comparing the salaries paid in these “professional” job levels across different job functions may provide some clues as to possible labor market shortages.
The table below compares the average net monthly salaries of employees across certain job functions that correspond reasonably closely to a particular field of study – namely Accounting & Finance, Administration & Human Resources, Engineering, and Sales, Marketing & Customer Service. It shows the percentage difference between the average salary in a particular job function and the average salary for all job functions. As can be seen from the table, the average salaries of engineering staff are significantly higher than the average salaries in other job functions. While definitive conclusions cannot be drawn from this information, it does suggest that there may be a shortage of qualified engineers relative to other occupations, which is being reflected in higher salaries.
Table 16: Difference between average net monthly salary per job function versus market average salary
Job Level Accounting & Finance Admin & HR Engineering IT
Sales, Marketing & Customer Service
Level 3 -5% -23% 58% 29% -17%
Level 4 -2% -14% 54% -12% 12%
Level 5 12% -11% 35% -4% 9%
Level 6 -5% 1% 20% 14% 4%
Source: HRINC Cambodia. 2008. Private Sector Salary Survey 2008-09, p.16.
3.3.3 Mismatches in the IT labor market: a survey by CIST In 2009, one of Cambodia’s ;leading IT training providers, the Centre for Information System Training (CIST), conducted a detailed study of the IT jobs market in Cambodia. The study was based on interviews with senior managers in 142 organisations from 13 different sectors located in Phnom Penh. The results were then extrapolated to produce estimates for the overall Cambodian IT market.46
46 The data and analysis only relate to companies with more than 10 employees, which CIST believes represents the majority of companies requiring IT staff. Moreover, CIST did not take into account IT jobs in Public Administration, which could be significant. Indeed, the Model developed by the research team assumes that around one quarter of all existing IT jobs are currently in the Public Administration sector.

Review of Higher Education: Cambodia Page 65 of 82
CIST estimates that in 2009, there were approximately 4,600 IT jobs in Cambodia (which, reassuringly, is similar to our Model’s estimate of around 5,000 jobs requiring an IT degree). For 2010, CIST estimates there will be demand for 753 new jobs (compared to 342 in our Model). This is much lower than the projected supply of IT graduates in 2010 – around 1,800 bachelor degrees plus an additional 500 associate degrees.
CIST concludes that: “In the coming years, the number of [IT] graduates will keep increasing strongly, with a 28% average annual growth between 2009 and 2012, resulting in an estimated 3,671 graduates in 2012. It is obvious that the number of graduates will be much higher than the number of jobs available – worst case scenario of 5 times higher and best case scenario of 3.5 times higher.”
Despite this apparent oversupply, the CIST survey also finds that companies find it difficult to find good IT employees in all job categories except IT support. As CIST points out: “Since there are many new IT graduates each year, this could mean that training programs are not adequate enough to make good IT employees.”
This last statement highlights an important point touched upon earlier in this report: an excess supply of graduates may overstate the true extent of oversupply in the labor market, because many of the graduates may not be capable of filling the positions demanded by the market.
3.3.3.1 Labor market demand – by specific skills and attributes For a higher education system to meet the demands of the labor market, it must achieve two things. First, it must supply graduates in those study disciplines that are demanded by employers. (This has been covered earlier in the chapter.) Second, it must supply graduates with the types of skills and attributes that are useful in the workforce. This second requirement – the need to equip graduates with the right skills and attributes – is the subject of this section.
This section seeks to answer two important questions:
1. What types of skills and attributes are demanded by employers?
2. To what extent do graduates possess these skills and attributes?
Answers to these questions have important implications for Cambodia’s higher education system, in terms of course content and teaching methods.
To a large extent, these questions were addressed in a 2008 survey of employers commissioned by the Cambodian Federation of Employers & Business Associations (CAMFEBA).47 The CAMFEBA survey was completed by 220 executives (mainly chief executives, managing directors and human resources managers), who together employ approximately 32,000 employees in Cambodia. The survey sample was broadly representative of the Cambodian labor market, in terms of organization ownership (private and non-government organizations), origin (foreign or local), size (large or small) and sector (garments, tourism, etc.). Among other things, the survey asked employers about the skills possessed by Cambodian youth (broadly defined to include anyone aged under 30) and perceived skills shortages.
The CAMFEBA survey represented the first time in Cambodia that such a representative survey had been conducted of employers’ views about the skills of Cambodian workers. As such, much of the information contained in this section is based on the results of this CAMFEBA survey. In addition, the research team has interviewed many executives and academics on the issue of demand and supply of skills in Cambodia.
3.3.3.2 Overall skills adequacy The CAMFEBA survey asked employers if they believe there is a skills gap in Cambodia. In particular, they were asked whether Cambodian youth meet the real demand for skills. Only 13% of employers
47 Youth & Employment: Bridging the Gap, prepared by BDLINK Cambodia for CAMFEBA, July 2008.

Review of Higher Education: Cambodia Page 66 of 82
agreed that graduates have “all or most” of the right skills for the labor market, while a further 76% believed youth have “some but not all” of the required skills. The remaining 11% believed that youth are not educated with the right skills at all. These results were broadly similar for respondents across all sectors of the economy.
These results are consistent with a number of relevant international studies. For example, according to a study by McKinsey, based on interviews with 83 HR managers in multinational companies, on average only 13% of university graduates in low-wage nations are suitable to work for a multinational company.48
3.3.3.3 Types of skills In broad terms, skills and attributes fall into either of two categories:
− Knowledge-based or technical skills refer to knowledge or expertise in specific areas, such as accounting processes, irrigation construction or economic research.
− “Basic employability” skills are generic skills or attributes that are required to perform graduate-level jobs across most sectors of the economy. These include the ability to work in teams, solve problems, make decisions, communicate effectively and maintain good interpersonal relations.
3.3.3.4 Specific skills and attributes – their importance and availability When looking at the skills demanded by employers, it is important to consider which skills are considered most important for the role, and also which skills are considered most difficult to find among university graduates. In the CAMFEBA survey, employers were asked to select the three skills that are most important, as well as the three skills that are most difficult to find, when recruiting professional staff. The results are reproduced in the two figures on the following page.
The figures highlight that two skills stand out as being the most important and most difficult to find – the ability to analyse information and the ability to make decisions. It is interesting to note that foreign language skills relatively important but not very difficult to find. This may reflect, in part, the large numbers of students studying foreign languages degrees.
48 The Emerging Global Labor Market: Part II: The Supply of Offshore Talent in Services, McKinsey Global Institute, 2005, p.7

Review of Higher Education: Cambodia Page 67 of 82
Figure 15: Skills and attributes that are most important (professional staff)
7%
16%
23%
25%
36%
38%
38%
47%
49%
53%
0% 20% 40% 60% 80%
Other
Computers
Education
Technical
Communication
Work attitude
Foreign Language
Experience
Decision-making
Analytical
Source: CAMFEBA (2008)
Figure 16: Skills and attributes that are most difficult to find (professional staff)
6%
6%
7%
19%
29%
29%
32%
37%
55%
64%
0% 10% 20% 30% 40% 50% 60% 70%
Other
Education
Computers
Foreign Language
Communication
Work attitude
Technical
Experience
Decision-making
Analytical
Source: CAMFEBA (2008)
Note: see appendix for detailed tables for this section.

Review of Higher Education: Cambodia Page 68 of 82
The two figures below disaggregate the above results by some broad economic sectors – namely garments, industrial, trading, professional services, non-government organizations (NGOs) and hospitality (tourism). Not surprisingly, there are some notable differences between sectors skills shortages. For example, analytical and decision-making skills are particularly difficult to find in professional services firms and NGOs, but less so in garment factories.
Figure 17: Skills and attributes that are most important – by sector
0%
10%
20%
30%
40%
50%
60%
70%
80%
Analyt
ical
Decision-m
aking
Experie
nce
Techn
ical
Work Attit
ude
Communicati
on
Foreign
Langu
age
Computer
Educa
tion
Garment
Industrial
Trading
ProfessionalServicesNGO
Hospitality
Source: CAMFEBA (2008)
Figure 18: Skills and attributes that are most difficult to find – by sector
0%
10%
20%
30%
40%
50%
60%
70%
80%
Analyt
ical
Decision-m
aking
Experie
nce
Techn
ical
Work Attit
ude
Communicati
on
Foreign
Langu
age
Computer
Educa
tion
Garment
Industrial
Trading
ProfessionalServicesNGO
Hospitality
Source: CAMFEBA (2008)

Review of Higher Education: Cambodia Page 69 of 82
The figures below disaggregate the results by firm size (number of employees).
Figure 19: Skills and attributes that are most important – by number of employees
0%
10%
20%
30%
40%
50%
60%
70%
80%
Analyt
ical
Decision-m
aking
Experie
nce
Techn
ical
Work Attit
ude
Communicati
on
Foreign
Langu
age
Computer
Educa
tion
1 to 25
26 to 100
>100
Source: CAMFEBA (2008)
Figure 20: Skills and attributes that are most difficult to find – by number of employees
0%
10%
20%
30%
40%
50%
60%
70%
80%
Analyt
ical
Decision-m
aking
Experie
nce
Techn
ical
Work Attit
ude
Communicati
on
Foreign
Langu
age
Computer
Educa
tion
1 to 25
26 to 100
>100
Source: CAMFEBA (2008)

Review of Higher Education: Cambodia Page 70 of 82
The figures below disaggregate the results by whether the firm is foreign-owned or local. Figure 21: Skills and attributes that are most important – by firm ownership
0%
10%
20%
30%
40%
50%
60%
70%
80%
Analyt
ical
Decision-m
aking
Experie
nce
Techn
ical
Work Attit
ude
Communicati
on
Foreign
Langu
age
Computer
Educa
tion
Foreign
Local
Source: CAMFEBA (2008)
Figure 22: Skills and attributes that are most difficult to find – by number of employees
0%
10%
20%
30%
40%
50%
60%
70%
80%
Analyt
ical
Decision-m
aking
Experie
nce
Techn
ical
Work Attit
ude
Communicati
on
Foreign
Langu
age
Computer
Educa
tion
Foreign
Local
Source: CAMFEBA (2008)
Managers interviewed during this survey all provided similar commentary, some of which are provided below:
HR Manager, Telecom Sector: “The most difficult skills is the technical and engineer specialized in Telecom. Our local market has a small talent pool which current operators are dragging back and forth. For example, we have very much difficulty in finding a skilled employee to perform the role of OSS Engineer or Core Network. What we did was we have outsourced this kind of skills overseas. “

Review of Higher Education: Cambodia Page 71 of 82
Chapter 4: Conclusions, Key Themes & Recommendations
4.1 Conclusions − Cambodia’s higher education system has grown rapidly over the past 5 years, in terms of
number of HEIs and student enrolments with high concentration in the capital city and main provinces.
− Only 5% of the tertiary-age population is enrolled in tertiary education which is quite low in comparison with an average of East Asia and the Pacific region. However, this figure is anticipated to increase significantly over the next several years.
− Higher education fees appear to be affordable by majority of Grade 12 graduate students. The average annual unit cost of a Cambodia student is below Cambodia’s GDP per capita which is on the low side among least developed countries, leading to limited educational services.
− The emphasis has been weighted too strongly towards expanding the system (coverage and quantity), with insufficient regard for improving the system (quality and labor market responsiveness).
− Accreditation of HEIs has not been rigorous enough – there are too many small, poorly funded, poor quality HEIs
− The quality of many courses is inadequate – inadequate infrastructure and teaching resources, large number of students in classroom, out-dated teaching methodologies, general low standards, uncompetitive compensation packages resulting in teachers taking on too many teaching hours, lack of credibility in student grades, etc.
− Access to qualified teachers with practical experiences is a challenge and HEIs cannot offer competitive compensation to attract and retain experienced and qualified teaching staff to devote full time and energy for the sake of quality of education.
− While there is little hard data available, there appears to be a growing oversupply of university graduates – there are too many graduates competing for too few jobs. This conclusion is based on the results of the workforce projection model developed for this research project, as well as anecdotal evidence, interviews with relevant stakeholders and a research study of the IT jobs market in Cambodia.
− The growing oversupply of graduates is likely to lead to high rates of graduate unemployment, with many graduates unlikely to get a sufficient return on their significant investment in education. This trend is likely to get worse over the next few years. As a result, earlier studies which have shown relatively high returns to higher education in the past may not be replicated in future studies.
− Students are enrolled in the wrong study disciplines – too many are enrolled in business-related courses and law while too few are enrolled in engineering.
− Even within study disciplines, graduating students do not have the right skills for the labor market. Course curricula and teaching methodologies focus too much on theory and not enough on practical workplace skills (analysis, problem-solving, decision-making).
− Any assessment of Cambodia’s labor market for graduates – including the conclusions reached in this report – will be open to debate and contention while there remains a lack of information about labor market demand and graduate employment. Developing more effective information systems, which help inform Government, policymakers, donors, universities and other stakeholders about current and future labor conditions, is crucial to enabling an effective and responsive higher education system.

Review of Higher Education: Cambodia Page 72 of 82
4.2 Proposed recommendations − The Government should shift its emphasis from expansion of the higher education system
(coverage and enrolment numbers) to improvement of the higher education system (accreditation, quality and labor market responsiveness). This is not possible without a clear understanding of the vision of the government for the labor force into which a higher education and vocational training strategies complement each other in achieving objectives.
− The government should pay more attention on HEIs which charge low level of fees associated with the quality of service leading to negative impact on quality of education or ACC could impose stricter measure in the accreditation process of HEIs. Institutions charging excessively low fees and providing poor education service should be certified insufficiently qualified bachelor holders, and should not be accredited as providing bachelor certification, but associate degree certification.
− A review of licensing and processes of the HE system overall to ensure that HEIs and government are focusing their efforts in the right areas: e.g. should the signing of certificates be done through the ministry or by the university itself if it is accredited by the government as a HEI.
− There is a need for a review of licensing, policies, staffing of DHE to ensure sufficient resources are allocated to and implementing the vision of HE.
− There is a need for a workforce vision to enable the building of an effective higher education vision and system that addresses the needs and expectations of the growing number of youth entering the labor market and labor market systems need to be coordinated in order to inform policy and strategy.
− The Government should review its graduate supply projections (for the next five years) to ensure their accuracy.
− The Government, with assistance from the World Bank and other relevant stakeholders, should refine and improve the Labor Market Model featured in this study. The key assumptions and estimates should be tested, revised and updated, with the aim of producing more reliable demand projections for the next five years. This Model should be updated annually, with the updated demand-supply projections widely disseminated to HEIs (especially) as well as to vocational training providers, employers and Grade 12 students.
− The Government, with the assistance from the World Bank, universities and other relevant stakeholders, should consider undertaking tracer studies of university graduates – following their employment experience after graduating. The results would provide valuable signals to the market regarding overall graduate unemployment levels and demand-supply mismatches in particular fields of study.
− The Government should look for ways to encourage HEIs to review their course curricula and teaching methodologies, with a view to equipping students with practical skills that are demanded by employers. This is best achieved by facilitating regular, meaningful consultations and linkages between universities and employers regarding course curricula.
− Organizational Development needs of DHE: The department requires an overview of its staffing needs, roles and responsibilities within is strategic plan including a clear development and training program to address the needs of staff members to implement their work effectively.
− Practical solutions to improve education quality can be done in the following ways: 1) Strengthening accreditation (of HEIs and course curricula) within a strategic framework that addresses a workforce vision and how higher education will contribute to this development; 2) Before issuing foundation year course certificate, Accreditation committee of Cambodia should impose stricter measures on accreditation and quality assurance process by carefully evaluating six assessment criteria: i). Department of foundation year course; ii) Strategic plan for foundation year course; iii) Foundation year course curriculum; iv) Teaching staff in foundation year course program; v) Physical facilities and learning resources; vi) student admission; 3) Improve teacher

Review of Higher Education: Cambodia Page 73 of 82
standards through providing support to universities and building links with private sector to that have working experience and practical implementation of theories learnt during university. Building a qualification framework for teachers and regular updating of skills and methodologies through a centralized coordination mechanism – either a university association or the DHE itself.
− Leading HEIs with sufficient resources need to take appropriate measures to recruit and retain qualified and experienced teaching staff by offering competitive incentives and creating good working environments in which teaching staff, in turn, are willing to devote time and energy for teaching quality.
o Governance and roles and responsibilities between HEIs and government need to be reviewed to ensure effective use of resources.
o Financing needs to be channeled to address the needs of the labor market and to strengthen the supply of graduates in areas that are currently not producing sufficient supplies or very poor quality.
o Sequencing of reforms should be done in a structured and prioritized manner within an overall vision for HE and link to the labor market needs.
− There is a need for closer collaboration between ministries especially MoLVT and HE to ensure effective use of resources and funds.

Review of Higher Education: Cambodia Page 74 of 82
Appendix
5.1 Research Methodology Various approaches were used to undertake the study. Firstly, the team conducted desk research by reviewing relevant documents, including the structure and performance of Cambodian economy, employment sector, government strategy, and previous studies within the context of higher education sector. Secondly, the team conducted expert interview with high and medium ranking government officials and practitioners with deep understanding and knowledge of higher education sector and institutions, particularly MoEYS, Department of Higher Education, and Accreditation Committee of Cambodia (ACC). Higher Education Institutes (HEIs), teachers, and students were also consulted to have a good understanding of the real practices at operational level as well as collect relevant reports and statistics for analysis. This was supplemented by field observation to cross-check information provided and actual implementation at higher education institutions in order to be able to provide an overall picture of higher education system.
Following desk research, utilization of information available in 2008 population census, 2007 Socio-Economic Survey, employment data from HR INC Cambodia’s salary survey, labor force from other countries, sector’s historical employment growth rates, overall outlook for the economy, the discussion with employers and university administrators and consultation with Department of Higher Education, Office of Statistics and Information, the team developed Two Simple Models: Demand and Supply Model for higher education.
The demand model or workforce projection model was created to estimate demand for higher education graduates in Cambodia. The generation of forecasts for annual graduate demand was based on key variables and assumptions: total sector employment, sector employment with high education, distribution by degree type of sector employment with higher education degree, annual growth (%) of total sector employment, and annual growth (%) of sector employment with higher education. The output of demand model was to provide forecasts, for each year from 2009 to 2014, and for each sector of the economy, of the number of new graduate positions – by degree type – that will be demanded by employers.
The supply model was developed to forecast the number of graduates entering the labor market from 2009 to 2014. This model applied an average of historical total enrolments by discipline in public and private HEIs from 2007 to 2009. It then projected the total bachelor degrees by discipline in three scenarios, namely Current Trend Scenario, Slow Growth Trend Scenario, and High Growth Trend Scenario. These scenarios were based mainly on the assumption of projected number of grade 12 graduates, projected number of students enter HEIs and number of student graduate bachelor degrees. Other factors including in the supply model of higher education graduates were higher education fee, MoEYS, ACC and HEIs policies on quality of education, and anticipated high rates of unemployment among university graduates. The output of supply model was to project number of bachelor degree by discipline from 2009 to 2014.
The preliminary assumptions and results of demand and supply model were consulted with the World Bank economists in Cambodia and modified after receiving inputs and suggestions. The study team then, using the results of demand and supply model as a foundation, compares the demand projection and supply projection and assesses potential demand-supply mismatches – both in aggregate and by field of study. The results from this analysis and findings from consultation were used as a guideline for possible recommendations for policies makers, relevant government agencies, higher education providers, parents and students and other stakeholder involving in higher education sector in Cambodia.

Review of Higher Education: Cambodia Page 75 of 82
5.2 Reference Materials Ashish Lall. 2008. Returns to Education in Cambodia: Results from the 2007 Socio-Economic Survey, Nov 2008, Asia Competitiveness Institute, LKY School of Public Policy, National University of Singapore.
BDLINK. 2008. Youth & Employment: Bridging the Gap, prepared by BDLINK Cambodia for CAMFEBA, July 2008.
C. Chealy. 2009. The Political Economy of Educational Reforms and Capacity Development in Southeast Asia: Higher Education in Cambodia, Springer.
Canadian Council on Learning for British Columbia Ministry of Advanced Education. 2007. Is it Possible to Accurately Forecast Labor Market Needs? (January 2007), Prepared by, Canada.
Chen, Ching-Yaw; Sok, Phyra; Sok, Keomony. 2007. Benchmarking Potential Factors Leading to Education Quality: A Study of Cambodian Higher Education in Quality Assurance in Education: An International Perspective, 2007.
Chris Sakellariou, Demand for Skills, Supply of Skills and Returns to Schooling in Cambodia, Economic Growth Centre, Nanyang Technological University, Singapore, Working Paper No. 2008/05.
EIC. 2009. Cambodia Economic Watch, April 2009.
Francois Orivel. 2009. Financing higher education in Cambodia, March 2009.
HRINC Cambodia. 2008. Private Sector Salary Survey 2008-09
ILO. 2007. Labor and Social Trends in ASEAN 2007, Integration, Challenges and Opportunities, Bangkok, 2007.
McKinsey Global Institute. 2005. The Emerging Global Labor Market: Part II: The Supply of Offshore Talent in Services, 2005
Ministry of Planning. 2009. National Institute of Statistics: Education 2007 Report based on Socio-Economic Survey 2007, August 2009
MoEYS, Department of Higher Education. 2009. Statistics of students in academic year 2008-2009.
MoEYS. 2005. Education Sector Support Program 2006-2010, December 2005.
Royal University of Phnom Penh, Handbook 2007-2011.
UNESCO. 2006. Higher Education in South-East Asia, 2006
Vin McNamara. 2008. Vision, Strategy & Human Resources Development Plan for MoEYS Higher Education, Consultant’s Report, 2008.
World Bank, Cambodia summary of higher education sheet. No Date
World Bank. 2009. Cambodia – Higher education quality and capacity improvement project, project information document, 2009.
World Bank. 2009. Sustaining Rapid Growth in a Challenging Environment, Cambodia Country Economic Memorandum, January 2009.

Review of Higher Education: Cambodia Page 76 of 82
5.3 Sector Activities and Definitions
Employment Sector Definitions/Component
Agriculture Fishery, forestry, logging, crops, livestock and poultry
Communications Telecommunications and information technology
Construction Construction and related activities
Education Public and private education
Finance Banking, microfinance, insurance and investment
Garment Textiles, apparel and footwear
Health Public and private health services
Other Other activities that do not fall into any of the specified sectors
Other Manufacturing Mining, food, beverage, tobacco, rubber, non-metallic, basic metal and metal products
Other Social Services Not-for-profit activities, community services
Public Administration and Defense All civil services except health and education
Real Estate and Business Services Real estate, consulting and business-related services
Tourism Hotels, restaurants and travel agents
Trade Wholesale and retail trade, motor vehicle sales and repair
Transport Shipping and logistics, other transportation services

5.4 Graduate demand and supply projections, 2009-2014 Year
Field of study Demand SupplyExcess Supply Demand Supply
Excess Supply Demand Supply
Excess Supply Demand Supply
Excess Supply Demand Supply
Excess Supply Demand Supply
Excess Supply Demand Supply
Excess Supply
Supply as % of
DemandAccounting 460 2,377 1,917 1,032 2,524 1,492 1,555 2,852 1,297 1,743 2,968 1,225 2,034 5,651 3,617 2,396 7,190 4,794 9,220 23,562 14,342 256%Banking, Finance & Economics 840 3,095 2,255 2,305 3,287 982 2,821 3,714 893 3,215 3,865 650 3,716 7,359 3,643 4,320 9,363 5,043 17,215 30,683 13,468 178%Business & Management 606 4,739 4,133 1,192 5,031 3,839 1,927 5,686 3,759 2,182 5,918 3,736 2,539 11,266 8,727 2,968 14,334 11,366 11,414 46,974 35,560 412%Marketing 153 252 99 740 268 -472 1,353 303 -1,050 1,582 315 -1,267 1,911 600 -1,311 2,328 763 -1,565 8,066 2,501 -5,565 31%Law 116 1,192 1,076 167 1,266 1,099 199 1,431 1,232 214 1,489 1,275 233 2,835 2,602 255 3,607 3,352 1,184 11,820 10,636 998%Tourism 57 665 608 360 706 346 400 798 398 445 830 385 576 1,581 1,005 794 2,011 1,217 2,632 6,591 3,959 250%Sociology, Humanity & Arts 208 1,391 1,183 241 1,477 1,236 256 1,669 1,413 271 1,737 1,466 288 3,307 3,019 306 4,208 3,902 1,570 13,789 12,219 878%Foreign Languages 307 3,325 3,018 426 3,530 3,104 478 3,989 3,511 517 4,152 3,635 565 7,905 7,340 622 10,057 9,435 2,916 32,958 30,042 1130%Engineering 264 726 462 650 771 121 1,620 871 -749 1,615 907 -708 1,860 1,726 -134 2,144 2,196 52 8,153 7,197 -956 88%IT 170 1,811 1,641 342 1,923 1,581 490 2,174 1,684 555 2,262 1,707 637 4,307 3,670 733 5,479 4,746 2,928 17,956 15,028 613%Health Science 1,572 1,253 -319 1,751 1,331 -420 2,310 1,504 -806 2,579 1,565 -1,014 2,879 2,980 101 3,215 3,791 576 14,307 12,424 -1,883 87%Other Science 67 482 415 111 511 400 153 578 425 163 601 438 176 1,145 969 191 1,456 1,265 860 4,773 3,913 555%Agriculture & Rural Development 406 871 465 589 925 336 860 1,046 186 963 1,088 125 1,087 2,072 985 1,237 2,636 1,399 5,141 8,638 3,497 168%Total 5,225 22,179 16,954 9,907 23,550 13,643 14,420 26,615 12,195 16,045 27,697 11,652 18,502 52,734 34,232 21,507 67,091 45,584 85,606 219,866 134,260 257%
Total (2009-2014)2013 20142009 2010 2011 2012

Review of Higher Education: Cambodia Page 78 of 82
Figure 23: Higher Education Organisation Structure
MOEYS Website: http://www.MOEYS.gov.kh (new mandate 2008 – 2012)
24 provinceMunicipal offices
of Educations, Youth
and Sport
Dept of InternalAudit & Audit unit
MinisterSecretary of State
Under Secretary of State
Permanent Secretaryof General for EFA
General Department ofEducation
General Department of Admin.
and FinanceGeneral InspectorateGeneral Department
Of YouthGeneral Department
of SportGeneral Department of
Higher Education
Dept. of Admin
Dept. of Finance
Dept. of Planning
Dept. of Material and
State Properties
Dept. of CultureRelation andscholarship
Dept. of Informationand ASEAN Affairs
National Institute of Education
Dept. of Personnel
Dept. of Primary Education
Dept. of Health Education
Dept. of SecondaryEducation
Dept. of Non- FormalEducation
Dept. of Early Childhood Education
Dept. of Pedagogy Research
Dept. of TeacherTraining
Dept. of Higher Education
Dept. of Science Research
Dept. of PhysicalEducation and
Sports
National Center for Sport Training
National Institute Of Physical
Education andSport
Dept. of PhysicalEducation and
SportsStudent
Dept. of Youth
Dept. Gender Management
Inspectorate of Education
Inspectorate of Admin. And
Finance
Advisers
Cabinet
Audit Unit
Publishing and Distribution
House
Same level (hierarchy)

Review of Higher Education: Cambodia Page 79 of 82
Figure 24: Department of Higher Education Organization Structure
Mr.Roath SokhaDirector of Higher Education Dept.
Ms. Mak Nang
Vice Director of HE Dept.
Mr. You Virak
Vice Director of HE Dept.
Mr. Kong Phom Mika
Vice Director of HE Dept.
Mr. Kong Dina
Vice Director of HE Dept.
Academic Coordination Office.
Total Staff: 14 staff
Female Staff: 2
Statistic and Information Office.
Total Staff: 7 staff
Female Staff: 2
Policy Office
Total Staff: 12 Staff
Female Staff: 5
Admission Office
No of Staff: 8 staff
Female Staff: 4
Inspection Office
Total Staff: 10 Staff
Female Staff: 3
Administration Office.
Total Staff: 8 staff
Female Staff: 1
Total Staff: 64
Female Staff: 18

Review of Higher Education: Cambodia Page 80 of 82
5.5 Skills & attributes that are most important
Analytical Decision-making Experience Technical Work Attitude Communication Foreign
Language Computer Education
All firms 53% 49% 47% 25% 38% 36% 38% 16% 23%
Garment 26% 26% 58% 26% 63% 32% 47% 26% 16%
Industrial 42% 42% 25% 25% 42% 50% 33% 17% 33%
Trading 54% 54% 31% 8% 38% 46% 31% 0% 38%
Professional Services 68% 50% 41% 27% 50% 41% 41% 9% 23%
NGO 66% 57% 55% 38% 34% 29% 39% 13% 25%
Hospitality 38% 50% 50% 13% 38% 46% 46% 33% 17%
Foreign 53% 50% 47% 21% 45% 33% 41% 15% 19%
Local 55% 51% 48% 30% 30% 40% 36% 17% 28%
1 to 25 45% 34% 36% 33% 29% 37% 37% 14% 20%
26 to 100 70% 38% 39% 36% 32% 30% 41% 16% 22%
>100 41% 59% 48% 24% 54% 39% 37% 17% 24%
Source: CAMFEBA (2008)
5.6 Skills & attributes that are most difficult to find
Analytical Decision-making Experience Technical Work Attitude Communicatio
n Foreign
Language Computer Education
All firms 64% 55% 37% 32% 29% 29% 19% 7% 6%
Garment sector 58% 37% 53% 32% 32% 21% 16% 16% 11%
Industrial 67% 33% 50% 25% 17% 25% 42% 8% 0%
Trading 69% 62% 23% 31% 38% 23% 23% 0% 8%
Professional Services 77% 64% 23% 27% 32% 32% 23% 9% 5%
NGO 73% 57% 43% 36% 30% 29% 16% 5% 5%
Hospitality 46% 63% 38% 21% 42% 38% 21% 13% 13%

Review of Higher Education: Cambodia Page 81 of 82
Foreign 69% 57% 42% 32% 29% 28% 16% 6% 6%
Local 60% 54% 32% 33% 30% 30% 23% 8% 7%
1 to 25 53% 46% 26% 34% 14% 29% 24% 11% 5%
26 to 100 81% 51% 29% 38% 16% 25% 26% 12% 6%
>100 54% 54% 46% 33% 39% 31% 20% 6% 7%
Source: CAMFEBA (2008)