Embed Size (px)
Citation preview

High tuning stability of sampled grating quantum cascade lasers
Stefan Kalchmair,1* Romain Blanchard,2 Tobias S. Mansuripur,1 Guy-Mael de Naurois,1 Christian Pfluegl,2 Mark F. Witinski,1,2 Laurent Diehl,2 Federico Capasso,1 and Marko
Loncar1 1School of Engineering and Applied Sciences, Harvard University, 29 Oxford St, Cambridge, Massachusetts 02138,
USA 2Eos Photonics, 30 Spinelli Place, Cambridge, Massachusetts 02138, USA
Abstract: Predictable tuning behavior and stable laser operation are both crucial for laser spectroscopy measurements. We report a sampled grating quantum cascade laser (QCL) with high spectral tuning stability over the entire tuning range. We have determined the minimum loss margin required to suppress undesired lasing modes in order to ensure predictable tuning behavior. We have quantified power fluctuations and drift of our devices by measuring the Allan deviation. To demonstrate the feasibility of sampled grating QCLs for high-precision molecular spectroscopy, we have built a simple transmission spectroscopy setup. Our results prove that sampled grating QCLs are suitable light sources for highly sensitive spectroscopy measurements.
©2015 Optical Society of America
OCIS codes: (140.5965) Semiconductor lasers, quantum cascade; (140.3600) Lasers, tunable; (140.3570) Lasers, single-mode.
References
1. Y. Yao, A. J. Hoffman, and C. F. Gmachl, “Mid-infrared quantum cascade lasers,” Nat. Photonics 6(7), 432–439 (2012).
2. P. Rauter, S. Menzel, A. K. Goyal, C. A. Wang, A. Sanchez, G. Turner, and F. Capasso, “High-power arrays of quantum cascade laser master-oscillator power-amplifiers,” Opt. Express 21(4), 4518–4530 (2013).
3. R. F. Curl, F. Capasso, C. Gmachl, A. A. Kosterev, B. McManus, R. Lewicki, M. Pusharsky, G. Wysocki, and F. K. Tittel, “Quantum cascade lasers in chemical physics,” Chem. Phys. Lett. 487(1–3), 1–18 (2010).
4. A. Hugi, R. Terazzi, Y. Bonetti, A. Wittmann, M. Fischer, M. Beck, J. Faist, and E. Gini, “External cavity quantum cascade laser tunable from 7.6 to 11.4 μm,” Appl. Phys. Lett. 95(6), 061103 (2009).
5. B. G. Lee, H. F. A. Zhang, C. Pflügl, L. Diehl, M. A. Belkin, M. Fischer, A. Wittmann, J. Faist, and F. Capasso, “Broadband distributed-feedback quantum cascade laser array operating from 8.0 to 9.8 µm,” IEEE Photon. Technol. Lett. 21(13), 914–916 (2009).
6. V. Jayaraman, Z. M. Chuang, and L. A. Coldren, “Theory, design, and performance of extended tuning range semiconductor lasers with sampled gratings,” IEEE Jour. Quant. Elec. 29(6), 1824–1834 (1993).
7. B. Mason, J. Barton, G. A. Fish, L. A. Coldren, and S. P. Denbaars, “Design of sampled grating DBR lasers with integrated semiconductor optical amplifiers,” IEEE Photon. Technol. Lett. 12(7), 762–764 (2000).
8. T. S. Mansuripur, S. Menzel, R. Blanchard, L. Diehl, C. Pflügl, Y. Huang, J. H. Ryou, R. D. Dupuis, M. Loncar, and F. Capasso, “Widely tunable mid-infrared quantum cascade lasers using sampled grating reflectors,” Opt. Express 20(21), 23339–23348 (2012).
9. S. Slivken, N. Bandyopadhyay, Y. Bai, Q. Y. Lu, and M. Razeghi, “Extended electrical tuning of quantum cascade lasers with digital concatenated gratings,” Appl. Phys. Lett. 103(23), 231110 (2013).
10. M. Carras, M. Garcia, X. Marcadet, O. Parillaud, A. De Rossi, and S. Bansropun, “Top grating index-coupled distributed feedback quantum cascade lasers,” Appl. Phys. Lett. 93(1), 011109 (2008).
11. C. Y. Wang, L. Kuznetsova, V. M. Gkortsas, L. Diehl, F. X. Kärtner, M. A. Belkin, A. Belyanin, X. Li, D. Ham, H. Schneider, P. Grant, C. Y. Song, S. Haffouz, Z. R. Wasilewski, H. C. Liu, and F. Capasso, “Mode-locked pulses from mid-infrared quantum cascade lasers,” Opt. Express 17(15), 12929–12943 (2009).
12. A. Lyakh, R. Maulini, A. Tsekoun, R. Go, C. Pflugl, L. Diehl, Q. J. Wang, F. Capasso, C. Kumar, and N. Patel, “3 W continuous-wave room temperature single-facet emission from quantum cascade lasers based on nonresonant extraction design approach,” Appl. Phys. Lett. 95(14), 141113 (2009).
#236107 - $15.00 USD Received 12 Mar 2015; revised 27 May 2015; accepted 29 May 2015; published 5 Jun 2015 © 2015 OSA 15 Jun 2015 | Vol. 23, No. 12 | DOI:10.1364/OE.23.015734 | OPTICS EXPRESS 15734

13. P. Werle, R. Mücke, and F. Slemr, “The limits of signal averaging in atmospheric trace gas monitoring by tunable diode laser absorption spectroscopy,” Appl. Phys. B 57, 131–139 (1993).
14. R. Lewicki, J. H. Doty 3rd, R. F. Curl, F. K. Tittel, and G. Wysocki, “Ultrasensitive detection of nitric oxide at 5.33 µm by using external cavity quantum cascade laser-based Faraday rotation spectroscopy,” Proc. Natl. Acad. Sci. U.S.A. 106(31), 12587–12592 (2009).
15. A. Fried, B. Henry, B. Wert, S. Sewell, and J. R. Drummond, “Laboratory, ground-based, and airborne tunable diode laser systems: performance characteristics and applications in atmospheric studies,” Appl. Phys. B 67(3), 317–330 (1998).
1. Introduction
Over the past few years, Quantum Cascade Lasers (QCLs) have found a tremendous number of applications, from spectroscopy to infrared countermeasures and free space optical communications [1]. Today, QCLs provide high optical output power and excellent beam quality [2]. Mid-infrared spectroscopy using QCLs is particularly interesting since most vapor phase and condensed phase compounds have very specific absorption spectra in the mid-wavelength infrared region (the Functional Group Region, 1500-4000 cm−1) and/or the long-wavelength infrared region (the Fingerprint Region, 400-1500 cm−1) [3]. For many applications (e.g. detection of toxins, explosives, etc.) high power is key for very sensitive measurements, such as trace residue detection, while high tunability is critical for ensuring high measurement specificity. To achieve a sufficiently high sensitivity/selectivity, therefore, a bright tunable light source with good beam quality is required. Conventional infrared spectrometers (for instance Fourier transform infrared spectrometers) use broadband thermal light sources to achieve high resolution, but the sensitivity is limited due to the low brightness of the source.
Single-wavelength QCLs with high brightness and good beam quality present an excellent light source for laser spectroscopy of narrowly absorbing chemicals, typically light gases relevant to the environment or public safety. In order to combine the advantages of a QCLs brightness with greater breadth of wavelength coverage, much work has gone into External Cavity QCLs, which use a mechanically actuated diffraction grating. External cavity QCLs show the widest tuning range achievable today with as much as 40% tuning range with respect to the center wavelength in pulsed operation (e.g. > 450 cm−1 around 9.5 µm) [4]. Unfortunately, these lasers have severe limitations such as slow tuning speeds and an extreme sensitivity to mechanical vibrations, which limits the use of these devices in the field and raises questions about long-term wavelength drift. Distributed feedback (DFB) laser arrays present a simple monolithic alternative for a tunable light source [5]. In a DFB array, each laser emits at a different wavelength, covering as a whole a wide spectral range (e.g. > 200 cm−1 around 9 µm). This monolithic approach allows fast electrical tuning, but is hampered by the emission from multiple apertures, rather than just one.
An elegant solution which allows for broad tuning, single-wavelength emission from a single laser facet, and uses no moving parts is the sampled grating QCL. This approach uses a Fabry-Pérot (FP) cavity with sampled grating distributed Bragg reflectors (SGDBRs) as mirrors. The wavelength is tuned by changing the refractive index of one of the mirrors, usually by electrically induced joule heating. Since the heated volume is small, this process can be very fast (~µsec) and reproducible. These lasers use the Vernier effect to achieve large tuning even for small changes of the refractive index [6,7]. Recently the first mid-infrared SGDBR-QCL has been successfully demonstrated operating around 8.5 µm wavelength with 5.4% tuning range [8]. Using a more advanced mirror design, the tuning range was increased to 10.9% for a QCL operating around 4.65 µm [9]. This technique has great potential as a broadly tunable light source for spectroscopy, providing high brightness from one aperture, high spectral breadth and a simple electronic tuning mechanism.
However, in practice these devices are very sensitive to process variations and driving conditions. The situation is similar to DFB lasers where the two cavity modes on each side of the photonic bandgap compete for the gain. Additional measures (e.g. anti-reflection coatings,
#236107 - $15.00 USD Received 12 Mar 2015; revised 27 May 2015; accepted 29 May 2015; published 5 Jun 2015 © 2015 OSA 15 Jun 2015 | Vol. 23, No. 12 | DOI:10.1364/OE.23.015734 | OPTICS EXPRESS 15735

metal top gratings) are needed to ensure single mode emission on only one of the two modes [4,10]. In widely tunable SGDBR-QCLs many cavity modes compete for the gain and a slight change in facet reflectivity or driving current can cause the lasing mode to switch. Proper mirror design is crucial to ensure robust single wavelength emission, which enables predictable tuning behavior and stable laser operation while sitting at a certain wavelength.
In this paper, we investigate the utility of SGDBR-QCLs for infrared spectroscopy measurements. Specifically, we study the tuning behavior for different mirror designs and derive a stability criterion. We then investigate different driving schemes of the devices and characterize output power fluctuation by measuring the Allan deviation. Finally, we discuss the practical utility of SGDBR-QCLs for infrared spectroscopy.
2. Design and fabrication
A SGDBR-QCL is a three-section device with a gain section located between two sampled grating mirror sections. Figure 1(a) shows a schematic cross-section through a SGDBR-QCL. A sampled grating is essentially a regular grating containing periodic spacer sections ( = sections with no grating elements). This can be described as spatial modulation of a periodic grating. The modulation period is called the sampling period (Fig. 1(b)).
Fig. 1. Schematic SGDBR-QCL device structure. (a) Cross section of the device. (b) Top view of the grating layout.
Fourier transform can be used to understand sampled gratings. The Fourier transform of a periodic sine function is single peak in the Fourier spectrum. If the sine function is modulated with a rectangular sampling function, the corresponding Fourier spectrum is a comb modulated with a Sinc squared function envelope. Analogously, the reflectivity spectrum of a periodic grating without sampling has a single reflectivity peak. The periodic spatial modulation of the grating ( = sampling) leads to the formation of a reflectivity comb with a Sinc squared function envelope. The reflectivity combs of the two sampled grating mirror sections are shown in Fig. 2. By design, the sampling period of the two combs is slightly different resulting in a different reflectivity comb spacing ∆ν1 and ∆ν2. This way only one pair of reflectivity peaks is overlapped for a given set of conditions within the relevant spectral range. The laser action takes place at the wavelength where two reflectivity peaks overlap, since here the reflectivity product of both combs has an absolute maximum. A slight change in refractive index of one of the mirror will shift the alignment to another pair of peaks, leading to a jump of the reflectivity maximum and discontinuous tuning of the laser. This effect is known as the Vernier effect. Continuous tuning can be achieved by changing the refractive index by the same amount in both mirrors simultaneously, which shifts the reflectivity combs by the same wavelength increment. A more detailed description of the working principle of SGDBR-QCLs can be found in [6–8]. An ideal laser with a flat gain curve will emit only at the absolute maximum of the reflectivity product, not at any side
#236107 - $15.00 USD Received 12 Mar 2015; revised 27 May 2015; accepted 29 May 2015; published 5 Jun 2015 © 2015 OSA 15 Jun 2015 | Vol. 23, No. 12 | DOI:10.1364/OE.23.015734 | OPTICS EXPRESS 15736
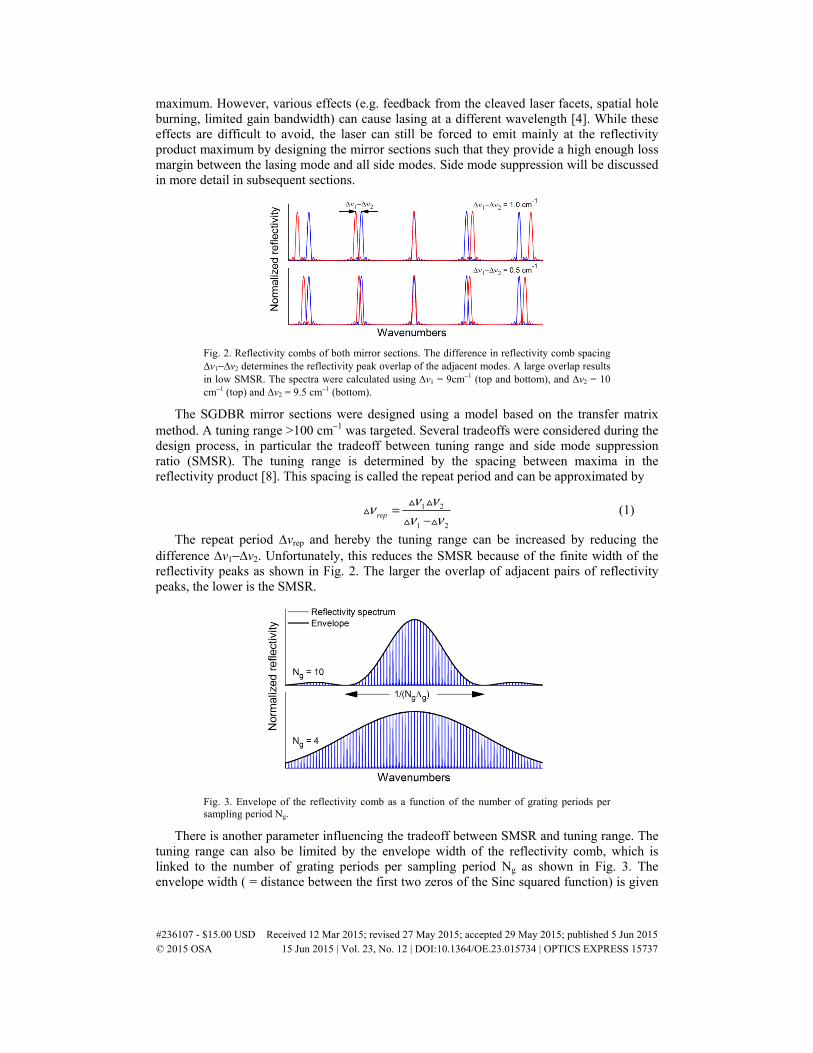
maximum. However, various effects (e.g. feedback from the cleaved laser facets, spatial hole burning, limited gain bandwidth) can cause lasing at a different wavelength [4]. While these effects are difficult to avoid, the laser can still be forced to emit mainly at the reflectivity product maximum by designing the mirror sections such that they provide a high enough loss margin between the lasing mode and all side modes. Side mode suppression will be discussed in more detail in subsequent sections.
Fig. 2. Reflectivity combs of both mirror sections. The difference in reflectivity comb spacing ∆ν1−∆ν2 determines the reflectivity peak overlap of the adjacent modes. A large overlap results in low SMSR. The spectra were calculated using ∆ν1 = 9cm−1 (top and bottom), and ∆ν2 = 10 cm−1 (top) and ∆ν2 = 9.5 cm−1 (bottom).
The SGDBR mirror sections were designed using a model based on the transfer matrix method. A tuning range >100 cm−1 was targeted. Several tradeoffs were considered during the design process, in particular the tradeoff between tuning range and side mode suppression ratio (SMSR). The tuning range is determined by the spacing between maxima in the reflectivity product [8]. This spacing is called the repeat period and can be approximated by
1 2
1 2rep
ν ννν ν
=−
(1)
The repeat period ∆νrep and hereby the tuning range can be increased by reducing the difference ∆ν1−∆ν2. Unfortunately, this reduces the SMSR because of the finite width of the reflectivity peaks as shown in Fig. 2. The larger the overlap of adjacent pairs of reflectivity peaks, the lower is the SMSR.
Fig. 3. Envelope of the reflectivity comb as a function of the number of grating periods per sampling period Ng.
There is another parameter influencing the tradeoff between SMSR and tuning range. The tuning range can also be limited by the envelope width of the reflectivity comb, which is linked to the number of grating periods per sampling period Ng as shown in Fig. 3. The envelope width ( = distance between the first two zeros of the Sinc squared function) is given
#236107 - $15.00 USD Received 12 Mar 2015; revised 27 May 2015; accepted 29 May 2015; published 5 Jun 2015 © 2015 OSA 15 Jun 2015 | Vol. 23, No. 12 | DOI:10.1364/OE.23.015734 | OPTICS EXPRESS 15737

by 1/(NgΛg). Λg is the grating period multiplied with the effective refractive index neff. A large Ng results in higher mirror reflectivity and higher SMSR, as will be discussed later, but the envelope of the reflectivity comb becomes narrower. If the envelope width becomes too narrow, the tuning range will be reduced as well.
We selected a reflectivity comb spacing for our sampled grating mirrors of ∆ν1 = 9 cm−1 (back mirror section) and ∆ν2 = 9.7 cm−1 (front mirror section), which corresponds to a repeat period ∆νrep≈125 cm−1. Ng was chosen such that the envelope width is similar to the repeat period ∆νrep. For Ng = 10 the envelope width is ≈108 cm−1, in which case the tuning range is dominated by the reflectivity envelope width. For designs with Ng≤8 the envelope width becomes larger than the repeat period, and the tuning range will be dominated by the repeat period. The reflectivity spectrum of both mirror sections for Ng = 10 is shown in Fig. 4(a). The transfer matrix simulation assumed perfectly anti-reflection coated facets, which is a good approximation. According to simulation a single layer Al2O3 coating can reduce the reflectivity to a value below 1%.
Fig. 4. SGDBR mirror design using transfer matrix simulation. (a) Reflectivity spectra of the two SGDBR mirror sections for Ng = 10 (in linear scale) and (b) the corresponding reflectivity product (in log scale). (c) Normalized adjacent mode loss margin Madj calculated for the entire tuning range. Mirror section 2 was tuned while mirror section 1 was kept fixed. Each circle shows the value of Madj as two reflectivity peaks are exactly aligned at that wavenumber.
In SGDBR lasers the resonator modes are formed by pairs of reflectivity peaks. To achieve predictable tuning behavior, good suppression of the adjacent resonator modes is essential. The mode at ν0 in Fig. 4(a) will most likely start lasing, but is competing mainly against the two adjacent modes at ν1 and ν2. The adjacent mode suppression is quantified by defining the normalized loss margin
( )
( )1 1 2 1 1 0 2 0
1 0 2 0
ln ( ) ( ) ( ) ( )
ln ( ) ( )adj
R R R RM
R R
ν ν ν νν ν
= (2)
where R1 and R2 are the reflectivities of mirror sections 1 and 2, respectively [6]. ν0 and ν1 are the wavenumbers of the lasing mode and the adjacent resonator mode, respectively. Madj is
#236107 - $15.00 USD Received 12 Mar 2015; revised 27 May 2015; accepted 29 May 2015; published 5 Jun 2015 © 2015 OSA 15 Jun 2015 | Vol. 23, No. 12 | DOI:10.1364/OE.23.015734 | OPTICS EXPRESS 15738

defined using only the adjacent resonator mode at ν1 (or equivalently ν2), since this mode always has the second highest reflectivity product.
The minimum Madj for SGDBR lasers fabricated in the InP-InGaAsP material system for the near-infrared (λ≈1.55 µm) was determined experimentally to be between 0.1 and 0.2 [6]. In QCLs, on the other hand, good side mode suppression is generally more difficult to achieve. QCLs suffer from pronounced spatial hole burning, which is the effect that the gain is saturated preferentially at the field maxima of the lasing mode [11]. Wherever competing cavity modes do not overlap spatially with the desired lasing mode, the competing modes are all amplified as well. Therefore we expect that Madj in QCLs ( = intersubband lasers) generally has to be higher compared to near-infrared laser diodes ( = interband lasers) to achieve the same SMSR.
The loss margin Madj can be adjusted by changing the number of grating periods per sampling period Ng. Figure 5 shows the calculated loss margin Madj for increasing Ng. A large Ng will result in a better SMSR, but cause a narrower envelope width. Since the reflectivity goes down towards the edges of the tuning range, the reflectivity product will be small. To start lasing at a wavelength far away from the center of the tuning range, the reflectivity product has to be larger than at any other wavelength. One way to force lasing at wavelengths far from the center of the tuning range is to shape the reflectivity envelope using aperiodic gratings [9]. For periodic gratings the envelope is always Sinc squared function shaped, which determines the envelope width and presents an upper limit for Ng.
Fig. 5. The adjacent mode loss margin Madj increases with the number of grating periods Ng. The plotted values show Madj of the mode at the center of the tuning range (2192cm−1). The upper limit for Ng is determined by the necessary envelope width, which is proportional to 1/Ng.
To investigate the tuning behavior and laser stability, we fabricated four SGDBR-QCLs with a Ng = 4,6,8 and 10 grating periods per sampling period. The QCL material was grown by molecular beam epitaxy (MBE) and designed to operate at 4.6 µm wavelength. The heterostructure design was chosen to exhibit a broad gain to allow a large tuning range. The QCL was grown on a Si-doped (3x1018 cm−3) InP substrate. The layer sequence is as follows: the lower cladding consists of 1.5 µm Si:InP (5x1016 cm−3) followed by 2.0 µm Si:InP (2x1016 cm−3) and 0.3 µm Si:InGaAs (3x1016 cm−3). The active region comprises 40 periods based on the design described in [12]. The upper cladding consists of the same layers as the lower cladding, but in reverse order. Finally, a 800 nm doped InP contact layer (5x1018 cm−3) followed by a 20 nm highly doped InGaAs contact layer (1x1019 cm−3) was grown on top of the upper cladding. From electroluminescence measurements we determined a full-width at half-maximum gain bandwidth of ≈280 cm−1 around the gain peak at 2173 cm−1 (4.60 µm).
The SGDBR mirrors were processed as buried sampled gratings into the InGaAs layer on top of the active region. The sampled gratings were defined using electron beam lithography, and etched to a depth of 320 nm by reactive ion etching (RIE). The upper cladding was regrown using metal organic chemical vapor deposition (MOCVD).
To prevent electrical cross-talk between the laser sections, 50 µm wide trenches were etched into the upper cladding. The etch depth was 900 nm, which is enough to remove the highly doped contact layer without significantly affecting the laser mode. Etching deeper can
#236107 - $15.00 USD Received 12 Mar 2015; revised 27 May 2015; accepted 29 May 2015; published 5 Jun 2015 © 2015 OSA 15 Jun 2015 | Vol. 23, No. 12 | DOI:10.1364/OE.23.015734 | OPTICS EXPRESS 15739
potentially lead to undesirable reflection or scattering losses. Next, 14 µm wide ridges were defined using laser lithography and dry-etched to a depth of 12 µm using RIE. The ridges were electrically insulated by depositing a 450 nm thick silicon-nitride layer using plasma-enhanced chemical vapor deposition. The insulation layer was opened on top of the ridges to provide electrical contact and Ti/Au (15/800 nm) contacts were deposited. The electrical resistance between the laser sections was about 850 Ω near zero bias voltage, which is about 10 times the resistance of the active region near zero bias voltage. It is crucial to have a higher resistance between the laser sections than across the active region to ensure independent control of each laser section.
The wafer was thinned to ≈150 µm using mechanical polishing and a Ti/Au (15/400 nm) back contact was deposited. The SGDBR lasers were cleaved to a total length of 7 mm (mirror section 1 = mirror section 2 = 2 mm, gain section = 3 mm). Finally, anti-reflection coatings consisting of a single layer of Al2O3 were deposited onto the laser facets using electron beam evaporation. The device was mounted with indium epitaxy-side-up onto a copper heat sink. For characterization the devices were placed on a thermoelectric cooler held at 18°C. The emission spectrum was measured using an FTIR spectrometer with 0.1 cm−1 resolution.
3. Tuning performance
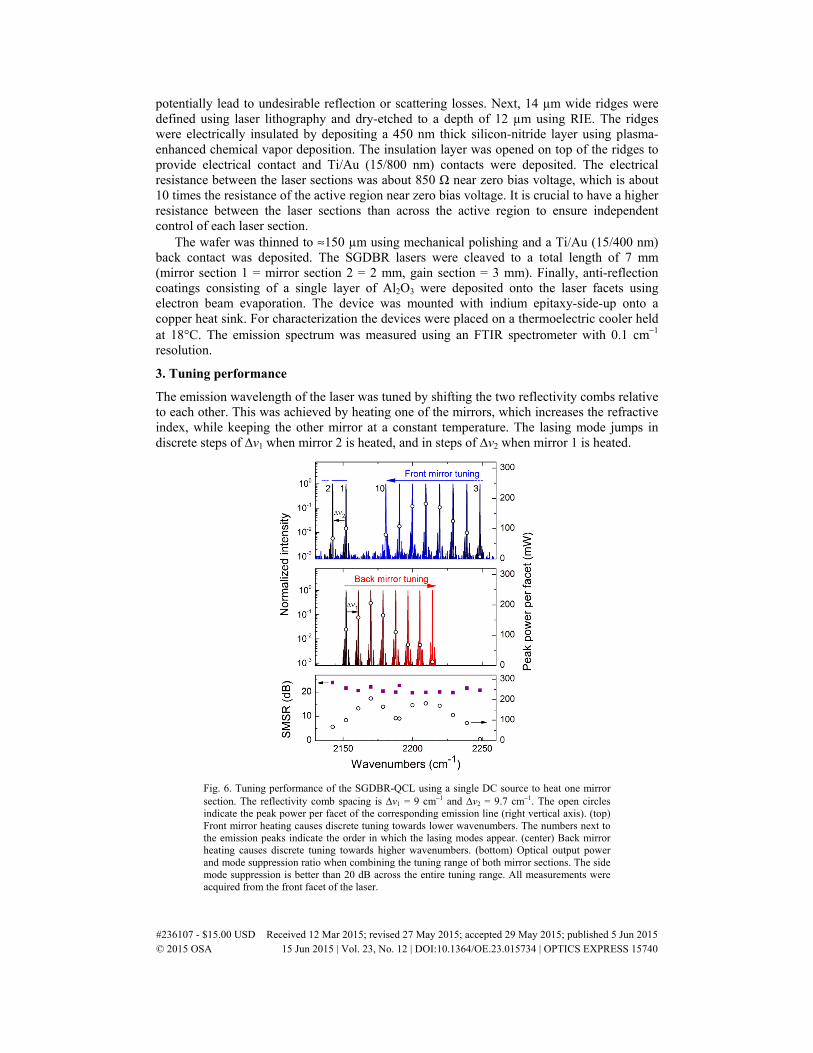
The emission wavelength of the laser was tuned by shifting the two reflectivity combs relative to each other. This was achieved by heating one of the mirrors, which increases the refractive index, while keeping the other mirror at a constant temperature. The lasing mode jumps in discrete steps of ∆ν1 when mirror 2 is heated, and in steps of ∆ν2 when mirror 1 is heated.
Fig. 6. Tuning performance of the SGDBR-QCL using a single DC source to heat one mirror section. The reflectivity comb spacing is ∆ν1 = 9 cm−1 and ∆ν2 = 9.7 cm−1. The open circles indicate the peak power per facet of the corresponding emission line (right vertical axis). (top) Front mirror heating causes discrete tuning towards lower wavenumbers. The numbers next to the emission peaks indicate the order in which the lasing modes appear. (center) Back mirror heating causes discrete tuning towards higher wavenumbers. (bottom) Optical output power and mode suppression ratio when combining the tuning range of both mirror sections. The side mode suppression is better than 20 dB across the entire tuning range. All measurements were acquired from the front facet of the laser.
#236107 - $15.00 USD Received 12 Mar 2015; revised 27 May 2015; accepted 29 May 2015; published 5 Jun 2015 © 2015 OSA 15 Jun 2015 | Vol. 23, No. 12 | DOI:10.1364/OE.23.015734 | OPTICS EXPRESS 15740

SG-DBR QCLs can be operated using different driving schemes. The mirror sections can be heated via the Joule effect either by applying long current pulses [8] or a direct current (DC) [9]. We used a variation of the latter method because of its simplicity, as it required only a pulsed current source to pump the gain section, and a DC source to heat one SGDBR mirror section and tune the laser. The gain section was pumped with 100 ns current pulses and 20 kHz repetition rate at IGS = 750 mA (1.79 kA/cm2). For comparison, the lasing threshold was IGS = 650 mA (1.55 kA/cm2), the rollover current was IGS = 1000 mA (2.39 kA/cm2). The tuning current was varied from 0 to 200 mA DC and applied to either the front or the back mirror section. The tuning current always stayed below the threshold current to prevent self lasing of the mirror section. Experimental data showed a tuning range of 106 cm−1 and side mode suppression ratio SMSR > 20 dB over the entire tuning range as shown in Fig. 6. Higher SMSR can be achieved by operating the laser in continuous wave, which requires efficient heat extraction for the active region e.g. by flip-chip mounting the laser onto AlN submounts. When the front mirror is heated, the lasing mode tunes in discrete steps of 9.7 cm−1 towards lower wavenumbers. At the edge of the tuning range (Mode #2), the lasing mode jumps to the opposite edge (Mode #3) and continues tuning in discrete steps towards lower wavenumbers. On the other hand, when the back mirror is heated the lasing mode tunes in discrete steps of 9 cm−1 toward higher wavenumbers.
Increasing the optical output power is possible by either injecting more current into the gain section or by pumping both mirrors with a current pulse to reduce the absorption losses. Laser driving schemes are described schematically in Fig. 11 in the appendix. The self-lasing threshold of the mirror sections is around 500 mA (1.8 kA/cm2). Pumping the mirrors with just 100 mA (0.36 kA/cm2) pulse current density almost tripled the optical power. However, the SMSR can be reduced in this case since feedback from the end facets is increased (Fig. 12 in the appendix).
4. Stability
Spectral tuning and power stability are crucial for spectroscopy, since fluctuations and drift of the optical output power introduce noise, thus limiting the sensitivity of the measurements, which depend on reproducible scanning in terms of wavelength, power, and tuning rate. To improve the signal-to-noise ratio (SNR), the signal can be averaged over an integration time τ. However, this improves the SNR only as long as the output power does not drift off too much. The optimum SNR is reached after a certain amount of averaging. Averaging beyond this point can actually decrease the SNR. The Allan deviation is the spectroscopists’ benchmark to quantify fluctuations and drift of laser systems, and allows identifying the optimum integration time for spectroscopy systems. A detailed description of the Allen deviation can be found in the appendix and in [13].
Figure 7 shows a measurement of the Allan deviation of a SGDBR-QCL both without tuning current (black) and with 80 mA tuning current applied to the back mirror. Each data point in the data set was acquired by integrating amplitude over one laser pulse. The entire data set was then normalized by its mean value to get a quantity, which is proportional to the Allan deviation in an absorption measurement and thus the detectable concentration change. The exact set of equations used to calculate the Allan deviation can be found in the appendix (Eq. (3)-(6)).
The Allan deviation of the SGDBR-QCL decreased rapidly and reached 3x10⁻⁴ after averaging only 2000 pulses. The ideal integration time for this laser with these current sources is about 100 ms. Interestingly, the minimum of the Allan deviation was lower by a factor of three when the DC current is supplied to the back mirror. We attribute the origin of this improvement to the higher laser output power emitted, leading to higher signal-to-noise ratio in that case. We do not yet have a good explanation for the bump observed at 3 ms integration time, but it is clearly related to the DC current source used in our experiment (Keithley 2040). The observed Allan Deviation minimum of 10−4 implies that a minimum detectable fractional
#236107 - $15.00 USD Received 12 Mar 2015; revised 27 May 2015; accepted 29 May 2015; published 5 Jun 2015 © 2015 OSA 15 Jun 2015 | Vol. 23, No. 12 | DOI:10.1364/OE.23.015734 | OPTICS EXPRESS 15741

absorption of as low as 10−4 could be possible with our laser source [14,15]. Of course, if an actual spectrometer were built around the source a new Allan Deviation minimum would need to be obtained in order to account noise and drift generated by the gas cell or any newly introduced components.
Fig. 7. Allan deviation of a SGDBR-QCL without tuning current (black like), and with 80 mA tuning current applied onto the back mirror (red line).
In order to be useful for sensing applications, a tunable laser source must have a predictable tuning behavior with high SMSR over the entire tuning range. As demonstrated below, these conditions can be met by depositing AR coatings on the laser facets and by optimizing the number of grating periods Ng per sampling period.
The position of the facets relative to the grating strongly influences the threshold gain of the cavity modes for DFB lasers [4] and for SGDBR lasers [6]. Unfortunately it is not possible to precisely control the position of facets during fabrication, since the facets are cleaved with a positioning accuracy of several micrometers. Feedback from the facets reduces the SMSR, tuning range, and causes unstable tuning behavior. Figure 8 shows the tuning behavior of a SGDBR-QCL device without AR coatings. The SMSR across the entire tuning range is relatively poor. Additionally, the spacing between the discrete tuning steps is not equal and does not always correspond to the reflectivity comb spacing. This can be caused by lasing on modes other than the modes favored by the sampled grating mirrors. Competing cavity modes can be either higher order lateral modes or Fabry-Pérot modes. Higher order lateral modes can resonate in the laser cavity since the waveguide width (14 µm) is relatively large compared to the wavelength. Usually, higher order lateral modes exhibit higher waveguide losses since the mode overlaps less with the gain region compared to the fundamental mode. However, high facet reflectivity and spatial hole burning can facilitate lasing on higher order lateral modes. Similarly, Fabry-Pérot modes can exhibit lower losses and start lasing when the facet reflectivity is high. Deposition of AR coatings on both output facets can dramatically improve the situation as demonstrated in Fig. 8. For this comparison, two identical devices were cleaved from the same chip, and only one was AR-coated with a single layer of Al2O3 (thickness ~700 nm).
#236107 - $15.00 USD Received 12 Mar 2015; revised 27 May 2015; accepted 29 May 2015; published 5 Jun 2015 © 2015 OSA 15 Jun 2015 | Vol. 23, No. 12 | DOI:10.1364/OE.23.015734 | OPTICS EXPRESS 15742

Fig. 8. Comparison of the tuning behavior with and without AR coatings. Feedback from the facets reduces the SMSR, tuning range, and causes unstable tuning behavior. The coatings deposited on the tested devices consist of a single layer of Al2O3 (thickness ≈700 nm) that reduces the facet reflectivity from 28% to 0.9%. The number of grating periods of the tested device is Ng = 10.
Fig. 9. Tuning stability of AR-coated SGDBR-QCLs. The tuning behavior becomes more predictable with increasing number of grating periods Ng, since the adjacent mode loss margin Madj increases. If Madj is too low, then the mode jumps chaotically between SGDBR modes. Ng = 4 corresponds to an adjacent mode loss margin Madj = 0.18 and Ng = 10 corresponds to Madj = 0.31.
#236107 - $15.00 USD Received 12 Mar 2015; revised 27 May 2015; accepted 29 May 2015; published 5 Jun 2015 © 2015 OSA 15 Jun 2015 | Vol. 23, No. 12 | DOI:10.1364/OE.23.015734 | OPTICS EXPRESS 15743

However, the deposition of AR coatings alone does not necessarily guarantee stable tuning behavior. The residual facet reflectivity, spatial hole burning and the finite gain bandwidth available can still have a great influence on SMSR and mode stability. To guarantee stability we need to provide sufficient suppression of the undesired cavity modes.
We have experimentally extracted the minimum value of Madj, which results in predictable tuning behavior, by comparing the tuning behavior of different SGDBR mirror designs. Figure 9 shows a comparison of four different SGDBR-QCLs with increasing number of grating periods Ng per sampling period. All four devices are on the same chip and AR-coated with ≈700 nm Al2O3. The current in the back mirror section was increased in steps of 2 mA up to 200 mA, and a spectrum was taken each time. The emission peak is drawn with a black line, 10 dB SMSR and 20 dB SMSR are indicated with a green and red line, respectively. At low tuning currents (<100 mA), where the lasing mode is still close to the center of the tuning range, all lasers show similar tuning behavior. They show a wide current range (>15 mA) over which lasing occurs consistently at the same wavelength, and the SMSR is greater than 20 dB. However, at higher tuning currents (>100 mA) the tuning behavior becomes irregular for lasers with a small number of grating periods.
For each measured device, we calculated Madj using our transfer matrix model. The adjacent mode loss margin for the device with Ng = 4 is Madj = 0.18, which would be a good value for a typical telecom SGDBR laser. For a QCL, which suffers more strongly from spatial hole burning this value of Madj is not sufficient. The SMSR is less than 10 dB and the tuning becomes unpredictable, especially for tuning currents higher than 100 mA. Such a device was found to be inherently unstable as it was not possible to reproduce the same emission wavelength by applying the same driving conditions on timescales longer than a few minutes. Since all modes have a very similar threshold gain, slight variation of the driving currents or temperature distribution will cause a very different tuning behavior. In practice such a device is not useful.
As Madj increases with increasing Ng the tuning behavior becomes more predictable. The tuning range can increase as well, since modes at the edge of the tuning range require sufficient Madj to suppress the modes at the center tuning range. Modes at the center of the tuning range are more difficult to suppress, since they overlap with the center of the gain spectrum. The laser with Ng = 10, which corresponds to a loss margin Madj = 0.31, shows predictable tuning and good SMSR over the entire tuning range.
In practice it is advantageous to have a large current range over which the same emission wavelength can be reliably obtained. Such parameter windows correspond to the width of the red bars in Fig. 9. A wide continuous bar indicates that the laser will always emit at the desired wavelength even for small changes in the driving current. Another desirable feature is tuning by changing as few parameters as possible at the same time, which is crucial for a well controllable system. Our SGDBR-QCL with Ng = 10 was tuned by changing a single parameter. It showed good SMSR and very predictable tuning behavior with wide parameter windows. For laser spectroscopy this would be a very useful device.
The optical output power of SGDBR-QCLs mainly depends on the gain in the gain section and the absorption losses in the mirror sections. Increasing the output power is possible by applying a small current to the mirror sections or by pumping the gain section at higher currents. We measured a small increase of the output power when pumping the gain section harder, and a more significant increase when pumping the mirror sections with a small current pulse (Fig. 12). However, the SMSR can suffer at higher injection currents since facet feedback and spatial hole burning are increased. We observed a reduced SMSR for increased gain section pumping, but no degradation of the tuning stability and range (Fig. 13). The laser demonstrated stable emission on the desired wavelength even for small changes in the tuning or the driving current. Of course a combination of high gain section pumping and mirror section pumping can be implemented to achieve even higher output powers. To maintain high SMSR, the mirror sections can be redesigned (e.g. by increasing Ng) to further increase Madj.
#236107 - $15.00 USD Received 12 Mar 2015; revised 27 May 2015; accepted 29 May 2015; published 5 Jun 2015 © 2015 OSA 15 Jun 2015 | Vol. 23, No. 12 | DOI:10.1364/OE.23.015734 | OPTICS EXPRESS 15744

To demonstrate the feasibility of spectroscopy measurements based on SGDBR-QCLs, we performed a simple transmission spectroscopy measurement through a 400 µm thick sheet of Polyurethane and compared it to the transmission spectrum acquired using a standard FTIR spectrometer (Bruker Vertex 80v). The light from the SGDBR-QCL was passed through the sheet of Polyurethane and focused onto a Peltier-cooled MCT detector. The detector signal was sampled and averaged over 128 laser pulses using an oscilloscope. The SGDBR-QCL measured transmission spectrum shows excellent agreement with the control measurement performed with the FTIR spectrometer, as shown in Fig. 10. The deviation of the leftmost data point in Fig. 10 is related to a lower SMSR (≈10 dB) at this wavelength of the device used in this experiment, which underlines the importance of good SMSR for laser spectroscopy.
Fig. 10. Comparison of the transmission spectrum measured with a SGDBR-QCL and a standard FTIR spectrometer. The sample was a 400 µm thick sheet of Polyurethane.
5. Conclusion
We have investigated the stability and tuning behavior of SGDBR-QCLs. We have determined the minimum loss margin required to suppress undesired lasing modes and ensure stable tuning behavior. We used transfer matrix simulations to predict the design parameters which result in predictable tuning. We have quantified power fluctuations and drift of our devices by measuring the Allan deviation. To demonstrate the feasibility of sampled grating QCLs for spectroscopy we have built a simple transmission spectroscopy setup. Our results prove that sampled grating QCLs are suitable light sources for sensitive spectroscopy measurements.
6. Appendix
6.1 Driving schemes for SGDBR-QCLs
Fig. 11. Driving schemes for SGDBR-QCLs. (a) Simple tuning scheme: The gain section is pumped with short current pulses to provide gain. A small DC current is applied to one mirror section to heat it up via the Joule effect and tune the laser emission. (b) High power operation: A small pulse is overlaid on both mirror sections to reduce absorption losses. The pulse current remains low enough to prevent self lasing of the mirror section.
#236107 - $15.00 USD Received 12 Mar 2015; revised 27 May 2015; accepted 29 May 2015; published 5 Jun 2015 © 2015 OSA 15 Jun 2015 | Vol. 23, No. 12 | DOI:10.1364/OE.23.015734 | OPTICS EXPRESS 15745

6.2 Optical output power
To increase the output power, either the gain section can be pumped at higher injection currents or the mirror sections can be pumped to decrease losses.
Fig. 12. Optical output power and SMSR of a SGDBR-QCL. Pumping the gain section at an injection current of 750 mA and leaving the mirrors unpumped yields good SMSR over the entire tuning range (blue circles). Increasing the current injected into the gain section to 1000 mA ( = rollover current) results in slightly higher output power (green diamonds). In this case, the SMSR increases for back mirror tuning but decreases for front mirror tuning. When the gain section is pumped at a relatively low injection current (750 mA), but both mirror sections are pumped with a small current pulse (100 mA), the output power almost triples. The increase of the output power depends on the absorption of the unpumped section, which is mostly a function of the doping concentration in the active region and waveguide.
6.2 Tuning stability for increasing gain section current
Fig. 13. Tuning stability of the SGDBR-QCL with Ng = 10 for increasing gain section pumping. The optical output power increases as the gain section is pumped at higher currents, but the SMSR decreases. The peak power given in each panel was measured at no tuning current.
#236107 - $15.00 USD Received 12 Mar 2015; revised 27 May 2015; accepted 29 May 2015; published 5 Jun 2015 © 2015 OSA 15 Jun 2015 | Vol. 23, No. 12 | DOI:10.1364/OE.23.015734 | OPTICS EXPRESS 15746

6.3 Calculation of the Allan deviation:
To calculate the Allan deviation a time series of N subsequent measurements was acquired. The detector signal of each optical pulse was sampled with 3 ns time resolution. The pulse width was 100 ns. The bandwidth of the MCT photodetector was 100 MHz. One data point in the time series is acquired by integrating over the duration of one pulse. The entire dataset X is then normalized by its mean X (Eq. (3)). The data is normalized to detect relative changes of the integrated pulse power. This way the Allan deviation is proportional to an absorption measurement and thus the detectable concentration change.
1
1i ix X i NX
= = (3)
The time series x is then split into M subgroups of size k (also called “binsize”). The
average A of the subgroups is calculated by
( 1)1
1( )
k
s s k ll
A k xk − +
=
= (4)
where s is the subgroup number. The Allan deviation ( )A kσ is then calculated by
[ ]2
11
1( ) ( ) ( )
2
m
A s ss
k A k A km
σ +=
= − (5)
with
1m M= − (6)
Figure 14 illustrates the calculation of the Allan deviation.
Fig. 14. The time series x is split into subgroups of size k. As(k) is the average value of each subgroup. The Allan deviation is calculated from the series of averages As(k).
To generate the Allan plot, the Allan deviation Aσ is plotted versus the binsize k in a
double-logarithmic plot. For a constant sampling interval ∆t, the integration time τ is related to the binsize k by k tτ = . A detailed discussion of the Allan plot can be found in [12].
Acknowledgments
Support from the Naval Air Warfare Center Weapons Division under Contract No. N68936-13-C-0118 (Program Manager: Dr. K.K. Law) and the Department of Homeland Security SBIR program under Grant No. D12PC00460 is gratefully acknowledged. Device fabrication was performed at the Center for Nanoscale Systems (CNS) at Harvard University. Harvard-CNS is a member of the National Nanotechnology Infrastructure Network (NNIN).
#236107 - $15.00 USD Received 12 Mar 2015; revised 27 May 2015; accepted 29 May 2015; published 5 Jun 2015 © 2015 OSA 15 Jun 2015 | Vol. 23, No. 12 | DOI:10.1364/OE.23.015734 | OPTICS EXPRESS 15747