Embed Size (px)
Citation preview

116 TRANSPORTATION RESEARCH RECORD 1300
High-Traffic Chip-Seal Construction: The Tulsa Test Road
SCOTT SHULER
hip-seal coat are used ro extend pavement service life by reducing water and air infiltration and improving skid re istance. App.Ii.cation of chip seals is usually limited to low-traffic volume facilities because of unknown co r-effcctiveness, vehicle damage caused by stoue , inattention to proper principles, traffic disruption , and inappr priale u~ign I rocedures. The cau e f the problem that dis ourage use of chip-seal coats on high-trafficvolume pavements were investigated in thi re earch project such that wider use of thi p tentia.lly co t-effective construction process can developed. The first of four experimental field project designed to demon. trate the p tential use and effectivene s of chip-seal applications on high-traffic-volume a phalt concrete pavements is de ·cribed. The su cessful con ·truction of the first of these full-scale experiments and the several type. of chip-seal treatments placed are documented. Methods used for calibration of equipment, traffic control de ign, and con truction proce se es. ent ial r r uccessful application of chip seal. on high-traffic pavement are de cribed. In addition, a promisiug new version of a laboratory test is d scribed a am thod of predi ting adhesive qualities of chip- cal binder in advance of construction.
A full-scale test pavement was constructed by maintenance personnel of Division 8, Oklahoma Department of Transportation (DOT) from October 11 to 13, 1989 between 46th and 56th street on US-169, Mingo Valley Expressway, in Tulsa, Oklahoma. A schematic of the test road location is shown in Figure 1.
The experimental sections were placed in the north- and southbound lanes of US-169 starting at 56th street and proceeding south in the northbound lane on October 11. The work was completed by starting at 46th street and proceeding north in the smith hound lane. All work was performed from 9:00 a.m. to 4:30 p.m. each day.
Traffic on US-169 was measured by Oklahoma DOT at the rate of 37,300 average daily traffic (ADT) for four lanes. This volume is more than double the minimum criteria of 7 ,500 vehicles per day per direction on four lanes established as high traffic for this research project.
Weather three weeks before construction consisted of snow showers and cool to cold daily and nighttime temperatures. However, fair to warm temperatures were forecast for the week of October 10, and the decision to build the experiment was made becaus of the ' reali. tic'' condition , that is, placing a chip seal on a distressed asphalt pavem 11t immediately befor winter in an attempt to forego further deterioration and more costly repairs. Daytime temperatures during construction varied from 75°F to 90°F. Nighttime temperatures ranged from 45°F to 55°F.
The Asphalt Institute, Lexington, Ky. 40512-4052.
EQUIPMENT CALIBRATION
Spray Nozzles
Special spray nozzles were fabricated by the research team for use on the experimental test sections. Three sizes of nozzles were supplied for installation in the pressure distributor used on the project. They were standard Roscoe No. 2 nozzles and standard nozzles machined to provide 20 percent and 30 percent increase in volume. Machining was accomplished so that spray width remained equal for all nozzles. These nozzles were placed in the spray bar so that the higher volume was applied outside and between the wheelpaths. Machining was accomplished in Brownwood, Texas, with the help of the Texas State Department of Highways and Public Transportation (SDHPT). The Brownwood district provides nozzles of the type fabricated for this experiment to contractors during construction of chip seals and believes that this practice is largely responsible for the success of the chip-seal program in that part of Texas. Details regarding the fabrication of the special nozzles are discussed in a recent paper by Martin (1). Following is a summary of how the nozzles were fabricated for this study.
A set of Roscoe No. 2 nozzles was purchased. The nozzles were grouped according to spray width and checked for volume output using the apparatus shown in Figure 2. Ten nozzles from the same spray width group were placed in the apparatus and volume output measured and averaged. A single nozzle was selected closest to the average volume output of the group of 10 nozzles and used a~ a 1de1ern.:e nuzzle. It was desired to create a set of 45 nozzles with known char-
TEST ROAD LOCATION
FIGURE 1 Area map of Tulsa test road.

Shuler
Water
Pressure Gauge
1-----Spray Width ___ __,
FIGURE 2 Spray nozzle calibration apparatus.
I 12"
I
acteristics to produce a potential spraying capability of 15 ft . Each of 45 nozzles with the same spray width were then compared with the re£ rence nozzle for volume output. Any nozzle deviating more than 10 percent from the average volume of the 45 nozzles was discarded. After the set of 45 nozzles with equal spray volume was obtained , 25 of the nozzles were selected for volume modification. These modified nozzles were placed in the spray bar for use out ide the wheelpath areas.
Nozzle modifica tion must be done so that an increase in spray volume occurs without a change in spray wid th. This is done by cutting the v-shaped groove in the nozzle deeper. This process must be done by trial-and-error at first until the amount of cutting can be related to the change in volume output of the nozzle .
The volume output of water was compared for each nozzle in the manner described above to verify that the machined nozzles produced 20 and 30 percent more output than the standard nozzles. Results of this laboratory evaluation were used to determine which nozzles provided accurate enough volume output for use in field tests . Results of the analysis are shown in Figure 3.
Uniformity of spray width was measured for each nozzle. This information is important so that difficulties such as "streaking," "roping ," or "drilling" during spray application
40
35
30
25
T l:J D
20
~ 0
cf15
> 10
5
0
-5
-10
. ~ ... -.......
n
2s J_ 0
- ~ _L_ O" . ..lJ _a,.., o_ u
"'"' uo .... - ..,,.. 0- 2s -..,
-
117
are reduced . Also, the spray width obtained during calibration can be used to determine correct spray bar height in the field. Spray bar height should be adjusted to produce a minimum of three overlaps from adjacent nozzles.
The equation for determining spray bar height based on laboratory calibration is as follows :
H. = qCN/W cos 6
.vhere
Hq = spray bar height for q overlaps (in.), C = nozzle calibration height (in .), N = nozzle spacing in distributor spray bar (in .), W = spray width during calibration (in.) , and 0 = nozzle angle in distributor spray bar.
This relationship has been used to generate a convenient graph for checking spray bar height given variou calibration spray widths, desired overlap , and two nozzle angle as h wn in Figure 4.
The calibration procedure used to derive the relationship for spray bar height and to generate Figure 6 is based on laboratory calibration using water as the spray medium. Water should be less viscous than asphalt materials used in chip-seal construction. This may affect volumetric output of the nozzles but has little , if any, effect on spray width .
The nozzles were positioned in the spray bar of the pressure distributor so that the 20- and 30-percent oversize nozzles were located in areas outside the wheelpaths of the pavement lane to be sprayed. Distribution of traffic across a typical twolane pavement was measured, and these data were used to determine positioning of the special oversize nozzles in the spray bar. The distribution of traffic and the corresponding nozzle po itions are shown in Figure 5.
The ·pray bar was positioned at a height to produce three overlaps of the spray pattern, as shown in Figure 5. Because of the overlapping paltern a transition between the 20- and 30-percent oversize and standard nozzles occurs in conjunction with the transition of traffic within the lane.
~
D 0
T D D D D
l D '-\] D n D
Q:ii::P ~o 0
[
~ uo o_,_o
~
D
0 5 10 15 20 25 30 35 40 45 50 55 60 65 70
Nozzle No.
FIGURE 3 Variation in water volume from nozzles.

118 TRA NSPORTATION RESEA RCH R ECORD 1300
20
20 25
Calibration Fan Width, In 30
FIGURE 4 Distributor spray bar height determination.
Distribution of Traffic, % (after J . Hall)
1.
12 11 10 9 8 7 6 5 4 3 2
w c: ., E
~ a..
0.5
0
6 x 30% 9xstd 6x20% 9xstd 5 x 30%
SPRAY BAR NOZZLE CONFIGURATION
FIGURE 5 Spray bar nozzle position in full-scale field test (data from personal communication with J. Hall).
Pressure Distributor Output
The pressure distributor was calibrated before construction to determine volumetric output of asphalt from each of the spray bar nozzles. Nozzles were selected for use in the distributors based on volumetric accuracy as discussed earlier. Determination of asphalt volume output from each spray nozzle for each pressure distributor was determined as follows : sample containers were placed under each spray nozzle to collect asphalt during discharge from the spray bar; asphalt was sprayed into the containers, and each was weighed. Results of this testing are shown in Figure 6.
According to District 23 Texas Highway Department personnel, variation in volume of 10 percent from the target volume desired for each nozzle group is satisfactory to achieve desired results. Results of testing shown in Figure 6 indicate this variation was exceeded for two nozzles on the left and one nozzle on the right side of the bar. However, it was felt
that on heating the bar during spray operations these nozzles would be within the tolerances suggested . Notice the trend to lower volume output in the nozzles located at the edges of the bar.
Aggregate Spreader Adjustment
Two weeks before construction of the test sections the aggregate spreader was inspected and adjusted for lateral spread uniformity . This operation consisted of accompanying the Division 8 maintenance personnel during chip-seal construction of SH127 and observing the appearance of the chips after spreading. Adjustments were made to gate openings on the spreader until a uniform appearance was achieved laterally across the pavement. After construction was completed at this location and ur.1iform spread had been accomplished, the spreader was parked until it was needed for construction of the test sections .
EXPERIMENTAL TREATMENTS
Independent variables to be evaluated in the full-scale experiment included aggregate type, gradation, treatment type (whether single or double application of aggregate) , and traffic control. Each was varied in accordance with the following outline:
• Aggregate: natural limestone and synthetic expanded shale; • Gradation : 5/s-in . and %-in. nominal; • Treatment types:
-First course natural 5ls in. and second course synthetic % in.,
-Double course natural 3/s in . over 5/s in ., -Sandwich natural % in. over 5/s in., -Single course natural 5/s in ., - Single course synthetic 5/s in., and -Double course synthetic 3/s in. over % in.; and
•Traffic control : pilot car at 15 mph for 1 hr and at 25 mph for 1 hr.

Shuler
40
30%0ver
'l!o 1-------111 "C c
~ 90 2 -8 c !o GI E Q
';!. 0 I
119
Standard Size 20%0ver Standard Size 30%0ver
-10 '---------------------------~
Bar Position (from left to right at rear)
FIGURE 6 Asphalt output from pressure distributor.
The natural limestone was a hard, durable mineral aggregate that is commonly used by Oklahoma DOT for chip-seal operations. The synthetic lightweight expanded shale is locally produced and had never been used by Oklahoma officials for this type construction before. It was desired to experiment with the lightweight aggregate in hopes of reducing the potential for vehicular damage.
The single course applications were both constructed using the larger 5/s-in. aggregate. The larger aggregate has the ability to produce a better seal because of the increased quantity of binder required to hold the aggregate. Also, larger aggregate results in more margin for error in the field because of the increased binder quantity required. However, it was unknown whether the larger aggregate could be retained by the asphalt binder under the high traffic conditions, potential snowplow operations and metal tire studs in the winter.
Single and double application treatments were designed and constructed as conventional multiple chip seals with the exception of the "sandwich seal." The sandwich seal was constructed as follows:
1. The surface was swept clean of dust and debris. 2. 5/s-in. aggregate was placed at approximately 80 percent
of the single course application rate; aggregate was placed on dry pavement in loose condition.
3. Asphalt emulsion was applied to the loose aggregate at approximately 90 percent of the design rate for conventional double-application seal.
4. %-in. aggregate was spread over coated first course stone at the design application rate for single course treatment.
5. Conventional rolling by pneumatic equipment was performed when the surface could accept construction traffic.
6. A pilot car was used to control traffic. 7. The section was opened to traffic.
This procedure was developed on the basis of experience gained by the author in constructing similar treatments with the help of the California Department of Highways near Susanville, the New Mexico Department of Highways north of Albuquerque, and through discussion with others (personal
communication with Gayle King and Marvin Exline of Elf Asphalt) .
Pilot cars were operated to guide traffic over the completed seals immediately after final rolling was complete. It was felt that slow-moving vehicular traffic would benefit the new surface by kneading the aggregate together. The optimum speeds to operate the pilot cars were selected on the basis of past experience with motorist patience (lower speed, 15 mph) and on potential for damage to the new chip seal (higher speed, 25 mph) .
MATERIALS
Aggregates
Two types and size gradations of aggregates were used in the test sections. They consisted of a natural crushed stone and a synthetic lightweight aggregate produced by Chandler Materials of Tulsa . Both types of aggregate were produced to meet the Oklahoma DOT gradation requirements for No. 2 and No. 3 chip-seal aggregates as presented in Table 1.
Additional physical tests of the aggregate chips included unit weight, specific gravity, board test (spread rate), flakiness index, and L.A. abrasion.
Results from the other four laboratory tests completed for each aggregate source are presented in Table 2.
These tests were conducted as input information for two chip seal design procedures. The estimated theoretical quantities calculated from the designs were then used for comparison to actual quantities used in the field .
Asphalt Emulsion
The emulsion was a cationic type designated CRS-2S modified using a styrene block copolymer and special processing. Properties of the emulsion are as shown in Table 3.
120 TRANSPORTATION RESEARCH RECORD 1300
TABLE 1 AGGREGATE GRADINGS 3/8" (No. 2) 5/8': (No. JJ
Sieve Natural Synthetic Spec Natural Synthetic Spec Size 5/8" 100 JOO 100 1/2" 100 JOO 100 86 86 90-100 3/8" 95 95 90-100 40 40 40-75 1/4" 31 31 2 2 0-15 4 2 2 0-2.'i 1 1 8 2 2 0-5 1 1 0-5 80 2 2 1 1 200 1.6 1.6 0-2 1 1 0-2
TABLE 2 PHYSICAL PROPERTIES OF AGGREGATE CHIPS Test
Bulk Specific Gravity, ASTM C127 Unit Weight, Rodded, pcf, ASTM C29 Board Test, psy Flakiness Index, Ref 1, 2 L.A. Abrasion, loss%
TABLE 3 PHYSICAL PROPERTIES OF ASPHALT EMULSION
Test Test Result Viscosity, SFS, 122F 379 Dcmulslbillty, % 68.2 Sieve, % 0.01 Residue Penetration, 77F, dmm 137 Softening Point, F 116 Viscosity, 140F, P 1437 Ductility, 4C 25 Residue,% 69
CHIP-SEAL DESIGNS
3/8" Natural 2.559 93.0 21.2 30.3 16
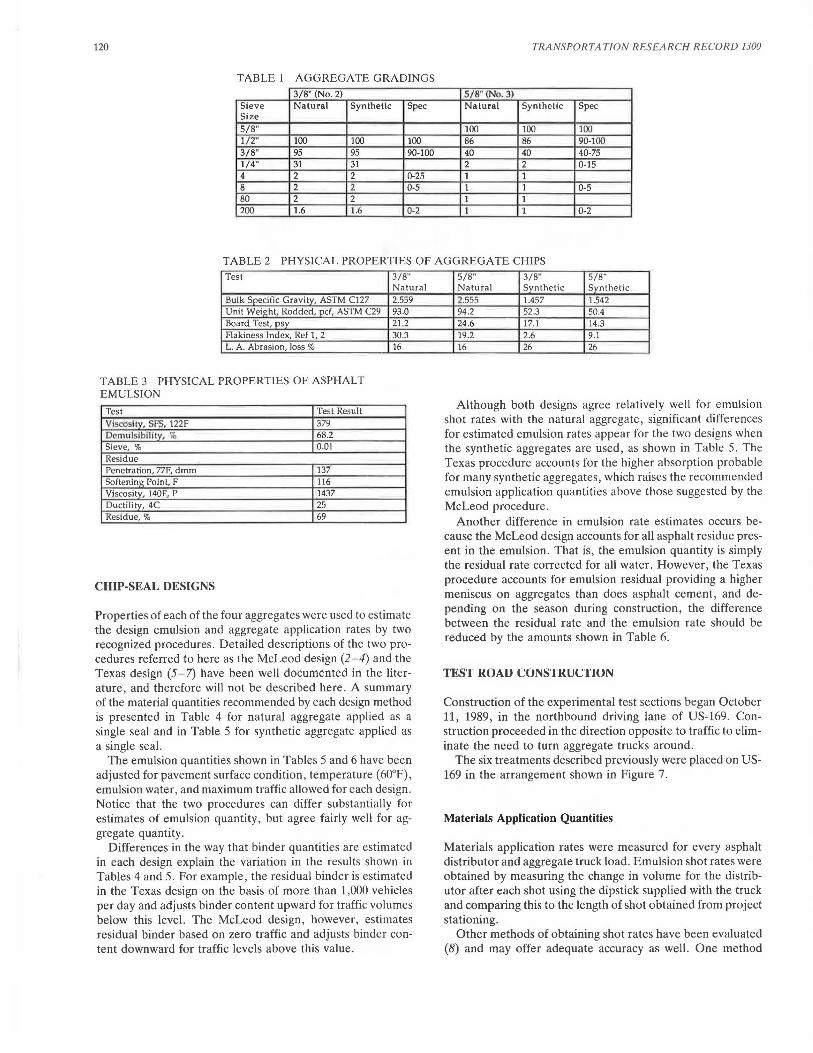
Properties of each of the four aggregates were used to estimate the design emulsion and aggregate application rates by two recognized procedures. Detailed descriptions of the two procedures referred to here as the McLeod design (2-4) and the Texas design (5- 7) have been well documented in the literature, and therefore will not be described here. A summary of the material quantities recommended by each design method is presented in Table 4 for natural aggregate applied as a single seal and in Table 5 for synthetic aggregate applied as a single seal.
The emulsion quantities shown in Tables 5 and 6 have been adjusted for pavement surface condition, temperature (60°F), emulsion water, and maximum traffic allowed for each design. Notice that the two procedures can differ substantially for estimates of emulsion quantity, but agree fairly well for aggregate quantity.
Differences in the way that binder quantities are estimated in each design explain the variation in the results shown in Tables 4 and 5. For example, the residual binder is estimated in the Texas design on the basis of more than 1,000 vehicles per day and adjusts binder content upward for traffic volumes below this level. The McLeod design, however, estimates residual binder based on zero traffic and adjusts binder content downward for traffic levels above this value.
5/8" 318" 5/8" Natural Svnthetic Svnthetic 2.555 1.457 J.542 94.2 52.3 50.4 24.6 17.l 14.3 19.2 2.6 9.1 16 26 26
Although both designs agree relatively well for emulsion shot rates with the natural aggregate, significant differences for estimated emulsion rates appear for the two designs when the synthetic aggregates are used, as shown in Table 5. The Texas procedure accounts for the higher absorption probable for many synthetic aggregates, which raises the recommended emulsion application quantities above those suggested by the McLeod procedure.
Another difference in emulsion rate estimates occurs because the McLeod design accounts for all asphalt residue present in the emulsion. That is, the emulsion quantity is simply the residual rate corrected for all water. However, the Texas procedure accounts for emulsion residual providing a higher meniscus on aggregates than does asphalt cement, and depending on the season during construction, the difference between the residual rate and the emulsion rate should be reduced by the amounts shown in Table 6.
TEST ROAU CONSTKUC'l'lUN
Construction of the experimental test sections began October 11, 1989, in the northbound driving lane of US-169. Construction proceeded in the direction opposite to traffic to eliminate the need to turn aggregate trucks around.
The six treatments described previously were placed on US-169 in the arrangement shown in Figure 7.
Materials Application Quantities
Materials application rates were measured for every asphalt distributor and aggregate truck load. Emulsion shot rates were obtained by measuring the change in volume for the distributor after each shot using the dipstick supplied with the truck and comparing this to the length of shot obtained from project stationing.
Other methods of obtaining shot rates have been evaluated (8) and may offer adequate accuracy as well. One method
Shuler 121
TABLE 4 NATURAL AGGREGATE SINGLE CHIP-SEAL DESIGNS :W" Surt<ni> Sliaht Flush Normal Sliohl Ravel
Desion Method> Texas Meleo< Texas "1eleoc Texas MeLeoc
Emulsion Rate Inside Wheelpalhs, gsy = 0.25 0.16 0.29 0.22 0.33 0.27
Aggregate Spread Rale, lbs/sq yd 21 .2 17.1 21 .2 17.1 21 .2 17.1
516" Surt<ni> Slioht Flush Normal Slloht Ravel Desion Method> Tex.as McLeoc Texas Meleoc Texas Meleo<
Emulsion Rate Inside Wheelpaths, gsy = 0.29 0.30 0.33 0.34 0.37 0.39
Aggregate Spread Rate, lbs/sq yd 24.6 25.6 24.6 25.6 24.6 25 ,6
TABLE 5 SYNTHETIC AGGREGATE SINGLE CHIP-SEAL DESIGNS
316" 9.Jrflal> DeslQn Method>
Emulsion Rate Inside Wheelpaths, gsy =
Aggregate Spread Rate, lbs/sq yd
516" Surfoce> Desiqn Method>
Emulsion Rate Inside Wheelpaths, gsy =
Aggregate Spread Rate, lbs/sq yd
TABLE 6 CORRECTION FOR RESIDUAL ASPHALT Season of Construction Emulsion vs Residual
Reduction Factor' Spring 0.60 Summer 0.55 Autumn 0.70 Winter 0.90
• This reduction is not a straight multiplier but rather a percentage of the difference between emulsion rate and residual asphalt. For example, the cooler the weather, the application will be closer to the total residual available in the emulsion.
involves placing preweighed geotextile fabric pads on the pavement in front of the asphalt distributor, allowing the asphalt distributor to spray the pads, and weighing the pads after asphalt application to determine asphalt spray rates. The method outlined by ASTM D2995 follows such a procedure.
Much difficulty has been documented in the measurement of asphalt spray quantities with fabric pads including relatively small sample sizes. Therefore, such techniques were not evaluated.
Volumetric measurements of distributor volume can also be performed using the external gauge supplied with most distributors . However, inaccurate determinations of volume can occur when the external gauge is used because of broken or improperly functioning gauges or foaming in asphalt emulsions. Therefore, this equipment should only be used as an indication of distributor volume and not for determination of accurate asphalt application quantities.
Aggregate trucks were weighed after loading, and the distance required to place a given truck load was obtained from project station distances.
Sllahl Flush Noimaf SJiaht Ravel Texas McLeoc Texas MeLeoc Texas Mcleoc
0.54 0.27 0.56 0.32 0.62 0.36
17.1 14.0 17.1 14.0 17.1 14 .0
Sliaht Flush Normal Sllahl Ravel Texas MeLeoc Texas IKeLeoc Texas MeLeoc
0.51 0.30 0.55 0.35 0.59 0.39
14.3 16.3 14.3 18.3 14.3 18.3
Other methods of measuring aggregate spread rates have also been documented (8). The technique often involves placement of sample containers in front of the aggregate spreader to collect chips as they are spread. These containers must be designed to fit under the spreader equipment as it passes so that a representative quantity of aggregate can be collected. The contents of the boxes are weighed and the aggregate quantity obtained. Although no apparent difficulty has been reported with estimating aggregate spread quantities by this procedure, it can be cumbersome if large, representative samples are obtained. Therefore, this technique was not used in lieu of the method of weighing each truck and measuring aggregate spread length .
Materials Application Rates: Actual Versus Design
The actual application rates compared with application rates determined from both the Texas and McLeod design methods are shown in Table 7. The shaded area of the table is provided as an indication of the design that most closely matches the application quantities judged to be appropriate in the field.
Design rates presented in Table 7 were obtained from Tables 4 and 5. Substrate pavement surface condition was considered to be "normal" for both designs . Second course asphalt emulsion application rates were determined by considering the substrate pavement surface condition (first chip application) to be that of a slightly raveled surface, that is, having moderate surface "hunger." First and second course emulsion rates for double application treatments do not appear to match when Tables 4 and 5 are compared with Table 7. This is because,

122
us 169 SB
No. 3 Natural Single
4
---
No. 2 I No. 3 Natural Sandwich Double
3 0+00
Pilot Car at 25 mph
No. 3 Synthetic Single
5
Pilot Car at 15 mph
No. 2 / No. 3 Natural Double
2 15+60
FIGURE 7 Placement of experimental treatments on Tulsa test road.
TRANSPORTATION RESEARCH RECORD 1300
55+86
No. 2 /No. 3 Synthetic Double
6
No. 2 /No. 3 us 169 Synthetic.Natural NB
Double 1
35+00 52+65
in accordance with the design procedures , the application of emulsion for the first aggregate course is decreased by an amount that is compensated for during application of the second aggregate course. Note that both design methods estimate the appropriate actual aggregate application relatively well. Although there was agreement between the two pro-
cedures for emulsion quant1t1es for the natural aggregate, significant discrepancies occurred for the synthetic aggregate. The Texas design allows for higher embedment when lightweight synthetic aggn:gale is used, whe1eas the McLeod prucedure does not discriminate between synthetic lightweight and natural aggregate emulsion rates.
TABLE 7 COMPARISON OF DESIGN AND ACTUAL MATERIALS RATES ON TULSA TEST ROAD
Emulsion Texas Mcleod
Section Descri tion Desi n Desi n Actual Actual
Double· 3/8" 0.62 0.36 0.42 17.1 14.0 14.4 1 Nal/Svrilh 518" 0.33 0.34 0.42 24 .6 25.6 26.2
Double 3/8" 0.41 0.34 0.24 21 .2 1 7 .1 18 0 2 Natural 5/8" 0.25 0.23 0.36 24 .6 25.6 26.5
Double .. 3/8" 21.2 20.0 21.1 3 Natural 5/8" 0.56 0.57 0.48 20.0 20 .0 18.9
Single 4 Natural 5/8" 0.33 0.34 0.48 24.6 25.6 29 .1
Single 5 Svnthetic 5/8" 0 .55 0.35 0.50 14.3 18.3 23.7".
Double 3/8" 0.76 0.45 0.56 17.1 14 . 0 14 .5 6 Svnthetic 518" 0.41 0.26 0.51 14.3 18.3 19 .6
' Single 5/8" natural !ailed during over night trafficiking. Second course of 3/8" synthetic applied next day.
" "Sandwich Seal". Design rates are from past experience of author, and are not related to Texas or Mcleod procedures. Emulsion rate is based on 90% of Texas double seal rate .
Aggregate rate for 3/8" second course based on Texas 3/8" rate. Aggregate rate for 5/8" first course based on 80% ol Texas 5/8" rate.
"· Too high. Adjusted on first course of section 6.

Shuler
Field Adjustments to Planned Experiment
Test Section 1
Section 1 was originally planned as a single treatment of %in. natural stone. The design emulsion shot rate for this section as shown in Tables 3 and 6 was 0.33 gal/yd2 for the Texas procedure and 0.34 gal/yd2 for the McLeod procedure. These shot rates were considered too low by the field personnel responsible for construction, and the actual shot rate was increased to 0.42 gal/yd2 • However, this increased rate was still not adequate for the conditions, and after approximately 16 hr of traffic the surface began to lose a significant amount of aggregate.
To help prevent further raveling of the surface a second application of smaller %-in. synthetic chips was placed over the remaining %-in. chip seal. The emulsion application rate used in the second application was decreased (0.42 gal/yd2)
from that estimated by the Texas procedure (0.62 gal/yd2) and
increased slightly from that suggested by the McLeod procedure (0.36 gal/yd2
).
Test Section 3
The sandwich seal first course aggregate application rate was too high for several hundred feet at the beginning of the section. The excess aggregate prevents asphalt emulsion from penetrating to the substrate pavement, which causes a potential for disbanding of the new chip seal from the original surface. Disbanding occurred in several isolated locations, which had to be resealed.
The setting time for the emulsion in this section was significantly longer than that required for other double application seals in the experiment. This was evidently caused by the high quantity of emulsion sprayed at one time for the sandwich seal. Although the other double application seals also had high binder contents, the emulsion was sprayed in two stages, allowing the first application to set before the second application was applied.
Traffic Control
Pilot cars were used to control traffic speed on the project . Some difficulty was experienced initially in getting traffic to follow the pilot cars onto the new chip seal surface. Because the passing lane had not been sealed, drivers had a tendency to drive on the smoother asphalt concrete surface and avoid the new chip seal. However, a plan was developed to force traffic onto the chip seal surface so that an evaluation of the beneficial effects could be judged. Speed of the pilot cars was reduced to 15 mph for 45 minutes , but traffic would not follow at this speed. Drivers passed the pilot cars on the shoulders and the median. The pilot car speed was subsequently increased to 25 mph. This speed solved the problem of impatience on the part of the motorists and did not have a detrimental effect on the chip-seal surface. It is believed the slow-moving traffic had a beneficial effect in helping embed chips better than the pneumatic rollers.
123
Scheduling completion of construction on the chip seal during the lowest volume traffic period (before the 4:00 p.m. rush hour) is believed to have contributed to the lack of complaints and vehicular damage documented.
Return of Traffic to Facility
The construction sequence required approximately 2 hr before traffic could return to the new chip seal behind the pilot vehicles. Pilot vehicle trafficking was conducted for 45 min for the 15 mph sections and 1 hr for the 25 mph sections. Traffic was returned to the pavement without pilot vehicles after these periods. Some sweeping was required the day after construction to remove loose aggregate dislodged by traffic.
Complaints and Damage Claims
The highway department received six telephone calls the day after construction of the first three seals. Each of the calls was regarding the noise generated by the seals and the change in texture of the pavement surface at the transition between the sealed surface and the smoother underlying asphalt concrete.
No calls or claims of vehicular damage were received .
SUMMARY AND CONCLUSIONS
1. An experimental chip seal was constructed on a 4-lane divided pavement with 38,000 ADT using 2 types and gradations of aggregate resulting in 6 experimental test sections approximately 1 mi long. No vehicular damage claims were received by the agency constructing the experimental treatments.
2. Two chip seal designs were used before construction to estimate the actual application rates of emulsion and aggregate. Comparison of the design material quantities with actual rates considered appropriate for the conditions indicates that one method was better at estimating aggregate spread quantities and neither design adequately estimated proper quantities for asphalt emulsion application rate. Both design methods estimated approximately the same emulsion rates for the natural aggregate, but disagreement occurred when emulsion rates for the synthetic aggregate were estimated.
3. Variable volume nozzles were fabricated for use during construction. Spray volumes were adjusted so that approximately 30 percent more binder was placed outside the wheelpaths and approximately 20 percent more binder was sprayed between the wheelpaths.
4. Traffic control using pilot vehicles traveling at 25 mph to keep traffic on the new chip-seal surface is considered mandatory for 1 hr following final rolling. This trafficking appears to benefit the early performance of the seal by improving initial embedment and voids reduction. Operation of the pilot vehicles at 15 mph was too slow and resulted in motorists attempting to pass the pilot vehicles. Scheduling construction to begin after and end before rush hour is believed to have contributed to the overall cooperative nature of motorists.
124
5. Adhesion testing was done using a modified Vialit procedure. Results of the testing indicate that adhesive strength of emulsions is dependent on setting rate and that setting rate depends largely on ambient temperature and wind conditions, as might be expected. Therefore, use of the Vialit test for field evaluations may be suspect unless ambient conditions can be controlled.
6. A modification to the Vialit test using glass marbles in place of mineral aggregates appears promising for laboratory evaluation of adhesive properties of emulsion chip-seal binders. Repeatability of the test is greatly improved compared with results obtained using mineral aggregates. Because the test does not use actual project aggregates, however, utility for estimating binder adhesive qualities for specific aggregates is low. However, it would be possible to compare results of new binders with a known standard for relative evaluations.
7. Correlation of the field Via lit test and the modified laboratory version appears promising. Comparison of results for an HFE-lOOS used on a full-scale experiment in New Mexico indicates relatively good agreement between a new accelerated laboratory version of the Vialit test and results obtained during actual field evaluations.
ACKNOWLEDGMENTS
The research described in this paper was sponsored by NCHRP under Project 14-8, Chip Seal Coats for High-Traffic-Volume Asphalt Concrete Pavements. The author gratefully acknowledges NCHRP for this sponsorship and the Oklahoma Department of Transportation , particularly Frank Chiles, Division 8 chief engineer, and Edgar Kellog, maintenance
TRANSPORTATION RESEARCH RECORD 1300
engineer , for providing significant cooperation and contribution in planning and construction of the test pavement sections .
REFERENCES
1. R. S. Ma rtin , Jr. hip Seal Prac tice. Proc. , Twe11ty-Si.ttlt Pa 11i11R and Transportation Co11fere11ce, Department of ivil Engineering, Unive rsity of New Mexico , Albuquerque, Jan. 1989.
2. N. W. McLeod . Seal Coa t Design. Proceedings, A sor.intio11 of A phalt Paving Technologists, t. Paul. Minn ., Vol. 38, Feb. 1969.
3. A Basic Asphalt Emulsion Ma1111al, Volume J, U11dersta11di11g and Using Emulsions. FHWA-IP-79- l. 111e A phalt In ·1itu 1e , ollege Park , Md .. ; Asphalt Emulsion Manufactu rers Associa tion, Washington, D.C., Jan. 1979.
4. F . M. Hanson . Bituminous Surface Treatments on Rural Highways . Proc. , New Zealand Society of Civil Engineers, Vol. 21 , 1934- 1935.
5. F . J . Benson . Seal Coats and Surface Treatments. Proc., 44th Purdue Road School, Purdue University, West Lafayette, Ind., 1950.
6. J . P. Kearby . Tests and Theories on Penetration Surfaces . HRB Proc., Vol 32 , 1953, pp. 232-237.
7. J. A . Epps, B. M. Gallaway, and C. H. Hughes . Field Manual on Design and Construction of Seal Coats. Research Report 214-25 . Texas TranspOrt.ation In titutc, Austin . Tex., Ju ly J981.
8. T. . Shuler. Performance of Polymer Modified hi1> eals . University of New Me..'< ico Research Report QC 9/ 122. New Mexico Highway and Transportation Department HPR 87-04, Santa Fe, Aug. 1989.
Publication of this paper sponsored by Committee on Characteristics of Bituminous-Aggregate Combinations To Meet Surface Require· ments.