Embed Size (px)
Citation preview
Corresponding author: Adama Zongo Environmental Sciences and Rural Development Institute (ESRDI), University of Dedougou, BP 176, Burkina Faso.
Copyright © 2021 Author(s) retain the copyright of this article. This article is published under the terms of the Creative Commons Attribution Liscense 4.0.
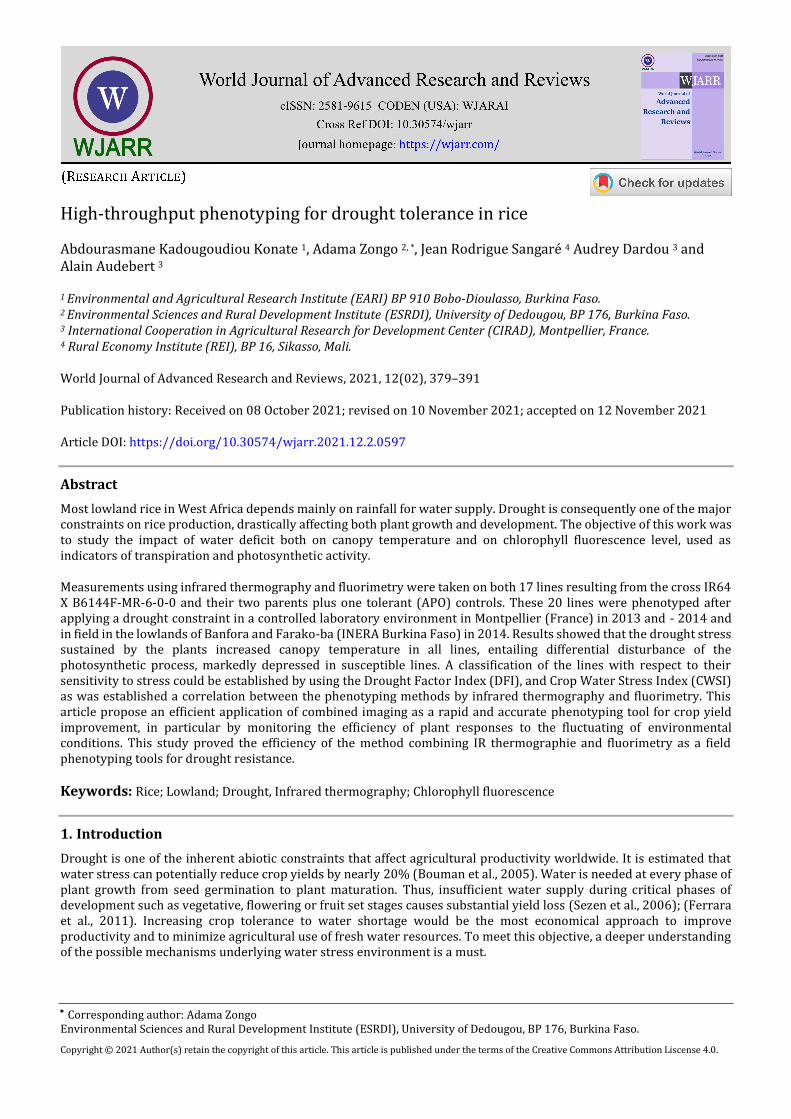
High-throughput phenotyping for drought tolerance in rice
Abdourasmane Kadougoudiou Konate 1, Adama Zongo 2, *, Jean Rodrigue Sangaré 4 Audrey Dardou 3 and Alain Audebert 3
1 Environmental and Agricultural Research Institute (EARI) BP 910 Bobo-Dioulasso, Burkina Faso. 2 Environmental Sciences and Rural Development Institute (ESRDI), University of Dedougou, BP 176, Burkina Faso. 3 International Cooperation in Agricultural Research for Development Center (CIRAD), Montpellier, France. 4 Rural Economy Institute (REI), BP 16, Sikasso, Mali.
World Journal of Advanced Research and Reviews, 2021, 12(02), 379–391
Publication history: Received on 08 October 2021; revised on 10 November 2021; accepted on 12 November 2021
Article DOI: https://doi.org/10.30574/wjarr.2021.12.2.0597
Abstract
Most lowland rice in West Africa depends mainly on rainfall for water supply. Drought is consequently one of the major constraints on rice production, drastically affecting both plant growth and development. The objective of this work was to study the impact of water deficit both on canopy temperature and on chlorophyll fluorescence level, used as indicators of transpiration and photosynthetic activity.
Measurements using infrared thermography and fluorimetry were taken on both 17 lines resulting from the cross IR64 X B6144F-MR-6-0-0 and their two parents plus one tolerant (APO) controls. These 20 lines were phenotyped after applying a drought constraint in a controlled laboratory environment in Montpellier (France) in 2013 and - 2014 and in field in the lowlands of Banfora and Farako-ba (INERA Burkina Faso) in 2014. Results showed that the drought stress sustained by the plants increased canopy temperature in all lines, entailing differential disturbance of the photosynthetic process, markedly depressed in susceptible lines. A classification of the lines with respect to their sensitivity to stress could be established by using the Drought Factor Index (DFI), and Crop Water Stress Index (CWSI) as was established a correlation between the phenotyping methods by infrared thermography and fluorimetry. This article propose an efficient application of combined imaging as a rapid and accurate phenotyping tool for crop yield improvement, in particular by monitoring the efficiency of plant responses to the fluctuating of environmental conditions. This study proved the efficiency of the method combining IR thermographie and fluorimetry as a field phenotyping tools for drought resistance.
Keywords: Rice; Lowland; Drought, Infrared thermography; Chlorophyll fluorescence
1. Introduction
Drought is one of the inherent abiotic constraints that affect agricultural productivity worldwide. It is estimated that water stress can potentially reduce crop yields by nearly 20% (Bouman et al., 2005). Water is needed at every phase of plant growth from seed germination to plant maturation. Thus, insufficient water supply during critical phases of development such as vegetative, flowering or fruit set stages causes substantial yield loss (Sezen et al., 2006); (Ferrara et al., 2011). Increasing crop tolerance to water shortage would be the most economical approach to improve productivity and to minimize agricultural use of fresh water resources. To meet this objective, a deeper understanding of the possible mechanisms underlying water stress environment is a must.
World Journal of Advanced Research and Reviews, 2021, 12(02), 379–391
380
Breeding strategies for improved drought tolerance should benefit from precise characterization of the target population of environments (TPE). This phenotyping approach also permitted us to identify genotypes able to maintain adequate yield under drought. The integration of phenotypic data with molecular data (generated by AfricaRice with 484 SNP markers) will constitute a significant advance for the identification of genomic regions associated to this trait. If these results are confirmed, they will allow the development of efficient marker assisted recurrent selection (MARS) approaches for drought tolerance breeding in rice. It is essential to develop fast screening methodologies for the development of drought tolerant varieties. Drought affects several variables of plant development, such as leaf temperature (Wiegand et al., 1983; Luquet et al., 2004) and photosynthesis (Idso et al., 1981; Moran et al., 1994; Moran, 2004) . Thus, crop water status monitoring is necessary for the efficient management of irrigation water. Plant cover temperature is one of the most widely used biophysical parameters for measuring plant water status. (Monteith and Szeicz, 1962) highlighted the value of Thermal Infrared use to study the hydric state of plant covers. Idso et al. (1977) used for the first time the difference between canopy temperature (Tc) and air temperature (Ta) to characterize plant water status. Later, several studies were carried out on infrared thermography to characterize crop water status using leaf temperature, which led to the development of other water status indices (Idso et al., 1981; Jackson et al., 1981; Jackson, 1991; Yacouba et al., 1999). Canopy temperature has long been recognized as a plant water status indicator, and the crop water stress index (CWSI), obtained from canopy temperature corrected by VPD (vapor pressure deficit), has been used as a tool for remote assessment of plant water status with airborne high resolution thermal monitoring (Sezen et al., 2014). Indeed, CWSI is the most frequently used index to quantify crop water stress based on canopy surface temperature (Bo et al., 2014). Thanks to technical improvement, IR thermographic cameras are now available with the added advantage of capturing multiple thermal data in a single picture.
(Jackson et al., 1981) presented an empirical approach to quantify stress by determining “non-water-stressed baselines” for crops. They developed linear relationships for canopy–air temperature difference (Tc–Ta) versus Vapour Pressure Deficit VPD. Research has been conducted to evaluate the use of CWSI in irrigation scheduling for different crops in different environments (Erdem et al., 2010; Sezen et al., 2014) . However it was found that CWSI is less effective for applications carried out in wet climates (Luquet et al., 2004; Yuan et al., 2004), where variations in absolute temperature are very low (Jones, 2002). In addition the baselines used for its calculation according to the definition of (Idso et al., 1981) vary according to weather agro conditions and crop growth stage (Idso, 1982; Jones, 1999) . For thermometric radio measurements in the field, a viewing angle of 45° compared to the vertical is advised (Jackson, 1982).
A second experimental approach makes use of chlorophyll fluorescence which represents a very small fraction of the energy dissipated in the photosynthesis mechanism, but it is useful for providing information on the structure and the function of electron transport chains (Strasser and Strasser, 1995; Strasser et al., 2004). The measurement of fluorescence output variations according to light variations allowed evidencing water stress. In addition, fluorescence is mainly emitted by the antennas of the PSII (Krause and Weis, 1991) which are also involved in the regulations mechanisms for the thermic dissipation of excess energy (non-photochemical quenching) (Govindjee, 1995; Müller et al., 2001). The JIP-test (fast fluorescence kinetics test), suggested by (Strasser and Strasser, 1995) provides information on the fundamental biophysics properties of the photosynthetic conservation of energy and photosynthetic transport. Plant performance as assessed by the performance index (PI) resulting from the JIP-Test, is the result of a multi-parametric combination of three independent expressions, corresponding to the kinetics of the OJIP transitional stages. PI has correspondingly been used to estimate the vitality of plants under various environmental stresses, thus providing indices on plant physiological state (Susplugas et al., 2000; Van Heerden et al., 2004).
The Drought Factor Index (DFI) is derived from the index used by Strauss et al. (2006) in the identification of cold tolerance. DFI permits assessing, depending on stress duration, the level of PI reduction. DFI was previously used to screen barley genotypes for drought tolerant (Oukarroum, 2007).
Altogether, a large number of works have focused on the advantages and possibilities of high-throughput plant phenotyping approaches; thermography has been successfully used at laboratory scale to reveal stress situations that affect stomatal conductance (Jones, 2002), but extrapolation of this approach for field use is not straightforward, given the fluctuations in environmental conditions (Grant et al., 2007). Field application of chlorophyll fluorescence imaging also raises some challenges due to the predominantly high and varying light levels (Chaerle et al., 2002). Laboratory-based screening can overcome the fluctuating environmental factors inherent to field conditions, but field trials remain essential for phenotyping and in-field imaging solutions are presently being developed (Leinonen et al., 2006). To our knowledge, this is the first time that imaging approaches for water stress detection and quantification, especially those involving combinations of thermal and fluorescence techniques under different conditions (controlled vs field) and localities (Burkina Faso and CIRAD) are presented. Possible applications of combined imaging as a screening tool for the selection of drought tolerant rice varieties are discussed.
World Journal of Advanced Research and Reviews, 2021, 12(02), 379–391
381
2. Material and methods
2.1. Plant material
Seventeen rice lines from the indica cross IR64 X B6144F-MR-6-0-0 plus their two parents and a drought tolerant genotype (APO) were used in this study. Both parents and the Indica rice APO tolerant to drought were used as controls. To ensure the different treatments (stressed and unstressed) would be applied at the same physiological stage. All the 20 genotypes selected had similar days to 50% flowering (D50F) values ranging from 85 to 92.
2.2. Experimental treatments
The experiments were conducted for two years (2013 and 2014) in a greenhouse in CIRAD Montpellier, France (N: 43°645935 E: 3°869505), and in two experimental fields, one at Banfora (N: 10°63067 W: 004°77.846) the other at Farako-Ba (N: 11°050036 W 4°202488) in Burkina Faso (West Africa) in 2014. Crops were managed with optimal fertilizing and phytosanitary conditions. In each experiment, two different treatments were applied; watering restriction was maintained during two weeks at flowering stage and plants were then watered to reach substrate saturation with a 5-cm water blade in field condition and with regular water in pot condition.
2.2.1. Greenhouse experiments
Individual plants were grown in 2-liter pots containing either natural field soil. The experiment was arranged in a randomized complete- block design (RBCD) with two treatments (well-watered and drought-stressed) with four to five replications. Each genotype was represented by 200 plants. Water was supplied up to substrate saturation level.
2.2.2. Field experiments
The treatments were carried out in a completely randomized block design with four to five replications. Spacing range between plants and rows were each maintained at 20 cm.
2.2.3. Measurement of growth and flowering parameters
Agro-morphological data were collected at the appropriate growth stage following the Standard Evaluation System (SES) for rice (IRRI, 2002). Traits that were evaluated were number of tillers (Tillers), days to flowering (Flowering), plant height at maturity, 1000 grain weight (W.1000g), biomass and grain yield. Days to flowering value was recorded when 50% of the plants in the plot had started to flower (D50F). For number of tillers determination, twenty five hills were chosen at random per plot. Final plant height (Height) was measured as the distance from the ground to the panicle tip of five random plants in a plot at maturity. 1000 grain weight and grain yield were determined after each plot was harvested, and grains dried, threshed, cleaned, weighed and adjusted to 14 % moisture content. Grain yield data was only collected from trials conducted at Banfora and Farako-Ba.
2.2.4. Measurement of canopy temperature
Two weeks after drought stress initiation, canopy temperature was measured by infrared thermography using an Infrared Thermography R300 camera (Nippon Avionics Co.,Ltd, Japan). Measurements were recorded for both treatments (well-watered and drought-stressed) between 12:00 and 2:00 p.m. on each site. Simultaneously, measurements of ground moisture and meteorological data (air temperature and moisture) were also obtained on each site. The thermographic images obtained were analyzed using Infrared Analyzer NS9500 Standard software (NEC Avio Infrared technologies Co, Ltd; V. 2.0A; 2011).
Canopy temperature (Tc) and air temperature (Ta) were used to calculate the Crop Water Stress Index (CWSI) based on the vapor pressure deficit (VPD), according to the following equation (Idso et al., 1981):
CWSI =(Tc − Ta) − D2
D1 − D2
Where D1 is the maximum canopy and air temperature difference for a stressed crop (the maximum stressed baseline), and D2 the lower limit canopy and air temperature difference for a well-watered crop (the non-water-stressed baseline).
CWSI can be determined using a graphical approach (Fig. 1) starting from the following relation: CWSI(B) =𝐵𝐶
AC
World Journal of Advanced Research and Reviews, 2021, 12(02), 379–391
382
where point B is the difference between leaf and air temperatures at the moment of measuring, point A is the difference in maximum temperature between the leaf and the air (superior limit), and point C the minimum difference (inferior limit) for the specific Vapour Pressure Deficit (VPD) conditions in which temperature measuring was carried out for the leaf and the air (B). Therefore, the CWSI is determined by the relative distance between the lower line (B-C) that represents the conditions without stress, and the upper line (A-C) where there is no transpiration.
Its calculation relies on two base lines: the D1 (A) «maximum of stress» base line which represents the seedlings subjected to an extreme hydric deficit and the «unstressed » base line D2 (B, which represents the seedlings whose water supply is not limited (Fig1). The calculation of the base line calls upon the linear relation which exists between [Tc - Ta] (B) and VPD under optimal (or non-limiting) water supply conditions. Each lower base line (low stress) is calculated from the straight regression line of the VPD and Tc-Ta control treatments. This approach permits enclosing the maximum of points inside the trapeze formed by the two base lines. CWSI for each point was calculated as the ratio between the distance with the Upper base line (D1) and the distance between the two bases lines (D1 and D2) at the same VPD value. For convenience the base line for control plants (D2) was obtained by linear regression.
Care must be taken that CWSI calculation must theoretically be adapted according to local conditions because it does not have the same significance depending on the meteorological agro conditions (Jackson, 1991). Thus in order to compare the CWSI of the various sites, we collected the data of all tests to construct the same base lines «maximum of stress» D1 and «unstressed» D2 used in all subsequence tests (Fig.1)
2.2.5. Measurement of fluorescence parameters
Chlorophyll fluorescence was measured using a Handy PEA (Hansatech Instruments, Norfolk, UK) portable fluorescence spectrometer following the manufacturer's instructions.
Briefly, 7 and 14 days after drought start, six leaves from both well-watered and drought-stress conditions for each genotype were selected to measure chlorophyll fluorescence parameters; the measurement support was clipped onto these leaves between 9 and 12 a.m for field experiment and 7:00 a.m. to 9:00 a.m for greenhouse test. The dark adaptation period (i.e. the time necessary to obtain a steady value of Fv / Fm) for all measurements was c.30 min. After adaptation, the measurement probe was positioned on the support and leaf surface was exposed to continuous red light (peak wavelength 600 nm, spectral line half-width 22 nm) provided by an array of three light-emitting diodes. Measurements were made at saturation irradiance up to 3000 μmol m-2s-1 and the duration of the light pulse was 1 s.
Fluorescence values recorded included:
Measurements of the Performance Indices were recorded. The expression of the Index of performance is by analogy derived from the equation of Nernst which is employed to determine the redox potential of a given system.
PIABS =𝑅𝐶
𝐴𝐵𝑆𝑋
φPo
1 − φPo𝑋
ψo
1 − ψo
𝑅𝐶
𝐴𝐵𝑆 : Ratio between reaction center concentration and chlorophyll
Where ΦPo / (1-φPo) indicating the performance of the photochemical reactions or «Light reactions » RC/ABS the ratio between the concentration of the reactional centers and chlorophyll, ψo/(1-ψo) indicating the performance of the non-photochemical reactions related to the flow of electrons.
The Drought Factor Index (DFI) concept presented by(Strauss et al., 2006) was used for the identification of drought tolerant genotypes. DFI, which assesses performance index (PI) reduction during the two weeks of hydric deficit, was calculated according to the formula:
DFI = log A + 2log B
Where A is the performance index (PI) relating to the control during the first week of the hydrous deficit; B is the index of performance relating to the control at the end of the second hydrous week of deficit. Relative PI was calculated as PI stressed/PI control. DFI is presented on the assumption that hydric deficit-tolerant varieties, able to tolerate the effect of stress during long periods, could maintain a higher PI after a long-term hydric deficit than the sensitive varieties. Consequently, the susceptible varieties which show the strongest PI reduction during the last stages of stress will also display the lowest DFI values.
World Journal of Advanced Research and Reviews, 2021, 12(02), 379–391
383
2.3. Data analysis
Analysis of variance (ANOVA) was carried out for all the traits measured for this study using R statistical software. The Principal Component Analysis (PCA) and Hierarchical Classification Ascendant were performed using XLSTAT.
3. Results
3.1. Evaluation of the agronomic traits
Analyse of variance and means values of agronomical traits under drought stress in Banfora and Farako-Ba 2014 are reported in Table 1. The averages of the variables were 279 ± 51 (Tillers/m²); 113 ± 5 (flowering d); 104 ± 7 (Height cm); 3280 ± 1509 (Biomass kg/ha) 21.5 ± 1.15 (Weight 1000g); 2358 ± 1256 (Yield kg/ha). The ANOVA shows a very highly significant difference between sites and among genotypes for all variables. ANOVA of interaction GXS was very highly significant for all variables, except for the output variable for which it is significant.
Table 1 Combined ANOVA for agronomical traits at Banfora and Farako-Ba (2014)
Varieties Tillers/m² Flowering PH (cm) Biom (kg/ha) W1000K Yield(kg/ha)
IRB_MR_208 287 115 99 3375 20.8 2244
IRB_MR_167 265 115 101 2457 20.8 2128
IRB_MR_108 247 111 105 3015 21.7 2196
IRB_MR_463 259 114 113 3648 20.5 2873
IRB_MR_278 303 112 103 2671 20.8 1732
IRB_MR_349 275 113 106 3045 21.2 2599
IRB_MR_130 224 117 106 2709 21.0 1666
IRB_MR_232 286 116 107 3217 21.3 2318
IRB_MR_420 287 115 105 2303 21.4 1832
IRB_MR_255 318 110 103 2353 22.6 1766
IRB_MR_68 247 112 98 2461 20.3 1653
IRB_MR_103 260 114 102 3108 20.4 2196
IRB_MR_412 352 111 104 6743 22.6 5423
IRB_MR_177 286 113 97 2641 23.5 1950
IRB_MR_251 276 117 96 2113 22.0 1499
IRB_MR_269 295 114 105 2384 21.5 1533
IRB_MR_250 249 110 109 2507 22.1 2033
IR64 285 110 100 2917 21.0 1685
B6144F_M_6 305 116 108 4684 22.6 3139
Apo 266 120 110 7593 21.9 5589
Mean 279 ± 51 113 ± 5 104 ± 7 3280 ± 1509 21.5 ± 1.15 2358 ± 1256
Sites *** *** *** *** *** ***
Genotypes *** *** *** *** *** ***
Genotypes X Sites *** *** *** *** *** *
PH= Plant heigh; W1000K= 1000 kernel weigh; Biom= Biomass
3.2. Canopy temperature evolution for controls and stress treatments
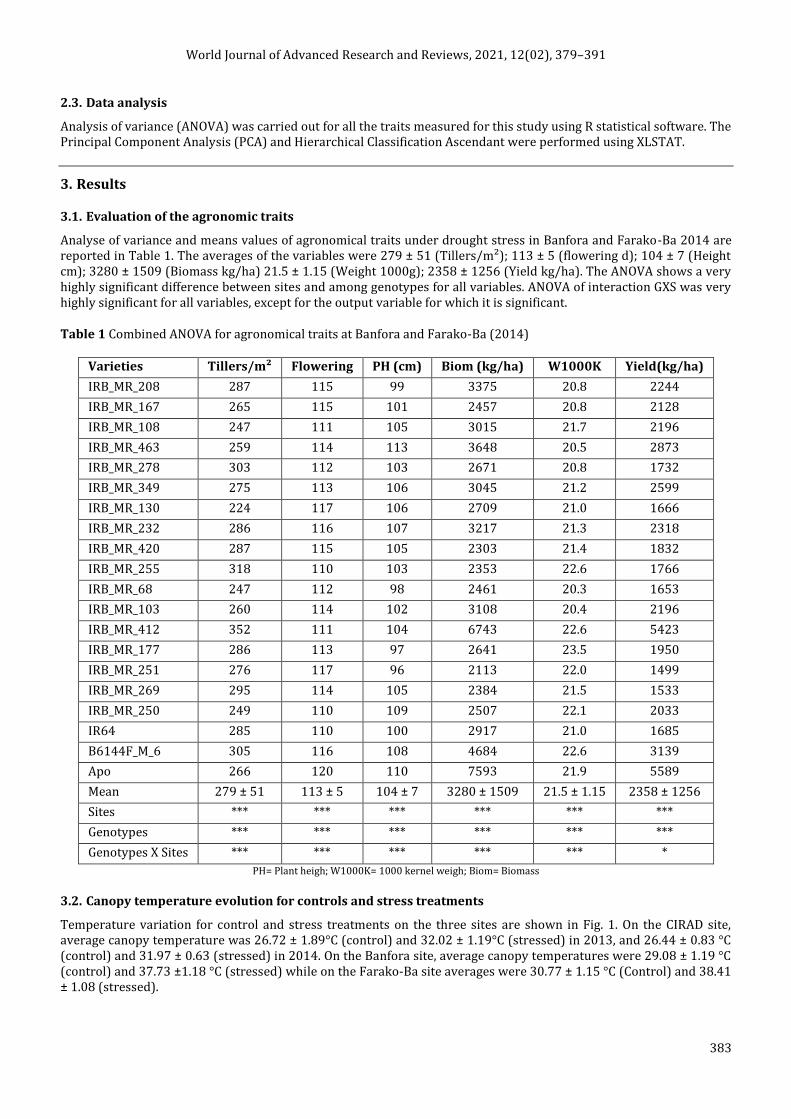
Temperature variation for control and stress treatments on the three sites are shown in Fig. 1. On the CIRAD site, average canopy temperature was 26.72 ± 1.89°C (control) and 32.02 ± 1.19°C (stressed) in 2013, and 26.44 ± 0.83 °C (control) and 31.97 ± 0.63 (stressed) in 2014. On the Banfora site, average canopy temperatures were 29.08 ± 1.19 °C (control) and 37.73 ±1.18 °C (stressed) while on the Farako-Ba site averages were 30.77 ± 1.15 °C (Control) and 38.41 ± 1.08 (stressed).
World Journal of Advanced Research and Reviews, 2021, 12(02), 379–391
384
Figure 1 Canopy temperature evolutions for controls and stress treatments in 4 different situations (CIRAD 2013; CIRAD 2014; Banfora 2013 and Farako-Ba 2014
3.3. Reaction of rice genotypes to drought (CWSI and DFI).
Analyse of variance and means values of CWSI and DFI are displayed respectively in table 2 and figure 5 and 6.
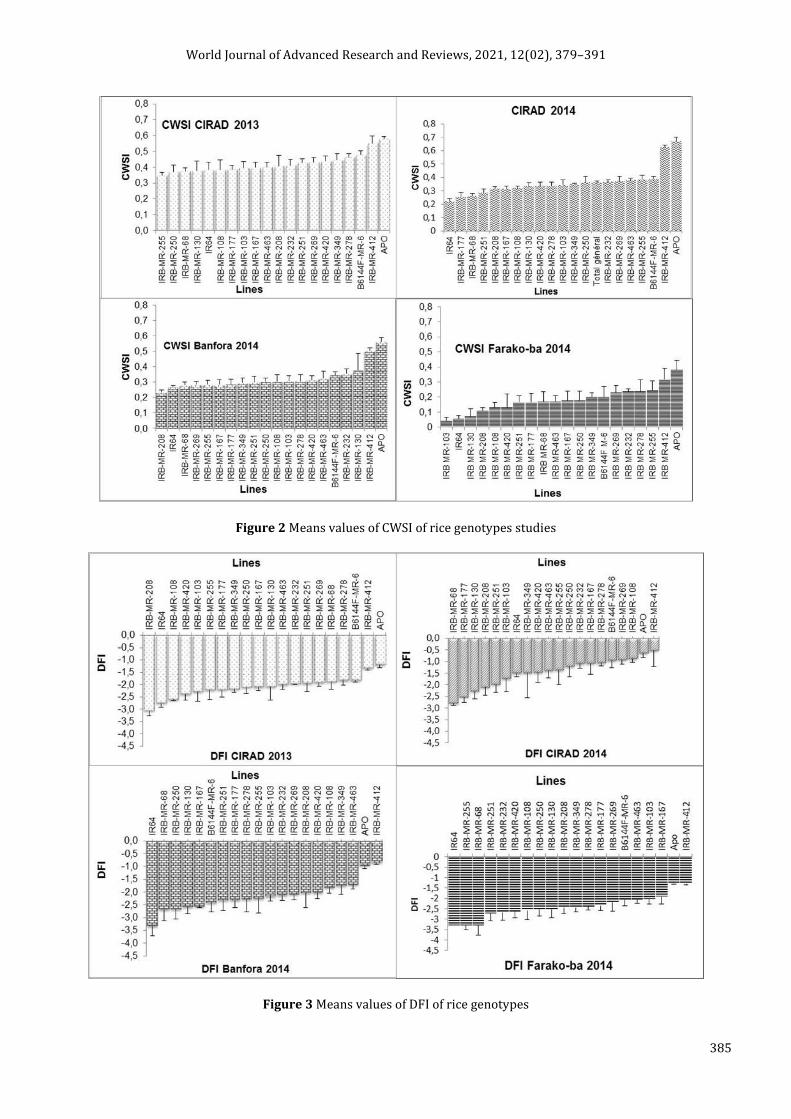
Leaf canopy temperature was used to calculate crop water stress index (CWSI). CWSI values varied from 0.170 to 0.768 in the 4 relatives test. The tolerant genotype (APO) has the high value of CWSI in the all sites while the susceptible genotype (IR64) displayed the lowest CWSI only in one site (CIRAD 2014). Four genotypes (IRB-MR-255, IRB-MR-250, IRB-MR-68 and IRB-MR-130) in CIRAD 2013; one genotype (IRB-MR-208) in Banfora 2014 and one genotype (IRB-MR-103) in Farako-ba 2014 had CWSI value lower than that of IR64 (drought susceptible genotype). With absolute calculation, the CWSI genotypes were 0,249 ± 0,083 (CIRAD 2013); 0,374 ± 0,118 (CIRAD 2014); 0,322 ± 0,091(Banfora 2014); 0,180 ± 0,135 (Farako-Ba 2014). Analyse of variance showed highly significant (P< 0.001) difference between sites (S), among genotypes (G) and for the genotype X site (GXS) Interaction.
As a whole, in the 4 relative tests, DFI varied from -3.338 to -0.530. On the 3 sites (4 different situations) the tolerant APO control and the IRB-MR-412 line had the highest DFI values and the susceptible control IR64 is indeed found among the susceptible lines (Fig 6). The averages were -2.096 ± 0.54 ; -1.46 ± 1.04; -2.156 ± 0.806; -2.32 ± 0.803 respectively for CIRAD 2013, CIRAD 2014, Banfora 2014 and Farako-ba 2014 (Table 1). DFI ANOVA indicates a highly significant difference P<0.001 between sites (S), among genotypes (G) and for the genotypes X sites (GXS) interaction.
World Journal of Advanced Research and Reviews, 2021, 12(02), 379–391
385
Figure 2 Means values of CWSI of rice genotypes studies
Figure 3 Means values of DFI of rice genotypes
World Journal of Advanced Research and Reviews, 2021, 12(02), 379–391
386
Table 2 Analysis of variance and means values of CWSI and DFI
Variables Trials Mean Sites (S) Genotypes (G) G X S
CWSI
CIRAD 2013 0.249 ± 0.083 *** ***
*** CIRAD 2014 0.374 ± 0.118 *** ***
Banfora 2014 0.322 ± 0.091 *** ***
Farako-Ba 2014 0.180 ± 0.135 *** ***
DFI
CIRAD 2013 -2.096 ± 0.54 *** ***
*** CIRAD 2014 -1.46 ± 1.04 *** ***
Banfora 2014 -2.156 ± 0.806 *** ***
Farako-Ba 2014 -2.32 ± 0.803 *** ***
3.4. Relationship between CWSI, DFI and agronomical traits
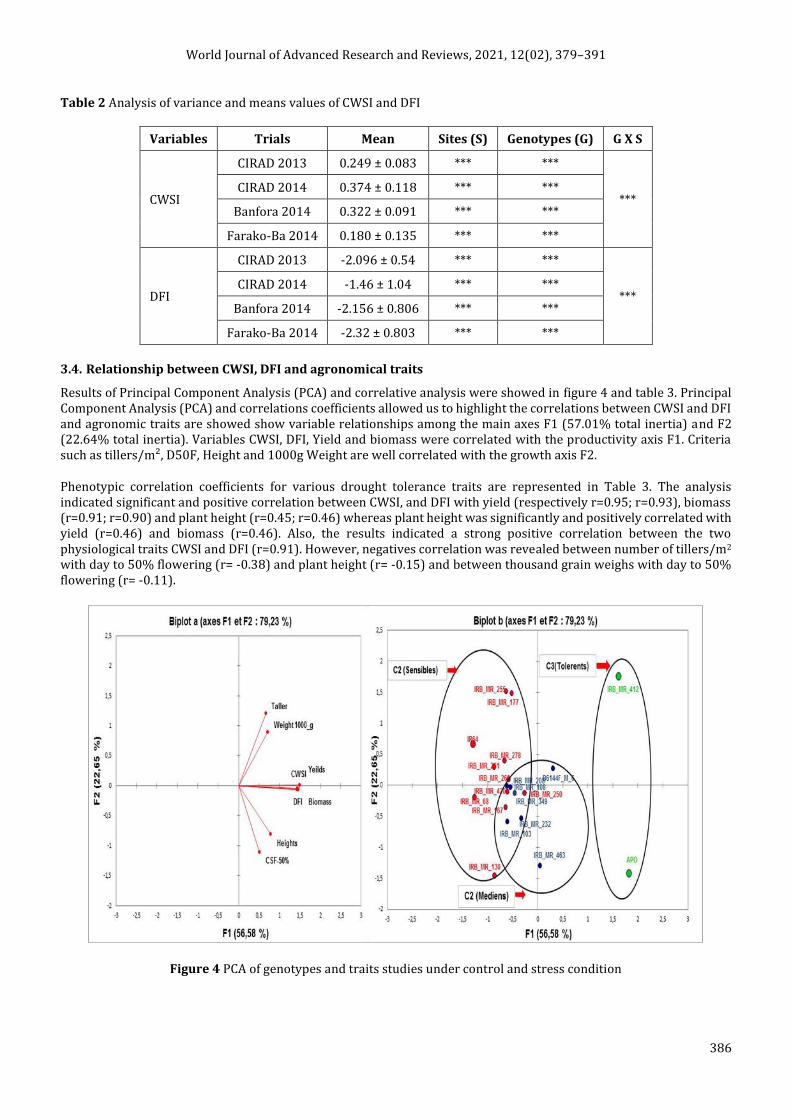
Results of Principal Component Analysis (PCA) and correlative analysis were showed in figure 4 and table 3. Principal Component Analysis (PCA) and correlations coefficients allowed us to highlight the correlations between CWSI and DFI and agronomic traits are showed show variable relationships among the main axes F1 (57.01% total inertia) and F2 (22.64% total inertia). Variables CWSI, DFI, Yield and biomass were correlated with the productivity axis F1. Criteria such as tillers/m², D50F, Height and 1000g Weight are well correlated with the growth axis F2.
Phenotypic correlation coefficients for various drought tolerance traits are represented in Table 3. The analysis indicated significant and positive correlation between CWSI, and DFI with yield (respectively r=0.95; r=0.93), biomass (r=0.91; r=0.90) and plant height (r=0.45; r=0.46) whereas plant height was significantly and positively correlated with yield (r=0.46) and biomass (r=0.46). Also, the results indicated a strong positive correlation between the two physiological traits CWSI and DFI (r=0.91). However, negatives correlation was revealed between number of tillers/m2 with day to 50% flowering (r= -0.38) and plant height (r= -0.15) and between thousand grain weighs with day to 50% flowering (r= -0.11).
Figure 4 PCA of genotypes and traits studies under control and stress condition
World Journal of Advanced Research and Reviews, 2021, 12(02), 379–391
387
Table 3 Person (S) Relationships between variables
Variables Tillers/m² D50F Height Biomass W.1000g Yield CWSI DFI
Tillers/m² 1
D50F -0.38 1
Height -0.15 0.37 1
Biomass 0.38 0.37 0.46* 1
W. 1000g 0.55* -0.11 0.01 0.4 1
Yield 0.42 0.30 0.46* 0.98*** 0.41 1
CWSI 0.36 0.29 0.45* 0.91*** 0.34 0.95*** 1
DFI 0.40 0.31 0.46* 0.90*** 0.35 0.93*** 0.91*** 1
Figures in bold are different from 0 at α= 0.05 signification, *** Significatif code
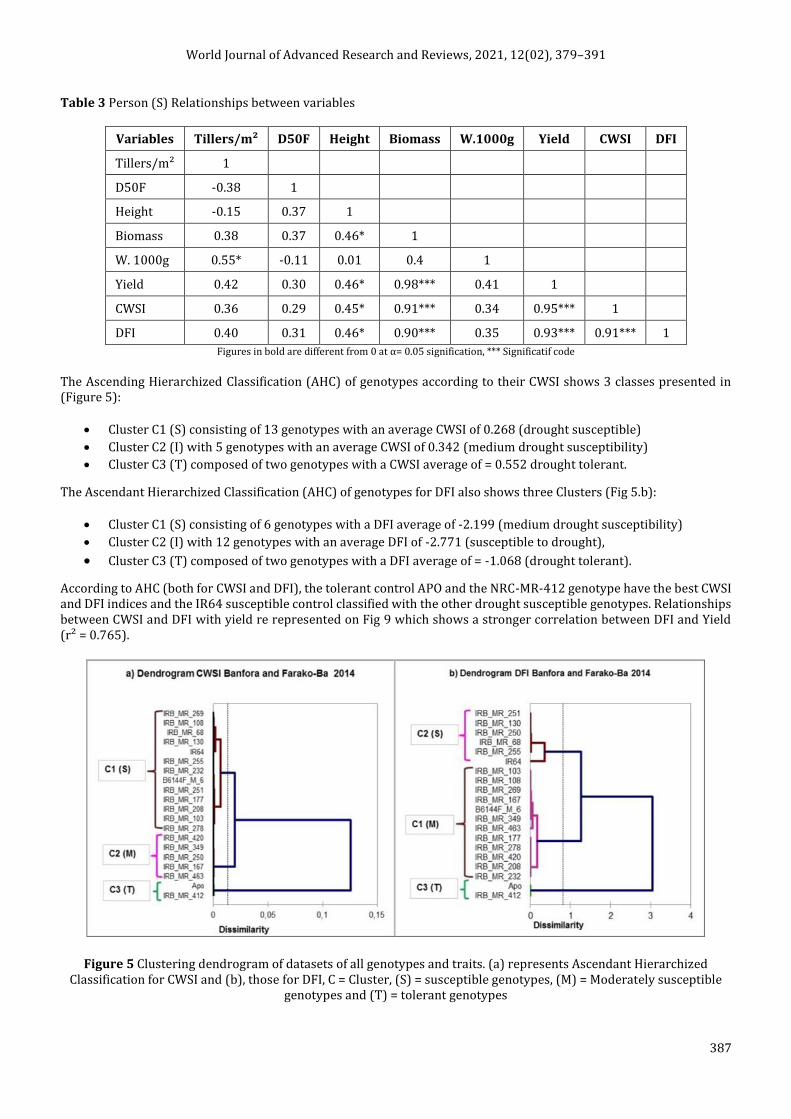
The Ascending Hierarchized Classification (AHC) of genotypes according to their CWSI shows 3 classes presented in (Figure 5):
Cluster C1 (S) consisting of 13 genotypes with an average CWSI of 0.268 (drought susceptible)
Cluster C2 (I) with 5 genotypes with an average CWSI of 0.342 (medium drought susceptibility)
Cluster C3 (T) composed of two genotypes with a CWSI average of = 0.552 drought tolerant.
The Ascendant Hierarchized Classification (AHC) of genotypes for DFI also shows three Clusters (Fig 5.b):
Cluster C1 (S) consisting of 6 genotypes with a DFI average of -2.199 (medium drought susceptibility)
Cluster C2 (I) with 12 genotypes with an average DFI of -2.771 (susceptible to drought),
Cluster C3 (T) composed of two genotypes with a DFI average of = -1.068 (drought tolerant).
According to AHC (both for CWSI and DFI), the tolerant control APO and the NRC-MR-412 genotype have the best CWSI and DFI indices and the IR64 susceptible control classified with the other drought susceptible genotypes. Relationships between CWSI and DFI with yield re represented on Fig 9 which shows a stronger correlation between DFI and Yield (r² = 0.765).
Figure 5 Clustering dendrogram of datasets of all genotypes and traits. (a) represents Ascendant Hierarchized Classification for CWSI and (b), those for DFI, C = Cluster, (S) = susceptible genotypes, (M) = Moderately susceptible
genotypes and (T) = tolerant genotypes
World Journal of Advanced Research and Reviews, 2021, 12(02), 379–391
388
4. Discussion
Analysis of variance of agro-morphological traits revealed significant differences between treatments and among the genotypes. Significant variation due to genotype for all the traits suggested that the magnitude of difference in genotypes was sufficient to provide some scope for selecting drought resistance traits (Jatoi et al., 2011). The genotypes x sites interactions were significant for all agro-morphological traits under drought stress. This result confirms that cultivar phenotype varied greatly depending on growing condition. In our case the VPD was the major factor explaining the different condition.
The estimate of canopy temperature interestingly shows differences between stressed and control plants were ca. 5°C in both years for greenhouse experiments and ca. 8°C for both field trials. Canopy temperature of a crop under drought stress will rise considerably above air temperature, so that temperature variation between crop canopy and air (Tc-Ta) becomes an indicator of plant water status(Bariou et al., 1985). This is a highly integrating trait resulting from the effects of several biochemical and morpho-physiological features acting at the root, stomata, leaf, and canopy levels (Tuberosa, 2012). In the field, genotypes with a cooler canopy temperature under drought stress, or a higher CTD, use more of the available water in the soil to avoid excessive dehydration (Reynolds et al., 2007; Reynolds et al., 2009; Tuberosa, 2012). However, due to the measurement method used and the climatic variation, this canopy temperature variable could not be used to compare individuals in the population, prompting the use of the crop water stress index (CWSI) method.
Crop water stress index (CWSI), based on canopy temperature measurement has been shown to be a good indicator of water deficits in field crops (Testi et al., 2008). In our study, ANOVA results show a highly significant difference between genotypes; sites and genotypes x sites interaction for CWSI. CWSI matches a classical rule where for the 3 sites the APO tolerant control has the best transpiration index of followed by the IRB-MR-412 line while the sensitive control IR64 displayed the lowest CWSI (Fig 5). Our results are consistent with those of Gontia and KN. (2008); Bijanzadeh (2012); Bayoumi et al. (2014) on wheat.
The drought factor index (DFI) was used to rank the 18 lines as well as the two reference parental sources with known drought stress response: Apo (drought tolerant) and IR64 (drought susceptible). On the 3 sites (4 different situations) the tolerant APO control and IRB-MR-412 line had the highest DFI values and the susceptible control IR64 was indeed found among the susceptible lines. Similar research was carried out by Strauss et al. (2006) for the cold tolerance on wheat, on the barley drought by Oukarroum et al. (2009), and on sesame by Boureima et al. (2012). These authors obtained similar results to ours.
The analysis of correlation between the features indicated strongly significant positive correlations between CWSI, DFI with biological yield (biomass), grain yield, height and thousand kernel weights. Then, these two physiological traits (CWSI and DFI) showed a close relationship with yield related traits, thus it can be presumed that if a reliable trait with high heritability is used as drought tolerant criterion, this may increase yield traits in the same direction. These results suggested also, that increase in CWSI and DFI could simultaneously increase yield traits in water stress conditions. Similar results were also achieved by Gupta et al. (2001); Jatoi et al. (2011) and Bayoumi et al. (2014) in wheat. This study showed a positive correlation of yield with plant height, date of 50% flowering, biomass and one thousand grain weigh under drought condition. These results are in accordance with those of several studies in rice such as Murthy et al. (2011); Mohankumar et al. (2011); Kumar et al. (2014) No significant negative correlations were evidenced between thousand grain weight, Days to 50% flowering, and plant height. This result is similar to those obtained by Bayoumi et al. (2014).
5. Conclusion
Infrared thermography and chlorophyll fluorescence were found to be effective tools for the early detection of drought stress in lowland rice. They moreover provided useful estimates of physiological traits such as canopy temperature (CWSI) and photosystem II status (DFI). Our study clearly shows the value of using a common base line for thermography measurements from several sites enabling the relevant use of CWSI for further calculation. It also confirmed that, during the reproductive phase, drought can affect CWSI and DFI to a significant degree, thus negatively impacting yield. The study showed correlations between secondary traits (CWSI and DFI) and some agronomic traits (tillers/m², flowering plant height, biomass, 1000-grain weight and yield). The combination of methods described here allowed us to precociously identify in a segregating population a high-yielding recombinant line with a drought tolerance level equivalent to the tolerant control, result duly validated in field trials. As the method was validated on twenty lines, we are planning to use it to applied it for phenotyping a panel of 250 segregating lines.
World Journal of Advanced Research and Reviews, 2021, 12(02), 379–391
389
In our opinion, this study clearly shows that the described methods, used in combination, (canopy temperature, use of CWSI (corrected for climatic variations) and use of chlorophyll fluorescence through DFI) can reliably be employed for in-field high-throughput phenotyping in rice, and possibly other crops, for drought tolerance research.
Compliance with ethical standards
Acknowledgments
The authors thank warmly the whole team of INERA, Cirad and AfricaRice for their active participation to this study. Financial support from General Challenge Program (GCP) is dully acknowledged.
Disclosure of conflict of interest
The authors declare no conflicts of interest regarding the publication of this paper.
References
[1] Bariou R, Lecamus D, Le henaff F. Indices de végétation; Rennes 2, Dossiers de télédétection. Université de Renne 2, Haute Bretagne. 1985; 121.
[2] Bayoumi TY, El-Hendawy S, Yousef MSH, El Gawad MA. Application of infrared thermal imagery for monitoring salt tolerant of wheat genotypes. Journal of American Science. 2014; 10.
[3] Bijanzadeh E. Evaluation of crop water stress index, canopy temperature and grain yield of five Iranian wheat cultivars under late season drought stress. Journal of Plant Physiology & Breeding. 2012; 2: 23-33.
[4] Bo L, Tieliang W, Jian S. Crop water stress index for off-season greenhouse green peppers in Liaoning, China. International Journal of Agricultural and Biological Engineering. 2014; 7: 28-35.
[5] Bouman B, Peng S, Castaneda A, Visperas R. Yield and water use of irrigated tropical aerobic rice systems. Agricultural Water Management. 2005; 74: 87-105.
[6] Boureima S, Oukarroum A, Diouf M, Cisse N, Van Damme P. Screening for drought tolerance in mutant germplasm of sesame (Sesamum indicum) probing by chlorophyll a fluorescence. Environmental and Experimental Botany. 2012; 81: 37-43.
[7] Chaerle L, Valcke RL, Van Der Straeten D. Visualization of early stress responses in plant leaves. AeroSense 2002. International Society for Optics and Photonics. 2002; 417-423.
[8] Erdem Y, Arin L, Erdem T, Polat S, Deveci M, Okursoy H, Gültas H. Crop Water Stress Index For Assessing Irrigation Scheduling of Drip Irrigated Broccoli (Brassica oleracea L. var. italica). Water Manage. 2010; 98: 148–156.
[9] Ferrara A, Lovelli S, Di Tommaso T, Perniola M. Flowering, growth and fruit setting in greenhouse bell pepper under water stress. Journal of Agronomy. 2011; 10: 12-19.
[10] Gontia N, KN T. Development of crop water stress index of wheat crop for scheduling irrigation using infrared thermometry. Agricultural Water Management. 2008; 95: 1144–1152.
[11] Govindjee R. Sixty-three years since Kautzky: chlorophyll a fluorescence. Aust. J. Plant Physiol. 1995; 22: 131-160.
[12] Grant OM, Tronina Ł, Jones HG, Chaves MM. Exploring thermal imaging variables for the detection of stress responses in grapevine under different irrigation regimes. Journal of Experimental Botany. 2007; 58: 815-825.
[13] Gupta N, Gupta S, Kumar A. Effect of water stress on physiological attributes and their relationship with growth and yield of wheat cultivars at different stages. Journal of Agronomy and Crop Science. 2011; 186: 55-62.
[14] Idso S, Jackson R, Pinter J, Reginato R, Hatfield J. Normalizing the stress-degree-day parameter for environmental variability. Agriculture Meteorology. 1981; 24: 45–55.
[15] Idso S, Jackson RD, Reginato RJ. Remote sensing of crop yield canopy temperature and albedo measurements:have been quantitativelv correlated with final harVests of wheat. Science. 1977; 196: 19-24.
[16] Idso SB. Non-water-stressed baselines: A key to measuring and interpreting plant water stress. Agricultural Meteorology. 1982; 27: 59-70.
[17] IRRI. Standard Evaluation System. International Rice Research Institute, Manila, Philippines. 2002; 11-30.
World Journal of Advanced Research and Reviews, 2021, 12(02), 379–391
390
[18] Jackson RD. Canopy temperature and crop water stress. Advances in Irrigation. 1982; 1: 43-85.
[19] Jackson RD, Idso SB, Reginato RJ, Pinter Jr PJ. Canopy temperature as a crop water stress indicator. Water Resour. Res. 1981; 17: 1133–1138.
[20] Jackson SH. Relationships between normalized leaf water potential and crop water stress index values for acala cotton. Agricultural Water Management. 1991; 20: 109-118.
[21] Jatoi W, Baloch M, Kumbhar M, Khan N, Kerio M. Effect of water stress on physiological and yield parameters at anthesis stage in elite spring wheat cultivars. Sarhad J. Agric. 2011; 27: 59-65.
[22] Jones HG. Use of infrared thermometry for estimation of stomatal conductance as a possible aid to irrigation scheduling Agricultural and Forest Meteorology. 1999; 95: 139-149.
[23] Jones HG, Stoll M, Santos T, Sousa Cd, Chaves MM, Grant OM. Use of infrared thermography for monitoring stomatal closure in the field: Application to grapevine. J. Exp. Bot. , Vol. 53, No. 378, pp. 2249-2260., 2002. Use of infrared thermography for monitoring stomatal closure in the field: Application to grapevine. J. Exp. Bot. 2002; 53: 2249-2260.
[24] Krause G, Weis E. Chlorophyll fluorescence and photosynthesis: the basics. Annual review of plant biology. 1991; 42: 313-349.
[25] Kumar S, Dwivedi S, Singh S, Jha S, Lekshmy S, Elanchezhian R, Singh O, Bhatt B. Identification of drought tolerant rice genotypes by analysing drought tolerance indices and morpho-physiological traits. SABRAO Journal of Breeding & Genetics. 2014; 46.
[26] Leinonen I, Grant O, Tagliavia C, Chaves M, Jones H. Estimating stomatal conductance with thermal imagery. Plant, Cell & Environment. 2006; 29: 1508-1518.
[27] Luquet D, Vidal A, Dauzat J, Begue A, Olioso A, Clouvel P. Using directional tir measurements and 3d simulations to assess the limitations and opportunities of water stress indices. Remote Sensing of Environment. 2004; 90: 53-62.
[28] Mohankumar M, Sheshshayee M, Rajanna M, Udayakumar M. Correlation and path analysis of drought tolerance traits on grain yield in rice germplasm accessions. ARPN Journal of Agricultural and Biological Science. 2011; 6: 70-77.
[29] Monteith JL, Szeicz G. Radiative temperature in the heat balance of natural surfaces. Quart. J. Roy. Meteorol. 1962; 88: 496-507.
[30] Moran MS. Thermal infrared measurement as an indicator of planet ecosystem health. Thermal remote sensing in land surface processes. 2004; 257-282.
[31] Moran MS, Clarke TR, Inoue Y, Vidal A. Estimating crop water deficit using the relation between surface-air temperature and spectral vegetation index. Remote Sensing of Environment. 1994; 49: 246-263.
[32] Müller P, Li XP, Niyogi KK. Non-photochemical quenching. A response to excess light energy. Plant Physiology. 2001; 125: 1558-1566.
[33] Murthy B, Kumar A, Hittalmani S. Response of rice (Oryza sativa L.) genotypes under aerobic conditions. Electronic journal of plant breeding. 2011; 2: 194-199.
[34] Oukarroum A. Vitalité des plantes d'orge (" Hordeum vulgare" L.) en conditions de stress hydrique et thermique analysée par la fluorescence chlorophyllienne. University of Geneva. 2007.
[35] Oukarroum A, Schansker G, Strasser RJ. Drought stress effects on photosystem I content and photosystem II thermotolerance analyzed using Chl a fluorescence kinetics in barley varieties differing in their drought tolerance. Physiologia plantarum. 2009; 137: 188-199.
[36] Reynolds M, Dreccer F, Trethowan R. Drought-adaptive traits derived from wheat wild relatives and landraces. Journal of Experimental Botany. 2007; 58: 177-186.
[37] Reynolds M, Manes Y, Izanloo A, Langridge P. Phenotyping approaches for physiological breeding and gene discovery in wheat. Annals of Applied Biology. 2009; 155: 309-320.
[38] Sezen SM, Yazar A, Daşgan Y, Yucel S, Akyıldız A, Tekin S, Akhoundnejad Y. Evaluation of crop water stress index (CWSI) for red pepper with drip and furrow irrigation under varying irrigation regimes. Agricultural Water Management. 2014; 143: 59-70.
World Journal of Advanced Research and Reviews, 2021, 12(02), 379–391
391
[39] Sezen SM, Yazar A, Eker S. Effect of drip irrigation regimes on yield and quality of field grown bell pepper. Agricultural Water Management. 2006; 81: 115-131.
[40] Strasser BJ, Strasser RJ. Measuring fast fluorescence transients to address environmental questions: the JIP-test. In: Mathis, P. (Ed.), Photosynthesis: From Light to Biosphere. Kluwer Academic Publishers, Dordrecht, V. 1950; 977-980.
[41] Strasser RJ, Srivastava A, Tsimilli-Michael M. Analysis of the chlorophyll a fluorescence transient. In: Papageorgiou, G., Govindjee (Eds.), Advances in Photosynthesis and Respiration Chlorophyll Fluorescence a Signature of Photo-synthesis. Kluwer Academic Publishers, The Netherlands. 2004; 19: 321-362.
[42] Strauss A, Krüger G, Strasser R, Van Heerden P. Ranking of dark chilling tolerance in soybean genotypes probed by the chlorophyll a fluorescence transient OJIP. Environmental and Experimental Botany. 2006; 56, 147-157.
[43] Susplugas S, Srivastava A, Strasser RJ. Changes in the photosynthetic activities during several stages of vegetative growth of Spirodela polyrhiza: effect of chromate. Journal of plant physiology. 2000; 157: 503-512.
[44] Testi L, Goldhamer D, Iniesta F, Salinas M. Crop water stress index is a sensitive water stress indicator in pistachio trees. Irrigation Science. 2008; 26: 395-405.
[45] Tuberosa R. Phenotyping for drought tolerance of crops in the genomics era Frontiers in Physiology/Plant Physiology. 2012; 3.
[46] Van Heerden PD, Strasser RJ, Krüger GH. Reduction of dark chilling stress in N2‐fixing soybean by nitrate as indicated by chlorophyll a fluorescence kinetics. Physiologia plantarum. 2004; 121: 239-249.
[47] Wiegand CL, Nixon PR, Jackson RD. Drought detection and quantification by reflectance and thermal responses. Agricultural Water Management. 1983; 7: 303-321.
[48] Yacouba H, Puech J, Duchesne J. Détection de l'heure d'apparition de stress hydrique journalier par la température de surface: Une possibilité de prévention du stress hydrique journalier. 1999.
[49] Yuan G, Luo Y, Sun X, Tang D. Evaluation of a crop water stress index for detecting water stress in winter wheat in the north china plain. Agricultural Water Management. 2004; 64: 29-40.


![High-Throughput Phenotyping and QTL Mapping Reveals the ...Breakthrough Technologies High-Throughput Phenotyping and QTL Mapping Reveals the Genetic Architecture of Maize Plant Growth1[OPEN]](https://img.pdfslide.us/doc/110x75/5e89d63e14d2eb2a2e00cbef/high-throughput-phenotyping-and-qtl-mapping-reveals-the-breakthrough-technologies.jpg)