Embed Size (px)
Citation preview
Abstract—This paper presents the validation of TRNSYS
models for a high temperature air-water heat pump and a
thermal energy storage based on field trial data. This validation
aims at clarifying strengths and weaknesses of the models and
verifying the model accuracy which can support further studies
conducting advanced models related to HTAWHP-TES. Results
show good agreements with field trial results for condenser
water outlet temperatures and Coefficient of Performance of
the validated model, with CV(RMSE) of 4.14% and 11.6%
respectively. Discrepancies caused in start-up operation of the
heat pump are the main disadvantage that the model cannot
address and have been discussed. The storage model was
validated in three modes: charge, discharge and standby. Very
strong coincidences of tank node temperatures are observed
between simulation and collected data in both charging and
discharging mode. In standby mode, less than 2.5˚C difference
is observed in top tank nodes, whereas bottom nodes are within
1˚C uncertainty. Stratification in standby loss has been
discussed.
Index Terms—High temperature air-water heat pump,
thermal energy storage, validation, TRNSYS.
I. INTRODUCTION
Large number of households in the UK have gas and oil
boilers to meet space heating and domestic hot water,
which accounts for nearly 78% in domestic energy
consumption and 40% domestic greenhouse gas emissions
[1]. Heat pump which is a promising technology for
heating/cooling can play a vital role to meet carbon emission
reduction target in domestic sector. However, conventional
heat pumps (low/medium temperature) cannot work well
with existing radiator system as conventional radiators
require high temperature to achieve desirable thermal
comfort. Therefore, high temperature heat pumps providing
flow temperature above 65°C as boilers can be a retrofit
since it can avoid replacement cost for existing radiators,
Manuscript received June 29, 2017; revised August 15, 2017. This work
was supported by Research Councils UK (RCUK) under i-STUTE project.
K. X. Le is PhD student with the Centre for Sustainable Technologies,
University of Ulster, Newtownabbey, Co Antrim, BT37 0QB, the UK
(corresponding author, phone: +44-2890366122; e-mail: le-
N. Shah is with the Centre for Sustainable Technologies, University of
Ulster, Newtownabbey, Co Antrim, BT37 0QB, the UK (e-mail:
M. J. Huang is with the Centre for Sustainable Technologies, University
of Ulster, Newtownabbey, Co Antrim, BT37 0QB, the UK (e-mail:
N. J. Hewitt is with the Centre for Sustainable Technologies, University
of Ulster, Newtownabbey, Co Antrim, BT37 0QB, the UK (e-mail:
controllers, etc. with satisfactory thermal comfort.
It is undeniable that energy storage combined with heat
pump has brought valuable benefits for demand side
management which may have a significant role in future
non-dispatchable renewable energy electrical supply systems
[2]. Off-peak electricity can be used to run heat pumps to
store energy in storage, and this energy is then drawn to
buildings for heating demands, which may help to reduce
peak electricity demand for grid and utility bills for
consumers. In addition, building thermal comfort can be
maximized if a storage tank is coupled with an air source
heat pump in cold climate whereby frost happens. This is
because the energy used for defrost can be extracted from
the storage instead of the house.
Dynamic energy building simulation in TRNSYS
(Transient System Simulation Tool) [3] has been widely
used for designing new buildings and investigating retrofit
technologies which can enhance energy efficiency of
existing buildings. However, building energy simulation in
TRNSYS is highly complicated as it can perform dynamic
interaction of building physical characteristics and
heating/cooling systems, so calibration/validation of building
energy models is truly difficult to obtain [4]. In order to
reduce time consumption and effort involving in
calibration/validation, individual component such as heat
pump and storage should be validated before integrating into
whole building energy models [5].
The objective of this paper is to present validation of
TRNSYS models for a high temperature air-water heat pump
with a storage tank, both of which will be coupled in the
building model for future work. A series of field trial data
has been used for model validation. Arising difficulties
throughout validation process are highlighted, which can be
helpful for other similar studies.
The paper highlights field trial description in Section II.
Methodologies and results of validated TRNSYS models for
the heat pump and the storage tank are presented in Section
III and Section IV, respectively. Conclusions and future
work are drawn in Section V.
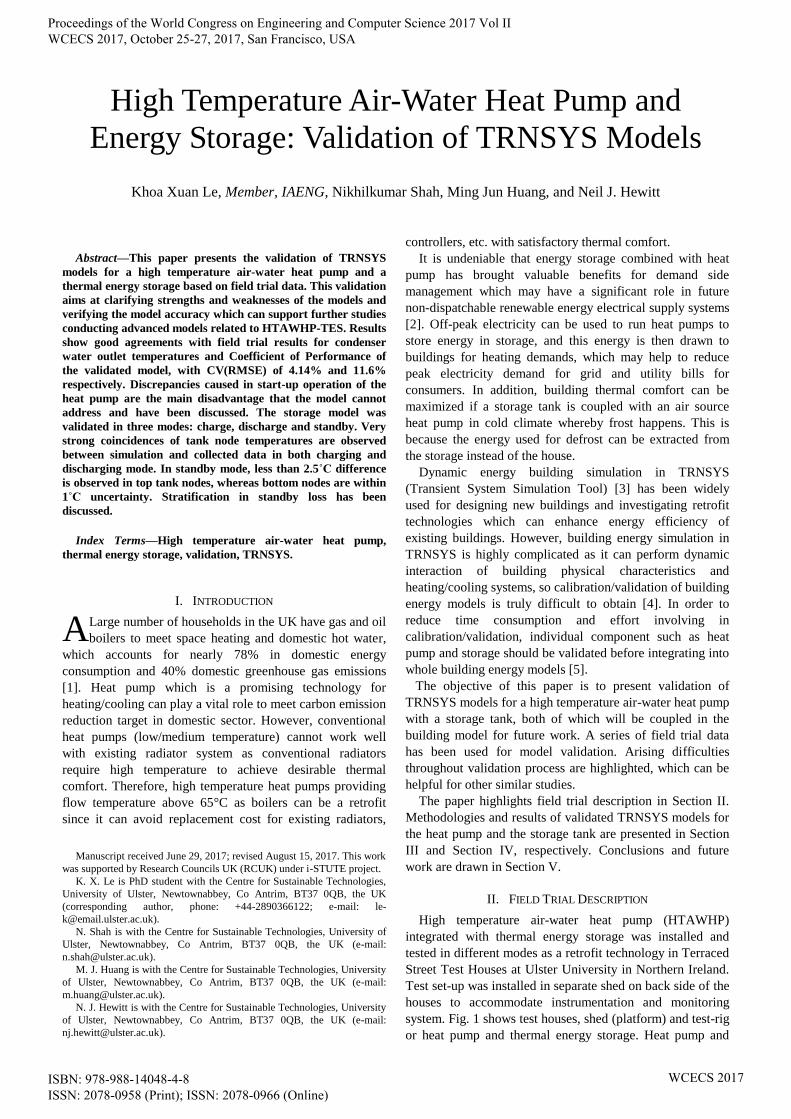
II. FIELD TRIAL DESCRIPTION
High temperature air-water heat pump (HTAWHP)
integrated with thermal energy storage was installed and
tested in different modes as a retrofit technology in Terraced
Street Test Houses at Ulster University in Northern Ireland.
Test set-up was installed in separate shed on back side of the
houses to accommodate instrumentation and monitoring
system. Fig. 1 shows test houses, shed (platform) and test-rig
or heat pump and thermal energy storage. Heat pump and
High Temperature Air-Water Heat Pump and
Energy Storage: Validation of TRNSYS Models
Khoa Xuan Le, Member, IAENG, Nikhilkumar Shah, Ming Jun Huang, and Neil J. Hewitt
A
Proceedings of the World Congress on Engineering and Computer Science 2017 Vol II WCECS 2017, October 25-27, 2017, San Francisco, USA
ISBN: 978-988-14048-4-8 ISSN: 2078-0958 (Print); ISSN: 2078-0966 (Online)
WCECS 2017
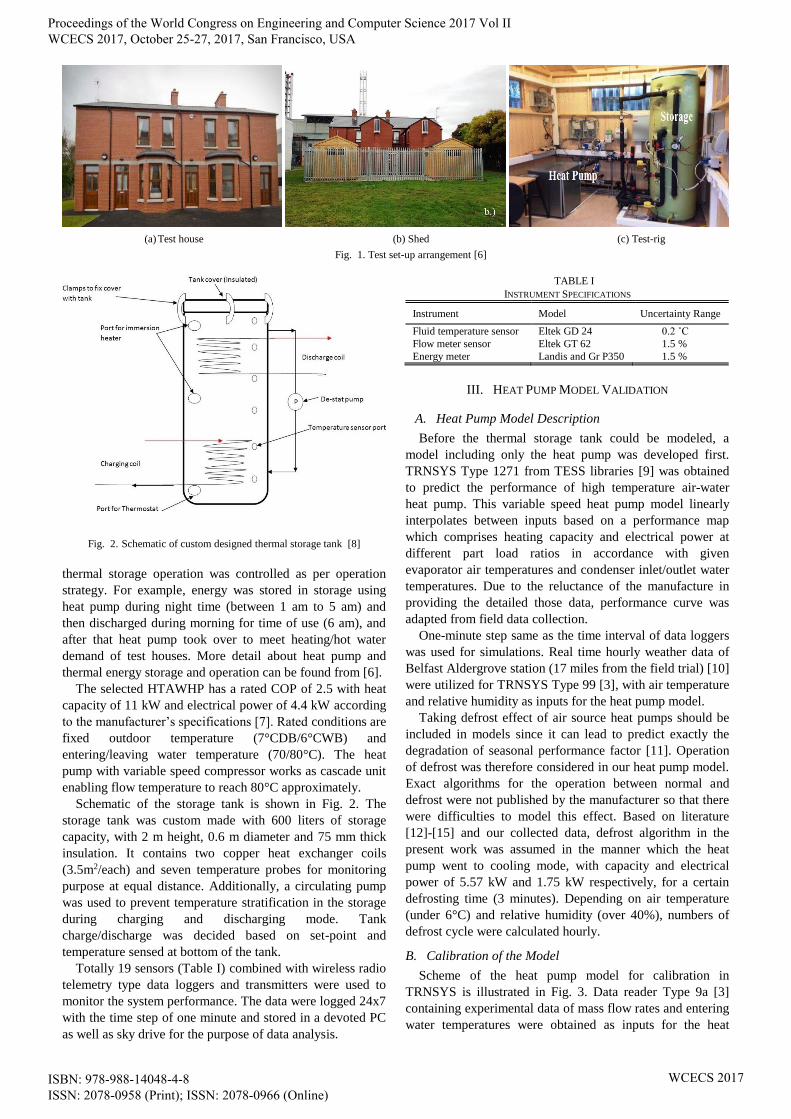
Fig. 2. Schematic of custom designed thermal storage tank [8]
thermal storage operation was controlled as per operation
strategy. For example, energy was stored in storage using
heat pump during night time (between 1 am to 5 am) and
then discharged during morning for time of use (6 am), and
after that heat pump took over to meet heating/hot water
demand of test houses. More detail about heat pump and
thermal energy storage and operation can be found from [6].
The selected HTAWHP has a rated COP of 2.5 with heat
capacity of 11 kW and electrical power of 4.4 kW according
to the manufacturer’s specifications [7]. Rated conditions are
fixed outdoor temperature (7°CDB/6°CWB) and
entering/leaving water temperature (70/80°C). The heat
pump with variable speed compressor works as cascade unit
enabling flow temperature to reach 80°C approximately.
Schematic of the storage tank is shown in Fig. 2. The
storage tank was custom made with 600 liters of storage
capacity, with 2 m height, 0.6 m diameter and 75 mm thick
insulation. It contains two copper heat exchanger coils
(3.5m2/each) and seven temperature probes for monitoring
purpose at equal distance. Additionally, a circulating pump
was used to prevent temperature stratification in the storage
during charging and discharging mode. Tank
charge/discharge was decided based on set-point and
temperature sensed at bottom of the tank.
Totally 19 sensors (Table I) combined with wireless radio
telemetry type data loggers and transmitters were used to
monitor the system performance. The data were logged 24x7
with the time step of one minute and stored in a devoted PC
as well as sky drive for the purpose of data analysis.
TABLE I
INSTRUMENT SPECIFICATIONS
Instrument Model Uncertainty Range
Fluid temperature sensor Eltek GD 24 0.2 ˚C
Flow meter sensor Eltek GT 62 1.5 %
Energy meter Landis and Gr P350 1.5 %
III. HEAT PUMP MODEL VALIDATION
A. Heat Pump Model Description
Before the thermal storage tank could be modeled, a
model including only the heat pump was developed first.
TRNSYS Type 1271 from TESS libraries [9] was obtained
to predict the performance of high temperature air-water
heat pump. This variable speed heat pump model linearly
interpolates between inputs based on a performance map
which comprises heating capacity and electrical power at
different part load ratios in accordance with given
evaporator air temperatures and condenser inlet/outlet water
temperatures. Due to the reluctance of the manufacture in
providing the detailed those data, performance curve was
adapted from field data collection.
One-minute step same as the time interval of data loggers
was used for simulations. Real time hourly weather data of
Belfast Aldergrove station (17 miles from the field trial) [10]
were utilized for TRNSYS Type 99 [3], with air temperature
and relative humidity as inputs for the heat pump model.
Taking defrost effect of air source heat pumps should be
included in models since it can lead to predict exactly the
degradation of seasonal performance factor [11]. Operation
of defrost was therefore considered in our heat pump model.
Exact algorithms for the operation between normal and
defrost were not published by the manufacturer so that there
were difficulties to model this effect. Based on literature
[12]-[15] and our collected data, defrost algorithm in the
present work was assumed in the manner which the heat
pump went to cooling mode, with capacity and electrical
power of 5.57 kW and 1.75 kW respectively, for a certain
defrosting time (3 minutes). Depending on air temperature
(under 6°C) and relative humidity (over 40%), numbers of
defrost cycle were calculated hourly.
B. Calibration of the Model
Scheme of the heat pump model for calibration in
TRNSYS is illustrated in Fig. 3. Data reader Type 9a [3]
containing experimental data of mass flow rates and entering
water temperatures were obtained as inputs for the heat
(a) Test house (b) Shed (c) Test-rig
Fig. 1. Test set-up arrangement [6]
Proceedings of the World Congress on Engineering and Computer Science 2017 Vol II WCECS 2017, October 25-27, 2017, San Francisco, USA
ISBN: 978-988-14048-4-8 ISSN: 2078-0958 (Print); ISSN: 2078-0966 (Online)
WCECS 2017
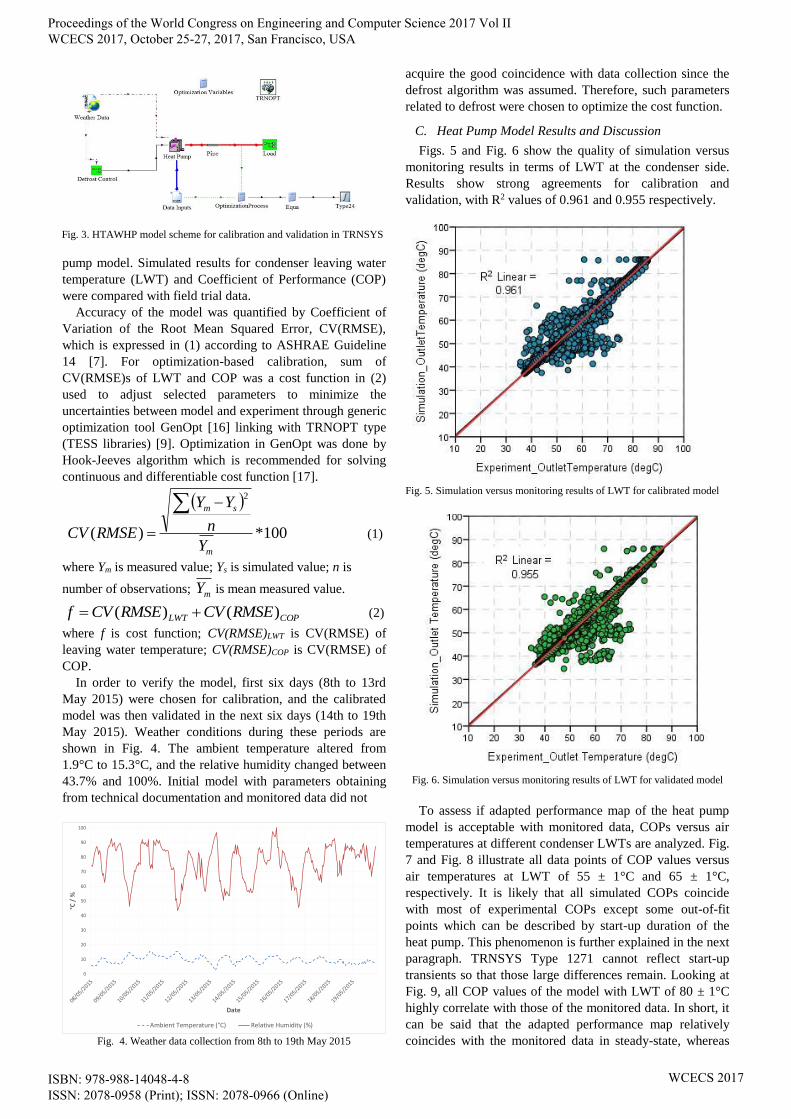
pump model. Simulated results for condenser leaving water
temperature (LWT) and Coefficient of Performance (COP)
were compared with field trial data.
Accuracy of the model was quantified by Coefficient of
Variation of the Root Mean Squared Error, CV(RMSE),
which is expressed in (1) according to ASHRAE Guideline
14 [7]. For optimization-based calibration, sum of
CV(RMSE)s of LWT and COP was a cost function in (2)
used to adjust selected parameters to minimize the
uncertainties between model and experiment through generic
optimization tool GenOpt [16] linking with TRNOPT type
(TESS libraries) [9]. Optimization in GenOpt was done by
Hook-Jeeves algorithm which is recommended for solving
continuous and differentiable cost function [17].
100*)(
2
m
sm
Y
n
YY
RMSECV
(1)
where Ym is measured value; Ys is simulated value; n is
number of observations; mY is mean measured value.
COPLWT RMSECVRMSECVf )()( (2)
where f is cost function; CV(RMSE)LWT is CV(RMSE) of
leaving water temperature; CV(RMSE)COP is CV(RMSE) of
COP.
In order to verify the model, first six days (8th to 13rd
May 2015) were chosen for calibration, and the calibrated
model was then validated in the next six days (14th to 19th
May 2015). Weather conditions during these periods are
shown in Fig. 4. The ambient temperature altered from
1.9°C to 15.3°C, and the relative humidity changed between
43.7% and 100%. Initial model with parameters obtaining
from technical documentation and monitored data did not
0
10
20
30
40
50
60
70
80
90
100
°C /
%
Date
Ambient Temperature (°C) Relative Humidity (%)
Fig. 4. Weather data collection from 8th to 19th May 2015
acquire the good coincidence with data collection since the
defrost algorithm was assumed. Therefore, such parameters
related to defrost were chosen to optimize the cost function.
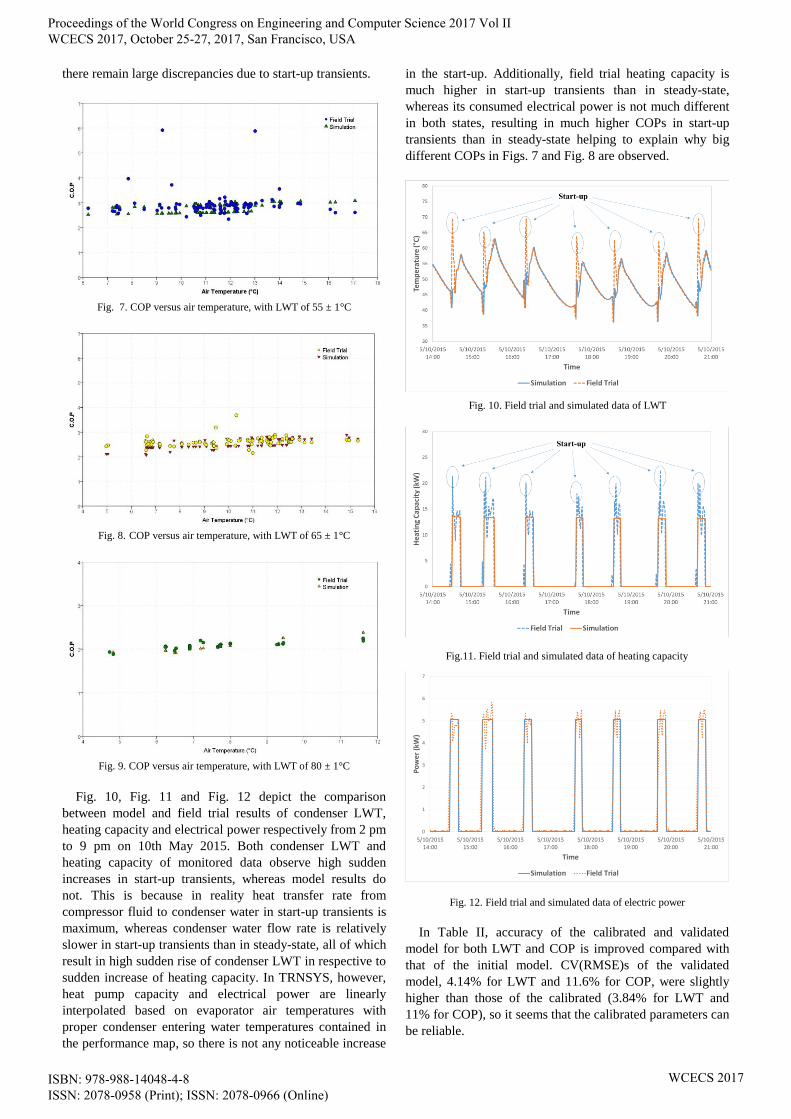
C. Heat Pump Model Results and Discussion
Figs. 5 and Fig. 6 show the quality of simulation versus
monitoring results in terms of LWT at the condenser side.
Results show strong agreements for calibration and
validation, with R2 values of 0.961 and 0.955 respectively.
Fig. 5. Simulation versus monitoring results of LWT for calibrated model
Fig. 6. Simulation versus monitoring results of LWT for validated model
To assess if adapted performance map of the heat pump
model is acceptable with monitored data, COPs versus air
temperatures at different condenser LWTs are analyzed. Fig.
7 and Fig. 8 illustrate all data points of COP values versus
air temperatures at LWT of 55 ± 1°C and 65 ± 1°C,
respectively. It is likely that all simulated COPs coincide
with most of experimental COPs except some out-of-fit
points which can be described by start-up duration of the
heat pump. This phenomenon is further explained in the next
paragraph. TRNSYS Type 1271 cannot reflect start-up
transients so that those large differences remain. Looking at
Fig. 9, all COP values of the model with LWT of 80 ± 1°C
highly correlate with those of the monitored data. In short, it
can be said that the adapted performance map relatively
coincides with the monitored data in steady-state, whereas
Fig. 3. HTAWHP model scheme for calibration and validation in TRNSYS
Proceedings of the World Congress on Engineering and Computer Science 2017 Vol II WCECS 2017, October 25-27, 2017, San Francisco, USA
ISBN: 978-988-14048-4-8 ISSN: 2078-0958 (Print); ISSN: 2078-0966 (Online)
WCECS 2017
there remain large discrepancies due to start-up transients.
Fig. 7. COP versus air temperature, with LWT of 55 ± 1°C
Fig. 8. COP versus air temperature, with LWT of 65 ± 1°C
Fig. 9. COP versus air temperature, with LWT of 80 ± 1°C
Fig. 10, Fig. 11 and Fig. 12 depict the comparison
between model and field trial results of condenser LWT,
heating capacity and electrical power respectively from 2 pm
to 9 pm on 10th May 2015. Both condenser LWT and
heating capacity of monitored data observe high sudden
increases in start-up transients, whereas model results do
not. This is because in reality heat transfer rate from
compressor fluid to condenser water in start-up transients is
maximum, whereas condenser water flow rate is relatively
slower in start-up transients than in steady-state, all of which
result in high sudden rise of condenser LWT in respective to
sudden increase of heating capacity. In TRNSYS, however,
heat pump capacity and electrical power are linearly
interpolated based on evaporator air temperatures with
proper condenser entering water temperatures contained in
the performance map, so there is not any noticeable increase
in the start-up. Additionally, field trial heating capacity is
much higher in start-up transients than in steady-state,
whereas its consumed electrical power is not much different
in both states, resulting in much higher COPs in start-up
transients than in steady-state helping to explain why big
different COPs in Figs. 7 and Fig. 8 are observed.
0
1
2
3
4
5
6
7
5/10/201514:00
5/10/201515:00
5/10/201516:00
5/10/201517:00
5/10/201518:00
5/10/201519:00
5/10/201520:00
5/10/201521:00
Po
we
r (k
W)
Time
Simulation Field Trial
Fig. 12. Field trial and simulated data of electric power
In Table II, accuracy of the calibrated and validated
model for both LWT and COP is improved compared with
that of the initial model. CV(RMSE)s of the validated
model, 4.14% for LWT and 11.6% for COP, were slightly
higher than those of the calibrated (3.84% for LWT and
11% for COP), so it seems that the calibrated parameters can
be reliable.
Fig. 10. Field trial and simulated data of LWT
Fig.11. Field trial and simulated data of heating capacity
Proceedings of the World Congress on Engineering and Computer Science 2017 Vol II WCECS 2017, October 25-27, 2017, San Francisco, USA
ISBN: 978-988-14048-4-8 ISSN: 2078-0958 (Print); ISSN: 2078-0966 (Online)
WCECS 2017

TABLE II
RESULTS OF HEAT PUMP MODEL
CV(RMSE) Initial Model Calibrated Model Validated Model
LWT 6.26% 3.84% 4.14%
COP 17.69% 11% 11.6%
IV. STORAGE MODEL VALIDATION
A. Storage Model Description
TRNSYS Type 534 from TESS libraries [9] was utilized
to model the storage tank. There were seven thermocouples
along the vertical line of the cylinder so that seven nodes
were set up in the tank model. Two coiled tube heat
exchangers were obtained for charging and discharging the
tank. The charging heat exchanger was immersed in the
three nodes placed at the tank's bottom, whilst the
discharging was in the other four nodes.
The tank was heated up to 75°C by the heat pump during
night time and then in standby mode (3.5 hours on the
average). When the first heating demand of the house was
called, the tank discharged heat to the house until its
temperature dropped to 55°C. After that, the storage was in
standby mode (the average of 18 hours) waiting for the heat
pump charging again. Based on this operation, experimental
data can allow the storage model to be validated as of three
modes: (1) charge, (2) discharge and (3) thermal standby
losses. There was a pump forcing convection of water inside
the tank. Consequently, a circulating pump Type 3d [3] was
implemented into the model to prevent stratification effect.
This pump was run only in the period of charge and
discharge so that stratification process only happened in
standby mode around 18 hours of a day.
B. Input and Output for Model Validation
Inputs of the storage model were obtained as follows:
➢ Inlet of the charging heat exchanger was connected to
outlet of the validated heat pump model including
water flow rates and condenser leaving water
temperatures.
➢ Experimental data of water flow rates and inlet
temperatures of the discharging heat exchanger were
obtained as input data for that heat exchanger of the
model.
Predicted seven node temperatures as well as outlet
temperatures of charging and discharging heat exchanger
were compared with experimental data. Those parameters
were chosen for validation since they can influence entering
water temperatures of the validated heat pump in charging
mode and inlet temperatures of radiators in discharging
mode for future work, all of which may cause propagation
uncertainties in the future building model.
C. Storage Model Results and Discussion
Normal operation for charging and discharging tank is
repeatable every day, so model results of one particular day
(8th May 2015) is chosen for model validation analysis.
Tank node temperatures between model and monitoring
results on 8th May 2015 are illustrated in Fig. 13, with only
temperatures at top and bottom nodes shown to make the
graph easier to look. Both the charge (1.02 am to 2.10 am)
and discharge (5.29 am to 6.18 am) show a good agreement
between field trial and model. The standby loss 1 attains a
good correlation, but there are some discrepancies during the
standby loss 2 (after 6.18 am) and stratification is noticed.
The simulated top node temperature in standby loss 2
gradually overestimates the monitored top temperature with
the maximum of 2.5 °C, whereas bottom temperatures seem
to coincide within 1 °C uncertainty.
The differences during standby loss 2 were highly
challenging to address, although the model parameters were
fine-tuning. This is because the tank nodes in TRNSYS were
40
45
50
55
60
65
70
75
80
Tem
pe
ratu
re (
°C)
Time (hr)
Simulation - Top Monitor - Top Monitor - Bottom Simulation - Bottom
Charge
DischargeStandby Loss 2
Standby Loss 1
Fig. 13. Simulated and monitored temperatures at top and bottom nodes on 10th May 2015
Proceedings of the World Congress on Engineering and Computer Science 2017 Vol II WCECS 2017, October 25-27, 2017, San Francisco, USA
ISBN: 978-988-14048-4-8 ISSN: 2078-0958 (Print); ISSN: 2078-0966 (Online)
WCECS 2017
consistent, while the experiment measured temperatures at
different heights of the tank by thermocouples which were
not uniform. In other words, there were inlets/outlets of heat
exchangers and supply water along the tank which caused
natural heat conduction with connected pipes as well as heat
convection within the tank, and therefore temperature at
thermocouples close to those pipes decreased more suddenly
than temperature at others. For example, top tank node
temperature of monitored data in Fig. 13 decreased quickly
after 4 pm. Such TRNSYS tank model, in contrast, did not
consider this effect. Fortunately, these discrepancies were
minor, and it was also mentioned in the work [18].
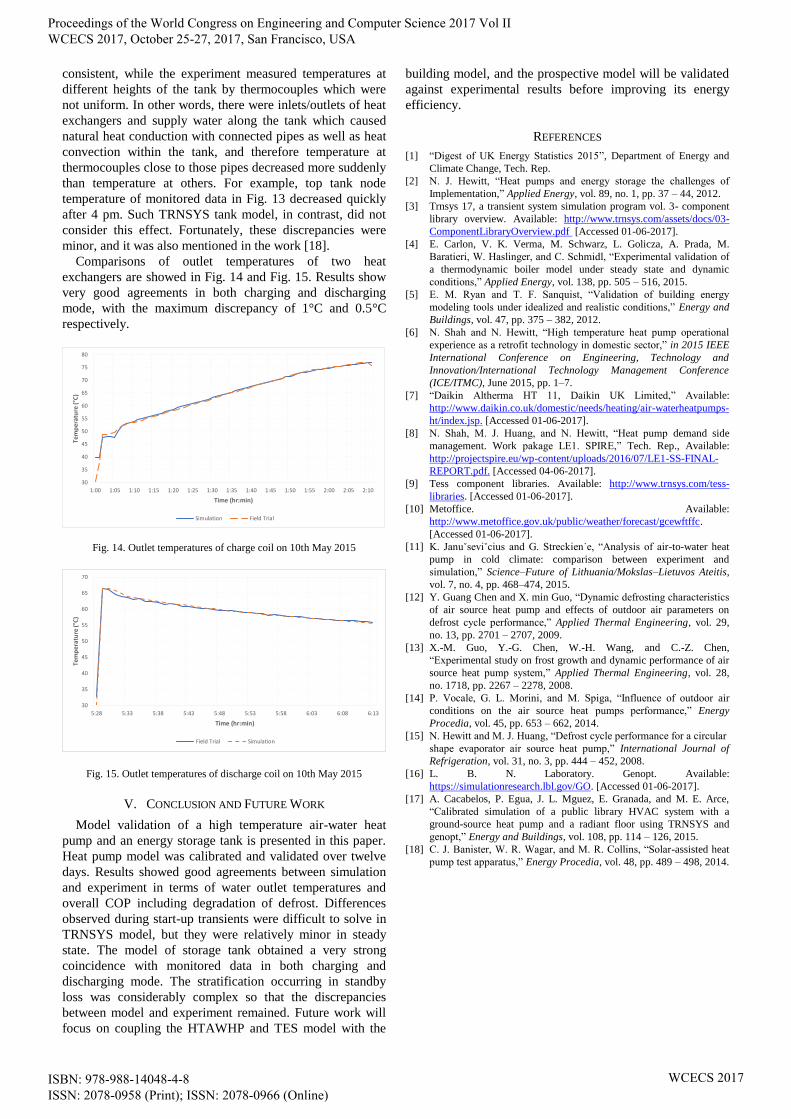
Comparisons of outlet temperatures of two heat
exchangers are showed in Fig. 14 and Fig. 15. Results show
very good agreements in both charging and discharging
mode, with the maximum discrepancy of 1°C and 0.5°C
respectively.
30
35
40
45
50
55
60
65
70
75
80
1:00 1:05 1:10 1:15 1:20 1:25 1:30 1:35 1:40 1:45 1:50 1:55 2:00 2:05 2:10
Tem
per
atu
re (
°C)
Time (hr:min)
Simulation Field Trial
Fig. 14. Outlet temperatures of charge coil on 10th May 2015
30
35
40
45
50
55
60
65
70
5:28 5:33 5:38 5:43 5:48 5:53 5:58 6:03 6:08 6:13
Tem
per
atu
re (
°C)
Time (hr:min)
Field Trial Simulation
Fig. 15. Outlet temperatures of discharge coil on 10th May 2015
V. CONCLUSION AND FUTURE WORK
Model validation of a high temperature air-water heat
pump and an energy storage tank is presented in this paper.
Heat pump model was calibrated and validated over twelve
days. Results showed good agreements between simulation
and experiment in terms of water outlet temperatures and
overall COP including degradation of defrost. Differences
observed during start-up transients were difficult to solve in
TRNSYS model, but they were relatively minor in steady
state. The model of storage tank obtained a very strong
coincidence with monitored data in both charging and
discharging mode. The stratification occurring in standby
loss was considerably complex so that the discrepancies
between model and experiment remained. Future work will
focus on coupling the HTAWHP and TES model with the
building model, and the prospective model will be validated
against experimental results before improving its energy
efficiency.
REFERENCES
[1] “Digest of UK Energy Statistics 2015”, Department of Energy and
Climate Change, Tech. Rep.
[2] N. J. Hewitt, “Heat pumps and energy storage the challenges of
Implementation,” Applied Energy, vol. 89, no. 1, pp. 37 – 44, 2012.
[3] Trnsys 17, a transient system simulation program vol. 3- component
library overview. Available: http://www.trnsys.com/assets/docs/03-
ComponentLibraryOverview.pdf [Accessed 01-06-2017].
[4] E. Carlon, V. K. Verma, M. Schwarz, L. Golicza, A. Prada, M.
Baratieri, W. Haslinger, and C. Schmidl, “Experimental validation of
a thermodynamic boiler model under steady state and dynamic
conditions,” Applied Energy, vol. 138, pp. 505 – 516, 2015.
[5] E. M. Ryan and T. F. Sanquist, “Validation of building energy
modeling tools under idealized and realistic conditions,” Energy and
Buildings, vol. 47, pp. 375 – 382, 2012.
[6] N. Shah and N. Hewitt, “High temperature heat pump operational
experience as a retrofit technology in domestic sector,” in 2015 IEEE
International Conference on Engineering, Technology and
Innovation/International Technology Management Conference
(ICE/ITMC), June 2015, pp. 1–7.
[7] “Daikin Altherma HT 11, Daikin UK Limited,” Available:
http://www.daikin.co.uk/domestic/needs/heating/air-waterheatpumps-
ht/index.jsp. [Accessed 01-06-2017].
[8] N. Shah, M. J. Huang, and N. Hewitt, “Heat pump demand side
management. Work pakage LE1. SPIRE,” Tech. Rep., Available:
http://projectspire.eu/wp-content/uploads/2016/07/LE1-SS-FINAL-
REPORT.pdf. [Accessed 04-06-2017].
[9] Tess component libraries. Available: http://www.trnsys.com/tess-
libraries. [Accessed 01-06-2017].
[10] Metoffice. Available:
http://www.metoffice.gov.uk/public/weather/forecast/gcewftffc.
[Accessed 01-06-2017].
[11] K. Januˇseviˇcius and G. Streckien˙e, “Analysis of air-to-water heat
pump in cold climate: comparison between experiment and
simulation,” Science–Future of Lithuania/Mokslas–Lietuvos Ateitis,
vol. 7, no. 4, pp. 468–474, 2015.
[12] Y. Guang Chen and X. min Guo, “Dynamic defrosting characteristics
of air source heat pump and effects of outdoor air parameters on
defrost cycle performance,” Applied Thermal Engineering, vol. 29,
no. 13, pp. 2701 – 2707, 2009.
[13] X.-M. Guo, Y.-G. Chen, W.-H. Wang, and C.-Z. Chen,
“Experimental study on frost growth and dynamic performance of air
source heat pump system,” Applied Thermal Engineering, vol. 28,
no. 1718, pp. 2267 – 2278, 2008.
[14] P. Vocale, G. L. Morini, and M. Spiga, “Influence of outdoor air
conditions on the air source heat pumps performance,” Energy
Procedia, vol. 45, pp. 653 – 662, 2014.
[15] N. Hewitt and M. J. Huang, “Defrost cycle performance for a circular
shape evaporator air source heat pump,” International Journal of
Refrigeration, vol. 31, no. 3, pp. 444 – 452, 2008.
[16] L. B. N. Laboratory. Genopt. Available:
https://simulationresearch.lbl.gov/GO. [Accessed 01-06-2017].
[17] A. Cacabelos, P. Egua, J. L. Mguez, E. Granada, and M. E. Arce,
“Calibrated simulation of a public library HVAC system with a
ground-source heat pump and a radiant floor using TRNSYS and
genopt,” Energy and Buildings, vol. 108, pp. 114 – 126, 2015.
[18] C. J. Banister, W. R. Wagar, and M. R. Collins, “Solar-assisted heat
pump test apparatus,” Energy Procedia, vol. 48, pp. 489 – 498, 2014.
Proceedings of the World Congress on Engineering and Computer Science 2017 Vol II WCECS 2017, October 25-27, 2017, San Francisco, USA
ISBN: 978-988-14048-4-8 ISSN: 2078-0958 (Print); ISSN: 2078-0966 (Online)
WCECS 2017