Embed Size (px)
Citation preview

1
High Speed Synchrotron X-ray Imaging Studies of the Ultrasound Shockwave
and Enhanced Flow during Metal Solidification Processes
D. Tan1, T. L. Lee1, J. C. Khong1, T. Connolley2, K. Fezzaa3, J. Mi1*
1University of Hull, Cottingham Road, Hull, East Yorkshire, HU6 7RX, UK
2Diamond Light Source, Didcot, Oxfordshire, OX11 0DE, UK 3Advanced Photon Source, Argonne National Laboratory, Argonne, Illinois 60439, USA
Abstract
The highly dynamic behaviour of ultrasonic bubble implosion in liquid metal, the multiphase
liquid metal flow containing bubbles and particles, and the interaction between ultrasonic waves
and semisolid phases during solidification of metal were studied in situ using the complementary
ultrafast and high speed synchrotron X-ray imaging facilities housed respectively at the
Advanced Photon Source, Argonne National Laboratory, US, and Diamond Light Source, UK.
Real-time ultrafast X-ray imaging of 135,780 frames per second (fps) revealed that ultrasonic
bubble implosion in a liquid Bi-8 wt. %Zn alloy can occur in a single wave period (30 kHz), and
the effective region affected by the shockwave at implosion was 3.5 times the original bubble
diameter. Furthermore, ultrasound bubbles in liquid metal move faster than the primary particles,
and the velocity of bubbles is 70 ~ 100% higher than that of the primary particles present in the
same locations close to the sonotrode. Ultrasound waves can very effectively create a strong
swirling flow in a semisolid melt in less than one second. The energetic flow can detach solid
particles from the liquid-solid interface and redistribute them back into the bulk liquid very
effectively.
The corresponding author: J.Mi, Email: [email protected], Tel: +44 01482 465670

2
Introduction
The transmission and attenuation of ultrasonic waves in a solid medium and its interactions with
the constituents inside solids are well understood, for example, ultrasound attenuation in steels [1]
and its synthetic effects on inorganic materials and metal powders [2, 3]. Based on those well-
developed theories, ultrasound-based imaging, non-destructive testing techniques and the
relevant instruments have been well developed and widely used in industry [4 - 7]. Similarly,
theories regarding the propagation of ultrasonic waves in a single phase liquid medium are also
well developed. Above a certain acoustic pressure threshold the Blake’s threshold [8],
ultrasound can generate bubbles in a liquid medium. The bubbles, driven by the alternating
acoustic pressure field in the liquid, can oscillate, grow, coalesce, and split, and under certain
conditions collapse violently. This is a process commonly known as ultrasonic cavitation and
bubble implosion [9]. Previous studies in the field of sonochemistry [10 - 13] revealed that
bubble implosion can generate a shockwave with an extremely high pressure (>1000 atm) and
temperature (>5000 K) immediately adjacent to the bubble surface, leading to complicated
sonochemical reactions. Ohl and Ikink [14] also reported that, when bubble implosion occurs
near a rigid interface, microjets with extremely high velocity can be created near the interface.
However, those studies were mainly carried out in light-transparent liquid media, such as water
or water based solutions [9, 15]. The dynamic behaviour of cavitation bubbles during
coalescence and splitting, especially at the instant of bubble implosion has not been fully
understood, because of the highly transient nature of cavitation, and the difficulties in developing
a predictive model to describe precisely the underlying governing physics [10].
A few attempts have been made using synchrotron X-ray imaging techniques to study ultrasound
bubbles in situ and in real-time [16], including the dynamics of bubble oscillation and bubble
implosion in opaque materials such as liquid metals [17, 18]. One of the driving forces for such
studies is to understand the precise mechanism of how the solidification microstructure of metal
alloys, regardless of the alloy chemistry, is refined by applying ultrasonic waves into metal
alloys during the solidification process. Laboratory-based research in this field started in 1930s,
and a wide range of fundamental and applied research on ultrasonic processing of metal alloys
were conducted in Russia from the 1960s to the 1980s, which was well documented and
reviewed in a new book by the Eskins [8].

3
In the past ten years or so, the global demand for developing and adopting environmental
friendly and sustainable technologies for metal manufacturing has stimulated a worldwide
resurgence in this research field. The effectiveness of degassing and grain refinement using
ultrasound has been demonstrated in several alloy systems, including Al [19, 24], Mg [20, 21],
Sn [22], and Fe [23] based alloys. Generally, three mechanisms have been proposed for the
underlying physics of grain refinement: (1) the enhancement of homogeneous nucleation because
of bubble implosion induced high pressure, which effectively increases the melting point of the
metal alloy at the region very close to the bubble and therefore increase the level of undercooling
for nucleation [25, 26]; (2) the activation of potential inoculating particles for heterogeneous
nucleation [8, 23], and (3) grain multiplication due to dendrite fragmentation [27 - 30]. However,
almost all previous research has been based on post-mortem microstructure analysis made on the
solidified samples, linking the results to the ultrasound parameters applied, including ultrasound
power, frequency, duration, the melt temperature, etc. There have been hardly any systematic
studies using in situ observation of the real-time dynamic interactions between ultrasound
bubbles and the liquid and solid phases, apart from very limited work on organic-transparent
alloys [28, 30]. Hence the relative importance of the above grain refinement mechanisms has
never been fully clarified, and the industrial uptake of this technology is therefore stalled.
In this paper, we used high speed synchrotron X-ray imaging techniques to study in situ the
highly dynamic behaviour of bubble implosion in liquid metal, the enhanced metal flow due to
ultrasonic waves, and the interaction between the metal flow and semisolid phases during the
solidification process. Information was extracted from the real-time image sequences to provide
quantitative information on the key mechanisms that govern ultrasound induced grain refinement
in metallic systems.
Experiment
Ultrafast and high speed synchrotron X-ray imaging beamlines
The ultrafast and high speed synchrotron X-ray imaging experiments were conducted at sector
32-ID-B of the Advanced Photon Source (APS), Argonne National Laboratory, US and the Joint

4
Environmental, Engineering and Processing (JEEP) beamline (I12) of Diamond Light Source
(DLS), UK.
At APS, the storage ring has a circumference of 1104 m and is filled with 7 GeV electrons from
the booster. It provides, in the western hemisphere, the brightest synchrotron X-ray beam with a
peak irradiance of 1014 photon/s/mm2/0.1%bw [31]. The storage ring can be operated in a hybrid
filling mode, in which most of the electron current is stored in the “long” electron bunch that
generates a 500 ns X-ray pulse with an intensity 6 times higher than that obtained in the uniform
filling mode [31, 32]. Sector 32-ID-B is a dedicated undulator source designed to fully utilise the
500 ns X-ray pulse by synchronizing the X-ray pulse from the storage ring with the ultrafast
shutter and the camera on the beamline. The 500 ns X-ray pulse is circulating in the storage ring
and comes around in every 3.68 µs, delivering an effective image acquisition rate of up to
271,554 fps with a spatial resolution of 1 μm/pixel dependant on the field of view. The
synchronization ensures that the image of an object is taken within the 500 ns exposure time,
providing an image temporal resolution of ~ 500 ns regardless of the frame acquisition rate. This
is the highest among the Synchrotron X-ray based imaging beamlines around the world, only
inferior to the X-ray free electron laser based imaging technique, such as those available at the
Linac Coherent Light Source at Stanford University [33, 34].
DLS, the UK’s national synchrotron light source, has a 3 GeV electron storage ring with a
circumference of 562 m. The I12 JEEP beamline is a dedicated high energy instrument on a 4.2
T wiggler source, offering white or monochromatic X-ray beams between 50 and 150 keV for
imaging, diffraction and tomography experiments. I12 has a large beam size (up to 50 mm × 12
mm in Experimental Hutch 1) and an X-ray imaging system with interchangeable objective
lenses. The imaging system allows users to automatically select different image magnifications
and hence fields of view. (We typically chose a field of view of 6.6 × 5.4 mm with a spatial
resolution of 12.2 μm/pixel versus the 1 × 1 mm with a spatial resolution of 1 μm/pixel at 32-ID-
B of APS). The wider field of view on I12 is therefore suitable for studying the collective
behaviour of bubble clouds and their interactions with the metal flow and semisolid phases.
Feasible acquisition speeds are dependent on sample attenuation and region of interest cropping.
In our experiments we used up to 2000 fps with filtered white beam (fixed filtration of 2.2 mm
diamond, 5.5 mm SiC, and optional filtration of 6 mm Cu plate).

5
The experimental apparatus and the set up at the beamlines
Fig. 1(a) is a photo showing the experimental apparatus and the set up at 32-ID-B of APS. A
similar set up was used at I12 JEEP of DLS. The custom-made experimental apparatus has two
key elements: (1) a specially-made furnace and a purposely-designed quartz tube container for
melting and holding metal alloys; and (2) an ultrasound processor (UP100H from Hielscher) and
a sonotrode to transmit ultrasonic waves into the metal alloys held inside the quartz tubes.
The furnace consists of four plates made from machinable ceramic (Duratec 750), including 1
front plate and 1 back plate with the same dimension of 120 mm (width) × 120 mm (height) × 20
mm (thickness); and 2 side plates with the same dimension of 35 mm (width) × 120 mm (height)
× 20 mm (thickness). Holes of 10 mm in diameter were drilled through the thickness of the plates
to accommodate six cartridge heaters with 2 seated inside the front plate, 2 inside the back plate,
and 1 inside each of the side plates. Each cartridge heater is 9 mm in diameter and 52 mm long
with a heating power of 300 W. The plates can be flexibly assembled around the quartz tube to
form a rectangular enclosure to act as a furnace (Fig. 1(a) and 1(c)). The six cartridge heaters can
deliver a heat power of 1.8 kW and heat the samples to 1073 K without difficulty. Windows of 5
mm (width) × 30 mm (length) were machined along the central symmetrical lines of the front
and back plates to allow X-ray to pass through the furnace and onto the thin channel area (~300
µm thick) of the quartz tube (Fig. 1(c)) which was made using the following procedure. Firstly,
two rectangular thin quartz sheets (15 × 10 × 1.2 mm) were put in parallel together with a gap of
~300 µm in between. Secondly, the edges along the 10 mm side of the two sheets were welded
together using a gas torch to form the thin channel of ~300 µm internal gap. Finally, the two
openings of the thin channel along the 15 mm side were linked and welded onto two 40 mm long
quartz tubes (13 mm outside diameter and 1.5 mm wall thickness from Robson ScientificTM).
Careful operations were carried out in the quartz softening temperature range to deform one end
of the quartz tubes into a wedge-shaped transition area in order to fit smoothly and then welded
together with the thin channel. The photos in Fig. 1(c) show the typical quartz tubes with the thin
channel in the middle which were all made in the Glass Workshop housed at the Department of
Chemistry, University of Hull. The ~300 µm internal gap in the thin channel area is wide enough
to allow the ultrasonic bubbles generated immediately under the sonotrode tip (Fig. 1(c)) to pass

6
through the channel, while thin enough to allow X-rays to penetrate the metal alloy held inside
the channel with enough photon flux to form images at an acquisition rate of up to 271,554 fps.
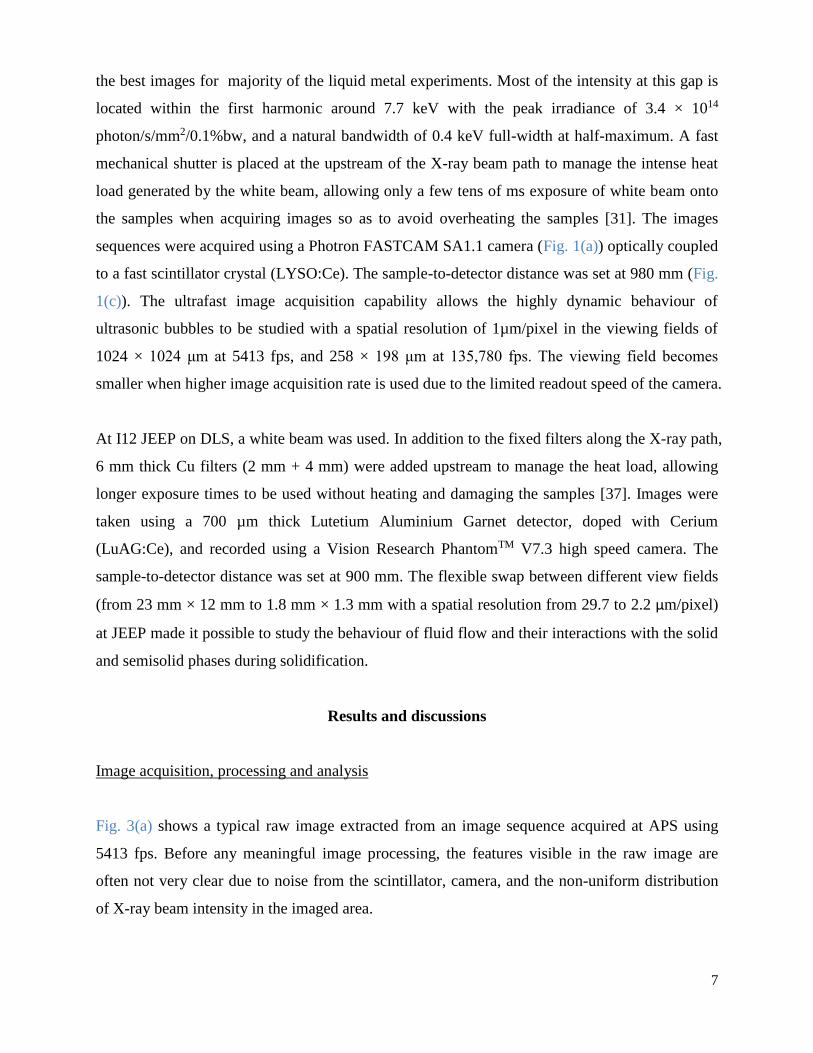
A Bi 8 wt. % Zn alloy that made from high purity elemental Bi (99.999%) and Zn (99.99%)
was used in the experiment. The phase diagram of Bi-Zn system can be found in Fig.2. The alloy
was chosen because of its low melting temperature, and the adequate X-ray absorption contrast
between Bi and Zn for high speed synchrotron X-ray imaging. Three 250 µm diameter K-type
thermocouples were placed at the top (TC1), middle (TC2) and bottom (TC3) positions inside
the thin channel (Fig. 1(c)) to monitor and record the temperatures of the alloys during melting
and cooling operations. The desired temperature gradient in the alloy inside the thin channel was
controlled by (1) adjusting the position of the quartz tube relative to the cartridge heaters, and (2)
placing a cold brass rod (ф9 × 15 mm) below the thin channel to act as a heat sink (Fig. 1(c)). By
imposing a suitable temperature gradient, a clear liquid-to-solid transition zone can be purposely
created in the middle of the thin channel, for example, at the location around TC2 as shown later
in Fig. 6, allowing the characteristics and the growth of a liquid-solid (L-S) interface and its
interactions with the ultrasonic bubbles and the enhanced flow to be studied in situ.
An UP100H ultrasound processor (Fig. 1(a)) made by HielscherTM was used in the experiment. It
has a fixed frequency of 30 kHz, and adjustable input power of 0 – 100 W with a maximum
acoustic power density of 600 W/cm2. Sonotrodes of 74 mm long with a tip diameter of either
0.3 or 2 mm were used and positioned at the wedge area above the thin channel to transmit
ultrasonic waves into the liquid metal held inside the thin channel. The ultrasound processor was
mounted on a precision linear stage, and its vertical movement was independent from that of the
sample stage, facilitating imaging with X-rays either at the tip of the sonotrodes or at the area of
interest within the thin channel. The on/off switching and the duration of the applied ultrasonic
waves were controlled by a custom-designed relay apparatus, operated from outside the
experimental hutch.
The experimental parameters for ultrafast and high speed imaging
At 32-ID-B of APS, a white beam with the undulator gaps set to 14 to 18 mm were used in the
experiments, and it was found that the energy spectrum at 18 mm undulator gap (Fig. 1(b)) gave
7
the best images for majority of the liquid metal experiments. Most of the intensity at this gap is
located within the first harmonic around 7.7 keV with the peak irradiance of 3.4 × 10¹⁴
photon/s/mm2/0.1%bw, and a natural bandwidth of 0.4 keV full-width at half-maximum. A fast
mechanical shutter is placed at the upstream of the X-ray beam path to manage the intense heat
load generated by the white beam, allowing only a few tens of ms exposure of white beam onto
the samples when acquiring images so as to avoid overheating the samples [31]. The images
sequences were acquired using a Photron FASTCAM SA1.1 camera (Fig. 1(a)) optically coupled
to a fast scintillator crystal (LYSO:Ce). The sample-to-detector distance was set at 980 mm (Fig.
1(c)). The ultrafast image acquisition capability allows the highly dynamic behaviour of
ultrasonic bubbles to be studied with a spatial resolution of 1µm/pixel in the viewing fields of
1024 × 1024 μm at 5413 fps, and 258 × 198 μm at 135,780 fps. The viewing field becomes
smaller when higher image acquisition rate is used due to the limited readout speed of the camera.
At I12 JEEP on DLS, a white beam was used. In addition to the fixed filters along the X-ray path,
6 mm thick Cu filters (2 mm + 4 mm) were added upstream to manage the heat load, allowing
longer exposure times to be used without heating and damaging the samples [37]. Images were
taken using a 700 µm thick Lutetium Aluminium Garnet detector, doped with Cerium
(LuAG:Ce), and recorded using a Vision Research PhantomTM V7.3 high speed camera. The
sample-to-detector distance was set at 900 mm. The flexible swap between different view fields
(from 23 mm × 12 mm to 1.8 mm × 1.3 mm with a spatial resolution from 29.7 to 2.2 μm/pixel)
at JEEP made it possible to study the behaviour of fluid flow and their interactions with the solid
and semisolid phases during solidification.
Results and discussions
Image acquisition, processing and analysis
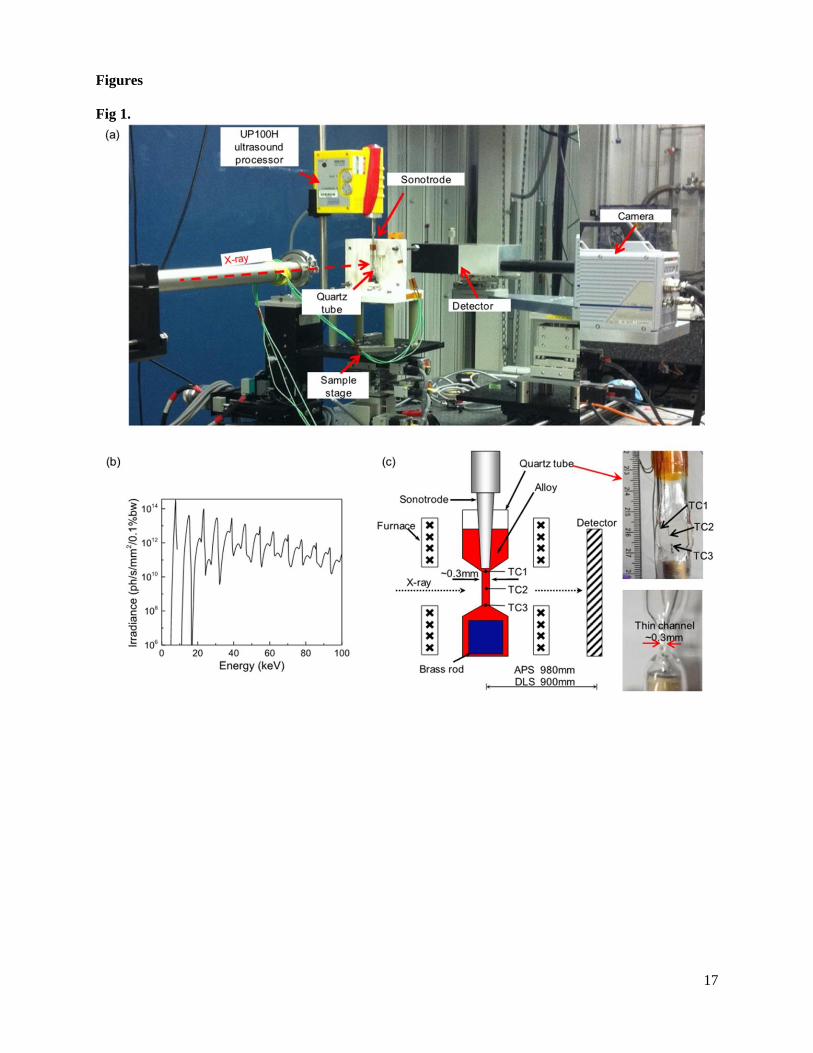
Fig. 3(a) shows a typical raw image extracted from an image sequence acquired at APS using
5413 fps. Before any meaningful image processing, the features visible in the raw image are
often not very clear due to noise from the scintillator, camera, and the non-uniform distribution
of X-ray beam intensity in the imaged area.

8
We therefore used the relevant functions available in the Matlab® image processing toolbox to
process the images. Firstly, a clear and uniform background image obtained from a pure liquid
(Fig. 3(b)) was subtracted from the raw image (Fig. 3(a)). The image artefacts caused by the
defects on the scintillator, or strip noises due to the camera operated at high frame rate were
therefore removed or minimized so as to reveal the real features more clearly (Fig. 3(c)).
Secondly, the build-in band-pass filter in Matlab® [38] was applied to Fig. 3(c) to enhance the
contrast (Fig. 3(d)). Finally a binary operation was applied on Fig. 3(d) to clearly segment the
bubbles and particles (Fig. 3(e)) for any further statistical analysis. To maintain consistency, the
same image processing parameters, e.g. the minimum and maximum grey scales and frequency,
were used for all images in the same image sequence.
We also developed a Matlab® program to extract the time-resolved information of every bubble
and particle in the image sequence, e.g. the shape and centre location (Fig. 3(f)), trajectory and
velocity of each bubble and particle. For example, five particles marked P1, P2, P3, P4 and P5 in
Fig. 3(e) were selected, and their trajectories were calculated using the standard 4 frame tracking
algorithm [39] based on the time-resolved locations of the target objects in the consecutive
images by estimating their most probable path and plotted in Fig. 3(g). The bubbles or particles
velocities can be calculated by using the translation distance over the time interval between the
consecutive images. However, any movement in the thickness direction cannot be obtained
because of the nature of the 2D images. Actually the geometrical design of the thin channel
ensured that the ultrasound wave and the associated fluid moved downwards without any
noticable movement in the thickness direction, therefore the relative movement of the particles
and the bubbles in the thickness direction can be ignored in this case.
Bubble implosion and shockwave in liquid metal
Fig. 4(a) – (f) show six images in a single wave period (33.3 μs for the 30 kHz ultrasonic wave)
extracted from an image sequence captured at APS using 135,780fps in a liquid Bi 8 wt. %Zn
alloy at 700 K. The temperature was measured by TC1, immediately below the sonotrode tip. In
this case, a 2 mm diameter tip sonotrode and an input ultrasound power of 20 W were used. At
this ultrafast image acquisition rate, the up-and-down cyclic movement of the sonotrode tip in a
single wave period can be clearly tracked and then linked to the corresponding acoustic pressure

9
as showed in details in Fig. 4(g). The sonotrode tip position (black square in Fig. 4(g)) measured
from each image followed exactly the sine wave of the ultrasound.
Fig. 4(a) – (c) show that, during the upwards half cycle, the sonotrode tip moved from position a
to b and then to c (Fig. 4(g)). The corresponding acoustic pressure decreased from near the
maximum positive pressure to near the maximum negative pressure (Fig. 4(g)). As the result, a
bubble of ~12 μm in radius (Fig. 4(b)) grew to ~23 μm in radius in 7.4 μs (Fig. 4(c)).
After reaching the highest position (position c in Fig. 4(g)), the sonotrode started the downwards
half cycle, and the acoustic pressure increased and compressed the bubble in Fig. 4(c) to a radius
of ~19 μm in 7.4μs (Fig. 4(d)). As the sonotrode reached almost the lowest position, the
maximum compressive acoustic pressure was reached, forcing the bubble to implode violently
and forming a blurred-and-misty circular region as shown in Fig. 4(e). In the next image (Fig.
4(f)), i.e. 7.4 µs after the implosion, no residual “debris” or tiny bubbles were observed, again
most likely because of the limitation of the spatial resolution.
Fig. 4(h) shows two curves, d-d and e-e, representing the counts of grey level for the dash lines
marked d-d in Fig. 4(d) and e-e in Fig. 4(e). The curve d-d clearly shows that, for the bubble in
Fig. 4(d), there is a relatively constant but higher grey value (~250) region in the center,
representing the main body of the bubble filled most likely with any diffused gas from the liquid
metal. The two regions with a steep change of grey value on either side the curve d-d represented
the boundary of the bubble, and actually it was the bubble wall separating the liquid metal and
the gas trapped inside the bubble. Therefore, the distance marked as A (~38μm) was actually the
diameter of the bubble in Fig. 4(d).
In contrast, the blurred-and-misty circular region in Fig. 4(e) did not have such a distinct bubble
wall. The curve e-e in Fig. 4(h) shows that, there was a relatively high grey value (~ 225) area in
the center marked by C with a distance of ~17 μm; and outside C the grey values followed
gradually reduced slopes. Again, using the Gilmore model [18], the bubble diameter instantly
before the bubble implosion is estimated at 20 μm, which is very close to measured distance C in
Fig. 4(h). More interestingly, the tiny peak of the grey value pointed by the blue arrow also
indicated that there could be tiny bubble debris or a new nucleus present at the center due to the
implosion.

10
Apparently, the grey values of the curve e-e outside distance C were higher than that of the liquid
metal, but lower than that of the bubble, indicating that there was a gradual change of X-ray
absorption capability (a gradual change of materials density) for the materials along the area
delineated by line e-e. This phenomenon is most likely caused by the shockwave produced at
bubble implosion as explained below. The pressure created by the shockwave at the bubble wall
expelled the gas trapped inside the original bubble into the nearby liquid and formed a gas-liquid
mixture with its density lower than that of the liquid metal but higher than that of the gas
originally trapped inside the bubble. The gas-liquid mixture region was actually reflected in X-
ray image as the blurred-and-misty circular region showed in Fig. 4(e) which spanned from an
initial diameter of ~17 μm to ~60 μm as marked by B in the curve e-e in Fig. 4(h). Clearly, in
this case, B represented the upper limit of the region which the bubble implosion (shockwave)
reached, which is about 3.5 times the diameter of the bubble immediately before implosion. The
in situ imaging study also confirmed that bubble implosion in liquid metal can occur in a single
wave period.
Multiphase flow under ultrasonic waves
Ultrasonic bubbles are often created collectively in a condition where the critical acoustic
pressure threshold is exceeded [8]. Their dynamic interaction with the liquid metal and any
primary particles in the liquid metal are very important for understanding the ultrasound
processing of liquid metals [2, 3]. Fig. 5(a) – (c) show a series of image sequences captured at
APS using 5413 fps at 0.5, 2.5, and 4.5 mm below the sonotrode tip, respectively. The melt
temperatures measured at TC1, TC2 and TC3 were 650 K, 630K, 600K respectively, indicating
that the alloy was in a fully liquid state. A sonotrode with a tip diameter of ~0.3 mm and 20 W
input power were used in the experiment to allow the dynamic behaviour of bubbles and
particles surrounding the sonotrode tip to be imaged within the limited field of view, i.e. 1 mm ×
1 mm at 5413 fps. Fig. 5(a-1) shows that, although the alloy is in a liquid state, some solid Zn
particles (pointed by the arrows in Fig. 5(a-1)) formed around the sonotrode tip because of the
relatively cold surface of the sonotrode tip. After applying ultrasound of 20 W, the Zn particles
were “shaken” off the tip and flew downward together with any ultrasound bubbles as shown in
Fig. 5(a-2) - (a-4). Due to the limited field of view (1 × 1 mm in this case), the behaviours of the
bubbles and particles further away from the sonotrode tip were imaged separately using the

11
identical melt conditions and ultrasound input power as that in Fig. 5(a). The typical image
sequences captured at 2.5 mm and 4.5 mm below the sonotrode tip are shown in Fig. 5(b) and
5(c), respectively. The image sequences taken at the different distances away from the sonotrode
tip allowed systematic and statistical datasets to be extracted from the images for studying
quantitatively the dynamic behaviours of the bubbles, the particles and the enhanced metal flow
under ultrasonic waves.
Firstly, the dynamic behaviours of an individual bubble and a particle were studied in detail by
extracting 8 images that contained a typical bubble and a typical Zn particle from the Fig. 5(b)
image sequence. The 8 selected images were enlarged and shown in Fig. 5(d) with the bubble
circled and marked B, and the particle boxed and marked P. Using the in-house Matlab® code,
the movement of B and P were tracked and their velocities were calculated and showed in Fig.
5(e). Clearly, B moved in a zigzag manner, while P travelled in a straight line, and the calculated
average velocity of B (0.26 m/s) was ~70% higher than that of P (0.15 m/s). These results
indicate that the alternating acoustic pressure affects much more the movement of bubbles than
that of the particle. Statistical analyses made on all the images and videos studied revealed that
the trajectories of the particles were either a straight line (Fig. 5(e)), or slightly curved paths (Fig.
3(g)), further confirming that the particles are mainly dragged and moved by the flow of liquid
metal, but not affected much by the alternating acoustic field.
To study the effect of ultrasound power on the multiphase flow, a new sample was studied using
an ultrasound input power of 60 W with all other experimental conditions unchanged (the same
alloys, temperatures, and beam conditions), and the results were compared with those obtained
from the case with 20 W ultrasound input powder. Fig. 5(f) summarises the calculated velocities
for the particles and bubbles in the images (> 20 particles and bubbles were measured in each
image sequence) captured at different locations below the sonotrode tip with the ultrasound input
powers of 20 and 60 W, respectively. The results show that the applied ultrasound power is one
of the dominant control parameters for the multiphase liquid metal flow containing bubbles and
particles. Both bubble and particle velocities increase with the increase of ultrasound power and
decrease at locations further away from the sonotrode tip. In all cases, the bubble velocity is 70 -
100% higher than the particle velocity at the location close to the sonotrode tip, but the
difference in velocity reduces gradually as it moves away from the sonotrode tip.

12
After studying and understanding the highly dynamic behaviour of bubbles and particles using
the ultrafast X-ray imaging capability at 32-ID-B of APS, we used the relatively slow speed
(~1500 fps), but larger viewing field imaging system available at I12 JEEP of DLS to study the
interaction between the ultrasound enhanced fluid flow and the L-S interface during the
solidification process. By carefully controlling a temperature gradient of ~3.9 K/mm for the
liquid held inside the thin channel, and imposing a constant cooling rate of 0.2 K/s, the liquid
metal was cooled to the semisolid temperature range with an L-S interface clearly formed near
the central region of the thin channel. Fig. 6(a-1) - (a-6) are the typical images captured at the
location ~ 4.5 mm below the sonotrode using 1500 fps (an exposure time of 660 μs) at DLS. A
sonotrode with a 2 mm diameter tip and an ultrasound input power of 60 W were used. The
temperature measured at TC2 (the center of the images) was 540 K. Fig. 6(a-1) shows that,
before applying ultrasound, the white Zn particles accounted for ~40% of the area below the L-S
interface in the viewing field. When ultrasound of 60 W input power was applied, a liquid jet
flow was created and shot down from the central region of the viewing field, expelling and
dispersing the Zn particles around, and forming a swirling flow at either side of the central line
of the image, that is, clockwise direction on the left and anti-clockwise direction on the right
(Fig. 6(a-2) – (a-4)). As the ultrasound continued, the Zn particles close to the L-S interface were
“flushed” away gradually by the swirling flow at either side. After 1 s (the preset time to stop the
ultrasound), a relatively stable and clear L-S interface was formed as shown in Fig. 6(a-5),
because the majority of the loose Zn particles floating above the L-S interface were “washed”
away, and replaced by a stream of clear liquid. Fig. 6(a-6) shows that, after the ultrasound was
stopped, the detached Zn particles continued to move up with a speed of ~0.003m/s driven by the
residual swirling flow and the buoyancy force. The “washed” away Zn particles could act as the
energy-favorable substrates for enhancing the nucleation of new grains in the bulk liquid.
Fig. 6(b) shows the flow velocity contour above the L-S interface when the fluid flow is
stabilized after the application of ultrasound for 500 ms. This velocity contour was calculated
based on the movement tracking of >100 particles of Zn in consecutive images of the image
sequence. At 2.5 mm below the sonotrode (near the top of Fig. 6(a)), a maximum flow velocity
of 0.25 m/s was established at the central region containing ~40% Zn particles (area fraction) in
just 500 ms. In just 1000 ms ultrasound processing, nearly 50% of the Zn particles in the viewing
field was washed away, with most of them being displaced within 500 ms (Fig. 6(a-3)), further

13
confirming that ultrasound enhanced fluid flow is very effective in dispersing and redistributing
primary solid particles in the bulk liquid.
Previous studies argued that the increase in temperature due to the application of ultrasound also
plays an important role in solute redistribution and remelting of any solid particles or dendritic
grains [8]. Our study shows that applying ultrasound indeed increased the temperature of the
liquid melt and the semisolid phases. Fig. 6(c) shows that initially the temperature difference
between TC1 and TC2 was ~ 12 K, and it was reduced continuously when the ultrasound was
applied until reached a relatively constant value of ~5 K after 1 s because the enhanced fluid
flows transported hotter liquid from top (TC1) regions towards the L-S interface (TC2).
However, the high speed image sequence shows that majority of the particles in the viewing field
were detached or loose within 500 ms after applying ultrasound (Fig. 6(a-3)) during which there
was hardly any obvious temperature increase (< 3K) at the L-S interface region (TC 2 in Fig.
6(c)). Hence the hydrodynamic force induced by the enhanced fluid flow plays a more dominant
role in dispersing and redistributing solid particles in the liquid metals.
Conclusion
Using the ultrafast synchrotron X-ray imaging facility at APS, the highly dynamic behaviour of
ultrasound bubble implosion in liquid metal was captured and studied in real-time. Bubble
implosion was found to occur in a single wave period (30 kHz), and the effective region affected
by the shockwave at implosion was ~3.5 times of the original bubble diameter.
Ultrasound bubbles in liquid metal move faster than the primary particles, that is, 70 ~ 100%
higher compared to the primary particles present in the same locations close to the sonotrode.
However, the difference in velocity reduced significantly at the locations further away from the
sonotrode tip.
Using the high speed Synchrotron X-ray imaging system with a relative large field of view at
DLS I12, the ultrasound enhanced fluid flow in a semisolid condition (during solidification of
metal) was studied in situ. The results show that the ultrasound enhanced swirling flow is a
dominant mechanism to detach the solid particles from the liquid-solid interface in just a few

14
hundreds of milliseconds, redistributing them very effectively back into the bulk liquid with the
possibility to act as the energy-favorable sites for nucleating new grains.
Acknowledgement
The authors would like to acknowledge the financial support from the U.K. Engineering and
Physical Sciences Research Council (Grant No. EP/L019965/1), The Royal Society Industry
Fellowship (for J Mi), and the Hull University & Chinese Scholarship Council (Hull-CSC) PhD
Studentship (for D. Tan). The awards of the synchrotron X-ray beam time (EE8542-1) by the
Diamond Light Source, UK, and the synchrotron X-ray beam time (GUP 23649 and GUP 26170)
by the Advanced Photon Source, Argonne National Laboratory, US are also gratefully
acknowledged. Use of the Advanced Photon Source, an Office of Science User Facility operated
for the U.S. Department of Energy (DOE) Office of Science by Argonne National Laboratory,
was supported by the U.S. DOE under Contract No. DE-AC02-06CH11357.
Special thanks also go to Julia Malle of Glass Workshop in the Department of Chemistry,
University of Hull, who has assisted on making the special quartz tube containers used in the in
situ synchrotron X-ray imaging studies.
References
1. R. L. Roderick and R. Truell: J. Appl. Phys., 1952, vol. 23, pp. 267-79.
2. K. S. Suslick, D. J. Casadonte, M. L. Green and M. E. Thompson: Ultrasonics, 1987, vol. 25, pp. 56-
59.
3. K. S. Suslick, S. Choe, A. A. Cichowlas and M. W. Grinstaff: Nature, 1991, vol. 353, pp. 414-16.
4. J. D. Achenbach and O. K. Parikh: Rev. Prog. Q., Springer US, 1991, pp. 1837-44.
5. H. R. Mayer, H. Lipowsky, M. Papakyriacou, R. Rösch, A. Stich and S. Stanzl-tschegg: Fatigue
Fract. Eng. M., 1999, vol. 22, pp. 591-99.
6. D. G. Shchukin, E. Skorb, V. Belova and H. Möhwald: Adv. Mater., 2011, vol. 23, pp. 1922-34.
7. J.Campbell: Int.Mater. Rev., 1981, vol. 26, pp. 77-108.
8. G. I. Eskin and D. G. Eskin: Ultrasonic Treatment of Light Alloy Melts, 2nd ed., CRC Press, Boca
Raton, Florida, US, 2015.
9. W. Lauterborn and T. Kurz: Rep. Prog. Phys., 2010, vol. 73, pp. 1-88.
10. K. S. Suslick and D. J. Flannigan: Annu. Rev. Phys. Chem., 2008, vol. 59, pp. 659-83.

15
11. M. L. Calvisi, O. Lindau, J. R. Blake and A. J. Szeri: Phys. Fluids, 2007, vol. 19, pp. 101-15.
12. D. J. Flannigan and K. S. Suslick: Nature, 2005, vol. 434, pp. 52-55.
13. K. S. Suslick, D. A. Hammerton and R. E. Cline: J. Am..Chem.Soc., 1986, vol. 108, pp. 5641-42.
14. C. D. Ohl and R. Ikink: Phys. Rev. Lett., 2003, vol. 90, pp. 21-24.
15. W. Lauterborn and C. D. Ohl: Ultrason. Sonochem., 1997, vol. 4, pp. 65-75.
16. T. L. Lee, J. C. Khong, K. Fezzaa and J. Mi: Mater. Sci. Forum, 2013, vol. 765, pp. 190-94.
17. H. Huang, D. Shu, Y. Fu, J. Wang and B. Sun: Ultrason. Sonochem., 2014, vol. 21, pp. 1275-78.
18. J. Mi, D. Tan and T. L. Lee: Metall. and Mater. Trans. B, 2014 (Opne Access published online 11
Dec 2014), DOI: 10.1007/s11663-014-0256-z.
19. X. Jian, H. Xu, T. T. Meek and Q. Han: Mater. Lett., 2005, vol. 59, pp. 190-93.
20. M. Qian and A. Ramirez: J. Appl.Phys., 2009, vol. 105, pp. 81-86.
21. M. K. Aghayani and B. Niroumand: J. Alloys Compd., 2011, vol. 509, pp. 114-22.
22. H. Chen, Z. Li, Z. Wu and Z. Zhang: J. Alloys Compd., 2005, vol. 394, pp. 282-85.
23. O. V. Abramov: Ultrasonics, 1987, vol. 25, pp. 73-82.
24. T. V. Atamanenko, D. G. Eskin, L. Zhang and L. Katgerman: Metall. Mater. Trans. A, 2010, vol. 41,
pp. 2056-66.
25. R. Hickling: Nature, 1965, vol. 206, pp. 915-17.
26. J. D. Hunt and K. A. Jackson: J. Appl. Phys., 1966, vol. 37, pp. 254-57.
27. B. Chalmers: Liquids: Structures, Properties, Solidlnteractions, 1st ed., Elsevier, Amsterdam, the
Netherlands, 1965.
28. G.M. Swallowe, J.E. Field, C.S. Rees, and A. Duckworth: Acta Mater., 1989, vol. 37, pp. 961–67.
29. R. Chow, R. Blindt, R. Chivers and M. Povey: Ultrasonics, 2005, vol. 43, pp. 227-30.
30. D. Shu, B. Sun, J. Mi and P.S. Grant: Metall. Mater. Trans. A, 2012, vol. 43, pp. 3755-66.
31. Y. Wang, X. Liu, K.S. Im, W. K. Lee, J. Wang, K. Fezzaa, D. S. Hung and J. R. Winkelman: Nat.
Phys., 2008, vol. 4, pp. 305-09.
32. K. Fezzaa, Y. Wang: Phys. Rev. Lett., 2008, vol. 100, pp. 13-16
33. R. Boll, D. Anielski, C. Bostedt, J. Bozek, L. Christensen, R. Coffee, S. De, P. Decleva, S. Epp, B.
Erk, L. Foucar, F. Krasniqi, J. Küpper, A. Rouzée, B. Rudek, A. Rudenko, S. Schorb, H. Stapelfeldt,
M. Stener, S. Stern, S. Techert, S. Trippel, M. Vrakking, J. Ullrich, and D. Rolles: Phys. Rev. A,
2013, vol. 88, no. 6, pp. 1402-1406
34. D. Milathianaki, S. Boutet, G. J. Williams, A. Higginbotham, D. Ratner, A. E. Gleason, M.
Messerschmidt, M. M. Seibert, D. C. Swift, P. Hering, J. Robinson, W. E. White, and J. S. Wark:
Science, 2013, vol. 342, pp. 220-23.
35. T. B. Massalski, and H. Okamoto: Binary Alloy Phase Diagrams, 2nd ed., Materials Park, ASM
International, USA, 1990.

16
36. J. Vizdal, M. H. Braga, A. Kroupa, K. W. Richter, D. Soares, L. F. Malheiros, and J. Ferreira:
Calphad, 2007,vol. 31, pp. 438-48.
37. M. Drakopoulos: http://www.diamond.ac.uk/Beamlines/Engineering-and-
Environment/I12/applications.html.
38. R.C. Gonzalez, R.E. Woods and S.L. Eddins: Digital Image Processing Using MATLAB, 2nd ed.,
Gatesmark, LLC, USA, 2009.
39. Y. A. Hassan and R. E. Canaan: Exp. Fluids, 1991, vol. 12, pp. 49-60.
17
Figures
Fig 1.
18
Fig 2.
Fig 3.

19
Fig 4.

20
Fig 5.

21
Fig 6.
22
List of figure captions:
Fig. 1: (a) A photo, showing the experimental set-up at 32-ID-B of APS. (b) The X-ray energy
spectrum at 18mm undulator gap on a logarithmic scale, and (c) a schematic (left) and two
photos (right), highlighting the purposely-made quartz tube with a ~300 μm thin channel in the
middle for X-ray imaging. Three K-type thermocouples (TC1, TC2, and TC3) were inserted
inside the thin channel to measure the temperatures of the metal alloys, and a sonotrode was
placed at the wedge area above the thin channel to transmit ultrasonic waves into the metal held
inside the thin channel.
Fig. 2: The Bi-Zn binary phase diagram [35, 36] with the dash line marking the Bi - 8wt%Zn
alloy used in the experiment.
Fig. 3. (a) A typical raw X-ray image acquired at APS using 5413 fps, (b) a typical background
image acquired from a pure liquid Bi – 8 wt. %Zn, (c) the image obtained by subtracting b from
a, (d) the image after applying the band-pass filter on c, (e) the binarised image of d, (f) the shape
profiles and centroids of the particles and bubbles, and (g) the trajectory of five typical particles
for the image sequence acquired at 2.5mm below the sonotrode tip using an ultrasound input
power of 20W. The arrows indicate the direction of movement.
Fig. 4: (a) - (f) The six consecutive images, showing the oscillation and implosion of a bubble in
a single wave period (an exposure time of 500 ns, and a time interval of 7.4 µs between the
consecutive images), (g) the positions of the sonotrode tip that are measured from images (a) to
(f) and superimposed onto the sine wave of the ultrasound, and the corresponding alternating
acoustic pressure; and (h) the distributions of the grey levels along the dashed lines in (d) and (e),
A is the diameter of the bubble in (d) and B is the diameter of the white halo in (e).
Fig. 5. A series of images captured in liquid Bi-8 wt. %Zn alloy with an ultrasound power of 20
W at APS using 5413 fps. The images were taken at (a) 0.5 mm, (b) 2.5 mm, and (c) 4.5 mm
respectively below the sonotrode tip. (d) Eight typical images extracted from the image sequence
showed in (b), showing the locations of bubble B and particle P, and their trajectories were
plotted in (e). (f) The velocities of particles and bubbles at different distances away from the
sonotrode tip when the ultrasound input powers of 20 W and 60 W applied. The error bar is the

23
standard deviation of the measured dataset (> 20 particles and bubbles are measured for each
point) in the field of view.
Fig. 6: (a) Images of ultrasound enhanced fluid flow disrupting the structure of semisolid phase
and leading to the detachment of Zn particles (1500 fps, 660 ms exposure time, and 60 W
ultrasound power applied by 1 s, 2 mm tip diameter sonotrode), the center of the image is ~4.5
mm below the sonotrode tip. (b) Velocity contour of fluid flow above the L-S interface measured
by tracking the detached Zn particles, and (c) the temperature history after the ultrasound was
switched on. (All the images are captured at I12 DLS)


![Synchrotron X-ray imaging of nanomagnetism in meteoritic …...generalized to electric-multipole transitions, which are important in nonresonant inelastic x-ray scattering (NIXS) [32]](https://img.pdfslide.us/doc/110x75/60c18af922a6d24d48353073/synchrotron-x-ray-imaging-of-nanomagnetism-in-meteoritic-generalized-to-electric-multipole.jpg)