Embed Size (px)
Citation preview
High-speed discrimination and sorting of
sub-micron particles using a microfluidic device
Sukumar Rajauria,†,§ Christopher Axline,†,‖ Claudia Gottstein,‡ and Andrew N.
Cleland∗,¶,⊥
Department of Physics, University of California, Santa Barbara, California 93106 USA,
Neuroscience Research Institute, University of California, Santa Barbara, California 93106 USA,
and Department of Physics and California Nanosystems Institute, University of California, Santa
Barbara, California 93106 USA
E-mail: [email protected]
KEYWORDS: Nanoparticles, sorting, high-throughput, size, fluorescence
∗To whom correspondence should be addressed†Department of Physics, University of California, Santa Barbara, California 93106 USA‡Neuroscience Research Institute, University of California, Santa Barbara, California 93106 USA¶Department of Physics and California Nanosystems Institute, University of California, Santa Barbara, California
93106 USA§Present address: HGST Western Digital, San Jose Research Center, San Jose, California 95138 USA‖Present address: Department of Applied Physics, Yale University, New Haven, Connecticut 06520 USA⊥Present address: Institute for Molecular Engineering, University of Chicago, Chicago Illinois 60637 USA
1
arX
iv:1
412.
1872
v1 [
cond
-mat
.sof
t] 5
Dec
201
4
Abstract
The size- and fluorescence-based sorting of micro- and nano-scale particles suspended in fluid
presents a significant and important challenge for both sample analysis and for manufactur-
ing of nanoparticle-based products. Here we demonstrate a disposable microfluidic particle
sorter that enables high-throughput, on-demand counting and binary sorting of sub-micron
particles and cells, using either fluorescence or an electrically-based determination of particle
size. Size-based sorting uses a resistive pulse sensor integrated on-chip, while fluorescence-
based discrimination is achieved using on-the-fly optical image capture and analysis. Follow-
ing detection and analysis, the individual particles are deflected using a pair of piezoelectric
actuators, directing the particles into one of two desired output channels; the main flow goes
into a third waste channel. The integrated system can achieve sorting fidelities of better than
98%, and the mechanism can successfully count and actuate, on demand, more than 60,000
particles/min.
2
Synthetic and naturally-occurring nanoparticles are playing an increasingly significant role in
both research and industry. In medicine, nanoparticles are increasingly being developed for thera-
peutics as well as implicated in disease;1–5 in manufacturing, nanoparticles are being developed for
data storage,6–8 photovoltaics,9,10 as well as food additives, cosmetics, and paint.11 Many appli-
cations rely on nanoparticles of a given size; however the methods used to generate nanoparticles
tend to produce a distribution of diameters. The ability to rapidly count and sort nanoparticles
based on size therefore presents a compelling approach to analyzing and narrowing these distribu-
tions. More generally, a technology that can actively separate nano- and micro-particles based on
fluorescence, magnetic response, or other physical attributes in addition to size would be a highly
useful tool for both nanoparticle synthesis and analysis.
A variety of methods for sorting micro- and nanoparticles have been demonstrated previously.
To date, these implementations have been limited in speed and fidelity.12–18 Here we describe
an alternative mechanism for the high-speed, high-fidelity binary sorting of sub-micron particles,
using particle size determined by resistive pulse sensing (RPS)19 to detect and discriminate. Fol-
lowing discrimination, particles are actuated using an on-chip piezoelectric push-pull microsorter
that deflects individual particles into the desired output channel.26,27 We also demonstrate that the
microactuator can be used to count and sort particles based on fluorescence, thereby providing a
means for the gentle and reliable binary sorting of e.g. populations of biological cells.
We first describe the resistive pulse sensing and sorting approach, in which size analysis and
on-demand actuation are integrated in a single device. We demonstrate high-speed sorting of a
binary mixture of sub-micron diameter polystyrene beads, and also use this device to test the max-
imum rate at which we can accurately actuate particles. Next, we describe how we construct a
fluorescence-based sorter, using the optical signals from fluorescent microparticles as a sorting
trigger for the same microactuator design. We use this approach to demonstrate counting and
binary sorting of a mixture of fluorescently stained and un-stained mammalian cells. This pro-
vides a gentle and reliable alternative to detection and sorting compared to e.g. conventional flow
cytometry.
3
Results
Electrically-based size detection and discrimination
Resistive pulse sensing has been demonstrated for the analysis of particle size down to particles a
few tens of nanometers in diameter,20–22 and has been implemented with quite large measurement
bandwidth, enabling particle detection at rates approaching 105 particles/s.23–25 Our high-speed
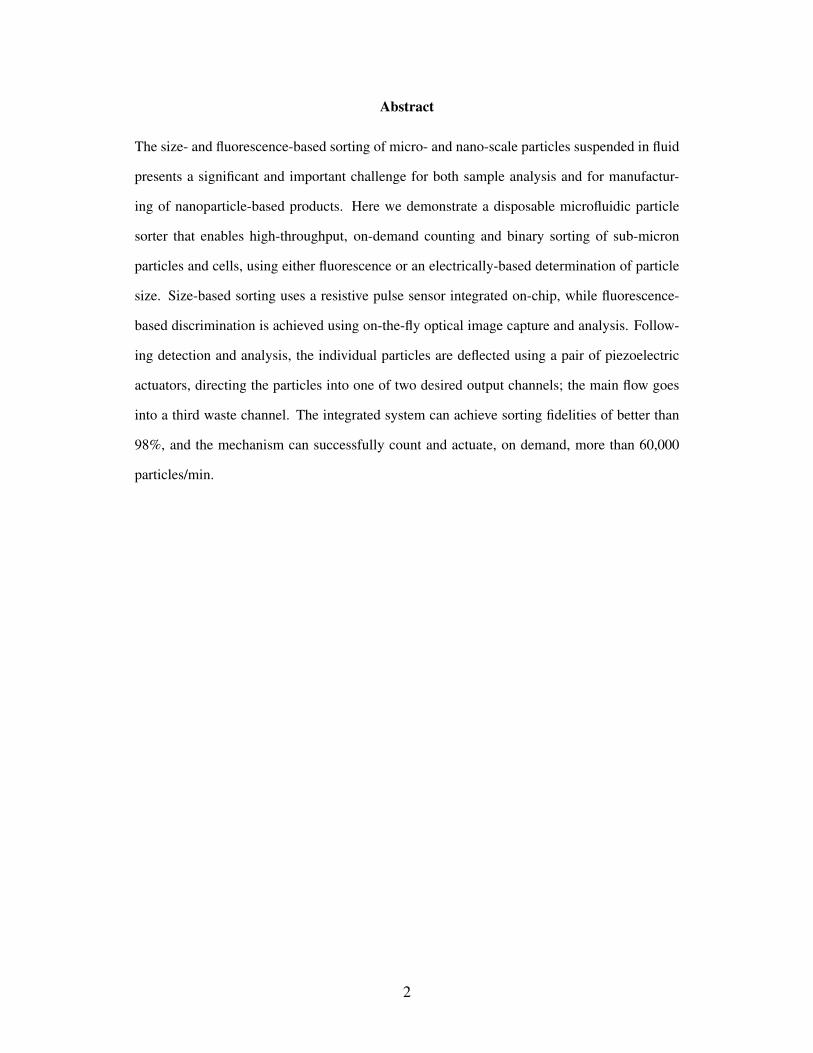
nanoparticle analyzer25 is shown in Fig. 1(a), comprising a molded microconstriction (MC), which
when filled with saline has electrical resistance Rb, a molded microfluidic bias resistor (FR), with
saline electrical resistance Ra, and a metal electrode that capacitively senses the saline electrostatic
voltage Vout between the microconstriction and bias resistor. When the device is biased by an
externally-applied voltage difference Vb−Va, and a particle passes through the microconstriction,
the microconstriction resistance will increase by an amount ∆Rb that is proportional to Rb and to
the particle volume.19 This changes the electrostatic potential of the saline above the metal sense
electrode by an amount
∆V =− RaRb
(Ra +Rb)2∆Rb
Rb(Vb−Va) . (1)
In an optimally-designed circuit the MC and FR resistances are balanced, Rb = Ra, and the first
term in Eq. (1) is equal to 1/4. In the limit where the amplifier circuit connected to the electrode
has infinite input impedance, the voltage change at the amplifier input is given by Eq. (1), yielding
a large bandwidth voltage signal proportional to the particle volume.
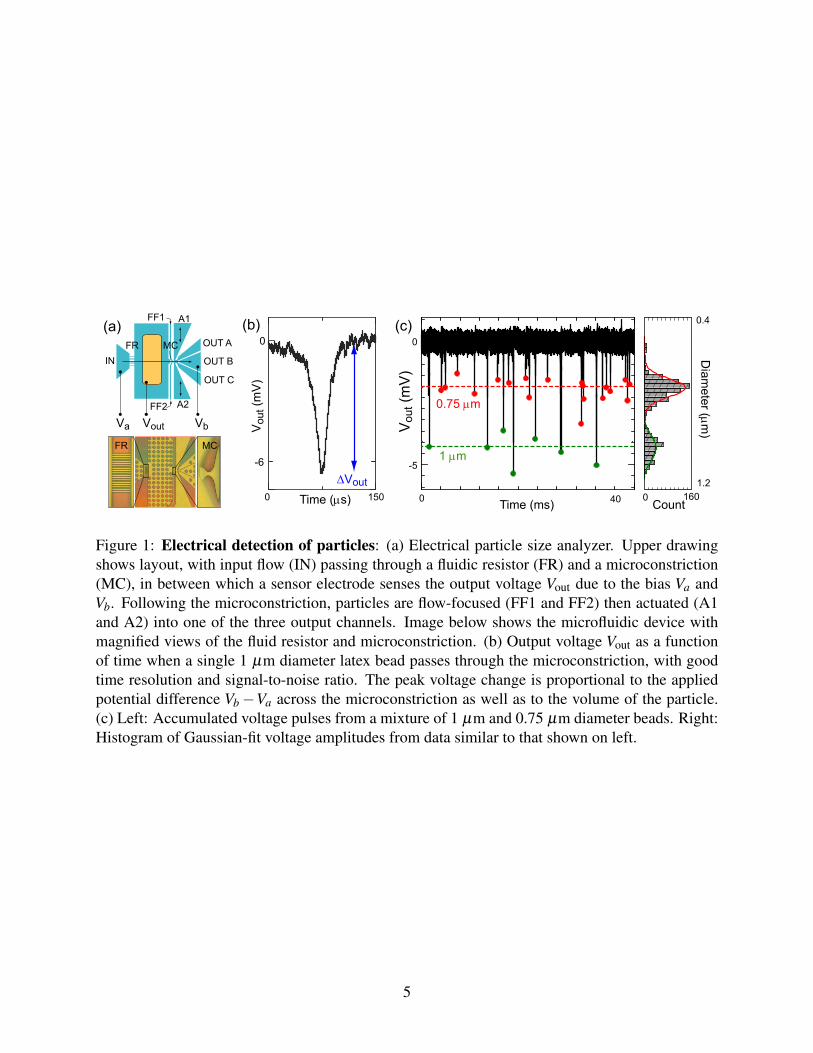
Figure 1(b) demonstrates the electrical detection of a single 1 µm diameter polystyrene particle.
It shows both the high sensitivity and the rapid electrical response of the device, corresponding to
the short transient (∼ 100 µs) generated by the particle passage through the microconstriction. The
amplitude of the voltage signal can be used to discriminate particle size, as in Fig. 1(c), showing
signals generated by a mixture of 0.75 µm and 1 µm diameter polystyrene beads. Two distinct
signal amplitudes are visible in the time trace, which are accumulated to generate the histogram
also shown in Fig. 1(c).
4
Time (s)0 150
Vou
t (m
V)
-6
0
Vout
(b)
Va VbVout
A1
A2
OUT A
OUT B
OUT C
FF1
FF2
IN
FR MC
(a)
0 160
0.4
1.2
Time (ms)0 40
0
-5
Vou
t (m
V)
0.75 m
1 m
(c)FR MC
Count
Diam
eter (m)
Figure 1: Electrical detection of particles: (a) Electrical particle size analyzer. Upper drawingshows layout, with input flow (IN) passing through a fluidic resistor (FR) and a microconstriction(MC), in between which a sensor electrode senses the output voltage Vout due to the bias Va andVb. Following the microconstriction, particles are flow-focused (FF1 and FF2) then actuated (A1and A2) into one of the three output channels. Image below shows the microfluidic device withmagnified views of the fluid resistor and microconstriction. (b) Output voltage Vout as a functionof time when a single 1 µm diameter latex bead passes through the microconstriction, with goodtime resolution and signal-to-noise ratio. The peak voltage change is proportional to the appliedpotential difference Vb−Va across the microconstriction as well as to the volume of the particle.(c) Left: Accumulated voltage pulses from a mixture of 1 µm and 0.75 µm diameter beads. Right:Histogram of Gaussian-fit voltage amplitudes from data similar to that shown on left.
5
Particle actuation
We actively displace particles using a pair of metal bimorph disc actuators, made from a lead
zirconate-titanate piezoelectric material and purchased commercially. The actuators bend in a
concave-up or concave-down fashion, determined by the sign of an externally applied voltage.
These actuators are placed symmetrically on either side of the sorting region of the microfluidic
device, each above a small volume of fluid connected by a narrow channel to the main channel
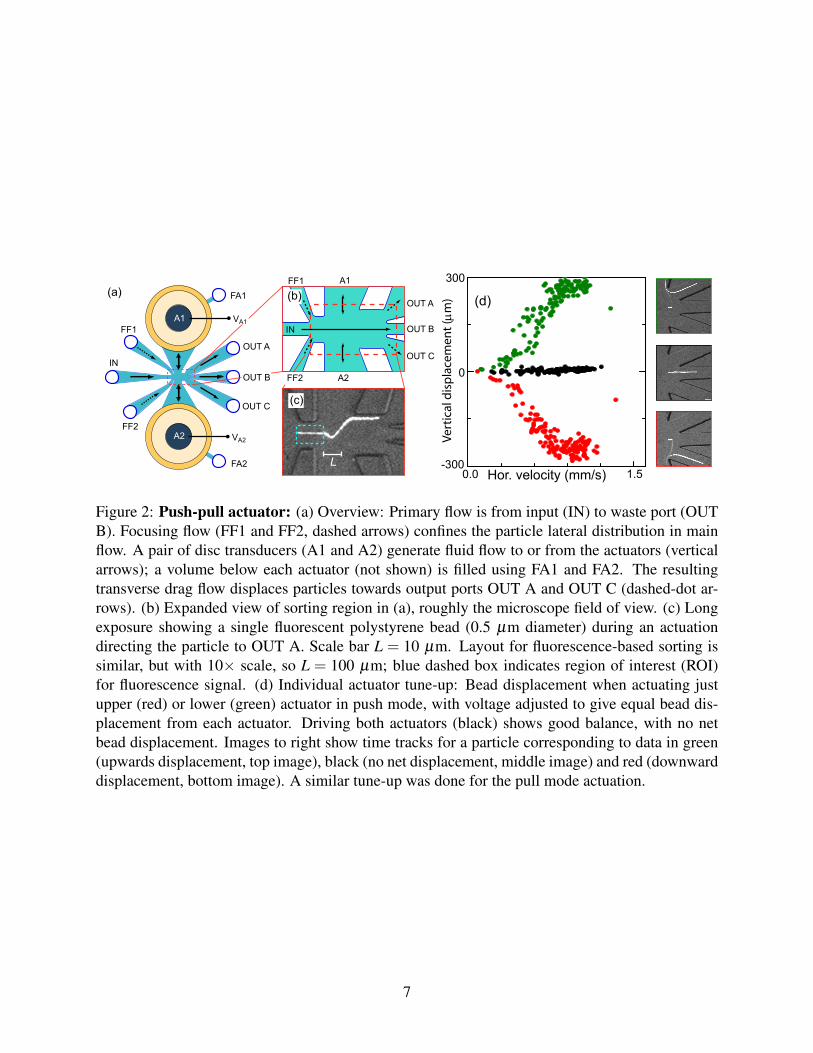
through which particles pass (see Fig. 2(a)). The actuators are used in a tandem push-pull arrange-
ment, one driven by a voltage pulse with polarity chosen so that it pushes the underlying fluid, and
the other driven by the opposite polarity voltage pulse, so that it pulls on the fluid underneath, mo-
tion that generates fluid flow with minimal static pressure change. When a particle passes through
the sorting region of the device, these opposite polarity voltage pulses (VA1, VA2) are generated and
applied to the actuators. The resulting pulse of fluid flow, transverse to the main channel flow in
which the particle is entrained, displaces the particle towards one of the output channels.
The microfluidic device shown in Fig. 2 was fabricated by molding polydimethylsiloxane
(PDMS) using a lithographically-defined mold made from photo-definable epoxy. The actuators
were embedded in the PDMS structure, with a very thin PDMS layer separating the actuator from
the fluid, thus yielding strong and efficient mechanical coupling to the fluid. We mounted the
completed device on the stage of an inverted fluorescence microscope, with the active area of
the device focussed through a dry objective onto the plane of a CCD camera. For the initial
experiments we used fluorescent polystyrene beads, 0.5 µm in diameter. The microfluidic channels
were completely filled with either filtered saline or deionized water, and fluid flow was established
by regulating the air pressure at each of the device ports. We then introduced the beads into the
input port on the device, and used parallel flow in the two flow-focussing ports on either side of
the input port to hydrodynamically focus the flow, yielding bead velocities of∼1 mm/s. The beads
were sufficiently diluted prior to injection that only one bead passed through the active area of the
device at a time.
To deflect a bead, two opposite-polarity electrical pulses with amplitude 1-5 V and duration 10
6
OUT A
OUT B
OUT C
A1
A2
FF1
FF2
A1
A2
FA1
IN
OUT A
OUT C
IN
FF2
FA2
FF1(a)
OUT B
(b)
(c)
Vert
ical
dis
pla
cem
ent
(m
)
-300
300
0
0.0 1.5Hor. velocity (mm/s)
(d)
L
VA2
VA1
Figure 2: Push-pull actuator: (a) Overview: Primary flow is from input (IN) to waste port (OUTB). Focusing flow (FF1 and FF2, dashed arrows) confines the particle lateral distribution in mainflow. A pair of disc transducers (A1 and A2) generate fluid flow to or from the actuators (verticalarrows); a volume below each actuator (not shown) is filled using FA1 and FA2. The resultingtransverse drag flow displaces particles towards output ports OUT A and OUT C (dashed-dot ar-rows). (b) Expanded view of sorting region in (a), roughly the microscope field of view. (c) Longexposure showing a single fluorescent polystyrene bead (0.5 µm diameter) during an actuationdirecting the particle to OUT A. Scale bar L = 10 µm. Layout for fluorescence-based sorting issimilar, but with 10× scale, so L = 100 µm; blue dashed box indicates region of interest (ROI)for fluorescence signal. (d) Individual actuator tune-up: Bead displacement when actuating justupper (red) or lower (green) actuator in push mode, with voltage adjusted to give equal bead dis-placement from each actuator. Driving both actuators (black) shows good balance, with no netbead displacement. Images to right show time tracks for a particle corresponding to data in green(upwards displacement, top image), black (no net displacement, middle image) and red (downwarddisplacement, bottom image). A similar tune-up was done for the pull mode actuation.
7
ms were applied to the transducers, generating the desired push-pull drag flow in the fluid channel
connecting the two transducers. Figure 2(c) displays the resulting response of an individual bead
to this kind of signal, with the bead directed to output port A. Reversing the polarity of the signals
would instead deflect the particle to output port C. In the absence of an actuation signal, particles
would flow into the waste port B.
Size-based sorting of particles
We combined the electrical size analyzer and the micro-actuator to demonstrate all-electronic size-
based sorting. We established pressure-driven flow of the analyte through the main channel of the
device, using flow-focussing to maintain tight lateral spacing of the particles. Particles passed one
at a time through the size analyzer, resulting in the generation of an output pulse whose amplitude,
proportional to the particle volume, was used to discriminate and drive the piezoelectric actuators.
The microactuator flow pulse then directed the particle to the desired output port. The electrical
schematic is shown in Fig. 3(a); the electrical signal from the particle analyzer was discriminated
and a trigger generated, after a programmable time delay, that was then amplified and used to drive
the actuators.
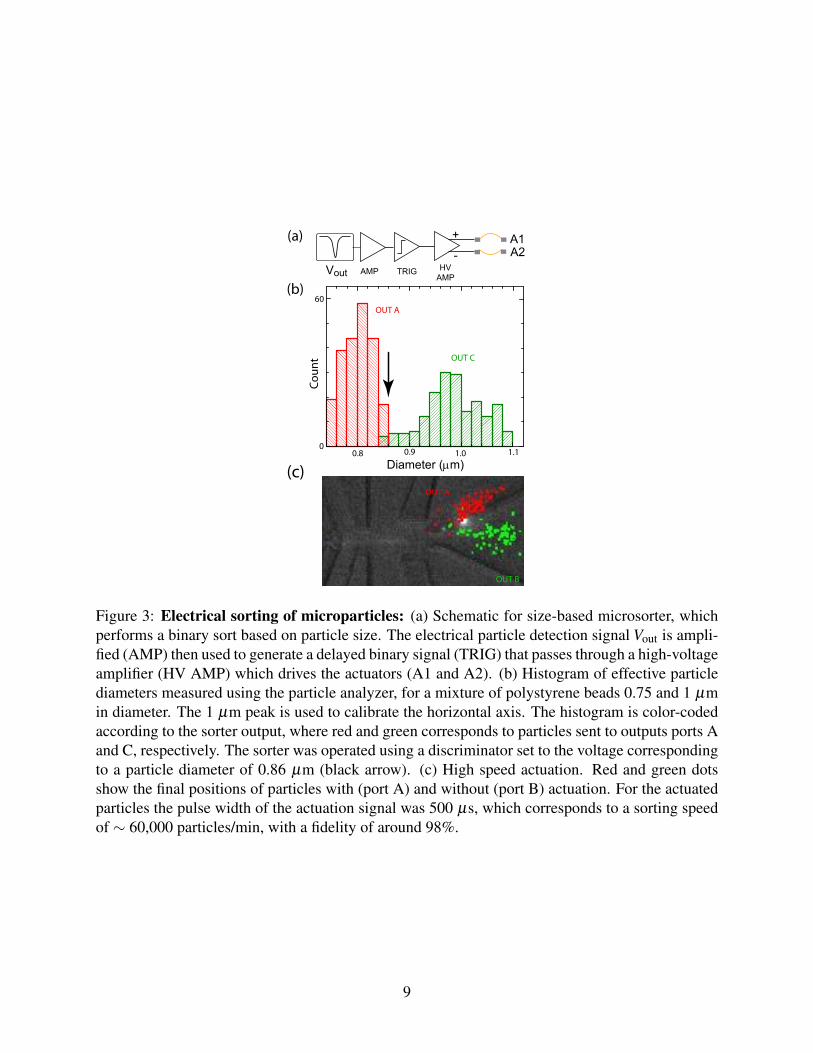
In Fig. 3(b) we show the results of a size-based sorting experiment, using a mixture of
polystyrene beads with 0.75 µm and 1 µm diameters. The figure displays the input size his-
togram, color-coded for where the input particles were directed (red for output A, green for output
C). We mark also the size (voltage) at which the binary sort discriminator and trigger was set. A
single pass through the device produces highly enriched outputs, with monodisperse populations
achieving (in this experiment) 100% sorting fidelity at each output port, defined as the fraction of
beads appearing at each output port that were intentionally directed there. The fidelity of the sorter
is ultimately limited by variations in the particle speed and by insufficient drag force on some par-
ticles, both of which arise for particles near the bottom and top of the channel, where the Poiseuille
flow velocity and the micro-actuator induced drag both fall to zero.
8
Co
un
t
0
60
0.8 1.0
Diameter (m)
(a)
OUT A
OUT C
(c)OUT A
OUT B
0.9 1.1
+ A1A2-
Vout AMP HVAMP
(b)TRIG
Figure 3: Electrical sorting of microparticles: (a) Schematic for size-based microsorter, whichperforms a binary sort based on particle size. The electrical particle detection signal Vout is ampli-fied (AMP) then used to generate a delayed binary signal (TRIG) that passes through a high-voltageamplifier (HV AMP) which drives the actuators (A1 and A2). (b) Histogram of effective particlediameters measured using the particle analyzer, for a mixture of polystyrene beads 0.75 and 1 µmin diameter. The 1 µm peak is used to calibrate the horizontal axis. The histogram is color-codedaccording to the sorter output, where red and green corresponds to particles sent to outputs ports Aand C, respectively. The sorter was operated using a discriminator set to the voltage correspondingto a particle diameter of 0.86 µm (black arrow). (c) High speed actuation. Red and green dotsshow the final positions of particles with (port A) and without (port B) actuation. For the actuatedparticles the pulse width of the actuation signal was 500 µs, which corresponds to a sorting speedof ∼ 60,000 particles/min, with a fidelity of around 98%.
9
Very high speed sorting can be achieved using this microactuator design. Figure 3(c) shows the
high-speed binary sorting of 1 µm diameter polystyrene particles, where we significantly increased
the flow rate of particles over the previous experiments. The voltage pulse from the particle size
analyzer was directly amplified to generate an actuation voltage that sent the first N particles to
output A. The actuation voltage was then shut off, and the next N particles were directed to output
B. Red and green dots show the final positions of particles in the output region. An output fidelity
of around 98% was achieved, as shown in Table 1. For the actuated particles, the actuation signal
pulse width was about 500 µs, which corresponds to a maximum sorting speed of about 60,000
particles/min, assuming a 50% duty cycle. The sorting rate is limited in this case by the compliance
of the actuators; stiffer actuators would be required to achieve sorting speeds significantly higher
than this.
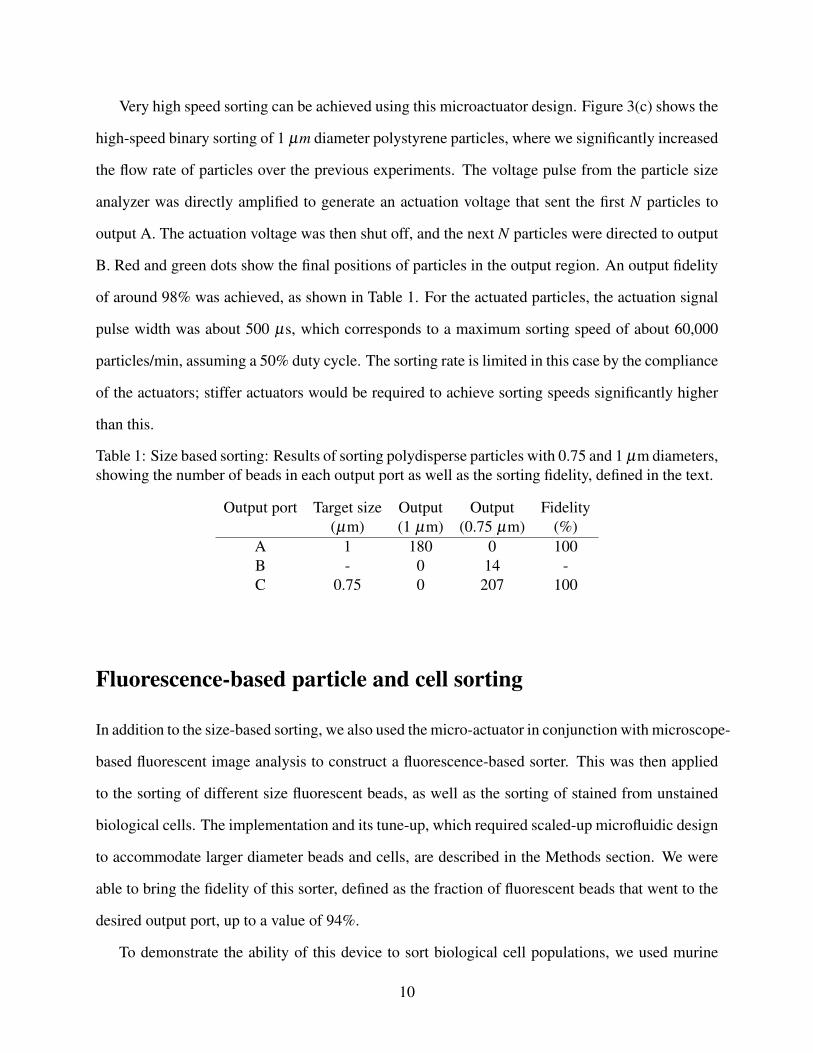
Table 1: Size based sorting: Results of sorting polydisperse particles with 0.75 and 1 µm diameters,showing the number of beads in each output port as well as the sorting fidelity, defined in the text.
Output port Target size Output Output Fidelity(µm) (1 µm) (0.75 µm) (%)
A 1 180 0 100B - 0 14 -C 0.75 0 207 100
Fluorescence-based particle and cell sorting
In addition to the size-based sorting, we also used the micro-actuator in conjunction with microscope-
based fluorescent image analysis to construct a fluorescence-based sorter. This was then applied
to the sorting of different size fluorescent beads, as well as the sorting of stained from unstained
biological cells. The implementation and its tune-up, which required scaled-up microfluidic design
to accommodate larger diameter beads and cells, are described in the Methods section. We were
able to bring the fidelity of this sorter, defined as the fraction of fluorescent beads that went to the
desired output port, up to a value of 94%.
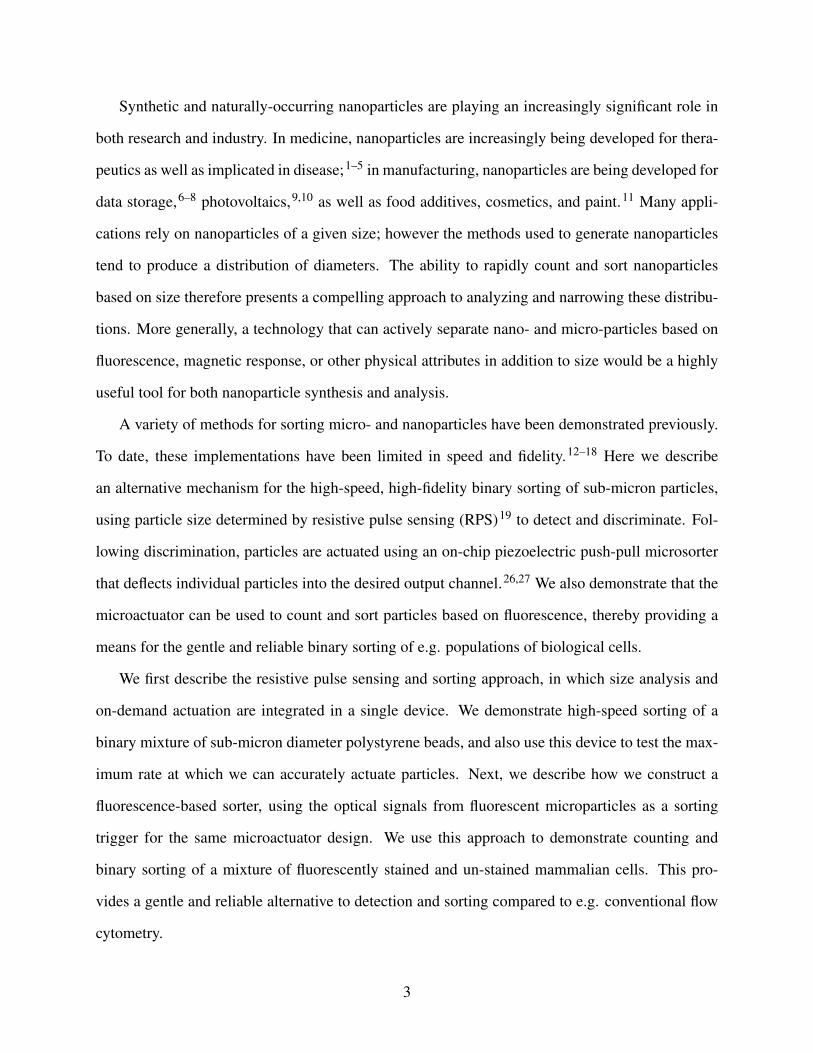
To demonstrate the ability of this device to sort biological cell populations, we used murine
10
macrophages, a model system for stem cells, stained with a Hoechst dye. In a stem cell sorting
experiment, this cell-permeable dye is rapidly transported out of stem cells, allowing discrimina-
tion of stem cells from non-stem cells through the resulting side population in e.g. flow cytometry-
based assays. In our model system, where we used a single type of cells, a differentiated population
was achieved by spiking the stained cells into a non-stained cell population at a ratio of 3:1. This
mixture was then passed through the fluorescence-based sorter.
Inte
nsity
(AU
)
Size (m)
100
50
(b)
Vertical disp. (m)-200 2000
(a)
Cou
nt
0
30
0 500
Stained
Unstained
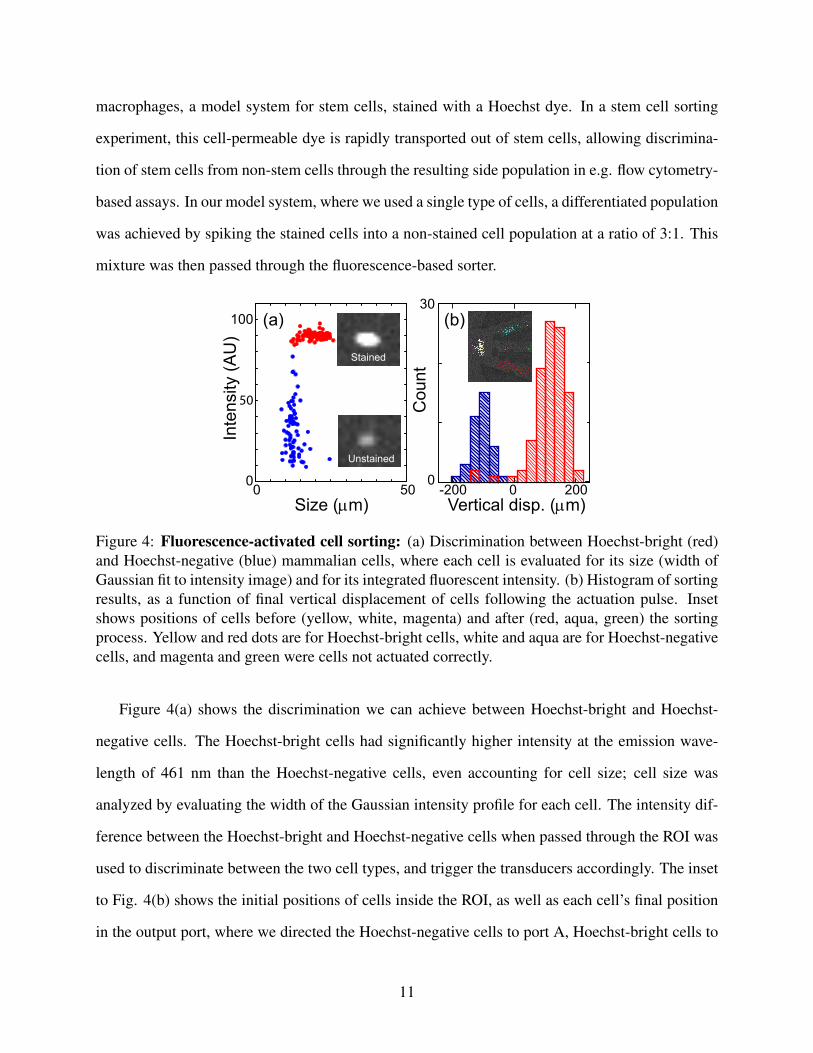
Figure 4: Fluorescence-activated cell sorting: (a) Discrimination between Hoechst-bright (red)and Hoechst-negative (blue) mammalian cells, where each cell is evaluated for its size (width ofGaussian fit to intensity image) and for its integrated fluorescent intensity. (b) Histogram of sortingresults, as a function of final vertical displacement of cells following the actuation pulse. Insetshows positions of cells before (yellow, white, magenta) and after (red, aqua, green) the sortingprocess. Yellow and red dots are for Hoechst-bright cells, white and aqua are for Hoechst-negativecells, and magenta and green were cells not actuated correctly.
Figure 4(a) shows the discrimination we can achieve between Hoechst-bright and Hoechst-
negative cells. The Hoechst-bright cells had significantly higher intensity at the emission wave-
length of 461 nm than the Hoechst-negative cells, even accounting for cell size; cell size was
analyzed by evaluating the width of the Gaussian intensity profile for each cell. The intensity dif-
ference between the Hoechst-bright and Hoechst-negative cells when passed through the ROI was
used to discriminate between the two cell types, and trigger the transducers accordingly. The inset
to Fig. 4(b) shows the initial positions of cells inside the ROI, as well as each cell’s final position
in the output port, where we directed the Hoechst-negative cells to port A, Hoechst-bright cells to
11
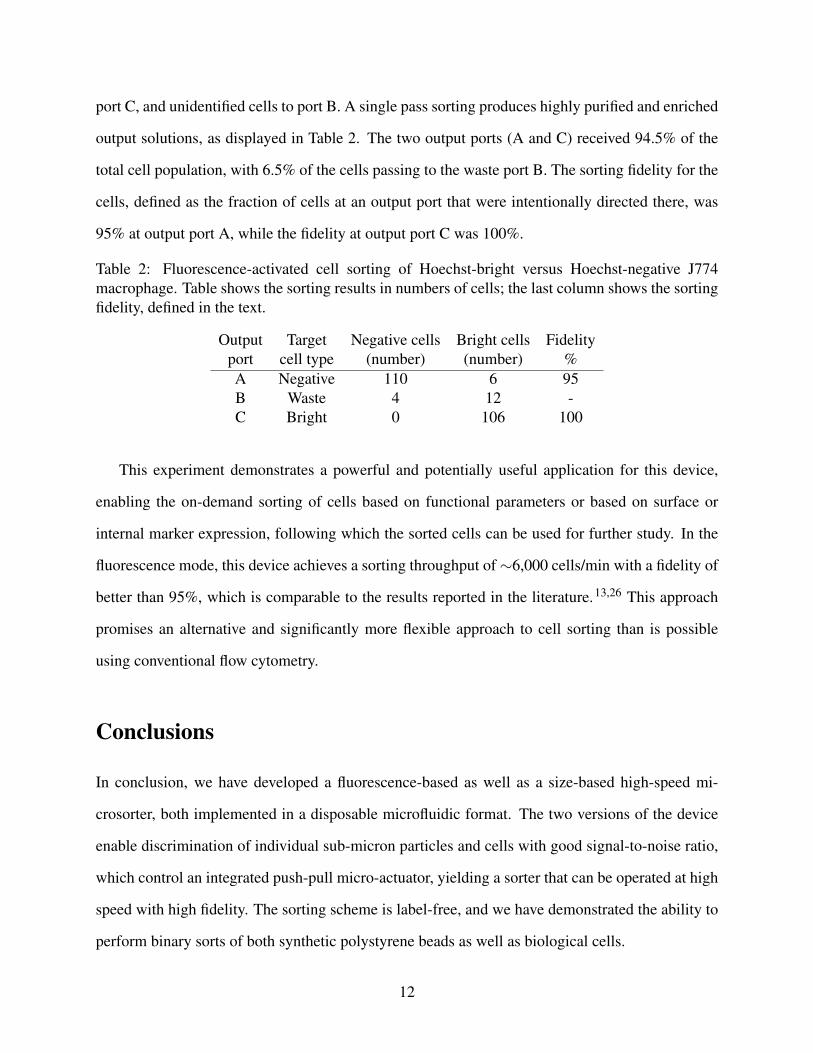
port C, and unidentified cells to port B. A single pass sorting produces highly purified and enriched
output solutions, as displayed in Table 2. The two output ports (A and C) received 94.5% of the
total cell population, with 6.5% of the cells passing to the waste port B. The sorting fidelity for the
cells, defined as the fraction of cells at an output port that were intentionally directed there, was
95% at output port A, while the fidelity at output port C was 100%.
Table 2: Fluorescence-activated cell sorting of Hoechst-bright versus Hoechst-negative J774macrophage. Table shows the sorting results in numbers of cells; the last column shows the sortingfidelity, defined in the text.
Output Target Negative cells Bright cells Fidelityport cell type (number) (number) %A Negative 110 6 95B Waste 4 12 -C Bright 0 106 100
This experiment demonstrates a powerful and potentially useful application for this device,
enabling the on-demand sorting of cells based on functional parameters or based on surface or
internal marker expression, following which the sorted cells can be used for further study. In the
fluorescence mode, this device achieves a sorting throughput of∼6,000 cells/min with a fidelity of
better than 95%, which is comparable to the results reported in the literature.13,26 This approach
promises an alternative and significantly more flexible approach to cell sorting than is possible
using conventional flow cytometry.
Conclusions
In conclusion, we have developed a fluorescence-based as well as a size-based high-speed mi-
crosorter, both implemented in a disposable microfluidic format. The two versions of the device
enable discrimination of individual sub-micron particles and cells with good signal-to-noise ratio,
which control an integrated push-pull micro-actuator, yielding a sorter that can be operated at high
speed with high fidelity. The sorting scheme is label-free, and we have demonstrated the ability to
perform binary sorts of both synthetic polystyrene beads as well as biological cells.
12

This concept can be extended to sort multi-component nanoparticle solutions. A multichannel
output design can easily be configured to allow more complex configurations, combining both
electrical and optical detection techniques as well as doing higher-order sorting, with different
binary sort elements cascaded to allow multiplexed operation. A cascaded arrangement could also
be used to correct sorting errors from previous sorting elements. It could also be possible to equip
the CCD camera with a Bayer mask or use a triple-CCD device, in order to obtain optical images
of the cells, similar to imaging flow cytometry, but with added sorting capability. The low cost,
scalable fabrication, and simple on-chip detection and sorting ability, make this device potentially
useful in a wide range of applications.
13
Methods
Device fabrication
The micromold used to define the microfluidic sorter poly(dimethylsiloxane) (PDMS) structure
was fabricated using two thicknesses of the photodefinable epoxy SU-8 (MicroChem Corp.), pat-
terned using optical lithography; see Fig. 5. The substrate consisted of a bare 100 mm silicon wafer
onto which we defined gold alignment marks using a photoresist liftoff process. The thin regions of
the micromold (2 µm thick), which includes the fluidic resistor (FR) and microconstriction (MR),
were patterned first. The fluidic resistor was defined using 17 parallel ribs of SU-8, each rib 50
µm long and 3 µm wide. The microconstriction was a rib of SU-8 2 µm long and 2 µm wide. The
remaining, thicker portions of the microfluidic structure were defined following this, using thick
(15 µm) SU-8. This mold was used to cast PDMS, also shown in Fig. 5, and could be reused to
fabricate many PDMS elements. Once cast, the PDMS was bonded to a clean glass slide that, for
the size-based micro-sorter, included a sensing electrode (10 nm Ti, 50 nm Au), fabricated using a
conventional photoresist liftoff process.
Steady-state device operation
The microfluidic channels were completely filled with either filtered saline or deionized water, and
fluid flow was established by regulating the air pressure at each of the device ports. Usually, IN,
FF1 and FF2 ports (refer to Figure 2(a)) were set to very similar values to create a pressure head on
the analyte input side. The beads or cells were introduced into the IN port on the device, FF1 and
FF2 flow-focussing ports were used to hydrodynamically focus the input beads towards the OUT
B port. On the other side of the microsorter, OUT A, B, C ports were set at lower pressure than IN
port, yielding the bead velocities of 1 mm/s.
14
UV Light
Si Thin SU8 Thick SU8 PDMS Glass
(a)
(b)
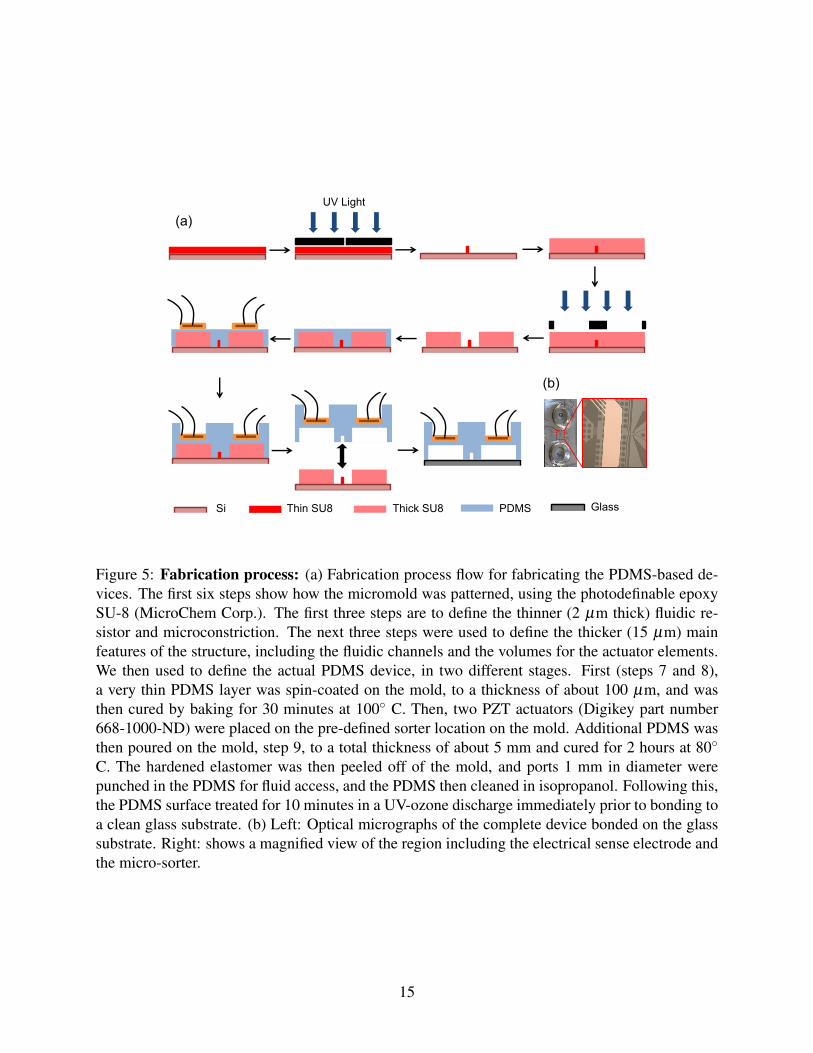
Figure 5: Fabrication process: (a) Fabrication process flow for fabricating the PDMS-based de-vices. The first six steps show how the micromold was patterned, using the photodefinable epoxySU-8 (MicroChem Corp.). The first three steps are to define the thinner (2 µm thick) fluidic re-sistor and microconstriction. The next three steps were used to define the thicker (15 µm) mainfeatures of the structure, including the fluidic channels and the volumes for the actuator elements.We then used to define the actual PDMS device, in two different stages. First (steps 7 and 8),a very thin PDMS layer was spin-coated on the mold, to a thickness of about 100 µm, and wasthen cured by baking for 30 minutes at 100◦ C. Then, two PZT actuators (Digikey part number668-1000-ND) were placed on the pre-defined sorter location on the mold. Additional PDMS wasthen poured on the mold, step 9, to a total thickness of about 5 mm and cured for 2 hours at 80◦
C. The hardened elastomer was then peeled off of the mold, and ports 1 mm in diameter werepunched in the PDMS for fluid access, and the PDMS then cleaned in isopropanol. Following this,the PDMS surface treated for 10 minutes in a UV-ozone discharge immediately prior to bonding toa clean glass substrate. (b) Left: Optical micrographs of the complete device bonded on the glasssubstrate. Right: shows a magnified view of the region including the electrical sense electrode andthe micro-sorter.
15
Actuator tune-up
Using the microactuator to successfully drive particles to the desired output port depends on trans-
ducer pulse amplitude, pulse timing as well as on the height of the particle in the channel. The
time delay from detection to the actuation point is inversely proportional to velocity, so finding a
pulse delay that works for the range of expected velocities is clearly necessary. The height of a
particle in the channel determines its velocity, due to the Poiseuille distribution of flow; this also
controls the effectiveness of the sorting flow pulse, which has the same Poiseuille flow distribution,
so that e.g. a slow particle will feel a smaller sorting force than a fast particle. As slower particles
are in the sorting region proportionally longer than fast particles, the integrated impulse can be
made almost independent of velocity. In order to achieve the highest fidelity actuation, we tuned
each transducer’s actuation voltage separately, and ensured that nearly the same end result could
be achieved independent of the particle’s measured horizontal velocity. Figure 2(d) shows part of
the tune-up for the push mode actuation, in which the voltage applied to one actuator acting by
itself was adjusted to give the same displacement as for the other actuator acting by itself (red and
green data points). This was verified by applying the same polarity pulse to each actuator, giving
a net null displacement (black data points). For example, for the device used here, we found the
upper actuator (A1) would balance the lower actuator (A2) if we used pulses of amplitude +2.5 V
and +4.5 V respectively, the difference in voltage reflecting a difference in the transducers or in
how they were mounted. A similar tune-up procedure was used for the pull mode actuation.
Operation of electrical size-based sorter
Constant and opposite voltages Va and Vb (typically a few volts in amplitude) were applied to bias
electrodes A and B respectively (Fig. 1a). The bias voltages were adjusted in such a way as to
keep the average sensor output voltage Vout near zero, to avoid electrolytic corrosion of the sensing
electrode. The instantaneous voltage Vout was monitored and compared to a set threshold voltage,
with voltages beyond the threshold triggering the sorter actuation. The trigger (Stanford Research
DG535) would in turn generate a square pulse of 10 ms duration and Vp−p = 1 V amplitude, which
16
was amplified by a dual-output amplifier (Krohn-Hite 3602M) to generate positive and negative
polarity pulses which were applied to the two PZT transducers. The voltages used to drive the
PZTs were tuned up as described above.
Operation of fluorescence-based sorter
For fluorescence-based sorting, which was used designed to sort both fluorescent beads as well
as biological cells with dimensions of order 10 µm, a much larger microfluidic design was used,
where in Fig. 2(b) and (c) the layout was scaled up uniformly by a factor of 10 from the micropar-
ticle sorter. In this implementation, the particles to be sorted were illuminated with a mercury lamp
through a DAPI filter cube, and the return fluorescent signal captured using a 60× dry objective
before illuminating a charge-coupled device (CCD) camera (QICAM 12-bit, 100 fps). The pixels
in the CCD lying inside a software-defined rectangular “region of interest” (ROI), shown in Fig.
2(c), were digitally analyzed and summed in real time to evaluate the ROI total intensity. When
a bead passes through the ROI, the summed intensity increases sharply, and this intensity is used
to generate a software-programmable delayed trigger pulse on a function generator (Stanford Re-
search Systems DS345, square pulses of 10 ms duration and Vp-p = 1 V amplitude). This pulse
was amplified by a dual-output amplifier (Krohn-Hite 3602M) to generate positive and negative
polarity pulses with amplitudes as per the tune-up procedure described above. The opposite po-
larity pulses were applied to the two transducers, generating the desired push-pull drag flow in the
channel connecting the two transducers. In the absence of an actuation signal, particles in the flow
stream would flow into the waste port B in Fig. 2.
The fidelity of this sorter, defined as the fraction of fluorescent beads that went to the desired
output port, depends strongly on the timing between fluorescence detection and the actuation flow
pulse, which required careful optimization due to the larger microfluidic dimensions as well as the
use of software analysis and its concomitant delays. We controlled the timing in part by varying
the position of the ROI in the camera field-of-view, while monitoring the sorter output, as shown
in Fig. 6. The inset to that figure shows how we varied the lateral position of the ROI in the
17
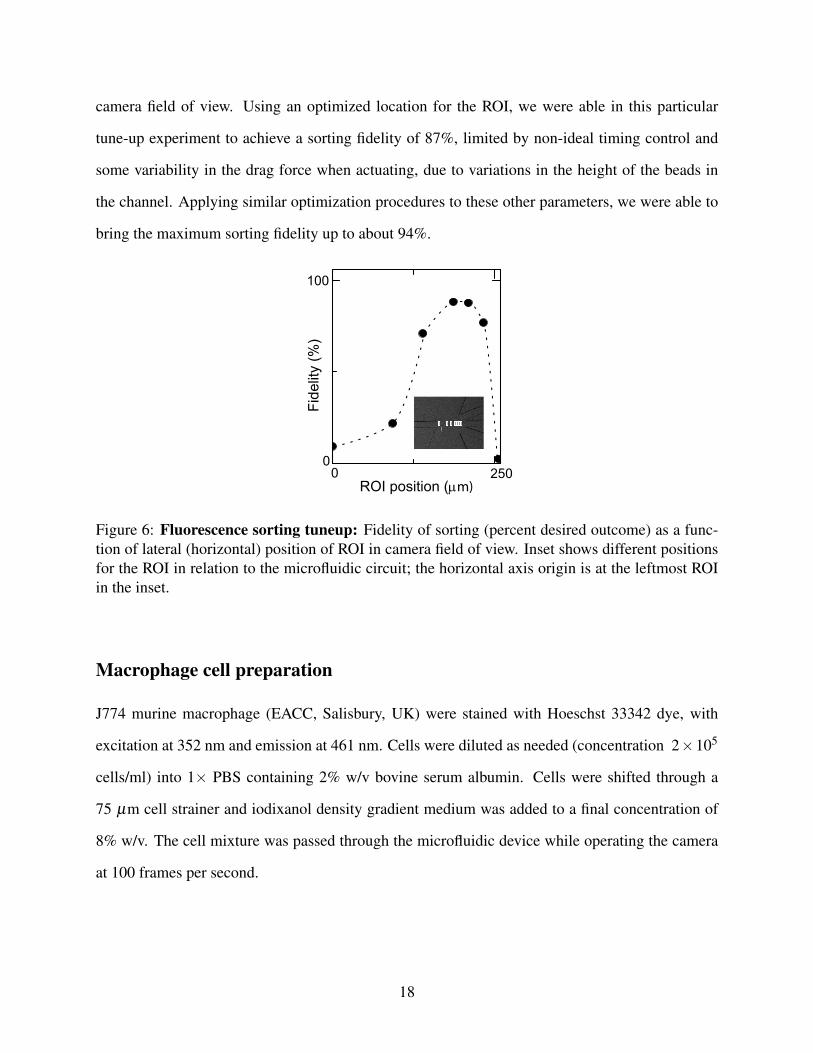
camera field of view. Using an optimized location for the ROI, we were able in this particular
tune-up experiment to achieve a sorting fidelity of 87%, limited by non-ideal timing control and
some variability in the drag force when actuating, due to variations in the height of the beads in
the channel. Applying similar optimization procedures to these other parameters, we were able to
bring the maximum sorting fidelity up to about 94%.
Fide
lity
(%)
0
100
ROI position (m)2500
Figure 6: Fluorescence sorting tuneup: Fidelity of sorting (percent desired outcome) as a func-tion of lateral (horizontal) position of ROI in camera field of view. Inset shows different positionsfor the ROI in relation to the microfluidic circuit; the horizontal axis origin is at the leftmost ROIin the inset.
Macrophage cell preparation
J774 murine macrophage (EACC, Salisbury, UK) were stained with Hoeschst 33342 dye, with
excitation at 352 nm and emission at 461 nm. Cells were diluted as needed (concentration 2×10⁵
cells/ml) into 1× PBS containing 2% w/v bovine serum albumin. Cells were shifted through a
75 µm cell strainer and iodixanol density gradient medium was added to a final concentration of
8% w/v. The cell mixture was passed through the microfluidic device while operating the camera
at 100 frames per second.
18
Polystyrene nanoparticle preparation
Fluorescent polystyrene beads were obtained from Polysciences Inc. (0.5 µm, catalogue no.
15700-10; 0.75 µm, catalogue no. 07766-10; and 1 µm, catalogue no. 15702-10). Number densi-
ties in stock solution were calculated from the manufacturer’s specifications, and the particles were
diluted as needed into 1× PBS with the addition of 1% Tween 20 (Sigma-Aldrich).
Acknowledgements
The authors would like to acknowledge the Keck Foundation for financial support, and the NSF
NNIN for support of the UC Santa Barbara Nanofabrication facility. We are grateful to Nelly
Traitcheva for mammalian cell culture and cell preparations.
Author information
Corresponding author: Email [email protected].
The authors declare they have no competing financial interests.
19
References
(1) Alivisatos, P. The use of nanocrystals in biological detection. Nat. Biotechnol. 2004, 22, 47-52.
(2) Michalet, X., Pinaud, F. F., Bentolila, L. A., Tsay, J. M., Doose, S., Li, J. J., Sundaresan, G.,
Wu, A. M., Gambhir, S. S. and Weiss, S. Quantum dots for live cells, in vivo imaging, and
diagnostics. Science 2005, 307, 538-544.
(3) Huang, X. H., Jain, P. K., El-Sayed, I. H. and El-Sayed, M. A. Gold nanoparticles: interest-
ing optical properties and recent applications in cancer diagnostic and therapy. Nanomedicine
2007, 2, 681-693.
(4) Langer, R. and Tirrell, D.A. Designing materials for biology and medicine Nature 2004, 428,
487-492.
(5) Rosenberg, A. Effects of Protein Aggregates: An Immunologic Perspective Am. Assoc. of
Pharma. Sci. J. 2006, 8, E501-507.
(6) Sun, S. H., Murray, C. B., Weller, D., Folks, L and Moser, A. Monodisperse FePt nanoparticles
and ferromagnetic FePt nanocrystal superlattices. Science 2000, 287, 1989-1992.
(7) Hyeon, T Chemical synthesis of magnetic nanoparticles. Chem. Commun. 2003, 8, 927-934.
(8) Lu, An-Hui, Salabas, E. L. and Schueth, F. Magnetic nanoparticles: Synthesis, protection,
functionalization, and application. Angew. Che. 2007, 46, 1222-1244.
(9) Seow, Z. L. S., Wong, A. S. W., Thavasi, V., Jose, R., Ramakrishna, S. and Ho, G. W. Con-
trolled synthesis and application of ZnO nanoparticles, nanorods and nanospheres in dye-
sensitized solar cells. Nanotechnology 2009, 20, 045604.
(10) Yella, A., Lee, H. W., Tsao, H. N., Yi, C. Y., Chandiran, A. K., Nazeeruddin, M. K., Diau, E.
W. G., Yeh, C. Y., Zakeeruddin and S. M., Gratzel, M. Porphyrin-Sensitized Solar Cells with
Cobalt (II/III)-Based Redox Electrolyte Exceed 12 Percent Efficiency. Science 2011, 334, 629-
634.
20
(11) Weir, A., Westeroff, P., Fabricius, L., Hristovski, K., von Goetz, N. Titanium Dioxide
Nanoparticles in Food and Personal Care Products Environ. Sci. Technol. 2012, 46, 2242-2250.
(12) Huang, L. R., Cox, E. C., Austin, R. H. and Sturm, J. C. Continuous particle separation
through deterministic lateral displacement. Science 2004, 304, 987-990.
(13) Baret, J. C., Miller, O. J., Taly, V., Ryckelynck, M., El-Harrak, A., Frenz, L., Rick, C.,
Samuels, M. L., Hutchison, J. B., Agresti, J. J., Link, D. R., Weitz, D. A. and Griffiths, A.
D. Fluorescence-activated droplet sorting (FADS): efficient microfluidic cell sorting based on
enzymatic activity. Lab Chip 2009, 9, 1850-1858.
(14) Han, J. and Craighead, H. G. Separation of Long DNA Molecules in a Microfabricated En-
tropic Trap Array. Science 2000, 288, 1026-1029.
(15) Stavis, S. M., Geist, J. and Gaitan, M. Separation and metrology of nanoparticles by nanoflu-
idic size exclusion. Lab Chip 2010, 10, 2618-2621.
(16) Fu, A. Y., Spence, C., Scherer, A., Arnold, F. H. and Quake, S. R. A microfabricated
fluorescence-activated cell sorter. Nat. Biotechnol. 1999, 17, 1109-1111.
(17) Miltenyi, S., Muller, W., Weichel, W. and Radbruch, A. High Gradient Magnetic Cell Sepa-
ration With MACS. Cytometry 1990, 11, 231-238.
(18) Lee, C. S., Lee, H. and Westervelt, R. M. Microelectromagnets for the control of magnetic
nanoparticles. Appl. Phys. Lett. 2001, 79, 3308-3310.
(19) DeBlois, R. W. and Bean, C. P. Counting and Sizing of Submicron Particles by the Resistive
Pulse Technique. Rev. Sci. Instrum. 1970, 41, 909-916.
(20) Saleh, O. A. and Sohn, L. L. An artificial nanopore for molecular sensing. Nano Lett. 2003,
3, 37-38.
(21) Li, J. L., Gershow, M., Stein, D., Brandin, E. and Golovchenko, J. A. DNA molecules and
configurations in a solid-state nanopore microscope. Nat. Mater. 2003, 2, 611-615.
21
(22) Dekker, C. Solid-State Nanopores. Nat. Nanotechnol. 2007, 2, 209-215.
(23) Wood, D. K., Oh, S. H., Lee, S. H., Soh, H. T. and Cleland, A. N. High-bandwidth radio
frequency Coulter counter. Appl. Phys. Lett. 2005, 87, 184106.
(24) Wood, D. K.,Requa, M. V. and Cleland, A. N. High-bandwidth radio frequency Coulter
counter. Rev. Sci. Instrum. 2007, 78, 104301.
(25) Fraikin, J. L., Teesalu, T., McKenney, C. M., Ruoslahti, E. and Cleland, A. N. A high-
throughput label-free nanoparticle analyser. Nat. Nanotechnol. 2011, 6, 308-313.
(26) Chen, C. H., Cho, S. H., Tsai, F., Erten, A. and Lo, Y. H. Microfluidic cell sorter with
integrated piezoelectric actuator. Biomed. Microdevices 2009, 11, 1223-1231.
(27) Zhou Y. and Amirouche F. An Electromagnetically-Actuated All-PDMS Valveless Microp-
ump for Drug Delivery. Micromachines 2011, 2, 345-355.
(28) Duffy, D. C., McDonald, J. C., Schueller, O. J. A. and Whitesides, G. M. Rapid prototyping
of microfluidic systems in poly(dimethylsiloxane). Anal. Chem. 1998, 70, 4974-4984.
(29) Unger, M. A., Chou, H. P., Thorsen, T., Scherer, A. and Quake, S. R. Monolithic microfabri-
cated valves and pumps by multilayer soft lithography. Science 2000, 288, 113-116.
(30) Wang, M. M., Tu, E., Raymond, D. E., Yang, J. M., Zhang, H. C., Hagen, N., Dees, B.,
Mercer, E. M., Forster, A. H., Kariv, I., Marchand, P. J. and Butler, W. F. Microfluidic sorting
of mammalian cells by optical force switching. Nat. Biotechnol. 2005, 23, 83-87.
(31) Nagrath, S., Sequist, L. V., Maheswaran, S., Bell, D. W., Irimia, D., Ulkus, L., Smith, M. R.,
Kwak, E. L., Digumarthy, S., Muzikansky, A., Ryan, P., Balis, U. J., Tompkins, R. G., Haber,
D. A. and Toner, M. Isolation of rare circulating tumour cells in cancer patients by microchip
technology. Nature 2007, 450, 1235-U10.
22
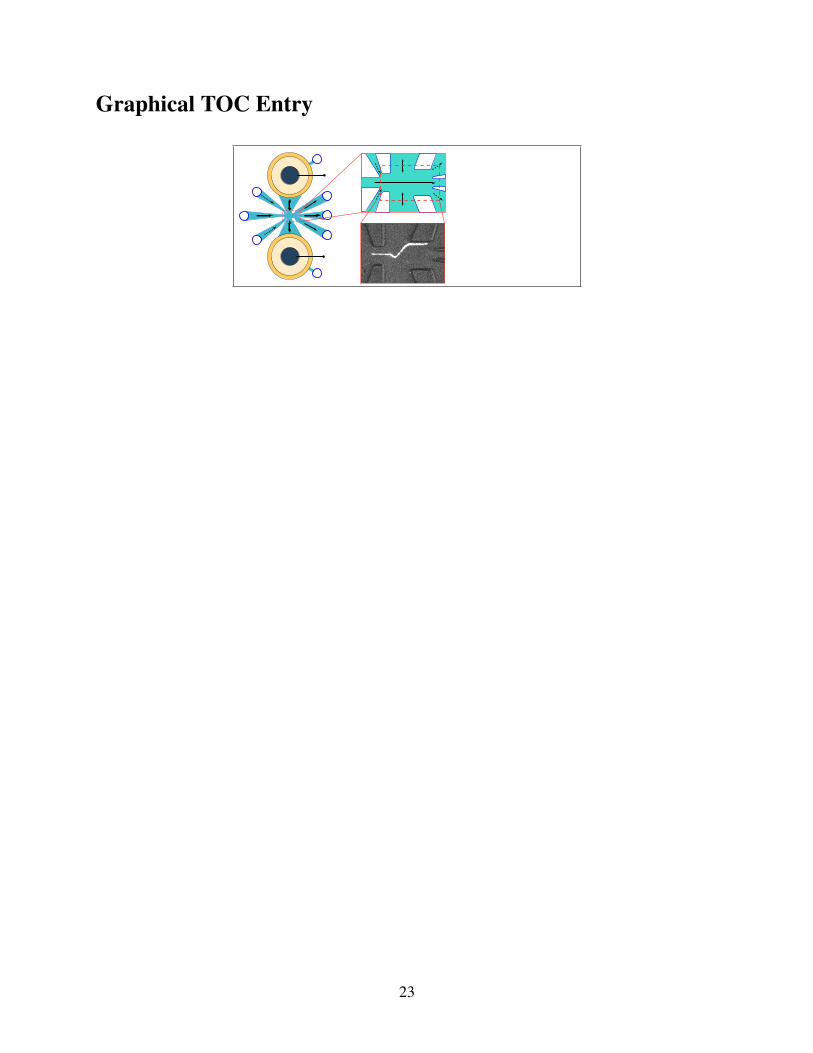
Graphical TOC Entry
23