Embed Size (px)
Citation preview
High sensitivity giant magnetoimpedance (GMI) magnetic transducer: magnitude versus
phase sensing
This article has been downloaded from IOPscience. Please scroll down to see the full text article.
2011 Meas. Sci. Technol. 22 035204
(http://iopscience.iop.org/0957-0233/22/3/035204)
Download details:
IP Address: 139.82.78.23
The article was downloaded on 22/11/2012 at 19:24
Please note that terms and conditions apply.
View the table of contents for this issue, or go to the journal homepage for more
Home Search Collections Journals About Contact us My IOPscience
IOP PUBLISHING MEASUREMENT SCIENCE AND TECHNOLOGY
Meas. Sci. Technol. 22 (2011) 035204 (9pp) doi:10.1088/0957-0233/22/3/035204
High sensitivity giant magnetoimpedance(GMI) magnetic transducer: magnitudeversus phase sensingE Costa Silva1,2, L A P Gusmao2, C R Hall Barbosa1, E Costa Monteiro1
and F L A Machado3
1 Postgraduate Program in Metrology, Pontifıcia Universidade Catolica do Rio de Janeiro, PUC-Rio, RuaMarques de Sao Vicente, 225, Gavea, Rio de Janeiro, RJ, Brazil2 Electrical Engineering Department, Pontifıcia Universidade Catolica do Rio de Janeiro, PUC-Rio, RuaMarques de Sao Vicente, 225, Gavea, Rio de Janeiro, RJ, Brazil3 Department of Physics, Federal University of Pernambuco, UFPE, Recife, PE, Brazil
E-mail: [email protected]
Received 10 October 2010, in final form 21 December 2010Published 15 February 2011Online at stacks.iop.org/MST/22/035204
AbstractThis paper presents the results of investigations recently done by our research group that leadto a new and much better approach to the design of GMI (giant magnetoimpedance) magnetictransducers, which considers the changes in the impedance phase characteristics of GMIsensors due to varying low-intensity magnetic fields, instead of the usual impedance magnitudecharacteristics considered in the GMI literature. The development process of this new class ofmagnetic field transducers is discussed, beginning with the definition of the ideal conditioningof the GMI sensor elements (the dc level and frequency of the excitation current and thesample length), proceeding to compare the differences observed between the impedancemagnitude and phase of GMI sensors and closing with the electronic circuits that conditionribbon-shaped GMI sensors and read their phase or magnitude variation as a function of thelongitudinal magnetic field. Simulation studies, including the full electronic circuit and basedon the experimental data obtained from measured GMI curves, have shown that animprovement in the sensitivity of GMI magnetometers larger than ten times can be expectedwhen phase-based transducers are used instead of magnitude-based transducers. Finally, it isalso shown that phase-based transducers are highly adequate for miniaturization purposes.
Keywords: impedance phase, impedance magnitude, giant magnetoimpedance, magneticsensors and magnetic transducers, biomagnetism
(Some figures in this article are in colour only in the electronic version)
1. Introduction
The Postgraduate Program in Metrology of PUC-Rio,through the research line in biometrology and in partnershipwith the Department of Physics of the Federal Universityof Pernambuco (UFPE), has been carrying out studiesseeking the implementation of high sensitivity prototypes ofmagnetometers based on the giant magnetoimpedance (GMI)phenomenon [1–10].
Recently, our research group has done investigationsaimed at measuring biomagnetic fields using GMI magnetictransducers. More specifically, we are aiming at developinga GMI magnetic transducer capable of measuring the cardiacmagnetic field, whose amplitude, of the associated magneticflux density, is in the order of 100 pT [4, 8, 11–16].
This work presents the effort to maximize the sensitivityof the GMI sensor elements by analyzing the experimentalset of parameters that affect the impedance magnitude andphase sensitivities of the GMI samples (the frequency and
0957-0233/11/035204+09$33.00 1 © 2011 IOP Publishing Ltd Printed in the UK & the USA
Meas. Sci. Technol. 22 (2011) 035204 E C Silva et al
amplitude of the ac excitation current, the length of the GMIribbon-shaped samples and the polarization magnetic field).The influence of the asymmetric GMI (AGMI) effect inducedby dc currents in the behavior of the GMI samples has alsobeen analyzed. This effect is a key factor in the sensitivityimprovement. The analysis is detailed in section 2 [3–10].
On the other hand, an improved electronic circuit capableof exciting the sensor elements and of reading the impedancemagnitude variations of the GMI samples has been developed.This circuit is discussed in section 3.1, which, togetherwith the optimization of the sensor element operation point,increased the sensitivity values of the previous magnitude-based prototypes from 12 V Oe−1 [1] to 108 V Oe−1 [6].However, this sensitivity is still below the required level tomeasure the human heart magnetic field [8, 11–16].
Thus, seeking to improve the transducer sensitivity, thebehavior of the impedance phase of the GMI effect wasanalyzed (instead of the impedance magnitude), using theAGMI effect as well. Following this direction, a new electroniccircuit capable of conditioning and reading the phase shift ofthe GMI sensor elements has been developed [3–5, 8–10].This circuit is discussed in section 3.2.
In the GMI literature, it is usual to consider only themagnitude characteristics. Nevertheless, the phase-basedapproach considered here has been effective in increasingthe transducer sensitivity. In other words, phase-basedtransducers are about ten times more sensitive than theimproved magnitude-based transducers [6]. A comparisonbetween these two possible implementations is presentedthroughout this work. However, it should be mentioned thatfuture developments will be necessary to reach the humanheart magnetic field levels [8].
Finally, it should be noticed that, as shown in section 3.3,the phase-based transducers are much more adequate forminiaturization purposes of the sensor elements [8–10].
1.1. Historical context
The importance of GMI in the world’s scientific scenery hasbeen increasing, and several laboratories have been conductingpromising research in different application areas [17–20]. Arecent example of that importance was the granting of the2007 Nobel Award in Physics to researchers Albert Fert andPeter Grunberg, who discovered the giant magnetoresistance(GMR) [21, 22].
The GMI effect started to be studied intensely in the 1990s.The first results obtained in such studies were interpreted as avariation of the GMR effect, whose experimental behavior isexamined with the application of a continuous current and inthe presence of a continuous magnetic field.
The GMR effect considers only the variation of theresistance, and the phenomenon is explained by the changein the electron motion when their spin is affected bythe magnetization orientation [21]. However, experimentsconducted with samples of amorphous ferromagnetic alloys,using alternating currents, have shown a variation of theresistive component as well as of the reactive component withrespect to both the external magnetic field and the frequency
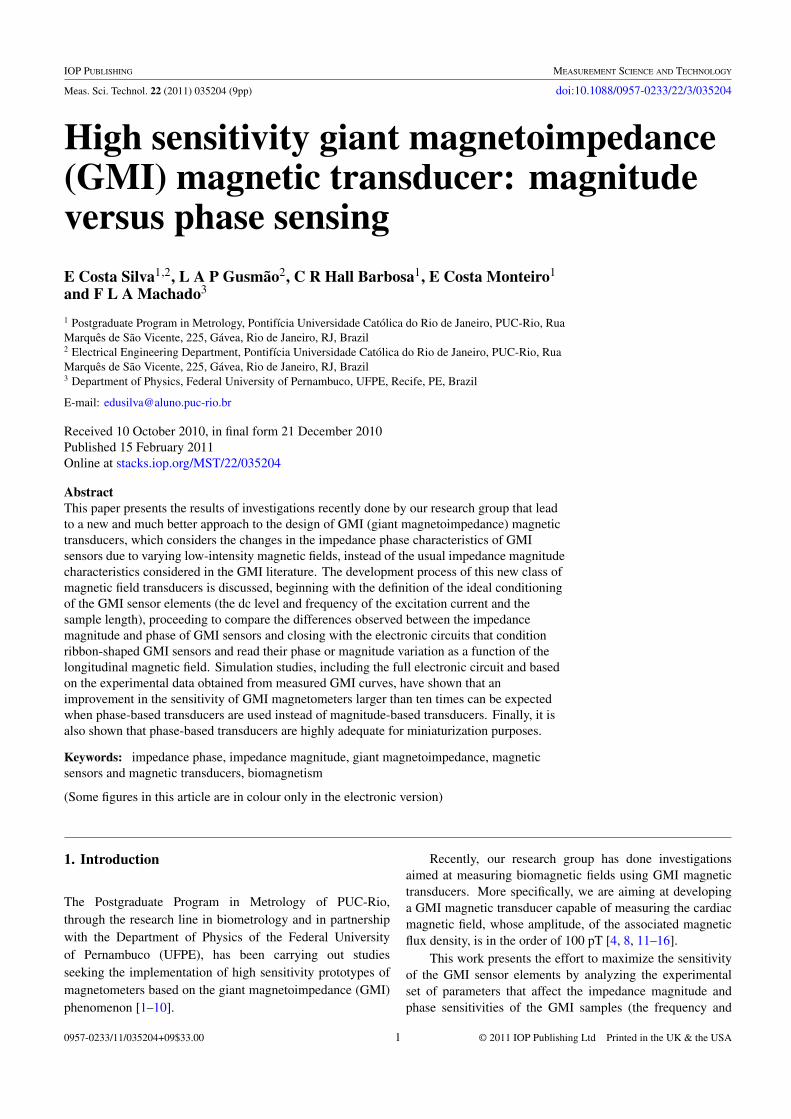
Figure 1. Typical GMI measurement.
of the applied current [8, 17, 23–28]. Thence comes thedesignation GMI.
1.2. GMI effect
This work focuses on a particular case of GMInamed longitudinal magnetoimpedance (LMI). The LMIphenomenon is induced by the application of an alternatingcurrent (I) along the length of a sample of amorphousferromagnetic alloy (ribbon- or wire-shaped), which is subjectto an external magnetic field (H) tangential to it. The differenceof potential (V) is then measured between the extremities ofthe GMI sample, as shown in figure 1.
Using the phasorial description of the ac voltage andcurrent, as well as arbitrating the phase of the current (φI )as zero, the impedance of the GMI sample can be calculatedas
Z = |V | eφV
|I | eφI= |V |
|I | eφ = |Z| cos φ + j|Z| sin φ = R + jX.
(1)
The GMI effect is actually a result of the skin depth (δ)dependence on the transversal magnetic permeability (μt ),which varies not only with the external magnetic field that isapplied to the sample, but also with the frequency and intensityof the current that passes through it. Then, for a GMI ribbon-shaped sample, in agreement with the literature [17, 27, 28],it can be stated that
Z = (1 − i)L
2ωσδ
1
1 − e−(1−i)t
2δ
(2)
and
δ = c
(√1
2πωμtσ
), (3)
where L is the length and t is the thickness of the ribbon, ω isthe frequency of the current and σ is the electrical conductivityof the material.
1.3. AGMI effect
The GMI curves, which indicate the variation of the impedancewith the external magnetic field (H), are usually symmetricalin relation to this field. However, it has been noticed thatcertain conditions favor the emergence of an asymmetry inthose curves, denoted asymmetric giant magnetoimpedance, orthe AGMI effect. Three causes of AGMI are highlighted in theliterature: (a) asymmetry due to dc current, (b) asymmetry dueto the ac magnetic field and (c) asymmetry due to ‘exchangebias’ [8, 17, 29–31].
2
Meas. Sci. Technol. 22 (2011) 035204 E C Silva et al
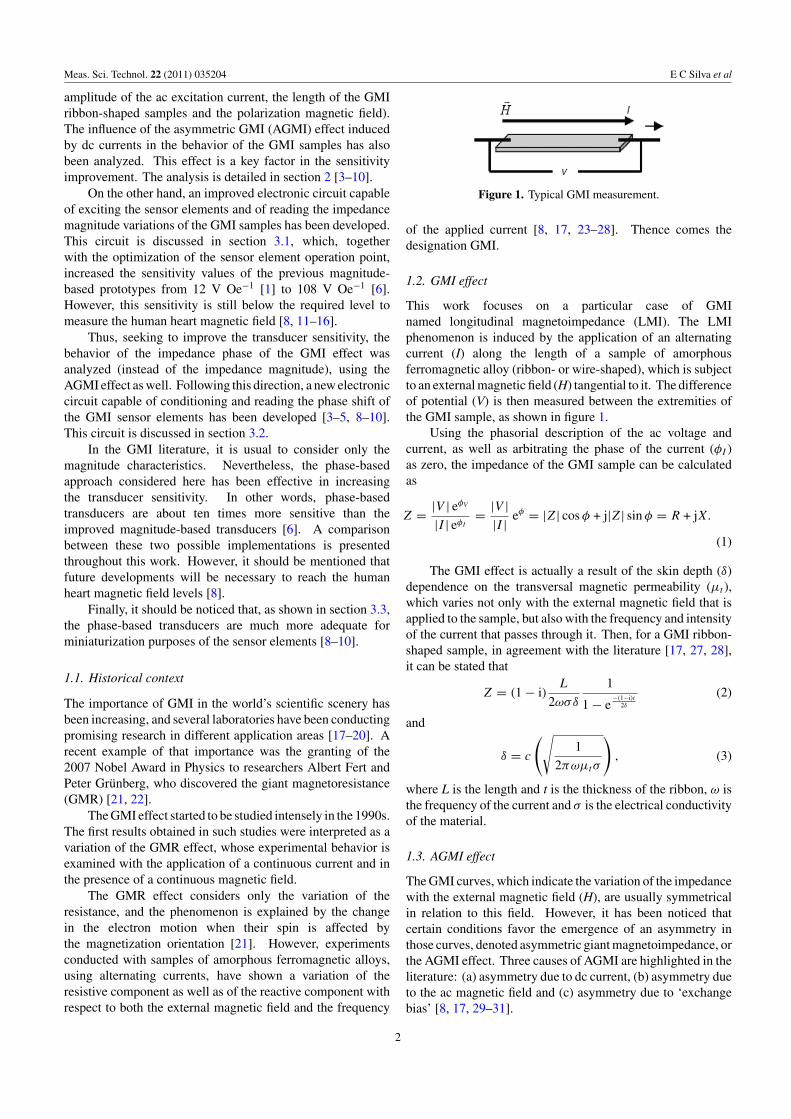
Figure 2. Block diagram of the system used in the characterizationof the GMI ribbons.
As will be seen in the subsequent sections, this workfocuses on the induction of AGMI by overlapping a dcoffset current with the alternating current used in the GMImeasurements. This alone alters significantly the form of thecurves of the GMI effect as a function of the magnetic field[3–10].
By means of AGMI, it is possible to improve boththe magnitude (d|Z|/dH) and phase (dθ/dH) sensitivitiesof the GMI sensor elements [3–6, 8]. This asymmetry ischaracterized by an increase in one of the peaks, or valleys,with a decrease in the other, in either the |Z|–H or the θ–Hcurves, as shown in section 2.2.
2. Impedance characterization
2.1. Methods and procedures
All the measurements were carried out in Co70Fe5Si15B10
ribbon-shaped alloys with an average thickness of 60 μm andan average width of 1.5 mm. The GMI ribbons were put in thecenter of a Helmholtz coil, as shown in figure 2, in order tobe excited by a magnetic field longitudinal to the direction ofthe current that flows through them. Also, the ribbon–coil setwas positioned in a way to guarantee that the magnitude of theEarth’s magnetic field was transversal to the ribbons. Thus, itsinfluence in the measurements has been minimized (the GMIribbons used are of the LMI type, characterized by showingsensitivities to longitudinal magnetic fields at least 100 timeshigher than those observed to transverse fields) [8, 32, 33].
The magnitude and phase readings were taken by anLCR meter, which was also responsible for both ac and dcstimulation of the ribbons. The variation of the magnetic fieldgenerated by the Helmholtz pair was obtained by a dc currentsource, according to
H = 8NI
5√
5R, (4)
where H is the magnetic field in the center of the Helmholtzpair, N the number of wire turns per coil, I the current thatflows through the coils and R the radius of the coils.
The spot welding technique was employed to connectthe terminals of the GMI ribbons to the electrical terminals,aiming at the excitation and reading of the GMI samples by
the LCR meter. Then, the electrical wires were connected tothe electrical terminals using conventional tin–lead solder [8].
The Helmholtz pair used have 48 wire loops in each coiland a radius of 15 cm, then the magnetic field H (Oe), inoersteds, in the center of the Helmholtz pair as a function ofthe current I (A), in amperes, that flows through the coils isgiven by
H(Oe) ≈ 2.87 × I (A). (5)
It is highlighted that oersted (Oe) is the unit of magneticfield in the CGS system, which is broadly used in the giantmagnetoimpedance literature. The SI unit (InternationalSystem of Units) of magnetic field is ampere per meter (A m−1),which is related to the oersted by
1 Oe = 1
4π× 103 A m−1. (6)
2.2. Experimental results
Studies have been conducted analyzing the influence, over theGMI ribbons, of the dc level (0 to 100 mA) and frequency (100kHz to 10 MHz) of the excitation current. Also, it has beeninvestigated how the GMI ribbon length (1, 3, 5 and 15 cm)affects the sensitivity and which is the best biasing field [3–10].The ac current amplitude used to condition the GMI ribbonswas held at 15 mA, because it has been previously seen thatsuch a parameter did not significantly affect the behavior of theanalyzed samples. For the sake of conciseness, only some ofthe characterization curves experimentally obtained, to eachof the four different tested lengths of the GMI samples, arepresented herein.
The current iC , used to condition the GMI samples, iscalled the conditioning or excitation current and it is expressedas
iC = Idc + Iac · sin(2π · f · t), (7)
where Idc is the dc level, Iac is the amplitude and f is thefrequency.
Aiming for a better understanding of figures 3–6, it shouldbe highlighted that, when a dc level is applied to the GMIsamples, negative field values (H) indicate that the dc level ofthe current that flows through the GMI ribbon has the samedirection as the dc magnetic field generated by the Helmholtzpair, and for positive field values the opposite occurs.
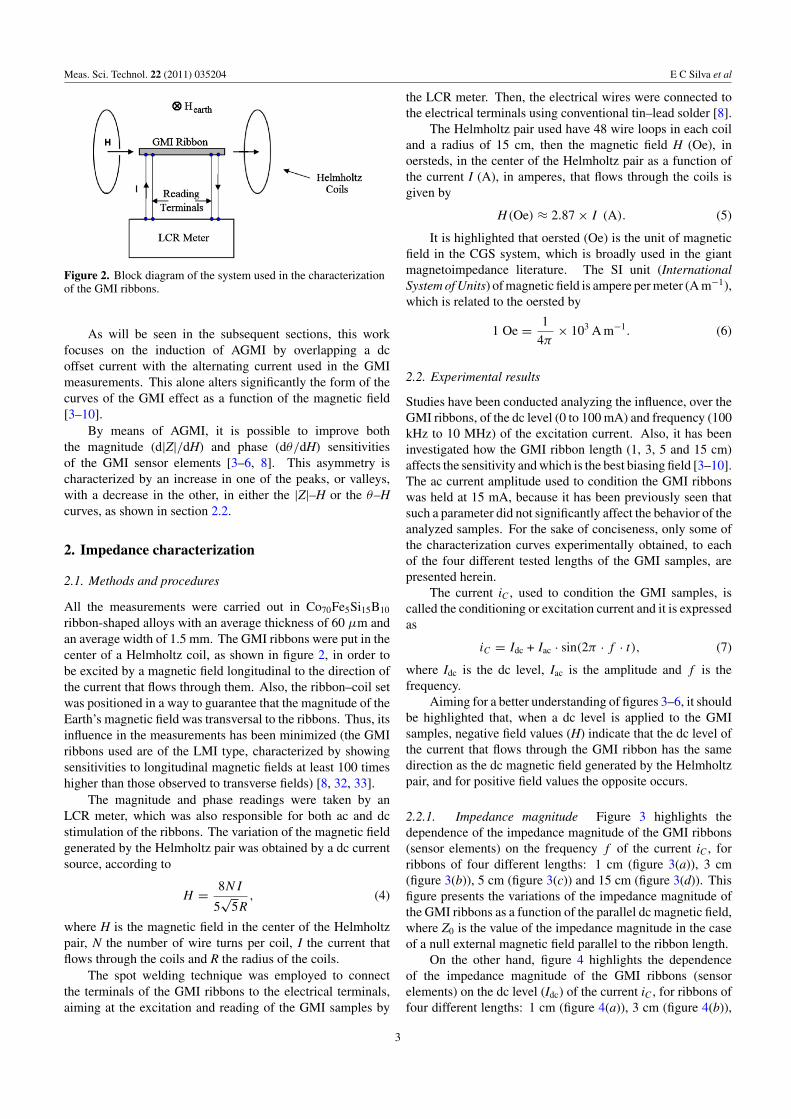
2.2.1. Impedance magnitude Figure 3 highlights thedependence of the impedance magnitude of the GMI ribbons(sensor elements) on the frequency f of the current iC , forribbons of four different lengths: 1 cm (figure 3(a)), 3 cm(figure 3(b)), 5 cm (figure 3(c)) and 15 cm (figure 3(d)). Thisfigure presents the variations of the impedance magnitude ofthe GMI ribbons as a function of the parallel dc magnetic field,where Z0 is the value of the impedance magnitude in the caseof a null external magnetic field parallel to the ribbon length.
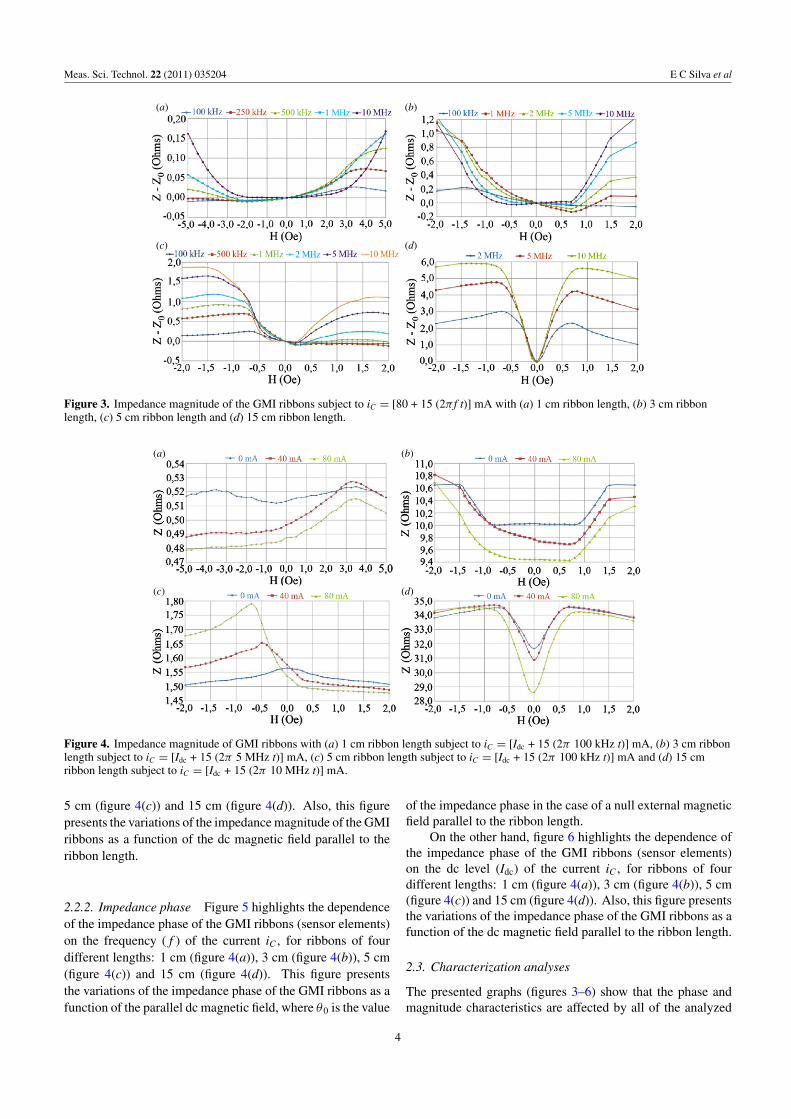
On the other hand, figure 4 highlights the dependenceof the impedance magnitude of the GMI ribbons (sensorelements) on the dc level (Idc) of the current iC , for ribbons offour different lengths: 1 cm (figure 4(a)), 3 cm (figure 4(b)),
3
Meas. Sci. Technol. 22 (2011) 035204 E C Silva et al
(a) (b)
(c) (d)
Figure 3. Impedance magnitude of the GMI ribbons subject to iC = [80 + 15 (2π f t)] mA with (a) 1 cm ribbon length, (b) 3 cm ribbonlength, (c) 5 cm ribbon length and (d) 15 cm ribbon length.
(a) (b)
(c) (d)
Figure 4. Impedance magnitude of GMI ribbons with (a) 1 cm ribbon length subject to iC = [Idc + 15 (2π 100 kHz t)] mA, (b) 3 cm ribbonlength subject to iC = [Idc + 15 (2π 5 MHz t)] mA, (c) 5 cm ribbon length subject to iC = [Idc + 15 (2π 100 kHz t)] mA and (d) 15 cmribbon length subject to iC = [Idc + 15 (2π 10 MHz t)] mA.
5 cm (figure 4(c)) and 15 cm (figure 4(d)). Also, this figurepresents the variations of the impedance magnitude of the GMIribbons as a function of the dc magnetic field parallel to theribbon length.
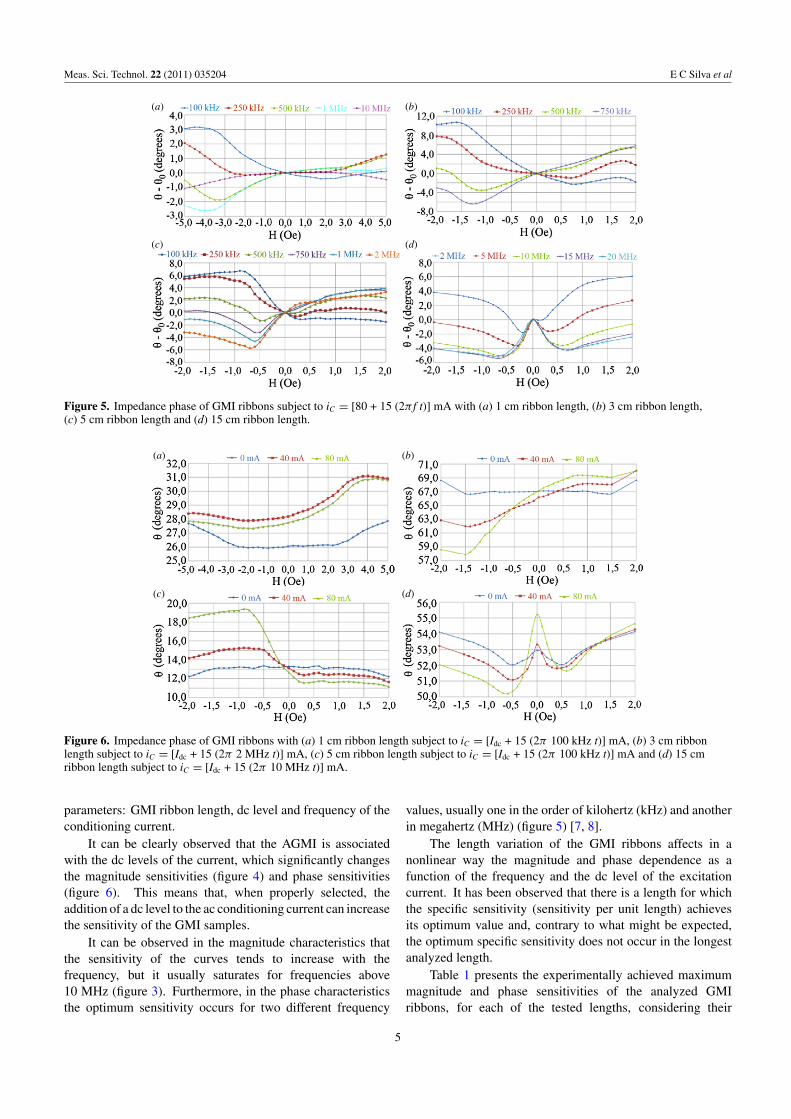
2.2.2. Impedance phase Figure 5 highlights the dependenceof the impedance phase of the GMI ribbons (sensor elements)on the frequency (f ) of the current iC , for ribbons of fourdifferent lengths: 1 cm (figure 4(a)), 3 cm (figure 4(b)), 5 cm(figure 4(c)) and 15 cm (figure 4(d)). This figure presentsthe variations of the impedance phase of the GMI ribbons as afunction of the parallel dc magnetic field, where θ0 is the value
of the impedance phase in the case of a null external magneticfield parallel to the ribbon length.
On the other hand, figure 6 highlights the dependence ofthe impedance phase of the GMI ribbons (sensor elements)on the dc level (Idc) of the current iC , for ribbons of fourdifferent lengths: 1 cm (figure 4(a)), 3 cm (figure 4(b)), 5 cm(figure 4(c)) and 15 cm (figure 4(d)). Also, this figure presentsthe variations of the impedance phase of the GMI ribbons as afunction of the dc magnetic field parallel to the ribbon length.
2.3. Characterization analyses
The presented graphs (figures 3–6) show that the phase andmagnitude characteristics are affected by all of the analyzed
4
Meas. Sci. Technol. 22 (2011) 035204 E C Silva et al
(a) (b)
(c) (d)
Figure 5. Impedance phase of GMI ribbons subject to iC = [80 + 15 (2π f t)] mA with (a) 1 cm ribbon length, (b) 3 cm ribbon length,(c) 5 cm ribbon length and (d) 15 cm ribbon length.
(a) (b)
(c) (d)
Figure 6. Impedance phase of GMI ribbons with (a) 1 cm ribbon length subject to iC = [Idc + 15 (2π 100 kHz t)] mA, (b) 3 cm ribbonlength subject to iC = [Idc + 15 (2π 2 MHz t)] mA, (c) 5 cm ribbon length subject to iC = [Idc + 15 (2π 100 kHz t)] mA and (d) 15 cmribbon length subject to iC = [Idc + 15 (2π 10 MHz t)] mA.
parameters: GMI ribbon length, dc level and frequency of theconditioning current.
It can be clearly observed that the AGMI is associatedwith the dc levels of the current, which significantly changesthe magnitude sensitivities (figure 4) and phase sensitivities(figure 6). This means that, when properly selected, theaddition of a dc level to the ac conditioning current can increasethe sensitivity of the GMI samples.
It can be observed in the magnitude characteristics thatthe sensitivity of the curves tends to increase with thefrequency, but it usually saturates for frequencies above10 MHz (figure 3). Furthermore, in the phase characteristicsthe optimum sensitivity occurs for two different frequency
values, usually one in the order of kilohertz (kHz) and anotherin megahertz (MHz) (figure 5) [7, 8].
The length variation of the GMI ribbons affects in anonlinear way the magnitude and phase dependence as afunction of the frequency and the dc level of the excitationcurrent. It has been observed that there is a length for whichthe specific sensitivity (sensitivity per unit length) achievesits optimum value and, contrary to what might be expected,the optimum specific sensitivity does not occur in the longestanalyzed length.
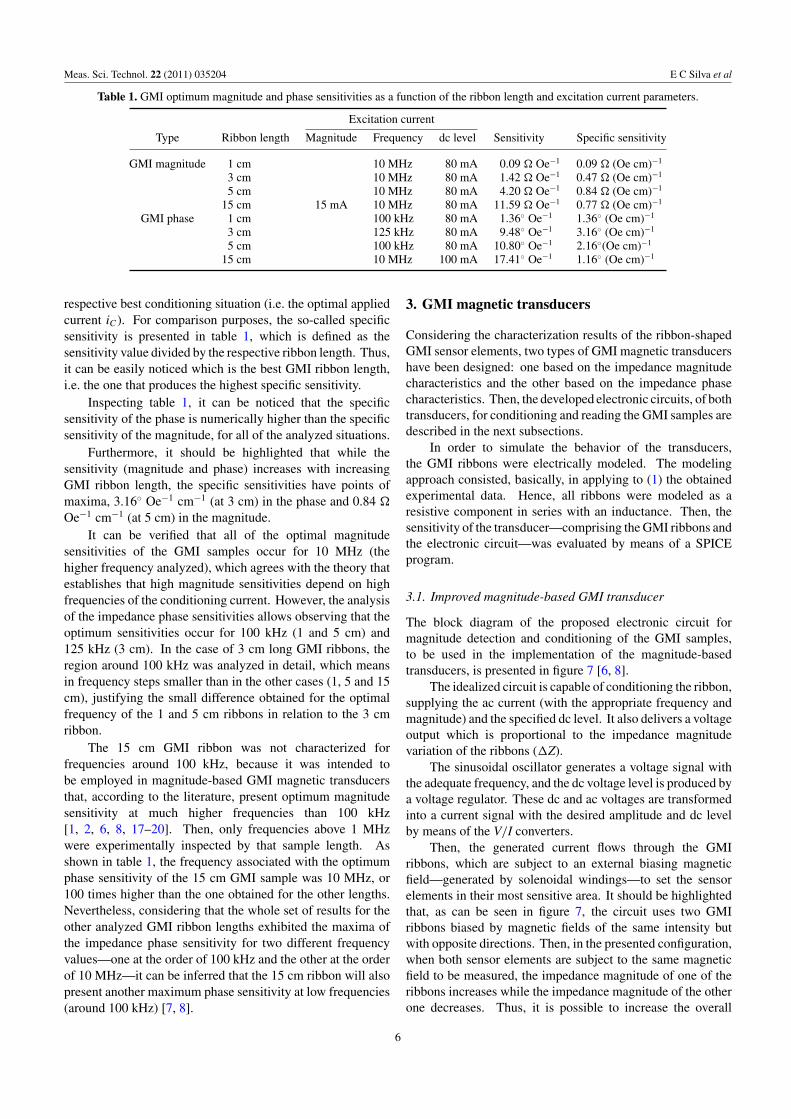
Table 1 presents the experimentally achieved maximummagnitude and phase sensitivities of the analyzed GMIribbons, for each of the tested lengths, considering their
5
Meas. Sci. Technol. 22 (2011) 035204 E C Silva et al
Table 1. GMI optimum magnitude and phase sensitivities as a function of the ribbon length and excitation current parameters.
Excitation current
Type Ribbon length Magnitude Frequency dc level Sensitivity Specific sensitivity
GMI magnitude 1 cm 10 MHz 80 mA 0.09 � Oe−1 0.09 � (Oe cm)−1
3 cm 10 MHz 80 mA 1.42 � Oe−1 0.47 � (Oe cm)−1
5 cm 10 MHz 80 mA 4.20 � Oe−1 0.84 � (Oe cm)−1
15 cm 15 mA 10 MHz 80 mA 11.59 � Oe−1 0.77 � (Oe cm)−1
GMI phase 1 cm 100 kHz 80 mA 1.36◦ Oe−1 1.36◦ (Oe cm)−1
3 cm 125 kHz 80 mA 9.48◦ Oe−1 3.16◦ (Oe cm)−1
5 cm 100 kHz 80 mA 10.80◦ Oe−1 2.16◦(Oe cm)−1
15 cm 10 MHz 100 mA 17.41◦ Oe−1 1.16◦ (Oe cm)−1
respective best conditioning situation (i.e. the optimal appliedcurrent iC). For comparison purposes, the so-called specificsensitivity is presented in table 1, which is defined as thesensitivity value divided by the respective ribbon length. Thus,it can be easily noticed which is the best GMI ribbon length,i.e. the one that produces the highest specific sensitivity.
Inspecting table 1, it can be noticed that the specificsensitivity of the phase is numerically higher than the specificsensitivity of the magnitude, for all of the analyzed situations.
Furthermore, it should be highlighted that while thesensitivity (magnitude and phase) increases with increasingGMI ribbon length, the specific sensitivities have points ofmaxima, 3.16◦ Oe−1 cm−1 (at 3 cm) in the phase and 0.84 �
Oe−1 cm−1 (at 5 cm) in the magnitude.It can be verified that all of the optimal magnitude
sensitivities of the GMI samples occur for 10 MHz (thehigher frequency analyzed), which agrees with the theory thatestablishes that high magnitude sensitivities depend on highfrequencies of the conditioning current. However, the analysisof the impedance phase sensitivities allows observing that theoptimum sensitivities occur for 100 kHz (1 and 5 cm) and125 kHz (3 cm). In the case of 3 cm long GMI ribbons, theregion around 100 kHz was analyzed in detail, which meansin frequency steps smaller than in the other cases (1, 5 and 15cm), justifying the small difference obtained for the optimalfrequency of the 1 and 5 cm ribbons in relation to the 3 cmribbon.
The 15 cm GMI ribbon was not characterized forfrequencies around 100 kHz, because it was intended tobe employed in magnitude-based GMI magnetic transducersthat, according to the literature, present optimum magnitudesensitivity at much higher frequencies than 100 kHz[1, 2, 6, 8, 17–20]. Then, only frequencies above 1 MHzwere experimentally inspected by that sample length. Asshown in table 1, the frequency associated with the optimumphase sensitivity of the 15 cm GMI sample was 10 MHz, or100 times higher than the one obtained for the other lengths.Nevertheless, considering that the whole set of results for theother analyzed GMI ribbon lengths exhibited the maxima ofthe impedance phase sensitivity for two different frequencyvalues—one at the order of 100 kHz and the other at the orderof 10 MHz—it can be inferred that the 15 cm ribbon will alsopresent another maximum phase sensitivity at low frequencies(around 100 kHz) [7, 8].
3. GMI magnetic transducers
Considering the characterization results of the ribbon-shapedGMI sensor elements, two types of GMI magnetic transducershave been designed: one based on the impedance magnitudecharacteristics and the other based on the impedance phasecharacteristics. Then, the developed electronic circuits, of bothtransducers, for conditioning and reading the GMI samples aredescribed in the next subsections.
In order to simulate the behavior of the transducers,the GMI ribbons were electrically modeled. The modelingapproach consisted, basically, in applying to (1) the obtainedexperimental data. Hence, all ribbons were modeled as aresistive component in series with an inductance. Then, thesensitivity of the transducer—comprising the GMI ribbons andthe electronic circuit—was evaluated by means of a SPICEprogram.
3.1. Improved magnitude-based GMI transducer
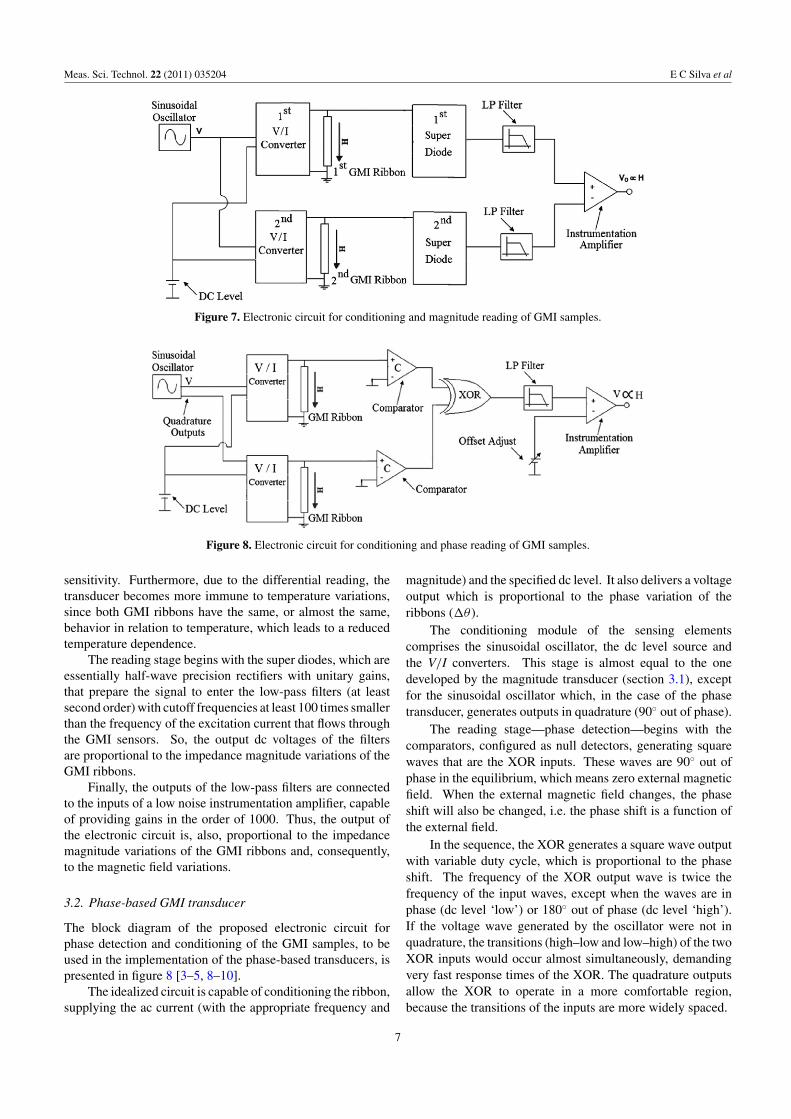
The block diagram of the proposed electronic circuit formagnitude detection and conditioning of the GMI samples,to be used in the implementation of the magnitude-basedtransducers, is presented in figure 7 [6, 8].
The idealized circuit is capable of conditioning the ribbon,supplying the ac current (with the appropriate frequency andmagnitude) and the specified dc level. It also delivers a voltageoutput which is proportional to the impedance magnitudevariation of the ribbons (Z).
The sinusoidal oscillator generates a voltage signal withthe adequate frequency, and the dc voltage level is produced bya voltage regulator. These dc and ac voltages are transformedinto a current signal with the desired amplitude and dc levelby means of the V/I converters.
Then, the generated current flows through the GMIribbons, which are subject to an external biasing magneticfield—generated by solenoidal windings—to set the sensorelements in their most sensitive area. It should be highlightedthat, as can be seen in figure 7, the circuit uses two GMIribbons biased by magnetic fields of the same intensity butwith opposite directions. Then, in the presented configuration,when both sensor elements are subject to the same magneticfield to be measured, the impedance magnitude of one of theribbons increases while the impedance magnitude of the otherone decreases. Thus, it is possible to increase the overall
6
Meas. Sci. Technol. 22 (2011) 035204 E C Silva et al
Figure 7. Electronic circuit for conditioning and magnitude reading of GMI samples.
Figure 8. Electronic circuit for conditioning and phase reading of GMI samples.
sensitivity. Furthermore, due to the differential reading, thetransducer becomes more immune to temperature variations,since both GMI ribbons have the same, or almost the same,behavior in relation to temperature, which leads to a reducedtemperature dependence.
The reading stage begins with the super diodes, which areessentially half-wave precision rectifiers with unitary gains,that prepare the signal to enter the low-pass filters (at leastsecond order) with cutoff frequencies at least 100 times smallerthan the frequency of the excitation current that flows throughthe GMI sensors. So, the output dc voltages of the filtersare proportional to the impedance magnitude variations of theGMI ribbons.
Finally, the outputs of the low-pass filters are connectedto the inputs of a low noise instrumentation amplifier, capableof providing gains in the order of 1000. Thus, the output ofthe electronic circuit is, also, proportional to the impedancemagnitude variations of the GMI ribbons and, consequently,to the magnetic field variations.
3.2. Phase-based GMI transducer
The block diagram of the proposed electronic circuit forphase detection and conditioning of the GMI samples, to beused in the implementation of the phase-based transducers, ispresented in figure 8 [3–5, 8–10].
The idealized circuit is capable of conditioning the ribbon,supplying the ac current (with the appropriate frequency and
magnitude) and the specified dc level. It also delivers a voltageoutput which is proportional to the phase variation of theribbons (θ ).
The conditioning module of the sensing elementscomprises the sinusoidal oscillator, the dc level source andthe V/I converters. This stage is almost equal to the onedeveloped by the magnitude transducer (section 3.1), exceptfor the sinusoidal oscillator which, in the case of the phasetransducer, generates outputs in quadrature (90◦ out of phase).
The reading stage—phase detection—begins with thecomparators, configured as null detectors, generating squarewaves that are the XOR inputs. These waves are 90◦ out ofphase in the equilibrium, which means zero external magneticfield. When the external magnetic field changes, the phaseshift will also be changed, i.e. the phase shift is a function ofthe external field.
In the sequence, the XOR generates a square wave outputwith variable duty cycle, which is proportional to the phaseshift. The frequency of the XOR output wave is twice thefrequency of the input waves, except when the waves are inphase (dc level ‘low’) or 180◦ out of phase (dc level ‘high’).If the voltage wave generated by the oscillator were not inquadrature, the transitions (high–low and low–high) of the twoXOR inputs would occur almost simultaneously, demandingvery fast response times of the XOR. The quadrature outputsallow the XOR to operate in a more comfortable region,because the transitions of the inputs are more widely spaced.
7
Meas. Sci. Technol. 22 (2011) 035204 E C Silva et al
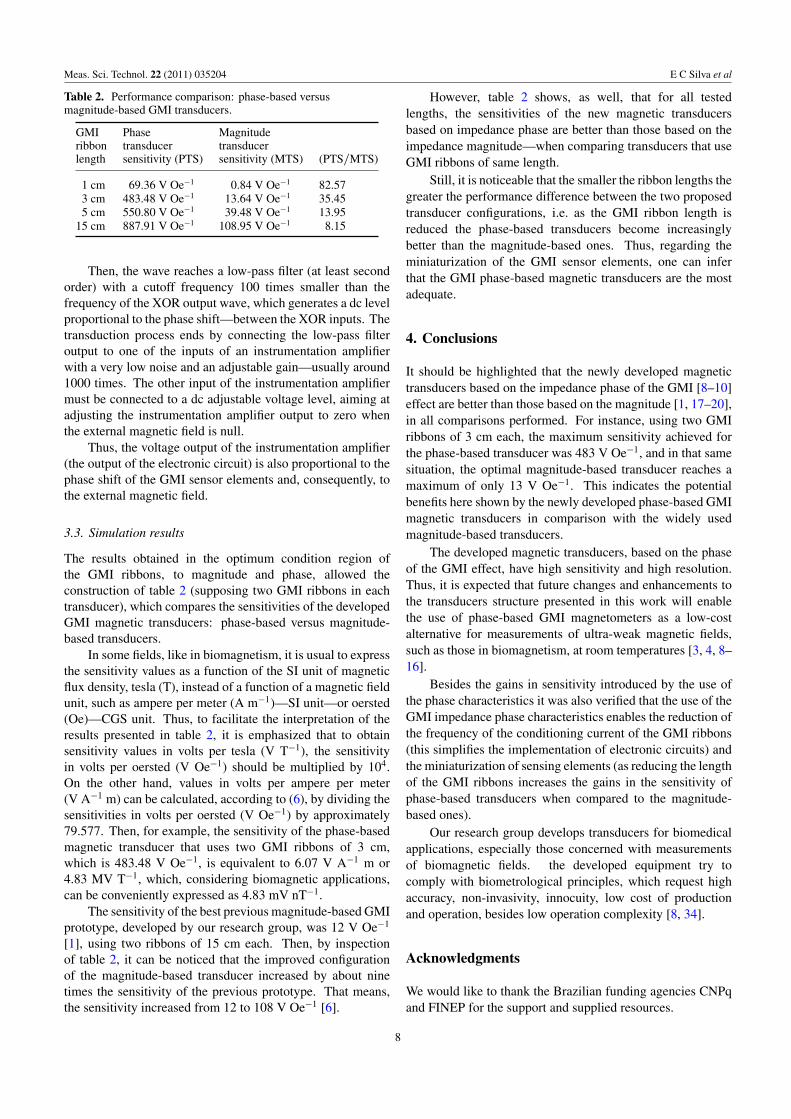
Table 2. Performance comparison: phase-based versusmagnitude-based GMI transducers.
GMI Phase Magnituderibbon transducer transducerlength sensitivity (PTS) sensitivity (MTS) (PTS/MTS)
1 cm 69.36 V Oe−1 0.84 V Oe−1 82.573 cm 483.48 V Oe−1 13.64 V Oe−1 35.455 cm 550.80 V Oe−1 39.48 V Oe−1 13.95
15 cm 887.91 V Oe−1 108.95 V Oe−1 8.15
Then, the wave reaches a low-pass filter (at least secondorder) with a cutoff frequency 100 times smaller than thefrequency of the XOR output wave, which generates a dc levelproportional to the phase shift—between the XOR inputs. Thetransduction process ends by connecting the low-pass filteroutput to one of the inputs of an instrumentation amplifierwith a very low noise and an adjustable gain—usually around1000 times. The other input of the instrumentation amplifiermust be connected to a dc adjustable voltage level, aiming atadjusting the instrumentation amplifier output to zero whenthe external magnetic field is null.
Thus, the voltage output of the instrumentation amplifier(the output of the electronic circuit) is also proportional to thephase shift of the GMI sensor elements and, consequently, tothe external magnetic field.
3.3. Simulation results
The results obtained in the optimum condition region ofthe GMI ribbons, to magnitude and phase, allowed theconstruction of table 2 (supposing two GMI ribbons in eachtransducer), which compares the sensitivities of the developedGMI magnetic transducers: phase-based versus magnitude-based transducers.
In some fields, like in biomagnetism, it is usual to expressthe sensitivity values as a function of the SI unit of magneticflux density, tesla (T), instead of a function of a magnetic fieldunit, such as ampere per meter (A m−1)—SI unit—or oersted(Oe)—CGS unit. Thus, to facilitate the interpretation of theresults presented in table 2, it is emphasized that to obtainsensitivity values in volts per tesla (V T−1), the sensitivityin volts per oersted (V Oe−1) should be multiplied by 104.On the other hand, values in volts per ampere per meter(V A−1 m) can be calculated, according to (6), by dividing thesensitivities in volts per oersted (V Oe−1) by approximately79.577. Then, for example, the sensitivity of the phase-basedmagnetic transducer that uses two GMI ribbons of 3 cm,which is 483.48 V Oe−1, is equivalent to 6.07 V A−1 m or4.83 MV T−1, which, considering biomagnetic applications,can be conveniently expressed as 4.83 mV nT−1.
The sensitivity of the best previous magnitude-based GMIprototype, developed by our research group, was 12 V Oe−1
[1], using two ribbons of 15 cm each. Then, by inspectionof table 2, it can be noticed that the improved configurationof the magnitude-based transducer increased by about ninetimes the sensitivity of the previous prototype. That means,the sensitivity increased from 12 to 108 V Oe−1 [6].
However, table 2 shows, as well, that for all testedlengths, the sensitivities of the new magnetic transducersbased on impedance phase are better than those based on theimpedance magnitude—when comparing transducers that useGMI ribbons of same length.
Still, it is noticeable that the smaller the ribbon lengths thegreater the performance difference between the two proposedtransducer configurations, i.e. as the GMI ribbon length isreduced the phase-based transducers become increasinglybetter than the magnitude-based ones. Thus, regarding theminiaturization of the GMI sensor elements, one can inferthat the GMI phase-based magnetic transducers are the mostadequate.
4. Conclusions
It should be highlighted that the newly developed magnetictransducers based on the impedance phase of the GMI [8–10]effect are better than those based on the magnitude [1, 17–20],in all comparisons performed. For instance, using two GMIribbons of 3 cm each, the maximum sensitivity achieved forthe phase-based transducer was 483 V Oe−1, and in that samesituation, the optimal magnitude-based transducer reaches amaximum of only 13 V Oe−1. This indicates the potentialbenefits here shown by the newly developed phase-based GMImagnetic transducers in comparison with the widely usedmagnitude-based transducers.
The developed magnetic transducers, based on the phaseof the GMI effect, have high sensitivity and high resolution.Thus, it is expected that future changes and enhancements tothe transducers structure presented in this work will enablethe use of phase-based GMI magnetometers as a low-costalternative for measurements of ultra-weak magnetic fields,such as those in biomagnetism, at room temperatures [3, 4, 8–16].
Besides the gains in sensitivity introduced by the use ofthe phase characteristics it was also verified that the use of theGMI impedance phase characteristics enables the reduction ofthe frequency of the conditioning current of the GMI ribbons(this simplifies the implementation of electronic circuits) andthe miniaturization of sensing elements (as reducing the lengthof the GMI ribbons increases the gains in the sensitivity ofphase-based transducers when compared to the magnitude-based ones).
Our research group develops transducers for biomedicalapplications, especially those concerned with measurementsof biomagnetic fields. the developed equipment try tocomply with biometrological principles, which request highaccuracy, non-invasivity, innocuity, low cost of productionand operation, besides low operation complexity [8, 34].
Acknowledgments
We would like to thank the Brazilian funding agencies CNPqand FINEP for the support and supplied resources.
8
Meas. Sci. Technol. 22 (2011) 035204 E C Silva et al
References
[1] Pompeia F, Gusmao L A P, Hall Barbosa C R,Costa Monteiro E, Goncalves L A P and Machado F L A2008 Ring shaped magnetic field transducer based on theGMI effect Meas. Sci. Technol. 19 025801
[2] Ramos Louzada D, Costa Monteiro E, Gusmao L A P andHall Barbosa C R 2007 Medicao nao-invasiva de ondas depulso arterial utilizando transdutor de pressao MIG(Arterial pulse waves non-invasive measurement using aGMI pressure transducer) Proc. 4th Latin AmericanCongress on Biomedical Engineering (Venezuela) (Berlin:Springer) pp 1–4
[3] Costa Silva E, Gusmao L A P, Hall Barbosa C R and CostaMonteiro E 2008 Magnetic field transducers based on thephase characteristics of GMI sensors and aimed tobiomedical applications Proc. 13th Int. Conf. on BiomedicalEngineering (Singapore) vol 23 pp 652–6
[4] Costa Silva E, Gusmao L A P, Hall Barbosa C R andCosta Monteiro E 2009 High sensitivity triaxial magneticfield transducer, based on the phase characteristics of theGMI effect Proc. 12th IMEKO World Congress (Portugal)pp 1755–9
[5] Costa Silva E, Gusmao L A P, Hall Barbosa C R andCosta Monteiro E 2010 Transdutor de pressao, baseado nascaracterısticas de fase do efeito GMI, destinado a aplicacoesbiomedicas (Pressure transducer, based on the phasecharacteristics of the GMI effect, aimed at biomedicalapplications) Controle & Automacao (Preprint)
[6] Costa Silva E, Gusmao L A P, Hall Barbosa C R,Monteiro Costa and Machado F L A 2010 Optimization ofthe sensitivity of GMI biomedical transducers Braz. J.Biomed. Eng. (Preprint)
[7] Costa Silva E, Gusmao L A P, Hall Barbosa C R andCosta Monteiro E 2010 Seesaw behavior in the impedancephase characteristics of Co75−xFexSi15B10 GMI samplesProc. 9th Brazilian MRS Meeting (Brazil)
[8] Costa Silva E 2010 Development of a transducer based on thephase of the giant magnetoimpedance for the measurementof biomagnetic fields Master Thesis Postgraduate Programin Metrology, Pontifıcia Universidade Catolica do Rio deJaneiro (PUC-Rio)
[9] Costa Silva E, Gusmao L A P, Hall Barbosa C,Costa Monteiro E, Machado F L A, Pompeia F andLouzada D R 2009 Patent BR no PI 0902770-0PUC-Rio—Pontifıcia Universidade Catolica do Rio deJaneiro
[10] Costa Silva E, Gusmao L A P, Hall Barbosa C, CostaMonteiro E, Machado F L A, Pompeia F and Louzada D R2010 Patent International Application no PCT/BR2010/000026 PUC-Rio—Pontifıcia Universidade Catolica do Riode Janeiro
[11] Costa Monteiro E, Penna S D, Donato L, Luzio S, Romani G Land Erne G L 1997 The study of steady magnetic fieldsassociated with primary and secondary ST shift inischaemic rabbit hearts Physiol. Meas. 18 191–200
[12] Costa Monteiro E, Schleussner E, Kausch S, Grimm B,Schneider A, Hall Barbosa C R and Haueisen J 2001 Fetalcardiac activity analysis during twin pregnancy using amulti-channel SQUID system Physica C 354 87–90
[13] Costa Monteiro E, Eiselt M, Giessler F, Haueisen J,Hall Barbosa C R and Lima E A 2001 Animalexperimentation study of atrial activity propagation using amulti-channel SQUID system Biomed. Tech.Erganzungsband 46 70–2
[14] Costa Monteiro E, Hall Barbosa C R, Eiselt M, Giessler Fand Haueisen J 2004 Magnetic imaging of electrical
propagation at the apex of isolated rabbit heart Biomed.Tech. Suppl. 48 168–70
[15] Yamada S and Yamaguchi I 2005 Magnetocardiograms inclinical medicine: unique information on cardiac ischemia,arrhythmias, and fetal diagnosis Intern. Med. 44 1–19
[16] Andra W and Nowak H 2007 Magnetism in Medicine: AHandbook 2nd edn (Weinheim: Wiley-VCH)
[17] Phan M-H and Peng H-X 2008 Giant magnetoimpedancematerials: fundamentals and applications Prog. Mater. Sci.53 323–420
[18] Lenz J and Edelstein A S 2006 Magnetic sensors and theirapplications IEEE Sensors J. 6 631–49
[19] Mahdi A E, Panina L and Mapps D 2003 Some new horizonsin magnetic sensing: high-Tc SQUIDs, GMR and GMImaterials Sensors Actuators A 105 271–85
[20] Hauser H, Kraus L and Ripka P 2001 Giantmagnetoimpedance sensors IEEE Instrum. Meas. Mag.4 28–32
[21] Fert A 2007 The origin, development and future of spintronicsNobel Lecture (Sweden), available at http://nobelprize.org/nobel_prizes/physics/laureates/2007/fert_lecture.pdf
[22] Grunberg P 2007 From spinwaves to giant magnetoresistance(GMR) and beyond Nobel Lecture (Sweden), available athttp://nobelprize.org/nobel_prizes/physics/laureates/2007/grunberg_lecture.pdf
[23] Mendes K C and Machado F L A 1998 Enhanced GMI inribbons of Co70.4Fe4.6Si15B10 J. Magn. Magn. Mater.177 111–3
[24] Soares J M, de Araujo J H, Cabral F A O, Dumelow T,Machado F L A and Araujo A E P 2002 Giantmagnetoimpedance in FeAg granular alloys Appl. Phys.Lett. 80 2532–4
[25] Castro G M B, Rodrigues A R, Machado F L A, Araujo A E P,Jardim R F and Nigam A K 2004 Magneto-impedancemeasurements in bulk samples of La0.7Ca0.3MnO3 andLa0.6Y0.1Ca0.3MnO3 J. Alloys Compd. 369 108–11
[26] Goncalves L A P, Soares J M, Machado F L A and de AzevedoW M 2006 GMI effect in the low magnetostrictiveCo70Fe5Si15B10 alloy Physica B 384 152–4
[27] Machado F L A and Rezende S M 1996 A theoretical modelfor the giant magnetoimpedance in ribbons of amorphoussoft-ferromagnetic alloys J. Appl. Phys. 79 6958–60
[28] Knobel V and Pirota K R 2002 Giant magnetoimpedanceconcepts and recent progress J. Magn. Magn. Mater.242 33–40
[29] Machado F L A, Rodrigues A R, Puca A A andde Araujo A E P 1999 Highly asymmetric giantmagnetoimpedance Mater. Sci. Forum 302–303 202–8
[30] Kim C G, Jang K J, Kim H C and Yoon S S 1999 Asymmetricgiant magnetoimpedance in field-annealing Co-basedamorphous ribbon J. Appl. Phys. 85 5447–9
[31] Makhnovskiy D P, Panina L V and Mapps D J 2000Asymmetric magnetoimpedance in as-cast CoFeSiBamorphous wires due to ac bias Appl. Phys. Lett. 77 121–3
[32] Mendes K C, Machado F L A, Pereira L G, Rezende S M,Montenegro F C, Altoe M V P and Missell F P 1996 Gianttransversal magnetoimpedance and Hall-effectmeasurements in Co70.4Fe4.6Si15B10 J. Appl. Phys.79 6555–7
[33] Goncalves L A P, Soares J M, Machado F L A andRodrigues A R 2006 Hall and giant magnetoimpedanceeffects in the Co70Fe5Si15B10 metallic glass J. Non-Cryst.Solids 352 3659–62
[34] Costa Monteiro E 2007 Biometrologia: confiabilidade nasbiomedicoes e repercussoes eticas (Biometrology:reliability in biomeasurements and ethical repercussions)Metrol. Instrum. 6 6–12
9