Embed Size (px)
Citation preview
High-Sensitivity Gas Sensors Based onGas-Permeable Liquid Core Waveguides andLong-Path Absorbance Detection
Purnendu K. Dasgupta,* Zhang Genfa, Simon K. Poruthoor, Steven Caldwell, and Shen Dong
Department of Chemistry and Biochemistry Texas Tech University, Lubbock, Texas 79409-1061
Su-Yi Liu
World Precision Instruments, Sarasota, Florida 34240
A new fluoropolymer is proposed as the basis of a novelclass of sensors. The devices are based on selectivechromogenic reactions and in situ long-path optical ab-sorbance measurement. The polymer is transparent from200 to 2000 nm and has the lowest known refractiveindex (RI) of any synthetic polymer. The RI is less thanthat of water. A tube of this material, filled with anaqueous solution (or virtually any other liquid), behavesas a liquid core optical fiber. As a result, long-path lengthoptical cells are possible without significant loss of light.The material is highly permeable to a number of tracegases of environmental interest. Relative to common poly-(tetrafluoroethylene) (PTFE)-type Teflon, the new amor-phous fluoropolymer (Teflon AF 2400) is more than 3orders of magnitude more permeable to many gases. Ifa Teflon AF tube is filled with a reagent that responds toa gaseous analyte by undergoing a change that is spec-troscopically detectable, an unusually versatile, sensitive,and inexpensive gas sensor can be made with conven-tional optical fibers at each end, connected respectivelyto an inexpensive light source such as a light-emittingdiode and a photodiode detector. A capillary hollow fiberstructure allows a high surface-to-volume ratio, allowinghigh sensitivity, and supports a thin wall, with responsetimes down to subsecond periods. The potential forsimilar sensors for volatile organic compounds dissolvedin water is also demonstrated.
According to the Lambert-Beer law, other factors remainingthe same, the sensitivity of optical absorbance detection is directlyrelated to the optical path length. Consequently, much effort hasbeen spent over the years to design long-path cells, generally ofcapillary bore to reduce the measurement volume. Absorbancemeasurement cells with path lengths of several meters with lasersas a light source were described by Fuwa et al.1 Even earlier,when light-emitting diodes (LEDs) were first introduced as lightsources, the first reported LED-based absorbance measurementcells utilized a 30-cm-long path.2 However, with divergent sources,
so much source light is lost to the walls, the detector becomeslight starved and noise increases at a rate faster than thesensitivity. For this reason, optimum detection limits in conven-tional cells are actually reached with fairly short path lengths;3,4
4-8-mm path lengths are most commonly used in current flow-through detectors such as those used in flow injection analysis(FIA) or high-pressure liquid chromatography (HPLC).
Light losses to the wall can be reduced with a reflective surface.Many liquid media of interest tarnish metallic or internallymetallized tubes. Moreover, such tubes are far from totallyreflectiveshigh attenuation generally results within a short length.If a glass or quartz tube is externally metallized, sample compat-ibility problems are largely eliminated but attenuation losses areeven higher. These problems could be solved if the sample cellbehaved as a waveguide; i.e., within a given acceptance angle andexcept for the portion that is actually absorbed by the sample,the light launched into the cell is essentially totally transmittedto the other side. To behave as an optical fiber, the light mustbe trapped within an optically denser (higher refractive index, RI)medium. A clean glass capillary does behave in a fashion as awaveguideslight launched into the bore is reflected at the externalglass-air interface. To keep light losses at a manageable level,the capillary must have a very thin wall and then be protectedexternally from soiling by incorporating it within a protective butnoncontacting jacket. While this is indeed possible,5 it does makefor a fragile and unwieldy arrangement. A decade ago, one of usdescribed a liquid core waveguide based on a tube made of air,as it were, fabricated by pneumatically introducing air throughthe exposed sides of a vertically placed porous hydrophobicmembrane tube.6 Again, the delicate balance of pressure neces-sary to maintain a gas shell but not introduce air bubbles into theliquid makes for an arrangement that is impractical for mostpurposes.
Of course, one can also achieve a liquid core waveguide bychoosing a high RI liquid. Carbon disulfide has a RI higher than
(1) Lei, W.; Fujiwara, K.; Fuwa, K. Anal. Chem. 1983, 55, 951.
(2) Flaschka, H.; McKeithan, C.; Barnes, R. M. Anal. Lett. 1973, 6, 585.(3) Poppe, H. Anal. Chim. Acta 1980, 114, 59.(4) Poppe, H. Anal. Chim. Acta 1983, 145, 17.(5) Ruzicka, J. University of Washington, Seattle, WA, personal communication,
1988.(6) Dasgupta, P. K.; Petersen, K. Spectroscopy 1987, 2, 50.
Anal. Chem. 1998, 70, 4661-4669
10.1021/ac980803t CCC: $15.00 © 1998 American Chemical Society Analytical Chemistry, Vol. 70, No. 22, November 15, 1998 4661Published on Web 10/17/1998
that of glass (1.63 vs typically 1.52 for the sodium D-line) and waschosen early on for this purpose.7 Unfortunately, this odorousand toxic solvent is not particularly useful for most real analyticalpurposes. Some aqueous solutions of high concentrations, e.g.,concentrated solutions of sucrose (saturated aqueous solution RI1.50), etc., also show high transmission when used in a low-RIpolymeric capillary, e.g., of poly(tetrafluoroethylene) (PTFE).6
However, it is debatable whether the transition from CS2 to (highlyviscous) sugar solutions represents any real step forward. Tsun-oda et al.8 showed a more practical arrangement in working withethanol (RI 1.36) in a fluorinated ethylene-propylene (FEP)copolymer (RI 1.34). Similarly, Hong and Burgess9 showed that,by incorporating large amounts of ethylene glycol (RI 1.43) inaqueous liquids, the overall RI can be raised sufficiently to attaingood light transmission in PTFE conduits.
A complete history of the development of liquid core waveguide-based absorbance measurement is not necessary for our purposes;further, Altkorn et al.10 have recently reviewed this matter inadmirable detail. Without a doubt, the most important develop-ment has been the introduction of a new fluorocarbon polymer,Teflon AF (amorphous fluoropolymer),11 a copolymer of perfluoro-2,2-dimethyl-1,3-dioxole (hereinafter called dioxole) and tetrafluo-roethylene that has a RI that decreases with increasing dioxolecontent.12,13 Teflon AF 1600 and 2400 have dioxole contents of65 and 87-90%, respectively, with RI values of 1.31 and 1.29. Thepolymers are optically transparent through 200-2000 nm. TeflonAF 1600 is also available as a solution in a fluorocarbon solvent.Capillaries made of Teflon AF are now semicommercially available.Conduits of other materials can also be coated internally withTeflon AF relatively easily because of its solution processability.Transparent capillaries, e.g., of quartz, can be coated on theexterior with Teflon AF as well and are commercially available.10,14
We are aware of at least one publication that uses a Teflon AF-based long-path liquid core waveguide to attain nanomolar limitsof detection (LODs) for the colorimetric detection of iron inseawater.15 However, the aspiring experimenter should note thata bewildering variety of patents, seemingly on the same subject,cover the use of Teflon AF in liquid core waveguides.16-22
From a perspective of polymer morphology, Teflon AF has avery large free volume; this intrinsic property results in not onlyan exceptionally low RI but also a very high permeability to avariety of gases and vapors, often 3 orders of magnitude higherthan PTFE.12,13 Further, the solution processability of the material
and its greater rigidity compared to PTFE makes it facile to workwith very thin walled tubes or thin-film devices of other geometry.This permits high transmembrane gas fluxes. Hong and Burgess9
made an asymmetric tubular membrane by coating a 1-µm-thicklayer of Teflon AF 1600 inside a porous polypropylene tube. Fromthe data presented, response times of this device to ammonia was∼1 min compared to ∼15 and ∼60 min for 84- and 150-µm-thickmembranes of PTFE, respectively. Since the response time insuch devices is proportional to the square of the thickness, theseresults are not especially encouraging (it can be easily computedfrom the above data that a 1-µm-thick PTFE film should result ina response time significantly less than 1 s) since diffusion throughthe physically porous outer membrane itself should occur in asubsecond time scale.23 In addition, adhesion of Teflon AF to anonfluorocarbon material is usually not good and such anarrangement may not be stable unless a fluorinated interlayer iscreated.24
In the present work, we show that, in conjunction with selectivechromogenic reactions, Teflon AF 2400 capillaries make attractivegas sensors based on extended path absorbance measurements.We further show that very thin walled (below 20-µm wallthickness) tubular Teflon AF 1600 devices can be fabricated inthe laboratory that respond in subsecond time scales. Differentmodes of the operation of such devices are discussed withillustrative test gases.
EXPERIMENTAL SECTIONMaterials and Equipment. Teflon AF 2400 capillaries in
different sizes were obtained from Biogeneral Inc. (San Diego,CA). Teflon AF 1600 capillaries were a gift of W. D. Van Hoeven,DuPont Fluoroproducts. Teflon AF 1600-coated fused-silica capil-laries (100-µm i.d., 375-µm o.d., TSU 100375) were obtained fromPolymicro Technologies (Phoenix, AZ). The light source in thephotometric experiments with chlorine was a high-brightness blueLED (Panasonic LNG992CFBW, manufacturer stated centeremission wavelength 470 nm, found 481 nm, specified half-width40 nm, found 32 nm, Digi-Key Corp., Thief River Falls, MN). Asuperluminescent green LED (Nichia 590S, manufacturer statedcenter emission wavelength 505 nm, found 495 nm, specified half-width 40 nm, found 47 nm) were used for experiments with H2Sand NO2. Small silicon photodiodes (type S2007, ElectronicGoldmine, Phoenix, AZ) were used as photodetectors. Exceptas stated, reagents were obtained from Aldrich Chemical and usedwithout further purification.
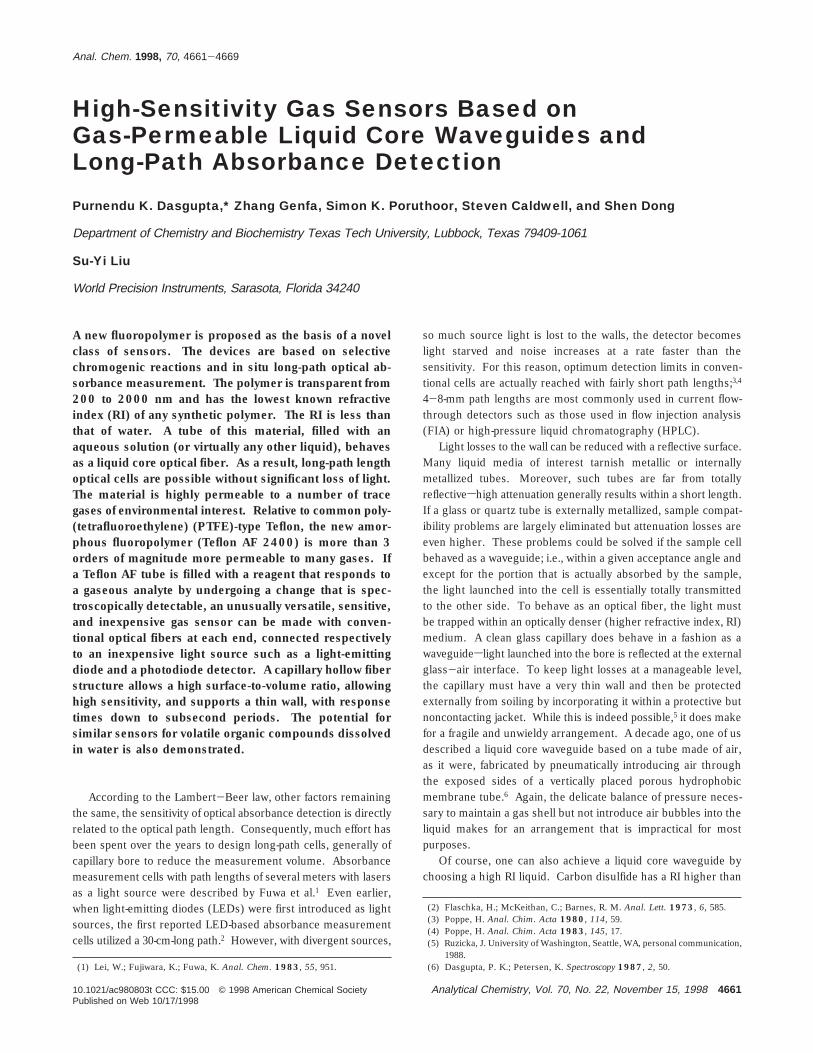
Gas Sensing Devices. (a) Devices Made from Com-mercially Available Tubes. The basic construction of theannular tubular device is shown schematically in Figure 1. TheTeflon AF 2400 tube constitutes the central element. Activelengths ranging between 15 and 30 cm were used in this work. Aglass tube of 4-mm i.d. surrounds the Teflon tube and an innerpair of polypropylene tees that fit securely into the glass jacketprovides the means of flowing gas around it. Spacers made frompoly(vinyl chloride) (PVC) pump tubing (Elkay Products, Shrews-bury, MA) seal the exits of the Teflon tube from the tees. TheTeflon tube then enters an outer tee at each end where an acrylicoptical fiber (Edmund Scientific, Barrington, NJ) of appropriate
(7) Fujiwara, K.; Fuwa, K. Anal. Chem. 1985, 57, 1013.(8) Tsunoda, K.; Nomura, A.; Yamada, J.; Nishi, S. Appl. Spectrosc. 1990, 44,
1163.(9) Hong, K. E.; Burgess, L. W. Proc. SPIE 1994, 2293, 71.
(10) Altkorn, R.; Koev, I,; Gottlieb, A. Appl. Spectrosc. 1997, 51, 1554.(11) DuPont Fluroproducts, Teflon AF Amorphous Fluoropolymers. H-16577-1,
Wilmington, DE 19880-0711, December 1989.(12) Alentiev, A. Yu.; Yampolskii, Yu P.; Shantarovich, V. P.; Nemser, S. M.;
Plate, N. A. J. Membr. Sci. 1997, 126, 123.(13) Pinnau, I.; Toy, L. G. J. Membr. Sci. 1996, 109, 125-133.(14) http://www.polymicro.com/tsu.htm. Information on series TSU fluorocarbon-
coated capillaries, Polymicro Technologies, Phoenix, AZ.(15) Waterbury, R. D.; Yao, W.; Byrne, R. H. Anal. Chim. Acta 1998, 357, 99.(16) Nath, G. U.S. Patent 5,165,773, November 24, 1992.(17) Gilby, A. C.; Carson, W. W. U.S. Patent 5,184,192, February 2, 1993.(18) Nath, G. U.S. Patent 5,412,750, May 2, 1995.(19) Liu, S.-Y. U.S. Patent 5,416,879, May 16, 1995.(20) Liu, S.-Y. U.S. Patent 5,444,807, August 22, 1995.(21) Liu, S.-Y. U.S. Patent 5,570,447, October 29, 1996(22) Munk, M. N. U.S. Patent 5,608,517, March 4, 1997.
(23) Dasgupta, P. K.; McDowell W. L.; Rhee, J.-S. Analyst 1986, 111, 87.(24) Van Hoeven, W. D. DuPont Fluoroproducts, Wilmington, DE, personal
communication, 1997.
4662 Analytical Chemistry, Vol. 70, No. 22, November 15, 1998
diameter is inserted into it and is sealed in the exit arm of the teeby another PVC tubing spacer. One optical fiber leads to aphotodiode and the second is cemented to an LED. A secondphotodiode cemented to the bottom of the LED acts as thereference detector. The two photodiode outputs are fed into alog-ratio amplifier (type 757N, Analog Devices, Norwood, MA),which thus constitutes a referenced absorbance detector.25
(b) Devices Made from in Situ Fabricated Tubes. Two1/16-in. barbed nylon tees (Ark-Plas, Flippin, AR) are inserted atthe ends of a 20-cm × 3-mm-o.d. glass tube, and a 24-cm-long,360-µm-o.d., 100-µm-i.d., 15-µm Teflon AF-coated silica capillaryis inserted through both the tees. The tube is radially andlongitudinally centered in the glass tube and affixed in place byapplying epoxy adhesives at both ends. The epoxy covers theends of the glass tube and the tees. A small area (∼0.1 mm ×0.05-0.1 mm) of Teflon AF coating is removed from both endsof the capillary, at a distance of ∼1 mm from the ends, by scrapingwith a scalpel blade under a stereomicroscope. Larger diameterPVC tubes are connected at both ends to fit snug on the epoxywithout touching the ends of the capillary. One of the PVC tubesis connected to waste while the other one is connected to a plasticdisposable syringe installed in a syringe pump or any alternativearrangement (syringe affixed to a support and a weight put onthe plunger) capable of pumping at a slow flow rate (∼1 mL/h).An aqueous solution of 20% HF is pumped through the silicacapillary until all the silica is etched out. (Caution: Handle HFwith sufficient protection. HF is very corrosive and can easilydiffuse through the skin. Work in a fume hood!) HF is thenremoved from the system by thoroughly flushing with deionizedwater.
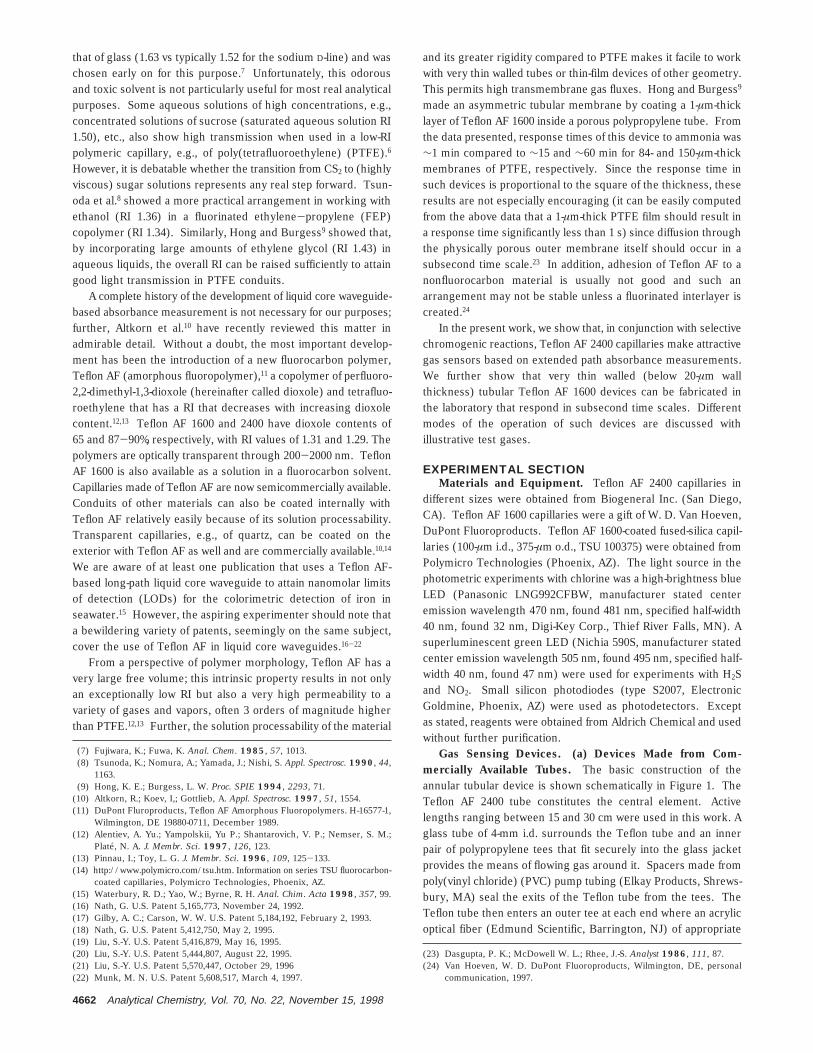
From one end, the PVC tube is removed to expose the TeflonAF tubing and an acrylic optical fiber is axially inserted throughthe Teflon AF tube. A larger diameter fiber is preferred for greaterlight throughput. To achieve this, the end of a 0.5-mm-diameteracrylic optical fiber (E2542, Edmund Scientific) is tapered at oneend by applying a longitudinal tension to the fiber while heatingit with a hair dryer. The diameter of the tapered terminus is madesuch that it is slightly less than the inner diameter of the TeflonAF tube. Next, the tapered fiber is inserted into the Teflon AFtube until there is a snug fit (the length of the fiber should betrimmed such that the fiber terminates within a short length (∼1mm) after the lateral aperture that was made by scraping with ascalpel). An outer tee is inserted over the joint and connected asdescribed above. In this case, the optical fiber is already alignedin the tube and therefore no additional care is needed while theepoxy is applied. Since the fiber end is of conical shape, there
will be sufficient gap between the fiber and the tube walls for liquidflow. Refer to Figure 2a for a detailed view of the terminus. Theother end is prepared in the same fashion.
In another device of this type, the silica was etched out bypumping the solutions through apertures on the Teflon claddingmade on the Teflon-coated capillary. This left a portion of thesilica tube at each terminus. These were filled with high-RI, UV-cure optical adhesive by capillary action and then cured photo-chemically. These ends then themselves serve as the opticalfibers (Figure 2b).
For the highest reproducibility and sensitivity, the sensordevices and connecting optical fibers (if not already jacketed) wereprotected from ambient light by wrapping with Al foil or electricaltape. However, the devices already have reasonable immunityto ambient light since an optical waveguide rejects transverseillumination. Many experiments were conducted without anyshielding from ambient light because illumination in the laboratoryis more or less constant.
Sensors for CO2 and Dissolved Organics in Water. A longTeflon AF 2400 tube (1.1-m × 450-µm i.d., 638-µm o.d., internalvolume 175 µL) was provided with tee connections for liquid inlet/outlet and silica optical fibers at each end, coiled into a 50-mm-diameter coil and put inside a wide-mouth polypropylene bottleequipped with a gas inlet/outlet. The fiber optic ends wereconnected to a CCD-based spectrometer (Spectromate, WorldPrecision Instruments, Sarasota, FL) equipped with its own UV/visible light source. The same basic tube and end connectionswere used for the measurement of dissolved organics, except thetotal length of 30 cm was used of which a ∼10 cm length wascoiled and immersed into a 100-mL beaker containing the testanalyte.
Test Arrangements. Compressed house air is fed through apressure regulator and purified by a column containing, insequence, silica gel, activated carbon, and soda lime. All air andgas flow rates were metered by mass flow controllers (model FC-280, Tylan General, Torrance, CA). The test gas was generatedfrom permeation devices (VICI Metronics, Santa Clara, CA;gravimetrically calibrated respectively to be emitting 610 ng ofCl2/min, 47 ng of NO2/min, and 950 ng of H2S/min). Thepermeation chamber was continuously flushed with dry air. Thechamber and the thermal preequilibration coil for the flush flowwere housed in a thermostated enclosure maintained at 30 °C.
(25) Dasgupta, P. K.; Bellamy, H. S.; Liu, H.; Lopez, J. L.; Loree, E. L.; Morris,K.; Petersen, K.; Mir, K. A. Talanta 1993, 40, 53.
Figure 1. Basic construction of an absorptiometric liquid corewaveguide-based gas sensor.
Figure 2. Terminal arrangements for thin tubular film-based gassensors: (a) based on a tapered optical fiber; (b) based on the originalsilica tube termini functioning as the optical fibers.
Analytical Chemistry, Vol. 70, No. 22, November 15, 1998 4663
An aspiration pump sampled the test gas or clean air through thejacket of the sensing device at the desired flow rate (100 standardcubic centimeters per minute, sccm, unless otherwise stated). Athree-way PTFE solenoid valve (Biochem Valve Corp., Hanover,NJ) was used at the inlet of the gas-sensing device to rapidlyswitch between zero air and the test gas. Except as stated,chlorine exposures were conducted at a concentration of 1.4 ppm.
For response time testing, chlorine gas was generated in astoppered 100-mL Erlenmeyer flask by mixing 5 drops of ∼1%NaOCl with 5 drops of concentrated HCl. One milliliter or lessof the headspace vapor in the flask was injected using a syringeinto the outer jacket of the sensor as rapidly as manually possible.For very short response times, such as with the very thin walleddevice, the flow through the jacket was increased to 2000 sccm.
When a constant liquid flow rate was desired, a Minipuls 2peristaltic pump (Gilson Medical Electronics) was used to effectliquid flow through the device. Otherwise, the reagent wascontained in a bottle, mildly pneumatically pressurized (∼5 psi)and connected to the device. On the liquid exit side an on/offsolenoid valve (Biochem Valve Corp.) was used to turn the flowon and off. A small length of a restriction tube was added to thevalve exit to control the flow when the valve was on.
Reagents and Analytical Methods. Chlorine was measuredby the reaction of the gas with acidic tetramethylbenzidine solution(TMB; this is a noncarcinogenic reagent for chlorine that resultsin an intensely yellow product via a very rapid reaction),26 NO2
was measured by the relatively slow but sensitive Griess-Saltzman reaction;27 the preparation and the composition of thereagents were carried out as described in the literature respec-tively cited above. Hydrogen sulfide was measured by theformation of lead sulfide using a solution containing 1% lead acetateand 1% acetic acid.
The carbon dioxide-sensing arrangement was tested both withand without liquid flow. Phenol red (pKa 7.8) was used as theindicator; the stationary liquid arrangement used ∼0.16 µM Phenolred (absorbance 0.9 at 556 nm for the 1.1-m cell) in a matrix of10 mM NaHCO3. The flowing liquid system used a ∼0.26 µMsolution of the dye adjusted to a pH of ∼8.5 (absorbance of ∼1.45at 556 nm) without any buffering agent. The dissolved organic-sensing arrangement contained HPLC-grade water as the internalfilling solution.
PRINCIPLESConsider a liquid core waveguide with gas-permeable walls
with an active length of L cm (for both optical and analyte transportpurposes) and inner and outer radii of ri and ro cm, respectively.If the device is exposed on its exterior with an analyte gasconcentration of Cg µg/m3 and the dimensionless partitionconstant for the gas-phase f polymer-phase distribution of theanalyte (solubility) is S, the concentration in the polymer phasein the outer wall, C0 is given (in units of mol/cm3) by
where MW is the molecular weight of the gas. We further assume
that the liquid contained within the tube rapidly and efficientlyabsorbs the gas such that the concentration of the analyte at theinner wall is zero. We assume a thin-walled tube of inner radiusri cm and outer radius ro cm and active length l cm and thus makethe approximation that permeation takes place through a thinplanar sheet of equivalent area 2πrl where r is the geometric meanradius (riro)0.5. If the diffusion coefficient of the analyte in thepolymer phase is D cm2/s, the rate of mass transfer (dm/dt) (inmol/s) will be given by
and ∆r is the diffusion distance ro - ri, the wall thickness of thetube. If the liquid flow rate through the device is V cm3/s andthe chromogenic product is formed rapidly and on a 1:1 molarbasis from the analyte, at steady state, the chromogen concentra-tion Cc (in mol/cm3) will be given by
For a molar absorptivity of ε L/mol‚cm and an optical path lengthof l cm, the resulting absorbance A will be
In the important situation (vide infra) when there is no flowthrough the device but the liquid is held stationary, holdup volumeis πri
2l and hence the temporal rate of increase of absorbancewithin the linear domain of an A vs Cc relationship as a result ofcontinuous exposure to an analyte gas concentration of Cg µg/m3 will be given by
Making the reasonable approximation that ri ) r for a thin-walledtube and putting in eq 1, we have
Equation 6 indicates that the rate of absorbance increase willlinearly increase with Cg, while the sensitivity of the techniquewill increase with increasing DS (sometimes called the perme-ability constant, it is the hallmark of Teflon AF that it exhibits ahigh DS for a number of gases12,13), increasing device length, anddecreasing wall thickness and radius of the tube. Practicalconsiderations on actually attainable limits of detection obviouslyalso depend on total light throughput, and an increase in l or adecrease in r will obviously have practical limits depending onthe nature and the brightness of the source light.
RESULTS AND DISCUSSIONIrreversible Reactions. Most chromogenic reactions that are
discussed in the following are irreversible; the chromogenicproduct once formed is stable irrespective of the analyte gasconcentration. In a second type of system, the optical status ofthe sensor changes with the status of the analyte gas, for example,when the sensor contains a lightly buffered solution of a pH
(26) Liu, H.; Dasgupta, P. K. Anal. Chem. 1995, 67, 4221.(27) Determination of Nitrogen Dioxide Content of the Atmosphere (Griess-
Saltzman reaction). Method 406. Methods for Air Sampling and Analysis,3rd ed.; Lodge, J. P., Jr., Ed.; Lewis: Ann Arbor, MI, 1989; p 389.
C0 ) 10-12 SCg/MW (1)
dm/dt ) 2πrlDCo/∆r (2)
Cc ) 2πrlDCo/(V∆r) (3)
A ) 2000πrl2εDCo/(V∆r) (4)
dA/dt ) 2000rlεDCo/(ri2∆r) (5)
dA/dt ) 2 × 10⁻⁹ lεDSCg/(MWr∆r) (6)
4664 Analytical Chemistry, Vol. 70, No. 22, November 15, 1998
indicator and is exposed to a protolyzable gas that is reversiblyabsorbed by the sensor solution. The irreversible reactionsystems are more general, involve specific and selective reactions,and are discussed first.
Why No Reagent Flow Is Best. The reaction of chlorine withTMB to form a yellow product constitutes a fast irreversiblereaction. Initial experiments with exposure to a constant con-centration of chlorine readily showed that the steady-state absor-bance is strictly linearly related to the reciprocal of the reagentflow rate, in accordance with eq 4. It thus became apparent that,relative to the continuous reagent flow mode, intermittent flow ofthe reagent, with all measurements taking place when the reagentis stationary in the device, is more attractive to design a sensitivesensor. Under these conditions, the time vs absorbance dataprovide all the information of intereststhe slope at any point givesthe instantaneous concentration and the final absorbance valuegives the cumulative exposure.
Note that the stationary reagent implementation obviates anypumping noise by eliminating the pump. Further, it makes for asimpler and less expensive arrangement. While the stationaryreagent/intermittent replacement arrangement can be attained inmany different ways, our experience shows that keeping thestationary reagent in the device under pressure as described inthe Experimental Section has the important merit that anyevaporative loss of liquid does not lead to bubbles in the opticalpath. Else, bubbles cause persistent and serious problems. Ifthe reagent blank is significant, there will be some increase inabsorbance over time even in the absence of any analyte becauseof the increasing concentration of the reagent components in thedevice due to evaporation. This is usually not a large effect andcan be compensated for (vide infra).
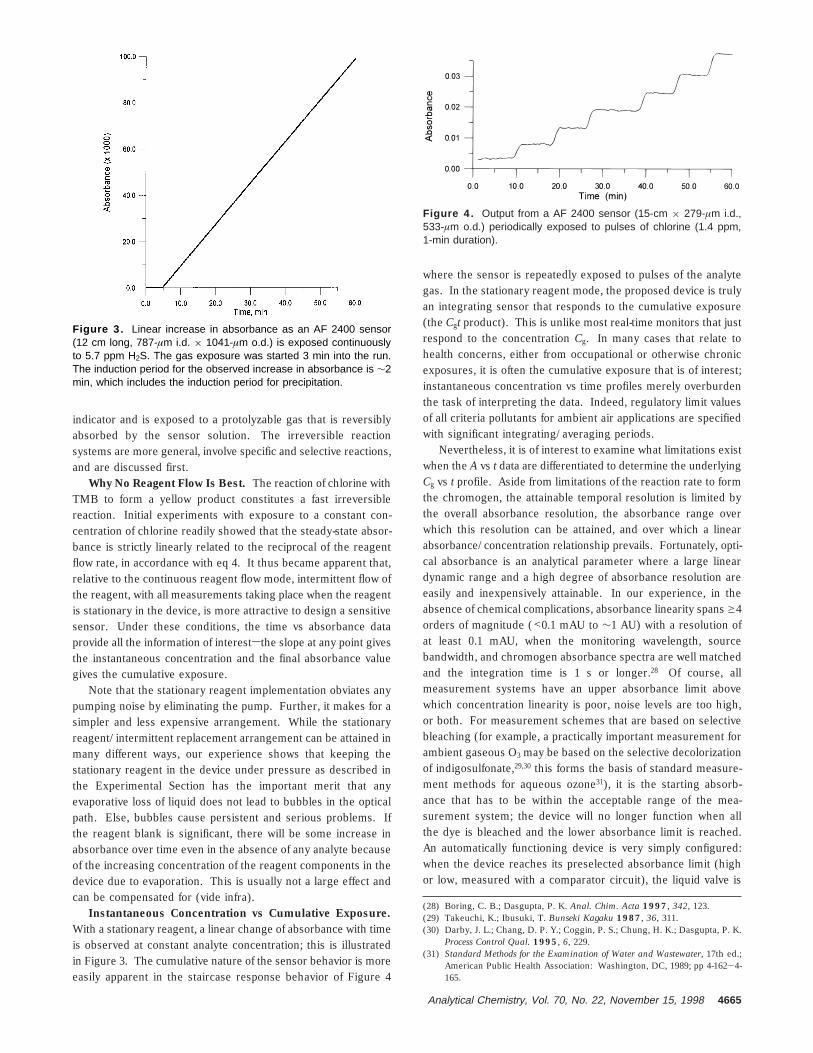
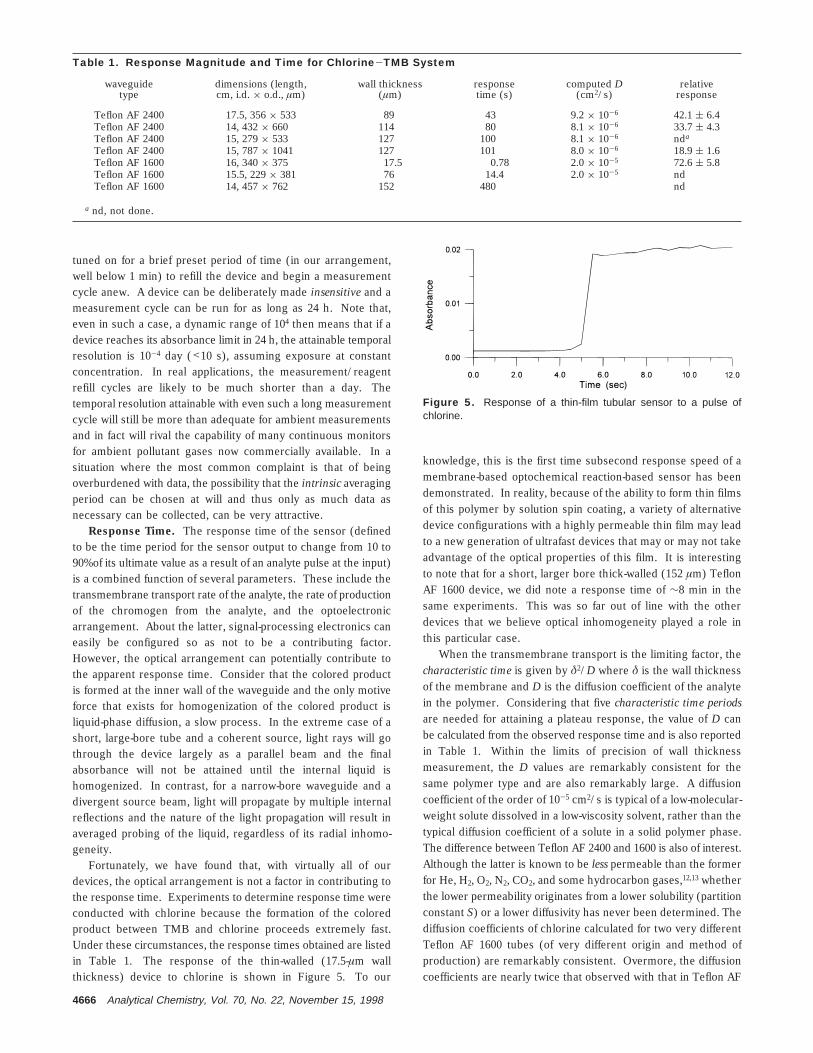
Instantaneous Concentration vs Cumulative Exposure.With a stationary reagent, a linear change of absorbance with timeis observed at constant analyte concentration; this is illustratedin Figure 3. The cumulative nature of the sensor behavior is moreeasily apparent in the staircase response behavior of Figure 4
where the sensor is repeatedly exposed to pulses of the analytegas. In the stationary reagent mode, the proposed device is trulyan integrating sensor that responds to the cumulative exposure(the Cgt product). This is unlike most real-time monitors that justrespond to the concentration Cg. In many cases that relate tohealth concerns, either from occupational or otherwise chronicexposures, it is often the cumulative exposure that is of interest;instantaneous concentration vs time profiles merely overburdenthe task of interpreting the data. Indeed, regulatory limit valuesof all criteria pollutants for ambient air applications are specifiedwith significant integrating/averaging periods.
Nevertheless, it is of interest to examine what limitations existwhen the A vs t data are differentiated to determine the underlyingCg vs t profile. Aside from limitations of the reaction rate to formthe chromogen, the attainable temporal resolution is limited bythe overall absorbance resolution, the absorbance range overwhich this resolution can be attained, and over which a linearabsorbance/concentration relationship prevails. Fortunately, opti-cal absorbance is an analytical parameter where a large lineardynamic range and a high degree of absorbance resolution areeasily and inexpensively attainable. In our experience, in theabsence of chemical complications, absorbance linearity spans g4orders of magnitude (<0.1 mAU to ∼1 AU) with a resolution ofat least 0.1 mAU, when the monitoring wavelength, sourcebandwidth, and chromogen absorbance spectra are well matchedand the integration time is 1 s or longer.28 Of course, allmeasurement systems have an upper absorbance limit abovewhich concentration linearity is poor, noise levels are too high,or both. For measurement schemes that are based on selectivebleaching (for example, a practically important measurement forambient gaseous O3 may be based on the selective decolorizationof indigosulfonate,29,30 this forms the basis of standard measure-ment methods for aqueous ozone31), it is the starting absorb-ance that has to be within the acceptable range of the mea-surement system; the device will no longer function when allthe dye is bleached and the lower absorbance limit is reached.An automatically functioning device is very simply configured:when the device reaches its preselected absorbance limit (highor low, measured with a comparator circuit), the liquid valve is
(28) Boring, C. B.; Dasgupta, P. K. Anal. Chim. Acta 1997, 342, 123.(29) Takeuchi, K.; Ibusuki, T. Bunseki Kagaku 1987, 36, 311.(30) Darby, J. L.; Chang, D. P. Y.; Coggin, P. S.; Chung, H. K.; Dasgupta, P. K.
Process Control Qual. 1995, 6, 229.(31) Standard Methods for the Examination of Water and Wastewater, 17th ed.;
American Public Health Association: Washington, DC, 1989; pp 4-162-4-165.
Figure 3. Linear increase in absorbance as an AF 2400 sensor(12 cm long, 787-µm i.d. × 1041-µm o.d.) is exposed continuouslyto 5.7 ppm H2S. The gas exposure was started 3 min into the run.The induction period for the observed increase in absorbance is ∼2min, which includes the induction period for precipitation.
Figure 4. Output from a AF 2400 sensor (15-cm × 279-µm i.d.,533-µm o.d.) periodically exposed to pulses of chlorine (1.4 ppm,1-min duration).
Analytical Chemistry, Vol. 70, No. 22, November 15, 1998 4665
tuned on for a brief preset period of time (in our arrangement,well below 1 min) to refill the device and begin a measurementcycle anew. A device can be deliberately made insensitive and ameasurement cycle can be run for as long as 24 h. Note that,even in such a case, a dynamic range of 104 then means that if adevice reaches its absorbance limit in 24 h, the attainable temporalresolution is 10-4 day (<10 s), assuming exposure at constantconcentration. In real applications, the measurement/reagentrefill cycles are likely to be much shorter than a day. Thetemporal resolution attainable with even such a long measurementcycle will still be more than adequate for ambient measurementsand in fact will rival the capability of many continuous monitorsfor ambient pollutant gases now commercially available. In asituation where the most common complaint is that of beingoverburdened with data, the possibility that the intrinsic averagingperiod can be chosen at will and thus only as much data asnecessary can be collected, can be very attractive.
Response Time. The response time of the sensor (definedto be the time period for the sensor output to change from 10 to90% of its ultimate value as a result of an analyte pulse at the input)is a combined function of several parameters. These include thetransmembrane transport rate of the analyte, the rate of productionof the chromogen from the analyte, and the optoelectronicarrangement. About the latter, signal-processing electronics caneasily be configured so as not to be a contributing factor.However, the optical arrangement can potentially contribute tothe apparent response time. Consider that the colored productis formed at the inner wall of the waveguide and the only motiveforce that exists for homogenization of the colored product isliquid-phase diffusion, a slow process. In the extreme case of ashort, large-bore tube and a coherent source, light rays will gothrough the device largely as a parallel beam and the finalabsorbance will not be attained until the internal liquid ishomogenized. In contrast, for a narrow-bore waveguide and adivergent source beam, light will propagate by multiple internalreflections and the nature of the light propagation will result inaveraged probing of the liquid, regardless of its radial inhomo-geneity.
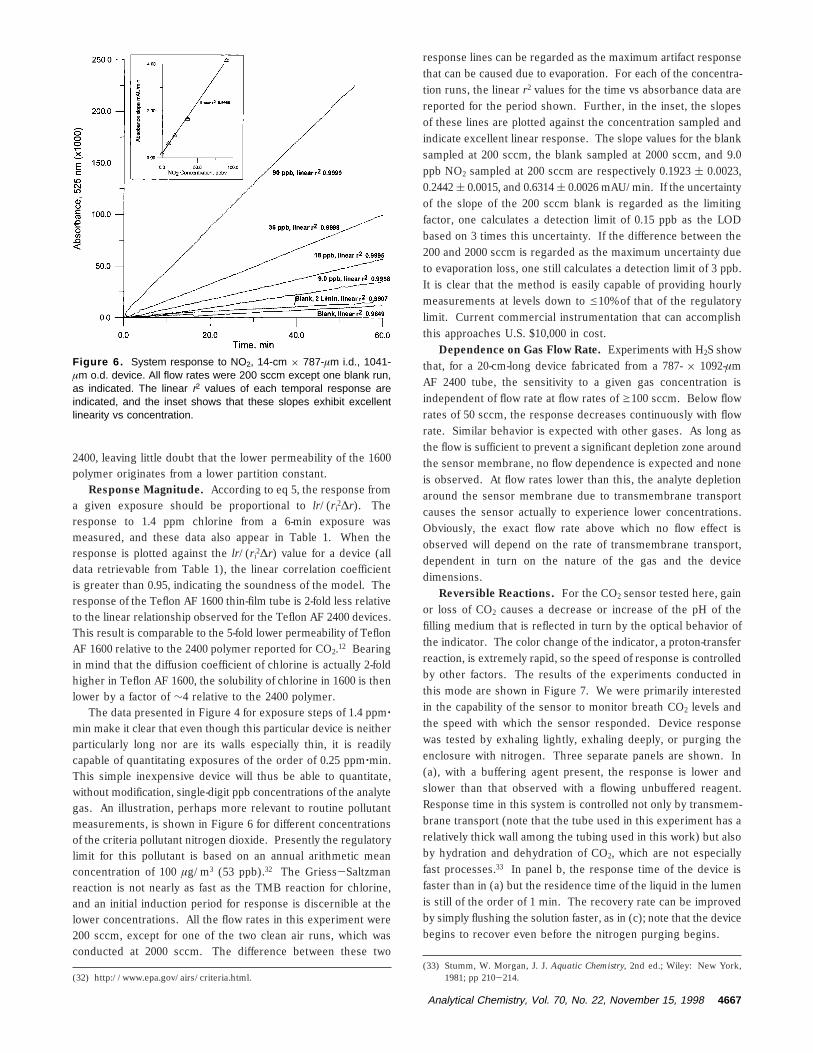
Fortunately, we have found that, with virtually all of ourdevices, the optical arrangement is not a factor in contributing tothe response time. Experiments to determine response time wereconducted with chlorine because the formation of the coloredproduct between TMB and chlorine proceeds extremely fast.Under these circumstances, the response times obtained are listedin Table 1. The response of the thin-walled (17.5-µm wallthickness) device to chlorine is shown in Figure 5. To our
knowledge, this is the first time subsecond response speed of amembrane-based optochemical reaction-based sensor has beendemonstrated. In reality, because of the ability to form thin filmsof this polymer by solution spin coating, a variety of alternativedevice configurations with a highly permeable thin film may leadto a new generation of ultrafast devices that may or may not takeadvantage of the optical properties of this film. It is interestingto note that for a short, larger bore thick-walled (152 µm) TeflonAF 1600 device, we did note a response time of ∼8 min in thesame experiments. This was so far out of line with the otherdevices that we believe optical inhomogeneity played a role inthis particular case.
When the transmembrane transport is the limiting factor, thecharacteristic time is given by δ2/D where δ is the wall thicknessof the membrane and D is the diffusion coefficient of the analytein the polymer. Considering that five characteristic time periodsare needed for attaining a plateau response, the value of D canbe calculated from the observed response time and is also reportedin Table 1. Within the limits of precision of wall thicknessmeasurement, the D values are remarkably consistent for thesame polymer type and are also remarkably large. A diffusioncoefficient of the order of 10-5 cm2/s is typical of a low-molecular-weight solute dissolved in a low-viscosity solvent, rather than thetypical diffusion coefficient of a solute in a solid polymer phase.The difference between Teflon AF 2400 and 1600 is also of interest.Although the latter is known to be less permeable than the formerfor He, H2, O2, N2, CO2, and some hydrocarbon gases,12,13 whetherthe lower permeability originates from a lower solubility (partitionconstant S) or a lower diffusivity has never been determined. Thediffusion coefficients of chlorine calculated for two very differentTeflon AF 1600 tubes (of very different origin and method ofproduction) are remarkably consistent. Overmore, the diffusioncoefficients are nearly twice that observed with that in Teflon AF
Table 1. Response Magnitude and Time for Chlorine-TMB System
waveguidetype
dimensions (length,cm, i.d. × o.d., µm)
wall thickness(µm)
responsetime (s)
computed D(cm2/s)
relativeresponse
Teflon AF 2400 17.5, 356 × 533 89 43 9.2 × 10⁻⁶ 42.1 ( 6.4Teflon AF 2400 14, 432 × 660 114 80 8.1 × 10⁻⁶ 33.7 ( 4.3Teflon AF 2400 15, 279 × 533 127 100 8.1 × 10⁻⁶ nda
Teflon AF 2400 15, 787 × 1041 127 101 8.0 × 10⁻⁶ 18.9 ( 1.6Teflon AF 1600 16, 340 × 375 17.5 0.78 2.0 × 10⁻⁵ 72.6 ( 5.8Teflon AF 1600 15.5, 229 × 381 76 14.4 2.0 × 10⁻⁵ ndTeflon AF 1600 14, 457 × 762 152 480 nd
a nd, not done.
Figure 5. Response of a thin-film tubular sensor to a pulse ofchlorine.
4666 Analytical Chemistry, Vol. 70, No. 22, November 15, 1998
2400, leaving little doubt that the lower permeability of the 1600polymer originates from a lower partition constant.
Response Magnitude. According to eq 5, the response froma given exposure should be proportional to lr/(ri
2∆r). Theresponse to 1.4 ppm chlorine from a 6-min exposure wasmeasured, and these data also appear in Table 1. When theresponse is plotted against the lr/(ri
2∆r) value for a device (alldata retrievable from Table 1), the linear correlation coefficientis greater than 0.95, indicating the soundness of the model. Theresponse of the Teflon AF 1600 thin-film tube is 2-fold less relativeto the linear relationship observed for the Teflon AF 2400 devices.This result is comparable to the 5-fold lower permeability of TeflonAF 1600 relative to the 2400 polymer reported for CO2.12 Bearingin mind that the diffusion coefficient of chlorine is actually 2-foldhigher in Teflon AF 1600, the solubility of chlorine in 1600 is thenlower by a factor of ∼4 relative to the 2400 polymer.
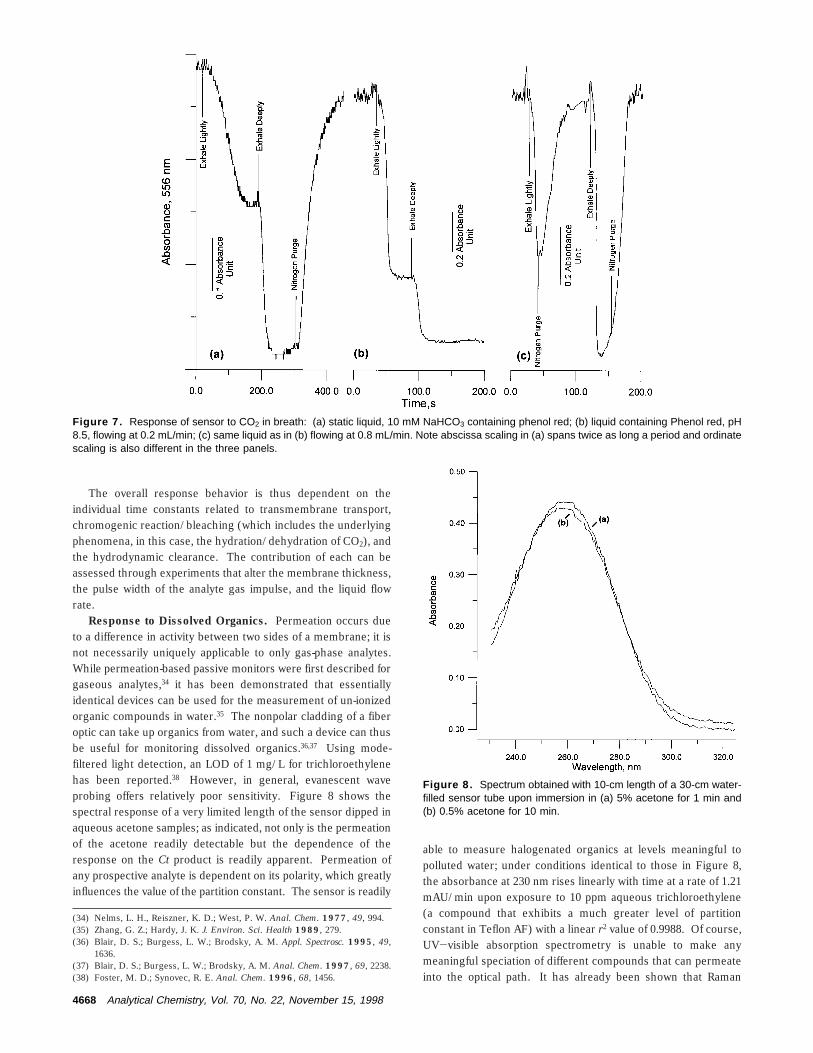
The data presented in Figure 4 for exposure steps of 1.4 ppm‚min make it clear that even though this particular device is neitherparticularly long nor are its walls especially thin, it is readilycapable of quantitating exposures of the order of 0.25 ppm‚min.This simple inexpensive device will thus be able to quantitate,without modification, single-digit ppb concentrations of the analytegas. An illustration, perhaps more relevant to routine pollutantmeasurements, is shown in Figure 6 for different concentrationsof the criteria pollutant nitrogen dioxide. Presently the regulatorylimit for this pollutant is based on an annual arithmetic meanconcentration of 100 µg/m3 (53 ppb).32 The Griess-Saltzmanreaction is not nearly as fast as the TMB reaction for chlorine,and an initial induction period for response is discernible at thelower concentrations. All the flow rates in this experiment were200 sccm, except for one of the two clean air runs, which wasconducted at 2000 sccm. The difference between these two
response lines can be regarded as the maximum artifact responsethat can be caused due to evaporation. For each of the concentra-tion runs, the linear r2 values for the time vs absorbance data arereported for the period shown. Further, in the inset, the slopesof these lines are plotted against the concentration sampled andindicate excellent linear response. The slope values for the blanksampled at 200 sccm, the blank sampled at 2000 sccm, and 9.0ppb NO2 sampled at 200 sccm are respectively 0.1923 ( 0.0023,0.2442 ( 0.0015, and 0.6314 ( 0.0026 mAU/min. If the uncertaintyof the slope of the 200 sccm blank is regarded as the limitingfactor, one calculates a detection limit of 0.15 ppb as the LODbased on 3 times this uncertainty. If the difference between the200 and 2000 sccm is regarded as the maximum uncertainty dueto evaporation loss, one still calculates a detection limit of 3 ppb.It is clear that the method is easily capable of providing hourlymeasurements at levels down to e10% of that of the regulatorylimit. Current commercial instrumentation that can accomplishthis approaches U.S. $10,000 in cost.
Dependence on Gas Flow Rate. Experiments with H2S showthat, for a 20-cm-long device fabricated from a 787- × 1092-µmAF 2400 tube, the sensitivity to a given gas concentration isindependent of flow rate at flow rates of g100 sccm. Below flowrates of 50 sccm, the response decreases continuously with flowrate. Similar behavior is expected with other gases. As long asthe flow is sufficient to prevent a significant depletion zone aroundthe sensor membrane, no flow dependence is expected and noneis observed. At flow rates lower than this, the analyte depletionaround the sensor membrane due to transmembrane transportcauses the sensor actually to experience lower concentrations.Obviously, the exact flow rate above which no flow effect isobserved will depend on the rate of transmembrane transport,dependent in turn on the nature of the gas and the devicedimensions.
Reversible Reactions. For the CO2 sensor tested here, gainor loss of CO2 causes a decrease or increase of the pH of thefilling medium that is reflected in turn by the optical behavior ofthe indicator. The color change of the indicator, a proton-transferreaction, is extremely rapid, so the speed of response is controlledby other factors. The results of the experiments conducted inthis mode are shown in Figure 7. We were primarily interestedin the capability of the sensor to monitor breath CO2 levels andthe speed with which the sensor responded. Device responsewas tested by exhaling lightly, exhaling deeply, or purging theenclosure with nitrogen. Three separate panels are shown. In(a), with a buffering agent present, the response is lower andslower than that observed with a flowing unbuffered reagent.Response time in this system is controlled not only by transmem-brane transport (note that the tube used in this experiment has arelatively thick wall among the tubing used in this work) but alsoby hydration and dehydration of CO2, which are not especiallyfast processes.33 In panel b, the response time of the device isfaster than in (a) but the residence time of the liquid in the lumenis still of the order of 1 min. The recovery rate can be improvedby simply flushing the solution faster, as in (c); note that the devicebegins to recover even before the nitrogen purging begins.
(32) http://www.epa.gov/airs/criteria.html.(33) Stumm, W. Morgan, J. J. Aquatic Chemistry, 2nd ed.; Wiley: New York,
1981; pp 210-214.
Figure 6. System response to NO2, 14-cm × 787-µm i.d., 1041-µm o.d. device. All flow rates were 200 sccm except one blank run,as indicated. The linear r2 values of each temporal response areindicated, and the inset shows that these slopes exhibit excellentlinearity vs concentration.
Analytical Chemistry, Vol. 70, No. 22, November 15, 1998 4667
The overall response behavior is thus dependent on theindividual time constants related to transmembrane transport,chromogenic reaction/bleaching (which includes the underlyingphenomena, in this case, the hydration/dehydration of CO2), andthe hydrodynamic clearance. The contribution of each can beassessed through experiments that alter the membrane thickness,the pulse width of the analyte gas impulse, and the liquid flowrate.
Response to Dissolved Organics. Permeation occurs dueto a difference in activity between two sides of a membrane; it isnot necessarily uniquely applicable to only gas-phase analytes.While permeation-based passive monitors were first described forgaseous analytes,34 it has been demonstrated that essentiallyidentical devices can be used for the measurement of un-ionizedorganic compounds in water.35 The nonpolar cladding of a fiberoptic can take up organics from water, and such a device can thusbe useful for monitoring dissolved organics.36,37 Using mode-filtered light detection, an LOD of 1 mg/L for trichloroethylenehas been reported.38 However, in general, evanescent waveprobing offers relatively poor sensitivity. Figure 8 shows thespectral response of a very limited length of the sensor dipped inaqueous acetone samples; as indicated, not only is the permeationof the acetone readily detectable but the dependence of theresponse on the Ct product is readily apparent. Permeation ofany prospective analyte is dependent on its polarity, which greatlyinfluences the value of the partition constant. The sensor is readily
able to measure halogenated organics at levels meaningful topolluted water; under conditions identical to those in Figure 8,the absorbance at 230 nm rises linearly with time at a rate of 1.21mAU/min upon exposure to 10 ppm aqueous trichloroethylene(a compound that exhibits a much greater level of partitionconstant in Teflon AF) with a linear r2 value of 0.9988. Of course,UV-visible absorption spectrometry is unable to make anymeaningful speciation of different compounds that can permeateinto the optical path. It has already been shown that Raman
(34) Nelms, L. H., Reiszner, K. D.; West, P. W. Anal. Chem. 1977, 49, 994.(35) Zhang, G. Z.; Hardy, J. K. J. Environ. Sci. Health 1989, 279.(36) Blair, D. S.; Burgess, L. W.; Brodsky, A. M. Appl. Spectrosc. 1995, 49,
1636.(37) Blair, D. S.; Burgess, L. W.; Brodsky, A. M. Anal. Chem. 1997, 69, 2238.(38) Foster, M. D.; Synovec, R. E. Anal. Chem. 1996, 68, 1456.
Figure 7. Response of sensor to CO2 in breath: (a) static liquid, 10 mM NaHCO3 containing phenol red; (b) liquid containing Phenol red, pH8.5, flowing at 0.2 mL/min; (c) same liquid as in (b) flowing at 0.8 mL/min. Note abscissa scaling in (a) spans twice as long a period and ordinatescaling is also different in the three panels.
Figure 8. Spectrum obtained with 10-cm length of a 30-cm water-filled sensor tube upon immersion in (a) 5% acetone for 1 min and(b) 0.5% acetone for 10 min.
4668 Analytical Chemistry, Vol. 70, No. 22, November 15, 1998
spectroscopy can be carried out with much greater sensitivity inliquid core waveguides and is applicable to aqueous solutions.39,40
In other cases, selective reactions such as the Fujiwara reactionfor halogenated organics may be directly applicable.41
Implications to Passive Monitoring. In passive dosimetry,used for both area and personnel monitoring, the analyte iscollected on a sorbent by exposing it to the analyte through sometransport/diffusion barrier, e.g., a membrane or an orifice.42 Thetransport barrier limits mass transport and makes the devicereasonably independent of the face velocity of the air sample towhich it is exposed. It is obvious that much like the sensor dippedin water to sense organic compounds, an unjacketed reagent-filledtube, with integral optical fibers, possibly mildly pressurizedthrough a miniature elastomeric reservoir at one end, can be easilydeployed as a passive monitor, either for area monitoring or forpersonnel monitoring applications. Such devices can be inter-rogated at desired intervals by a light source/detector that doesnot need to be integral to the collector. After reading, the reagentcan be refilled from the integral reservoir (depending on reagentlife and the capacity of the reservoir). Similar devices can bedeployed in water for monitoring organic compounds. To providea suitable sink for organic compounds of interest as well as tohave minimum permeation loss to the outside, a low-vapor-
pressure optically transparent filling fluid such as a glycol or apolyol can be used as the internal liquid.
In summary, a new class of inexpensive and versatile sensorsare described that can potentially be used for continuous areamonitoring and cumulative exposure monitoring for either work-place or ambient air use. In the active gas sampling mode, strictflow control is not necessary as long the flow rate is kept abovesome minimum value. Selective chromogenic reactions areavailable for a large number of analyte gases of interest, includingNO2, SO2, CO, and O3, criteria pollutant gases so designated bythe EPA. The same device can be readily reconfigured to measuredifferent gases by changing the reagent and the light source.Fluorometric measurements are also possible because the liquidcore waveguides also make possible uniquely simple fluorometry;this will be discussed in a separate article. An active participationin environmental monitoring is a key to ensure proper stewardshipof this planet; the affordability of the present concept can extendsuch efforts routinely to high school levels and thus attract ourfuture citizens to this effort.
ACKNOWLEDGMENTThis research was supported in part by the U.S. Environmental
Protection Agency through STAR Grant R82-5344-01-0. Themanuscript has not, however, been reviewed by the agency andno endorsements should be inferred.
Received for review July 21, 1998. Accepted September11, 1998.
AC980803T
(39) Altkorn, R.; Koev, I.; Van Duyne, R. P.; Litorja, M. Appl. Opt. 1997, 36,8992.
(40) Song, L.; Liu, S.-Y.; Zhelyaskov, V.; El-Sayed, M. A. Appl. Spectrosc., in press.(41) Smilde, A. K.; Tauler, R.; Henshaw, J. M.; Burgess, L. W.; Kowalski, B. R.
Anal. Chem. 1994, 66, 3345.(42) Schaaf, S. W. Occup. Health Saf. 1989, 58, 491.
Analytical Chemistry, Vol. 70, No. 22, November 15, 1998 4669