Embed Size (px)
Citation preview

High School Science and Mathematics
Course Enrollment and Performance of Students who
Attended the International Baccalaureate
Middle Years Programme
February 2013
Julie H. Wade and Natalie L. Wolanin


i MYP Follow-Up in Science and Mathematics
Table of Contents
Executive Summary ....................................................................................................................... iii
Summary of Methodology ......................................................................................................... iii
Key Findings .............................................................................................................................. iii
Conclusion ................................................................................................................................. iv
Background ..................................................................................................................................... 1
Literature Review............................................................................................................................ 2
Scope of the Study .......................................................................................................................... 2
Methodology ................................................................................................................................... 3
Sample of Schools....................................................................................................................... 3
Sample of Students ..................................................................................................................... 3
Measures of Course Enrollment and Student Performance ........................................................ 3
Student Demographic Information ............................................................................................. 4
Procedures for Analysis .............................................................................................................. 4
Results ............................................................................................................................................. 5
Characteristics of the Student Sample ........................................................................................ 5
Research Question 1: Was previous enrollment in MYP related to enrollment in advanced
level (honors or AP) science or mathematics courses in Grades 9 and 10? ............................... 6
Research Question 2: Was previous enrollment in MYP related to performance in science or
mathematics courses in Grades 9 and 10? .................................................................................. 7
Research Question 3: Was previous enrollment in MYP related to performance on Biology
and Algebra 1 state-mandated exams? ........................................................................................ 8
Conclusion .................................................................................................................................... 10
Limitations .................................................................................................................................... 11
References ..................................................................................................................................... 12
Appendix A ................................................................................................................................... 14

ii MYP Follow-Up in Science and Mathematics
List of Tables
Table 1 Demographic Characteristics of 2010–2011 Grade 9 Students Who Attended 2009–
2010 Grade 8 in an MYP School or a non-MYP School .......................................................... 5
Table 2 2010–2011 and 2011–2012 Enrollment in Advanced-Level Science and
Mathematics Courses: Students from MYP Schools and non-MYP Schools.......................... 6
Table 2a Odds Ratios for Enrollment in Advanced-Level Courses in Mathematics and
Science, Effect of Grade 8 Enrollment in MYP ....................................................................... 7
Table 3 2010–2011 and 2011–2012 Percentage of Students Earning a Grade of C or Higher
in Science and Mathematics Courses: Students From MYP Schools and non-MYP
Schools ...................................................................................................................................... 7
Table 3a Odds Ratios for Earning a Course Grade of C or Higher, Effect of Previous
Enrollment in MYP ................................................................................................................... 8
Table 4 Adjusted Mean Scale Scores on Algebra 1 and Biology State Exams Through Grade
10: Students from MYP Schools and non-MYP Schools ........................................................ 9
Table 5 Percentage of Students Earning a Passing Score on Algebra 1 and Biology State
Exam Through Grade 10: Students From MYP Schools and non-MYP Schools .................... 9
Table 5a Odds Ratios for Passing Algebra and Biology State Exam, Effect of Previous
Enrollment in MYP ................................................................................................................... 9

iii MYP Follow-Up in Science and Mathematics
Executive Summary
A study of the International Baccalaureate (IB) Middle Years Programme (MYP) was conducted
in a large, socioeconomically diverse district of rural, urban, and suburban communities. The
study was requested by the school district office overseeing the program, in collaboration with
the IB. Funding for the study was provided by the IB.
The broad objective of this three-phase study is to examine the influence of MYP on later high
school performance and course enrollment, as well as to gain a more thorough understanding of
the MYP experience from both student and teacher perspectives. This report is focused on
phase 1 of the study: an analysis of the high school mathematics and science course-taking and
performance of students previously enrolled in the five district MYP middle schools and five
non-MYP middle schools.
Summary of Methodology
Grade 9 and Grade 10 science and mathematics course enrollment and performance were
examined for two groups of students: students who attended an MYP middle school in Grade 8
during the 2009–2010 school year (N = 1,317), and students who attended a demographically
similar non-MYP middle school in Grade 8 during the same school year (N = 1,266). Biology
and Algebra 1 state-mandated test scores also were examined in relation to previous MYP
enrollment. The study was conducted using two levels of control to reduce the selection bias: 1)
by design, in the selection of demographically similar comparison schools; and 2) by statistical
procedures, controlling for student background characteristics.
Key Findings
Findings for each of the research questions follow.
1. Was previous enrollment in MYP related to enrollment in advanced level (honors or
Advanced Placement [AP]) science or mathematics courses in Grades 9 and 10? In
Grade 9 and Grade 10 science and mathematics courses, students who attended an MYP
school were significantly more likely to be enrolled in an advanced-level course than
students who attended a non-MYP school. The effect was strongest for enrollment in
Grade 9 advanced-level courses. In mathematics, the effect size was small, but of
practical significance (d = .20). The effect size for Grade 9 science approached
significance (d = .19).
2. Was previous enrollment in MYP related to performance in science or mathematics
courses in Grades 9 and 10? In Grade 9 science and mathematics courses, significantly
lower percentages of students who previously attended MYP schools earned a C or
higher, compared with students who previously attended non-MYP schools. The effect
size for Grade 10 science was small but of practical significance (d = -.21) and the effect
size for Grade 9 mathematics approached significance (d = -.18). Effect sizes for Grade
9 science and Grade 10 mathematics were negligible (Grade 9 science: d = -.10; Grade 10
mathematics: d = -.06).

iv MYP Follow-Up in Science and Mathematics
3. Was previous enrollment in MYP related to performance on Biology and Algebra
state-mandated exams? Students who previously attended MYP schools were
significantly more likely to achieve a passing score on the Biology exam, but the effect
size was not large enough to be of practical educational significance (d = .16). In
addition, no statistically significant differences between MYP and non-MYP students
were found in their mean Biology or Algebra 1 scale scores.
Conclusion
This study found some evidence that students who attended an MYP school were more likely to
enroll in advanced-level science and mathematics courses in high school than their peers who
attended a non-MYP school. Enrollment in Grade 9 advanced-level science and mathematics
courses had the strongest association with previous MYP enrollment. This finding is in line with
the better performance of MYP students compared with non-MYP students on Grade 8
mathematics MSA tests (Wade, 2011). In addition, in survey responses, MYP students named
the rigor and challenge of MYP courses as one of the top three benefits of being an MYP student
(Wade & Wolanin, 2013). The findings suggest that the opportunity to tackle a high level of
academic work through the MYP has an impact on students’ course selections in high school.
There were few differences between MYP students and their non-MYP peers with respect to
course grades in science and mathematics, or performance on Biology and Algebra 1 state-
mandated tests. It is possible that these measures in the context of this follow-up study were not
sensitive enough to detect the effects of previous enrollment in MYP.

1 MYP Follow-Up in Science and Mathematics
High School Science and Mathematics Course Enrollment and
Performance of Students who Attended the
International Baccalaureate Middle Years Programme
Julie H. Wade and Natalie L. Wolanin
Background
The International Baccalaureate (IB) offers four programs of international education to over
1,080,000 students, aged 3 to 19 years, in 145 countries. The IB Primary Years Programme
(PYP), Middle Years Programme (MYP), Diploma Programme (DP), and the IB Career-related
Certificate (IBCC) offer challenging curricula with rigorous assessment; each program
encourages students to become lifelong learners and active citizens with a global perspective.
The MYP “provides a framework of academic challenge that encourages students to embrace
and understand the connections between traditional subjects and the real world, and become
critical and reflective thinkers” (http://www.ibo.org/mission/). Five middle schools in the district
have implemented MYP, and all use a whole-school model; that is, all teachers and students in
the school participate in the program.
The broad objective of this study was to examine the influence of MYP on later high school
performance and course enrollment, as well as to gain a more thorough understanding of the
MYP experience from both student and teacher perspectives. The study was conducted in three
phases: 1) an analysis of the effect of previous enrollment in MYP on high school course-taking
and performance; 2) a comparison of the perceptions of students previously enrolled in MYP
with students previously enrolled in non-MYP middle schools with regard to their middle school
experiences, their plans for IB, student service learning and volunteer experiences, and global
mindedness; and 3) an examination of the perceptions of MYP teachers about the program and
MYP professional development.
This report addresses phase 1 of the study: An analysis of the high school science and
mathematics course-taking and performance of students previously enrolled in the five district
MYP middle schools and five non-MYP middle schools. A previous study of the MYP in the
district (Wade, 2011) found small to medium effect sizes in favor of MYP in the science and
mathematics performance of MYP and non-MYP middle school students. The aim of the current
study was to extend and substantiate those findings by following the progress of these students
into high school.
The study was conducted by evaluation personnel in the district; it was requested by the district
office overseeing the program, in collaboration with the IB. Funding for the study was provided
by the IB.

2 MYP Follow-Up in Science and Mathematics
Literature Review
In an examination of the IB MYP after 30 years of operation, Bunnell (2011) noted that the MYP
has been the focus of little research, particularly when compared with the DP. A few studies
have examined the academic achievement of MYP students in comparison with non-MYP
students (Tan & Bibby, 2010, 2010; Kiplinger, 2005a, 2005b; Tan and Bibby, 2012; Wade,
2011). In general, when effects were found, they more often favored MYP, but regional
differences and issues of research design have been noted. Reimers (2004) examined the impact
of MYP on IB DP scores, with mixed results. Caffyn and Cambridge (2005), however,
published a critique questioning the design and analyses of Reimers’ study, and concluding that
the findings were not valid.
Assessing the impact of IB program participation on student achievement is often complicated
by issues of selection, since many IB students, particularly in the IB DP, are high-achieving even
before they participate in IB. This problem was highlighted by Kiplinger (2005a; 2005b) and
discussed in an IB publication (IB, 2008). Studies of effects associated with IB programs must
contend with the fact that IB students, particularly at the high school level, are often high-
performing students who have opted to take the most demanding courses. Although the
philosophy of the IB program extends beyond academics, it is difficult to measure the impact of
IB, academic or otherwise, because of self-selection in most IB programs (IB, 2008).
The whole-school model of the MYP in five district middle schools provided a study sample not
confounded by student self-selection factors. A previous study of MYP in the same district
(Wade, 2011), compared the engagement and performance of students enrolled in the five MYP
middle schools with that of students in five demographically similar middle schools without
MYP. In the district that conducted the study, MYP students attend their neighborhood public
school, where all students and teachers participate in the MYP. Thus, although at the school
level some selection factors may be at play (i.e., the schools that students attended were not
randomly assigned to MYP or non-MYP); the students within schools did not elect whether or
not to be in MYP, as has been the case in some earlier studies. The current study builds on the
earlier study and its use of the whole-school model for MYP by following the academic progress
of students who were enrolled in the two study samples—students from MYP middle schools
and students from demographically similar non-MYP comparison schools.
Scope of the Study
This study compared the Grade 9 and Grade 10 science and mathematics course enrollment and
performance of students who previously attended five MYP middle schools with that of students
who attended five demographically similar non-MYP middle schools. The questions guiding the
study included:
1. Was previous enrollment in MYP related to enrollment in advanced level (honors or AP)
science or mathematics courses in Grades 9 and 10?
2. Was previous enrollment in MYP related to performance in science or mathematics
courses in Grades 9 and 10?

3 MYP Follow-Up in Science and Mathematics
3. Was previous enrollment in MYP related to performance on Biology and Algebra state-
mandated exams?
Methodology
Course enrollment and student performance were examined for two groups of students: students
who attended an MYP middle school in Grade 8 during the 2009–2010 school year, and students
who attended a demographically similar non-MYP middle school in Grade 8 during the same
school year. The study was conducted using two levels of control to reduce the selection bias:
1) by design, in the selection of demographically similar comparison schools; and 2) by
statistical procedures, controlling for student background characteristics.
Sample of Schools
The sample of schools used in this study was the same sample used in the previous study
(Wade, 2011) which compared the performance and school engagement of students in MYP
schools with students in non-MYP schools. That is, all five MYP schools were included in the
study, and five comparison schools were selected from among the non-MYP schools in the
district, based on their similarity on a composite of demographic variables: percentage of
students receiving English for Speakers of Other Languages (ESOL), Free and Reduced-price
Meals System (FARMS), and special education services; percentage of students identified as
Asian American, African American, Hispanic, or White; and number of students in the school.
Schools with special programs requiring student applications for selection were not included
among the comparison group of schools.
Sample of Students
The sample of students for this study was drawn from the previous study sample (Wade, 2011).
Two groups of students comprised the study sample: students who attended an MYP in Grade 8
during the 2009–2010 school year (N = 1,317); and students who attended a demographically
similar non-MYP middle school in Grade 8 during the same school year (N = 1,266). Course
enrollment and performance measures were examined for these two groups of students at two
points: in Grade 9 (one year out of middle school) and in Grade 10 (two years out of middle
school).
For this study, students were categorized according to their (previous) Grade 8 middle school
enrollment (MYP middle school or non-MYP middle school). Their current high school of
enrollment was not considered in the analyses.
Measures of Course Enrollment and Student Performance
Course enrollment and student performance data were obtained from district student records.
Science and mathematics course enrollment and course grades were examined, as well as
Biology and Algebra 1 state exam scores.

4 MYP Follow-Up in Science and Mathematics
Enrollment in advanced-level science and mathematics courses in Grade 9 and in Grade 10 was
examined for the two groups of students. Courses were counted as advanced if they were
designated “Honors,” “AP,” or “pre-IB.” In addition, mathematics courses that were more than
one year beyond the typical “pathway” in this school district were counted as advanced courses:
in Grade 9, Algebra 2, Pre-calculus, Calculus, and Statistics were counted as advanced courses
(in addition to Honors, AP, and pre-IB courses); in Grade 10, Pre-calculus, Calculus, and
Statistics were counted as advanced courses.
Scores and passing rates on the state-mandated Biology and Algebra exams were used as
additional measures of performance in science and mathematics. All high school students in this
state are required to take and pass exams in algebra, biology, government, and English. The
exams measure students’ content knowledge in the respective subject areas, and are aligned with
the state’s High School Core Learning Goals. Analyses of state-mandated test performance
included data for students who had taken the exams as of the end of Grade 10 (2011–2012 school
year).
Student Demographic Information
Race/ethnicity, gender, previous and current school, and receipt of services (FARMS, ESOL, and
special education) data were obtained from the district student records. The demographic data
were used as control variables in analyses of the effect of MYP on high school course
enrollment, course performance, and state-mandated test scores.
Procedures for Analysis
Data analytic procedures varied with the format of the data (e.g., binary or continuous outcome
variable). In all analyses of student performance and course enrollment, differences in student
characteristics were controlled using propensity scores based on race/ethnicity; receipt of
FARMS, special education, and ESOL services; and gender. The propensity scores were
converted to quintiles and used as covariates in the analytic models (Rosenbaum & Rubin, 1983,
1984, 1985). Additional covariates were used in some analyses, as described below. The
following analytic procedures were used in this study:
Logistic regression was used for the first evaluation question, examining whether
previous attendance at an MYP school had an effect on enrollment in advanced-level
science and mathematics courses during Grades 9 and 10. Differences in demographic
characteristics were controlled, as described above, using propensity score quintiles.
Logistic regression was used for the second evaluation question, examining whether
MYP had an effect on earning a C or higher in Grades 9 and 10 science and mathematics
courses. Differences in demographic characteristics were controlled, as described above,
using propensity score quintiles. In addition, students’ enrollment in an advanced-level
science or mathematics course was used as a covariate.
Analysis of Covariance (ANCOVA) and logistic regression were used to address the third
evaluation question. ANCOVA was used to examine whether previous attendance at an
MYP school had an effect on students’ scale scores on the Algebra 1 and Biology state-
mandated tests. Logistic regression was used to test whether MYP was related to
achieving a passing score on the Algebra 1 or Biology state test. Differences in

5 MYP Follow-Up in Science and Mathematics
demographic characteristics were controlled, as described above, using propensity score
quintiles.
Both statistical significance tests and measurement of effect size (Cohen’s d) were used in the
study. Cohen’s d was included to provide context across the findings and to judge whether the
observed relationships were large enough to be of practical significance to educators (American
Psychological Association, 2010). Appendix A describes the computation of effect sizes
associated with the analytic procedures used in this evaluation.
Results
Characteristics of the Student Sample
Characteristics of two groups of students—those who were enrolled in Grade 8 in 2009–2010 in
an MYP school, and those who were enrolled in Grade 8 in 2009–2010 in a non-MYP school—
were examined. Table 1 shows the demographic characteristics of the two groups of students in
2010–2011, during Grade 9.
Since the non-MYP schools were chosen to be demographically similar to the five MYP schools,
the samples were similar overall. The percentage of Black or African American students in the
MYP group was somewhat higher than that of the non-MYP group (24% vs. 17%), the
percentage of Asian students was somewhat lower in the MYP group than in the non-MYP group
(12% vs. 20%) and the percentage of students who currently or previously had been enrolled in
Table 1
Demographic Characteristics of 2010–2011 Grade 9 Students
Who Attended 2009–2010 Grade 8 in an MYP School or a non-MYP School
Demographic Characteristics
Grade 8 Enrollment in 2009–2010
MYP School
(N = 1,317)
non-MYP School
(N = 1,266)
% %
Gender Male 51.9 53.2
Female 48.1 46.8
Race/Ethnicity
American Indian or Alaskan Native 0.3 0.0
Asian 11.8 19.8
Black or African American 23.9 17.3
Hispanic/Latino 32.8 29.6
Native Hawaiian or Other Pacific Islander 0.2 0.0
White 26.7 29.5
Two or More Races 4.3 3.7
FARMS
(current or previous) FARMS 51.6 44.2
ESOL (current) ESOL enrollment, any level 6.8 4.9
Special education
(current)
Special education services,
any level 10.2 11.1
Note. FARMS = Free and Reduced-price Meals System; ESOL = English for Speakers of Other Languages.

6 MYP Follow-Up in Science and Mathematics
FARMS was 52% among the MYP group and 44% among the non-MYP group. Other
differences in the demographic makeup of the two groups were less than five percentage points.
Research Question 1: Was previous enrollment in MYP related to enrollment in advanced
level (honors or AP) science or mathematics courses in Grades 9 and 10?
Table 2 shows the percentage of students in each group who were enrolled in advanced-level
science and mathematics courses during Grade 9 and Grade 10. Higher percentages of students
who previously attended MYP schools were enrolled in advanced-level science and mathematics
courses compared with students who attended non-MYP schools, particularly in Grade 9 courses.
The effect of previous enrollment in an MYP school on enrollment in advanced-level courses in
high school was tested using logistic regression analyses, controlling for demographic
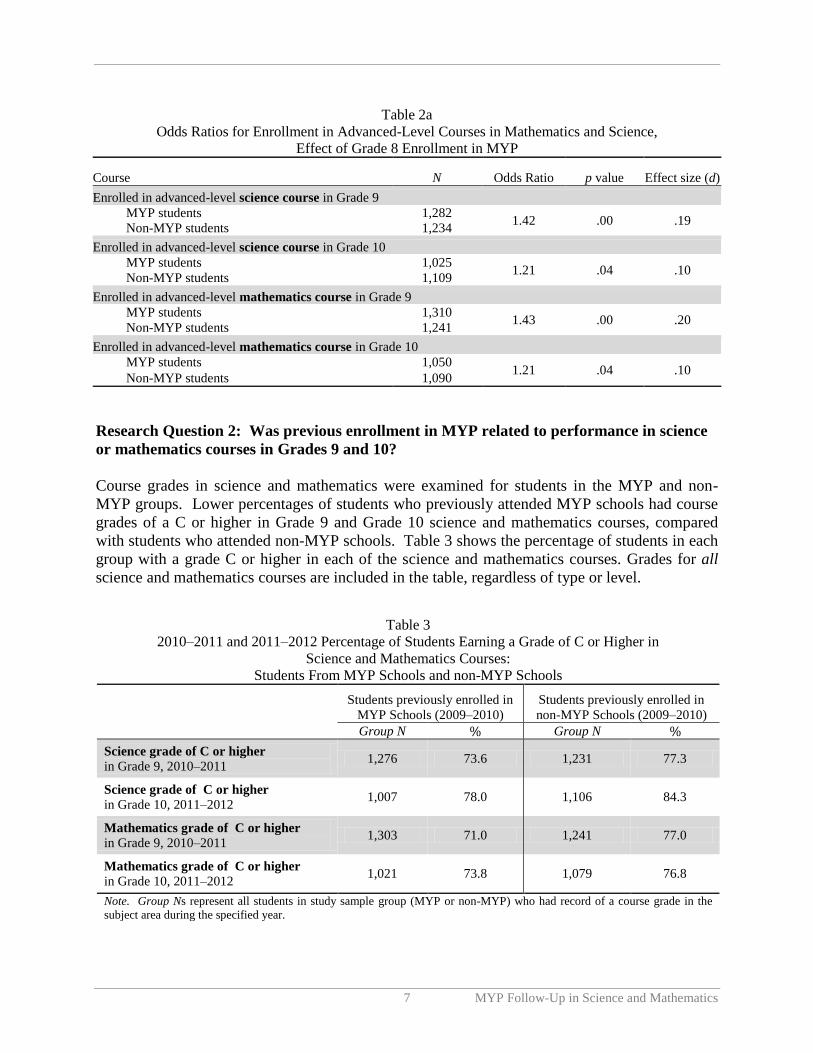
characteristics (using a propensity score quintile). As shown in Table 2a, in both science and
mathematics courses in Grade 9 and Grade 10, previous MYP enrollment had a statistically
significant effect; students who attended an MYP school were significantly more likely to be
enrolled in an advanced-level course than students who attended a non-MYP school. The effects
were strongest for enrollment in advanced-level courses in Grade 9. In Grade 9 mathematics, the
Odds Ratio was 1.43, indicating a small effect (d = .20), but one of practical significance. The
effect size for Grade 9 science was similar, and was very close to the threshold for practical
significance in education (OR = 1.42, d = .19).
Table 2
2010–2011 and 2011–2012 Enrollment in Advanced-Level Science and Mathematics Courses:
Students from MYP Schools and non-MYP Schools
Course and Grade Level
Students previously enrolled in
MYP Schools (2009–2010)
Students previously enrolled in
non-MYP Schools (2009–2010)
Group N % Group N %
Enrolled in advanced-level
science course in Grade 9, 2010–2011 1,282 69.5 1,234 63.9
Enrolled in advanced-level
science course in Grade 10, 2011–2012 1,025 62.0 1,109 61.0
Enrolled in advanced-level
mathematics course in Grade 9,
2010-2011
1,310 52.0 1,241 47.1
Enrolled in advanced-level
mathematics course in Grade 10,
2011-2012
1,050 46.1 1,090 44.7
Note. Group Ns represent all students in study sample group (MYP or non-MYP) who had record of a course in the subject
area during the specified year.
7 MYP Follow-Up in Science and Mathematics
Research Question 2: Was previous enrollment in MYP related to performance in science
or mathematics courses in Grades 9 and 10?
Course grades in science and mathematics were examined for students in the MYP and non-
MYP groups. Lower percentages of students who previously attended MYP schools had course
grades of a C or higher in Grade 9 and Grade 10 science and mathematics courses, compared
with students who attended non-MYP schools. Table 3 shows the percentage of students in each
group with a grade C or higher in each of the science and mathematics courses. Grades for all
science and mathematics courses are included in the table, regardless of type or level.
Table 2a
Odds Ratios for Enrollment in Advanced-Level Courses in Mathematics and Science,
Effect of Grade 8 Enrollment in MYP
Course N Odds Ratio p value Effect size (d)
Enrolled in advanced-level science course in Grade 9
MYP students 1,282 1.42 .00 .19
Non-MYP students 1,234
Enrolled in advanced-level science course in Grade 10
MYP students 1,025 1.21 .04 .10
Non-MYP students 1,109
Enrolled in advanced-level mathematics course in Grade 9
MYP students 1,310 1.43 .00 .20
Non-MYP students 1,241
Enrolled in advanced-level mathematics course in Grade 10
MYP students 1,050 1.21 .04 .10
Non-MYP students 1,090
Table 3
2010–2011 and 2011–2012 Percentage of Students Earning a Grade of C or Higher in
Science and Mathematics Courses:
Students From MYP Schools and non-MYP Schools
Students previously enrolled in
MYP Schools (2009–2010)
Students previously enrolled in
non-MYP Schools (2009–2010)
Group N Group N
Science grade of C or higher
in Grade 9, 2010–2011 1,276 73.6 1,231 77.3
Science grade of C or higher
in Grade 10, 2011–2012 1,007 78.0 1,106 84.3
Mathematics grade of C or higher
in Grade 9, 2010–2011 1,303 71.0 1,241 77.0
Mathematics grade of C or higher
in Grade 10, 2011–2012 1,021 73.8 1,079 76.8
Note. Group Ns represent all students in study sample group (MYP or non-MYP) who had record of a course grade in the
subject area during the specified year.

8 MYP Follow-Up in Science and Mathematics
Logistic regression analyses were used to test whether previous MYP enrollment was related to a
grade of C or higher in Grade 9 and Grade 10 science and mathematics.1 Demographic
characteristics, as well as current enrollment in an advanced-level course, were controlled in the
analyses. Significantly higher percentages of students who previously attended non-MYP
schools earned a C or higher in Grade 10 science and in Grade 9 mathematics courses. The
effect size for Grade 10 science was small but of practical significance (d = -.21), and the effect
size for Grade 9 mathematics approached practical significance (d = -.18). Effect sizes for
Grade 9 science and Grade 10 mathematics were negligible (Grade 9 science: d = -.10; Grade 10
mathematics: d = -.06).
Research Question 3: Was previous enrollment in MYP related to performance on Biology
and Algebra 1 state-mandated exams?
Performance on the Biology and Algebra 1 state exams were examined with scale scores and
passing rates. Table 4 summarizes the mean scale scores for students who attended MYP
schools and students who attended non-MYP schools, adjusted for demographic characteristics.
ANCOVA revealed no statistically significant differences between MYP and non-MYP students
in their mean Biology scale scores or their mean Algebra 1 scale scores.
1 Course grades were categorized into “C or higher” and “D or E (failing)” because the district uses these categories
in systemwide analyses. Additional analyses were conducted using course grades of B and higher, with similar
results.
Table 3a
Odds Ratios for Earning a Course Grade of C or Higher,
Effect of Previous Enrollment in MYP
Course N Odds Ratio p value Effect size (d)
Science grade of C or higher in Grade 9
MYP students 1,276 .83 .06 -.10
Non-MYP students 1,231
Science grade of C or higher in Grade 10
MYP students 1,007 .69 .00 -.21
Non-MYP students 1,106
Mathematics grade of C or higher in Grade 9
MYP students 1,303 .72 .00 -.18
Non-MYP students 1,241
Mathematics grade of C or higher in Grade 10
MYP students 1,021 .89 .28 -.06
Non-MYP students 1,079

9 MYP Follow-Up in Science and Mathematics
Table 5 shows the percentage of students in each of the two groups who earned passing scores on
the Biology and Algebra 1 state-mandated exams.
Logistic regression analyses were used to test whether previous MYP enrollment was related to
earning a passing score on the Biology and Algebra exams (Table 5a). Demographic
characteristics (using propensity score quintiles) were controlled. Analysis of Biology exam
pass results revealed an Odds Ratio of 1.35 (p = .05), indicating the MYP students were more
likely to pass, but the effect size was smaller than the traditional threshold for practical
educational significance (d = .17). MYP enrollment had no effect on a students’ likelihood of
passing the Algebra exam (OR = 1.09, p = .49)
Table 4
Adjusted Mean Scale Scores on Algebra 1 and Biology State-mandated Exams Through Grade 10:
Students from MYP Schools and non-MYP Schools
Grade 8 Enrollment in 2009–2010
IB MYP Schools Non-MYP Schools MYP effect
N ̅ N ̅ Mean
difference
Std.
error p ES (d)
Biology Score 983 440.6 1,053 439.9 0.7 1.04 .65 .02
Algebra 1 Score 1,215 441.4 1,207 440.2 1.2 .85 .33 .04
Table 5
Percentage of Students Earning a Passing Score on Algebra 1 and Biology State-mandated Exams
Through Grade 10: Students From MYP Schools and non-MYP Schools
Grade 8 Enrollment in 2009–2010
MYP Schools non-MYP Schools
Group N Group N
Earned Passing Score on Biology Exam 983 90.5 1,053 89.1
Earned Passing Score on Algebra 1 Exam 1,215 87.0 1,207 87.6
Table 5a
Odds Ratios for Passing Algebra and Biology State-mandated Exam,
Effect of Previous Enrollment in MYP
State-mandated exam N Odds Ratio p value Effect size (d)
Biology
MYP students 983 1.35 .05 .17
Non-MYP students 1,053
Algebra
MYP students 1,215 1.09 .49 .05
Non-MYP students 1,207

10 MYP Follow-Up in Science and Mathematics
Conclusion
This study followed the progress of MYP and non-MYP students into high school in an effort to
examine whether high school course enrollment and performance in mathematics and science
were related to previous MYP enrollment. There was some evidence that students who attended
an MYP school were more likely to be enrolled in advanced-level mathematics and science
courses in Grades 9 and 10; the strongest effects of MYP were in Grade 9 course enrollment.
This finding is in line with the better performance of MYP students compared with non-MYP
students on Grade 8 mathematics and science MSA tests reported in an earlier study (Wade,
2011). In addition, in survey responses, MYP students named the rigor and challenge of MYP
courses as one of the top three benefits of being an MYP student (Wade and Wolanin, 2013). It
may be that the opportunity to tackle a high level of academic work in MYP has an impact on
students’ course selections in high school.
However, students who attended MYP schools were slightly less likely than their non-MYP
counterparts to earn a grade of C or better in Grade 10 science, after controlling for demographic
variables and current enrollment in an advanced level course. Other differences between MYP
students and non-MYP students were not statistically or practically significant. The current
study does not provide insight into why no positive effects were found for MYP on course
grades. Since the scale for course grades is only five points with a restricted range, it is possible
that grades were not a sensitive measure for testing the effect of a program that the student was
enrolled in one or two years earlier.
Finally, students who had attended MYP schools were more likely to pass their Biology state-
mandated exam than non-MYP students, but the difference was too small to be of practical
significance to educators. Passing rates on the Algebra 1 exam and scale scores on both exams
were statistically similar for the two groups of students. Given that almost all students pass the
state-mandated exams, it becomes difficult to detect a relationship with MYP. In addition,
students have little or no incentive to achieve more than a passing score, so the scale scores may
not display the same range as other tests on which a student may realize some benefit by
achieving the highest score possible (e.g., SAT).

11 MYP Follow-Up in Science and Mathematics
Limitations
Students in this study were categorized according to their (previous) Grade 8 middle school
enrollment (MYP middle school or non-MYP middle school). Their current high school of
enrollment was not considered in the analyses. It should be noted, however, that 6 of the 25 high
schools attended by students in the study have MYP or pre-IB programs for students in Grades 9
and 10, and students from both MYP and non-MYP middle schools may participate in the
Grades 9 and 10 MYPs in these high schools. Thus, in the current study, some students in the
non-MYP group (based on enrollment in a non-MYP middle school) may have participated in an
MYP or pre-IB program in Grade 9 or Grade 10.

12 MYP Follow-Up in Science and Mathematics
References
American Psychological Association. (2010). Publication manual of the American Psychological
Association (6th ed.). Washington, DC: Author.
Bunnell, T. (2011). The International Baccalaureate Middle Years Programme after 30 years:
A critical inquiry. Journal of Research in International Education, 10(3), 261–274.
Caffyn, R. & Cambridge, J. (2005). From Middle Years Programme to Diploma Programme: A
critical response to Candice Reimers. IB Research Notes, 5(2), 2–9.
Cohen, J. (1988). Statistical power for the behavioral sciences (2nd ed.). Hillsdale, NJ:
Erlbaum.
International Baccalaureate. (2008). A review of research relating to the IB Diploma
Programme. Retrieved February 1, 2011, from
http://ibo.org/research/resources/documents/dpresearchreview.pdf.
International Baccalaureate. (2011a). About the International Baccalaureate. Retrieved
February 1, 2011, from http://www.ibo.org/general/who.cfm.
International Baccalaureate. (2011b). The Middle Years Programme. Retrieved February 1,
2011, from http://ibo.org/myp/.
Kiplinger, V.L. (2005a). Effects of IB participation on mathematics achievement and growth,
2001–2004 in Academy School District Twenty. Unpublished report.
Kiplinger, V.L. (2005b). Effects of IB participation on reading achievement and growth,
2000–2004 in Academy School District Twenty. Unpublished report.
Kline, R.B. (2004). Beyond significance testing. Washington, DC: American Psychological
Association.
Reimers, C. (2004). From MYP to Diploma: An investigation into the impact of the
International Baccalaureate Middle Years Programme on International Baccalaureate
Diploma candidates. International Schools Journal, 24(2), 11–18.
Rosenbaum, P.R., & Rubin, D.B. (1983). The central role of the propensity score in
observational studies for causal effects. Biometrika, 70, 41–45.
Rosenbaum, P.R., & Rubin, D.B. (1984). Reducing bias in observational studies using
subclassification on the propensity score. Journal of the American Statistical Association,
79, 561–524.

13 MYP Follow-Up in Science and Mathematics
Rosenbaum, P.R., & Rubin, D.B. (1985). Constructing a control group using multivariate
matched sampling that incorporates the propensity score. The American Statistician, 39,
33–38.
Tan, L. & Bibby, Y.(2010). IB PYP and MYP student performance on the International Schools’
Assessment(ISA). Melbourne:Australian Councilfor Educational Research.
Tan, L and Bibby, Y. 2012. Performance Comparison between IB School Students and Non-IB
School Students on the International Schools’ Assessment (ISA) and on the Social and
Emotional Wellbeing Questionnaire. Melbourne: Australian Council for Educational
Research.
Wade, Julie. (2011). Student Performance and Student Engagement in the International
Baccalaureate Middle Years Programme. Bethesda, MD: International Baccalaureate
Organization.
Wade, J. and Wolanin, N. (2013). Global mindedness and perceptions of middle school
experiences among students enrolled in the International Baccalaureate Middle Years
Programme. Bethesda, MD: International Baccalaureate Organization.

14 MYP Follow-Up in Science and Mathematics
Appendix A
Calculation of Effect Sizes
Effect sizes for comparing groups on continuous outcome measures (e.g., means). Effect sizes
were estimated for differences between means with the standardized mean difference statistic, or
Cohen’s d (Cohen, 1988). The formula for Cohen’s d is:
meantreatment − meancomparison
pooled standard deviation of outcome measure
Cohen (1988) provides these guidelines for interpretation: d = .20 is considered a small effect;
d = .50 is considered a medium effect; d = .80 is considered a large effect.
Effect sizes for comparing groups on categorical outcome measures (e.g., proficient/not
proficient; agree/disagree). For categorical outcomes the logistic regression analytic procedure
was used to compute an odds ratio. Kline (2004) provides a formula for converting an odds ratio
to an effect size expressed as d. That formula is:
logit d = ln(OR)
pi/3
In this study, the treatment group is
students who attended MYP schools and
the comparison group is students who
attended non-MYP schools.