Embed Size (px)
Citation preview

http://www.nyc.gov/html/dot/html/safety/walkingschools.shtml
High School Activities Grades 9-12
2 GRADES 9-12: HIGH SCHOOL ACTIVITIES
EDUCATOR GUIDE
Thanks for your interest in this interdisciplinary project designed for high school students. It’s simple, rewarding, and a chance for your students to enter and win a competition! In this packet you will find suggested activities and handouts to help prepare your students’ contest entry.
In order to raise awareness about the importance of walking in New York, our suggested activities highlight the following three key themes:
Health: There are major health benefits to walking, from a healthy heart, to weight loss—and more.
Environmental Sustainability: With zero carbon emissions, walking is a great way to go green.
Safety: We can do our part to be safe when we walk by staying alert and making ourselves visible. We can also ask drivers to be alert and slow down to make walking safer!
It’s up to you to decide which activity/activities to do with your students. Your studies can examine any of the many aspects of walking that are relevant to your contest entry and correspond to the contest guidelines.
HandoutsNeighborhood Walk(1)
The Carbon Footprint of a Commute(2)
CrashStat(3)
PSA Planning Sheet(4)
Streets Survey(5)
Redesign Your Street(6)
Outline Your Letter(7)
NYC Walking Facts(8)
Introduction
About We’re Walking HereNew York City is a city of walkers. The majority of young New Yorkers walk to school, to transit, and around their city each day. We want to take the opportunity this October, the month of International Walk to School Day, to celebrate this achievement – and to encourage students and their families to walk more often.
Safe Routes to School (SRtS) is a national program that was born out of the need to protect school-aged children as they walk or bike to school. Here in New York City, we at NYCDOT’s Division of Safety Education and Outreach work directly with schools to educate children to be skilled pedestrians and cyclists. Additionally, NYCDOT is working to make streets safer by slowing traffic around schools and raising awareness about the importance of safe driving and biking behavior.
3 GRADES 9-12: HIGH SCHOOL ACTIVITIES
EDUCATOR GUIDE
Neighborhood WalkCategories: SafetySubjects: Social Studies, ScienceTime: 30-45 minutesHandout: (1) Neighborhood Walk
Lead the students in a discussion about the area around their school and the way the streets are designed. You can use the “Neighborhood Walk” handout that we’ve included. Distribute copies to each student and assign teams. Take a walk with your students on the block directly around the school or a few blocks that are close by. Have the students use the handout to write observations for each category, determining what kinds of behaviors they see that are dangerous. When you return from your walk, discuss how these observations and notes can inform their contest entry. Were you surprised by what you saw? Why is it especially dangerous when drivers don’t pay attention? If a lot of kids walk to your school, but the traffic seems to be going too fast, what behavior changes should be made to encourage walking in the area? If people are making dangerous turns at an intersection, what could your students teach drivers to make them safer?
Commuter ChoicesCategories: Health, Safety, EnvironmentSubjects: Social Studies, ELA, MathTime: 20-30 minutes
Have the students list the various modes of transportation available in the city. Encourage them to think outside the box and include things like the ferry, skateboarding etc. Now take a poll of the students. Ask them to raise their hands and identify the way they got to school this morning. Mark
these numbers down on the board. Ask students to express them as a fraction or percentage (e.g. two-thirds of us walked today). Figure out how many people walk each day (since so many students take transit, you can include those who walk to and from transit for your numbers here). Then have a discussion about ways we can get around that are better for ourselves and for our city. What are the healthiest, greenest, and most fun ways to get to school? What could we do to improve our commutes? How could we share this information with adults through the competition entry?
Personal Carbon FootprintCategories: EnvironmentSubjects: Environmental Science, Social StudiesTime: 20-30 minutesHandout: (2) The Carbon Footprint of a Commute
Ask the class to define the term “carbon footprint.” If you want to give them an official definition, it’s a “measure of the impact human activities have on the environment in terms of the amount of greenhouse gases produced, measured in units of carbon dioxide.” In other words, your personal carbon footprint is how much pollution you put in the air from your behavior in a day. For the purposes of this lesson, we will concentrate only on the carbon footprint of a commute to and from school. Use “The Carbon Footprint of a Commute” handout to go over the different amounts of pollution produced by the different modes of transportation. Why is walking so great for the environment?
Classroom Activities
4 GRADES 9-12: HIGH SCHOOL ACTIVITIES
EDUCATOR GUIDE
Crashstat.orgCategories: SafetySubjects: Social StudiesTime: 45 minutesHandout: (3) Crashstat.org
Distribute the “Crashstat.org” handout. Have students work with partners at a computer. Look at the mapped crash statistics for the area around the school and fill out the worksheet. Come back together for a class discussion. Why is it important for the streets to be safe for pedestrians? What percentage of people getting around are pedestrians? Which pedestrians are most vulnerable? If the students believe that people are generally driving dangerously in the area, encourage them to think about what particular changes need to be made to mitigate this problem. Do we need better education, engineering, or enforcement? Do we need all three? If so, how would we go about doing any of these things? And in the meantime, what could we do to protect ourselves?
Public Service AnnouncementsCategories: Health, Safety, EnvironmentSubjects: ELA, Social StudiesTime: 1.5 hoursHandout: (4) PSA Planning Sheet
Create posters or flyers promoting walking and safe driving. As a class, you can define what is a Public Service Announcement (PSA) and think of some examples of PSA campaigns that have been effective (around smoking or obesity, for example). You can explain to the class that we can make our own PSAs to advocate for change in our communities. Students can work alone, with partners, or in groups to make their PSAs. (We’ve included a planning sheet you can use).
They can present these as posters or flyers to their classmates, the rest of the school, or leaders in their community. Put up posters at the front entrance for the month of October, or hand out flyers at a school-wide event.
Walkability MapsCategories: Health, Safety, EnvironmentSubjects: Geography, Urban PlanningTime: 1.5 hours
Create “walkability” maps by surveying the area around the school. As a class, create a set of criteria such as how clear are the street markings, how safe are the street crossings, are there places to sit and rest along the route, etc. Then go outside to conduct research, and then split into groups to create the maps. You can use NYC Oasis [www.oasisnyc.net/map.aspx] to find a good aerial view of your school zone. Have a discussion about the areas where you can walk more safely and easily than others. Why is it important to be able to walk to get around? Use these maps as a jumping off point for your design ideas.
5 GRADES 9-12: HIGH SCHOOL ACTIVITIES
EDUCATOR GUIDE
Survey ProjectCategories: Health, SafetySubjects: Social Studies, MathTime: 45 minutes Handout: (5) Street Survey
Pass out the survey sheet. Ask the students to think through the answers to the seven questions in the survey and fill out their answers as honestly as possible. Have a discussion about their answers. If there’s time, calculate some percentages in table groups and have them make pie charts.
Oral History ProjectCategories: Health, Safety, EnvironmentSubjects: History, Social StudiesTime: 1 hour
Visit a local senior center or retirement community and interview older adults about how streets in the area used to be when they were children or young adults. How did they get around their city? Did they do a lot of walking? What were the transit options like? Have the streets changed since? Do they feel safe in the area? Why or why not? What are their recommendations for making the streets safer for seniors to walk today?
Photography ProjectCategories: Health, Safety, EnvironmentSubjects: Geography, Social Sciences, ArtTime: 1.5 hours
Students should photograph important things that are beautiful, interesting, and/or dangerous about the streets around the school. Take a look at the pictures. Anything they would like to change? What can you do about the streets? Have students work with groups to draw their ideas for improved streets by layering transparent vellum/tracing paper over print-outs of these photographs. They should also create a key to their designs and write up accompanying descriptions. Or if time is limited, just have them write up verbal descriptions of proposed changes. Put up these photos and proposed changes in an exhibit somewhere in the school or a nearby community center.
6 GRADES 9-12: HIGH SCHOOL ACTIVITIES
EDUCATOR GUIDE
Video ConferenceCategories: Health, Safety, EnvironmentSubjects: Social StudiesTime: 45 minutes
Video conference with another classroom in the city, preferably from another borough, and discuss walking in that area. How do most students get to that school each day? What are streets like in the area? How is it similar or different from how students get to your school? Are there any safety, health, or sustainability initiatives going on at that school? How could we partner together on a long-term project pertaining to walking?
Alternatively, find a school in a suburban or rural location, or another city, to discuss the differences between NYC and their location.
Human BarometerCategories: SafetySubjects: Social Studies, Geography, GovernmentTime: 30 - 45 minutes
Do a “human barometer” activity about walking and safety. Have students stand up and clear away desks. Establish a corner for AGREE, one for DISAGREE and a point in the center for MIXED.Then read each statement to the class. After each question, have students choose whether they AGREE, DISAGREE, or are in the middle, in which case they are MIXED. They should walk towards the side of the class with which they most identify. Here are suggested statements. We recommend that you select three from these five in order to build in enough time for a full class conversation about the issue:
My street is safe enough to walk there. •
Children should be able to walk to school by • themselves.
When a pedestrian is hit by a car, it’s not an • accident - someone is to blame.
I trust drivers when walking across the street.•
Walking safely in New York is everyone’s right.•
Once the students have had a conversation about each question, have a wrap up discussion for a few minutes. Ask the students if they have ever thought about these issues before.
Redesign Your StreetCategories: Health, Safety, EnvironmentSubjects: Social Studies, ArtTime: 1.5 hoursHandout: (6) Redesign Your Street
If you have time, go for a walk in the area around your school and observe problems in terms of health, safety, and sustainability. Have a discussion about what you saw and determine what design changes should be made to make streets better for pedestrians. Use the “Redesign Your Street” handout to draw an outline of the block around the school. Note the avenues and side streets and major markers that are located on the block (school, park, hospital, etc). Next students can come up with a design for the street that makes it more pedestrian-friendly. Present designs to the class.
7 GRADES 9-12: HIGH SCHOOL ACTIVITIES
EDUCATOR GUIDE
Letter WritingCategories: Health, Safety, EnvironmentSubjects: ELA, Social Studies, GovernmentTime: 45 minutes-1.5 hoursHandout: (7) Outline Your Letter, (1) Neighborhood Walk
Identify ways in which streets could be improved to make for safer walking. Discuss letter writing as a form of political action, and why it is a good way to make your voice heard. First you need to collect some information about your streets to figure out what is wrong (you can brainstorm in groups using the “Neighborhood Walk” handout). We’ve included a worksheet, “Outline Your Letter,” if you want to take more time to plan out your letters in advance. Identify the appropriate official to send letters. Find your school zone’s elected officials by typing in the zip code at the following website: www.congress.org/ congressorg/dbq/officials/.
8 GRADES 9-12: HIGH SCHOOL ACTIVITIES
EDUCATOR GUIDE
Walking BannerCategories: Health, Safety, EnvironmentSubjects: Art, Health, Social Studies
Have a discussion about the social, health, environmental, and cost benefits of walking to get around. Think about what kind of images portray these themes. Make a big banner about walking in September, and put up the banner at the front of the school for the month of October to celebrate walking.
School-wide Walk for a CauseCategories: Health, Safety, EnvironmentSubjects: Art, Health, Social Studies
Organize a school-wide fundraiser walk for a cause, to raise money for an issue related to walking, such as an environmental, health, or safety organization. Greet walkers with stickers, gifts and refreshments. Public officials can be invited to say a few words.
School-wide Active Transportation CompetitionCategories: Health, Safety, EnvironmentSubjects: Art, Health, Social Studies, Science, Math
Create a competition to log miles that students have accumulated via walking, transit, and biking. Classes can compete against each other or different grades, or the school could work as a team to accumulate green miles towards a common goal, such as “Getting To Antarctica.” Have an assembly as a culmination of this school-wide project to celebrate sustainable miles logged.
School-wide Activities
EDUCATOR GUIDE
9 GRADES 9-12: HIGH SCHOOL WORKSHEETS
WorksheetsGrades 9-12
GRADES 9-12: HIGH SCHOOL WORKSHEET
Name:
School:
Date:
Class:
(1) Neighborhood Walk
CATEGORy How many people do you see? What should they be doing differently?
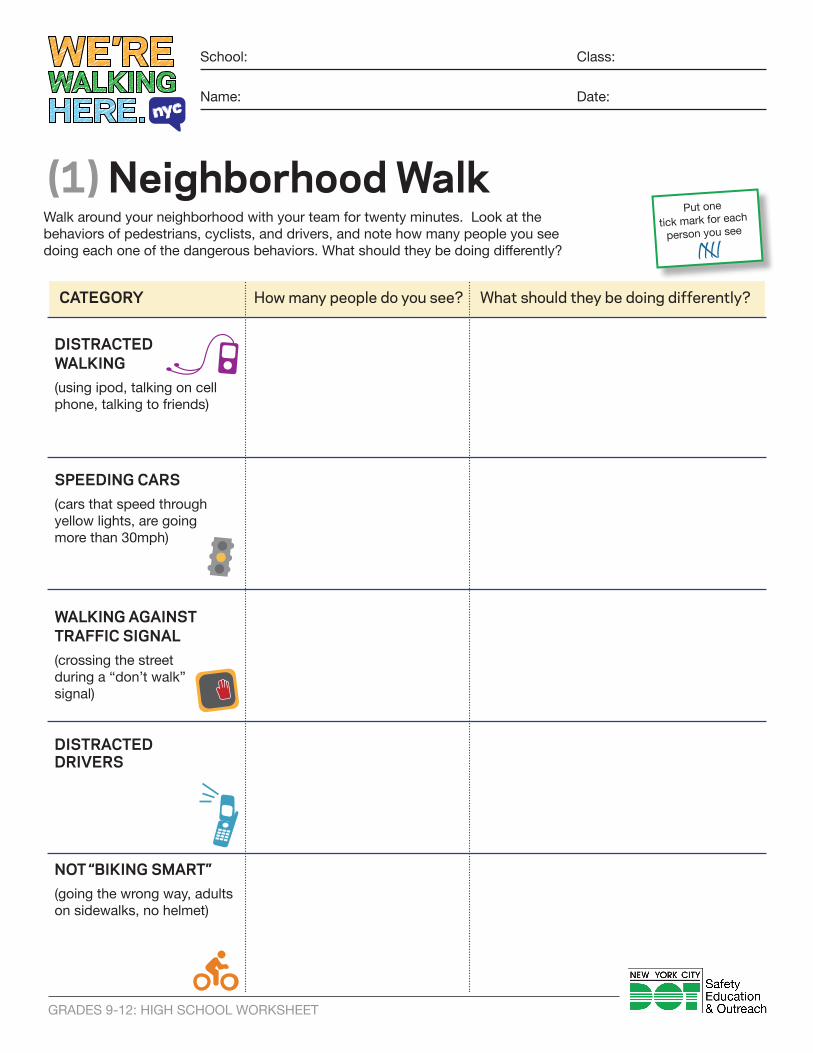
Walk around your neighborhood with your team for twenty minutes. Look at the behaviors of pedestrians, cyclists, and drivers, and note how many people you see doing each one of the dangerous behaviors. What should they be doing differently?
DISTRACTED WAlkING(using ipod, talking on cell phone, talking to friends)
SPEEDING CARS(cars that speed through yellow lights, are going more than 30mph)
WAlkING AGAINST TRAffIC SIGNAl(crossing the street during a “don’t walk” signal)
DISTRACTED DRIvERS
NOT “BIkING SmART”(going the wrong way, adults on sidewalks, no helmet)
Put one
tick mark for each
person you see
IIII
GRADES 9-12: HIGH SCHOOL WORKSHEET
Name:
School:
Date:
Class:
(2) The Carbon footprint of a Commute
5 mile
s
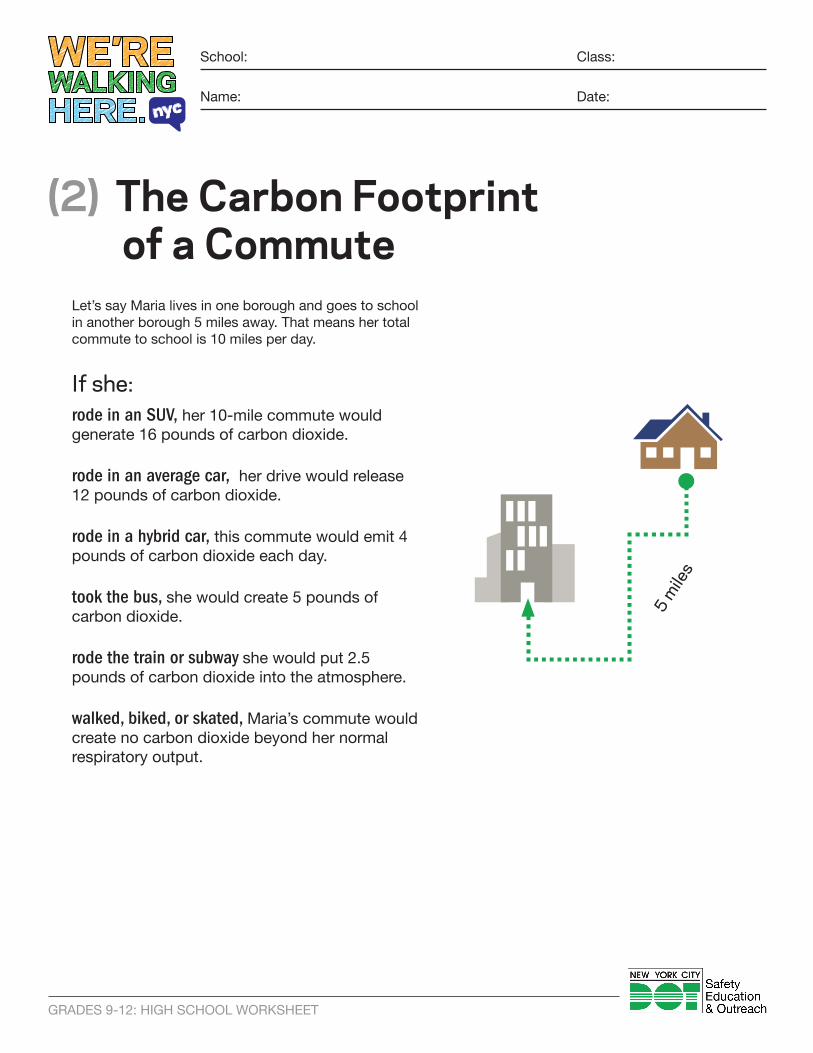
Let’s say Maria lives in one borough and goes to school in another borough 5 miles away. That means her total commute to school is 10 miles per day.
If she:rode in an SUV, her 10-mile commute would generate 16 pounds of carbon dioxide.
rode in an average car, her drive would release 12 pounds of carbon dioxide.
rode in a hybrid car, this commute would emit 4 pounds of carbon dioxide each day.
took the bus, she would create 5 pounds of carbon dioxide.
rode the train or subway she would put 2.5 pounds of carbon dioxide into the atmosphere.
walked, biked, or skated, Maria’s commute would create no carbon dioxide beyond her normal respiratory output.
GRADES 9-12: HIGH SCHOOL WORKSHEET
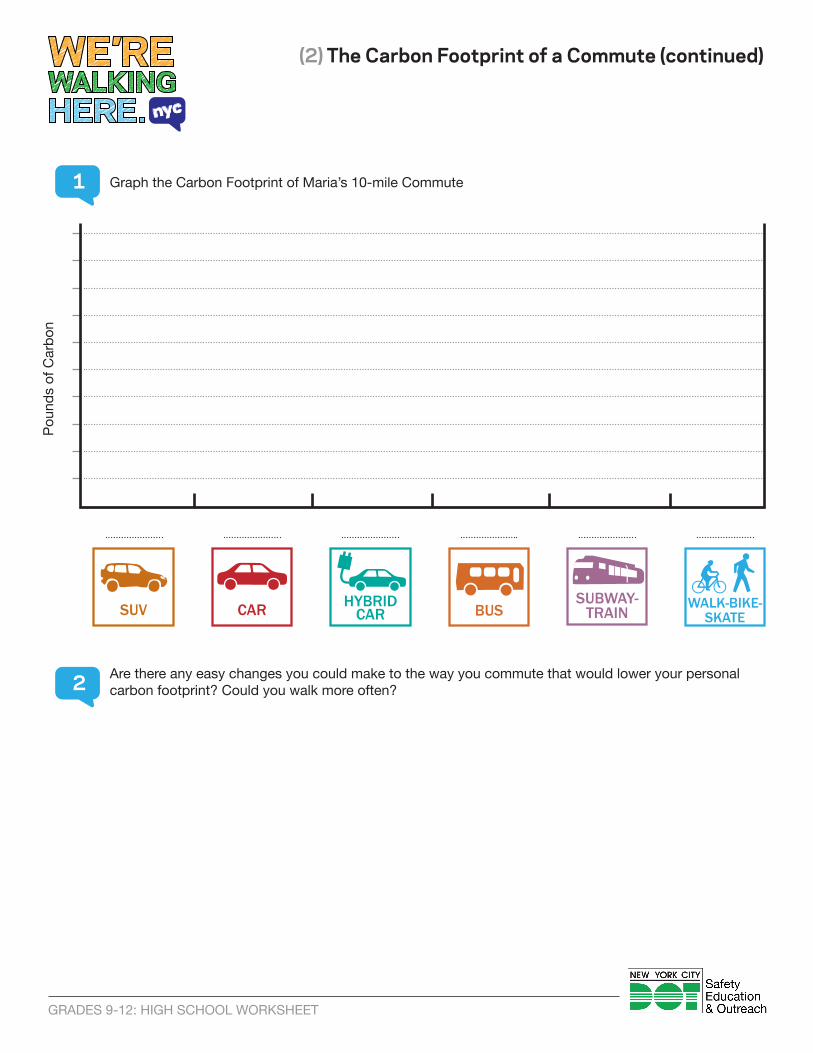
Graph the Carbon Footprint of Maria’s 10-mile Commute
Pou
nds
of C
arb
on
Are there any easy changes you could make to the way you commute that would lower your personal carbon footprint? Could you walk more often?
WALK-BIKE-SKATECAR
BUS
SUBWAY- TRAIN
HYBRIDCARSUV
1
2
(2) The Carbon footprint of a Commute (continued)
GRADES 9-12: HIGH SCHOOL WORKSHEET
Name:
School:
Date:
Class:
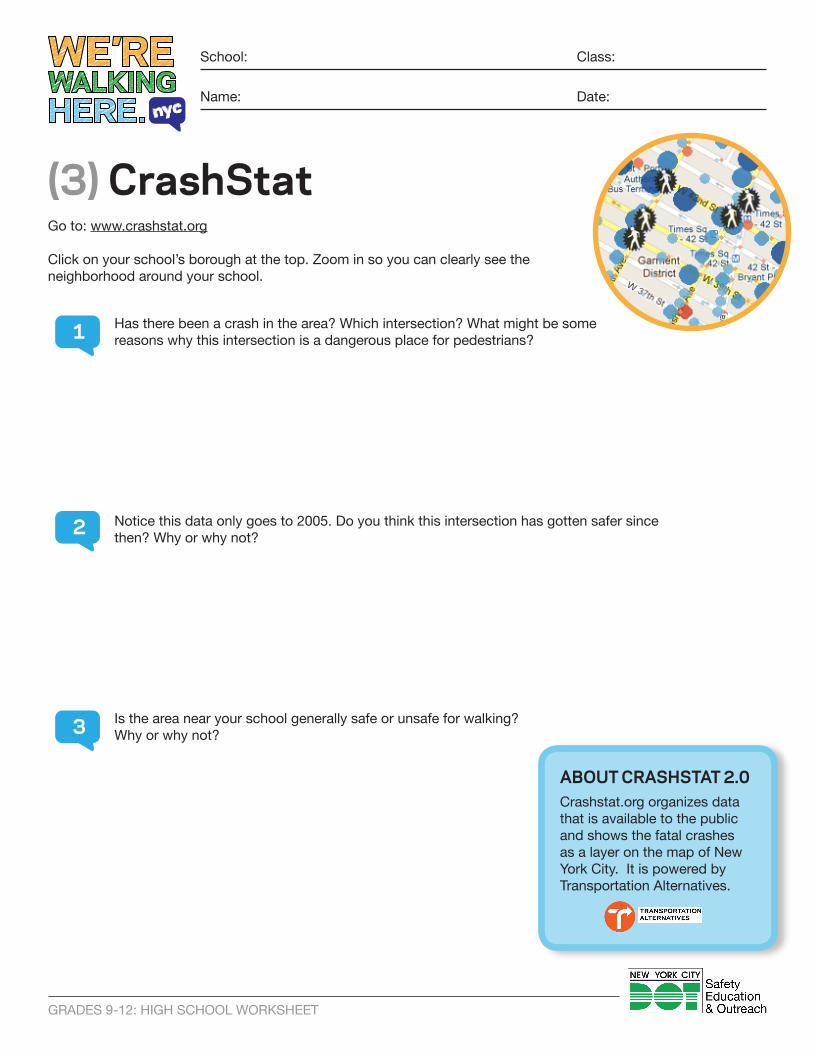
(3) CrashStatGo to: www.crashstat.org
Click on your school’s borough at the top. Zoom in so you can clearly see the neighborhood around your school.
1
2
3
Has there been a crash in the area? Which intersection? What might be some reasons why this intersection is a dangerous place for pedestrians?
Notice this data only goes to 2005. Do you think this intersection has gotten safer since then? Why or why not?
Is the area near your school generally safe or unsafe for walking? Why or why not?
ABOUT CRASHSTAT 2.0Crashstat.org organizes data that is available to the public and shows the fatal crashes as a layer on the map of New York City. It is powered by Transportation Alternatives.
GRADES 9-12: HIGH SCHOOL WORKSHEET
Name:
School:
Date:
Class:
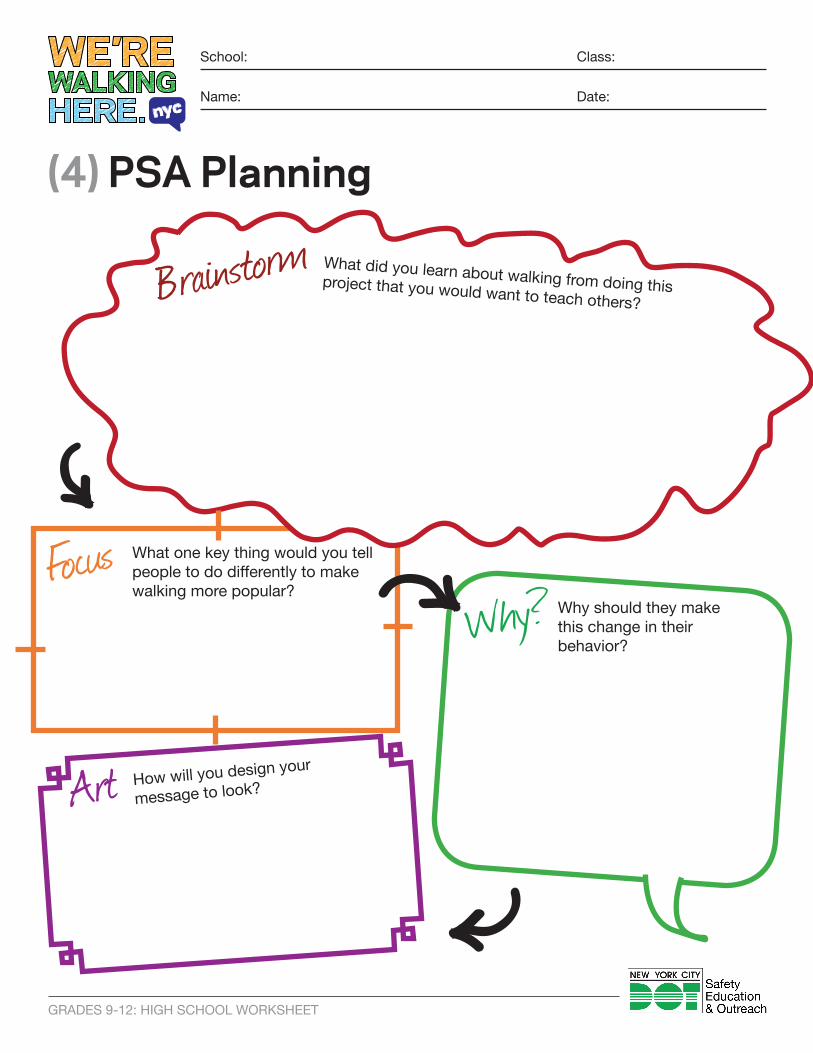
(4) PSA Planning
What did you learn about walking from doing this project that you would want to teach others?
What one key thing would you tell people to do differently to make walking more popular?
Why should they make this change in their behavior?
How will you design your
message to look?
Brainstorm
FocusWhy?
Art
GRADES 9-12: HIGH SCHOOL WORKSHEET
Name:
School:
Date:
Class:
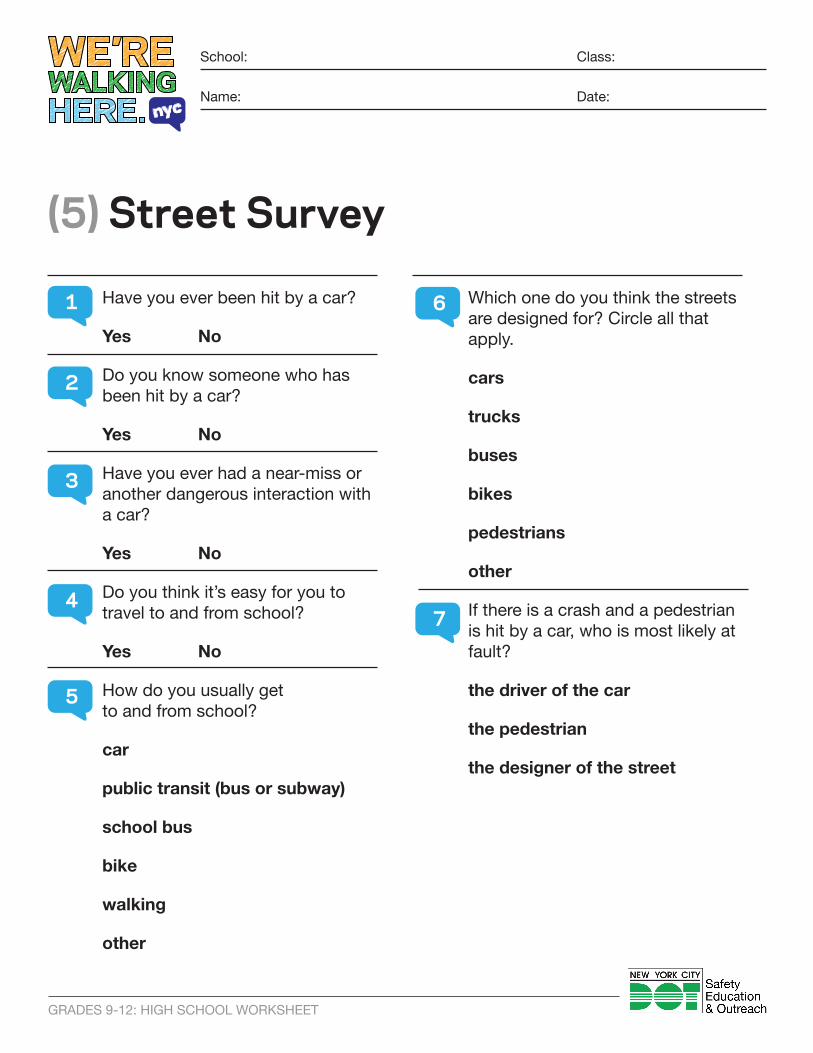
Have you ever been hit by a car?
Yes No
Do you know someone who has been hit by a car?
Yes No
Have you ever had a near-miss or another dangerous interaction with a car?
Yes No
Do you think it’s easy for you to travel to and from school?
Yes No
How do you usually get to and from school?
car
public transit (bus or subway)
school bus
bike
walking
other
Which one do you think the streets are designed for? Circle all that apply.
cars
trucks
buses
bikes
pedestrians
other
If there is a crash and a pedestrian is hit by a car, who is most likely at fault?
the driver of the car
the pedestrian
the designer of the street
(5) Street Survey
1
2
3
4
5
6
7
GRADES 9-12: HIGH SCHOOL WORKSHEET
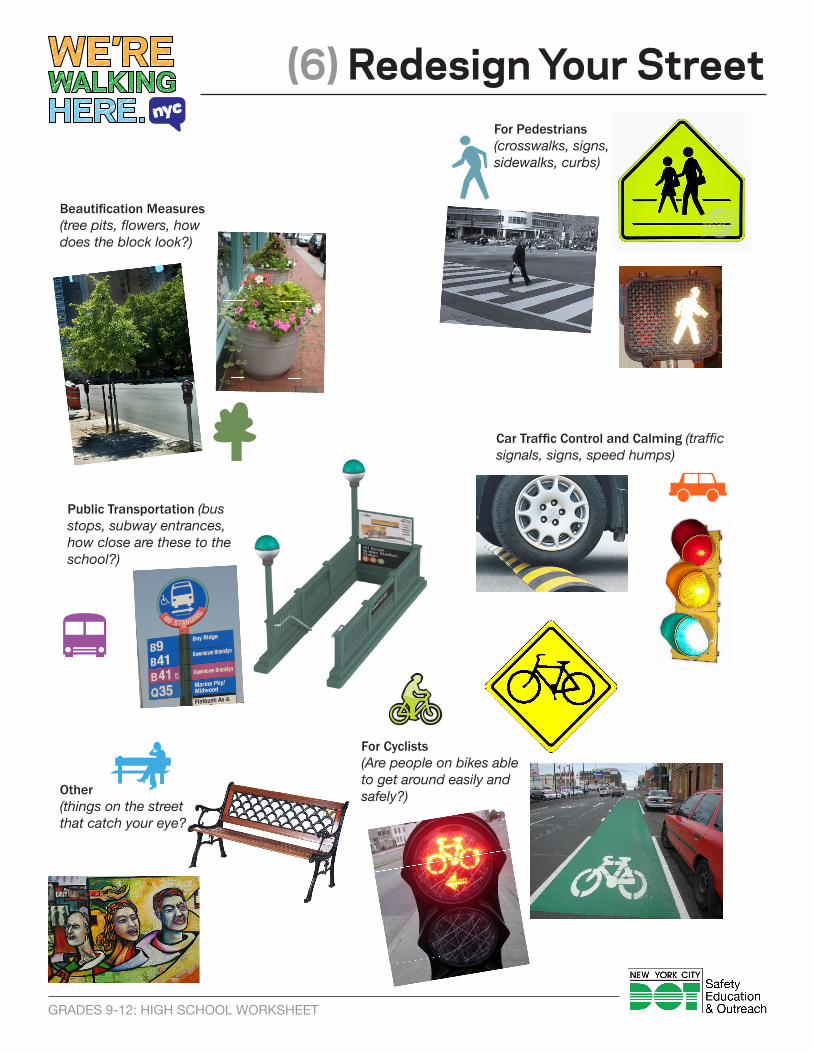
Beautification Measures(tree pits, flowers, how does the block look?)
For Pedestrians (crosswalks, signs, sidewalks, curbs)
Car Traffic Control and Calming (traffic signals, signs, speed humps)
Public Transportation (bus stops, subway entrances, how close are these to the school?)
Other (things on the street that catch your eye?
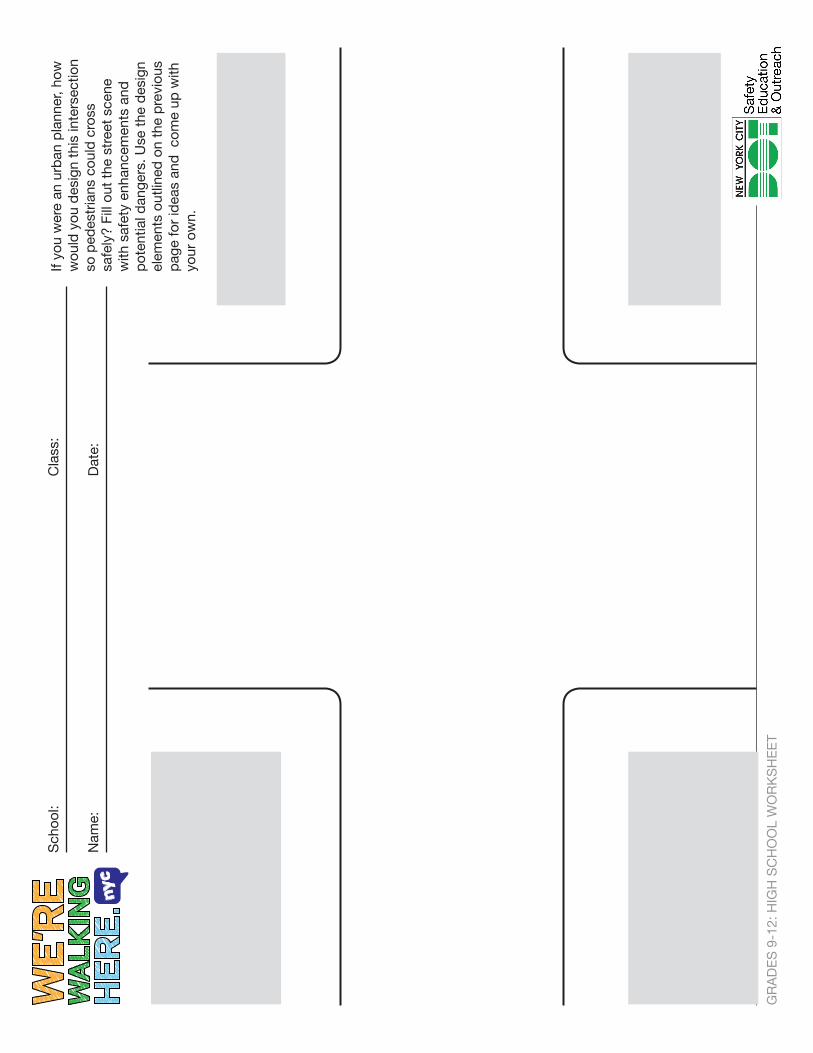
(6) Redesign your Street
For Cyclists (Are people on bikes able to get around easily and safely?)
Nam
e:
Sch
ool:
Dat
e:
Cla
ss:
GR
AD
ES
9-1
2: H
IGH
SC
HO
OL
WO
RK
SH
EE
T
If yo
u w
ere
an u
rban
pla
nner
, how
w
ould
you
des
ign
this
inte
rsec
tion
so p
edes
tria
ns c
ould
cro
ss
safe
ly?
Fill
out
the
stre
et s
cene
w
ith s
afet
y en
hanc
emen
ts a
nd
pot
entia
l dan
gers
. Use
the
des
ign
elem
ents
out
lined
on
the
pre
viou
s p
age
for
idea
s an
d c
ome
up w
ith
your
ow
n.
GRADES 9-12: HIGH SCHOOL WORKSHEET
Name:
School:
Date:
Class:
(7) Outline your letterUse this outline to plan your letter to an elected official.
TOPIC What subject will you write about?
PURPOSE What improvements you will ask for?
lETTER RECIPIENT Who will you write to? If you don’t know the official to contact, ask your teacher for suggestions.
Now write notes for yourself about what information you will include in your introduction, 2-3 body paragraphs, and conclusion:
INTRODUCTION
GRADES 9-12: HIGH SCHOOL WORKSHEET
BODy PARAGRAPH #1
BODy PARAGRAPH #2
BODy PARAGRAPH #3
CONClUSION
(7) Outline your letter (continued)
GRADES 9-12: HIGH SCHOOL WORKSHEET
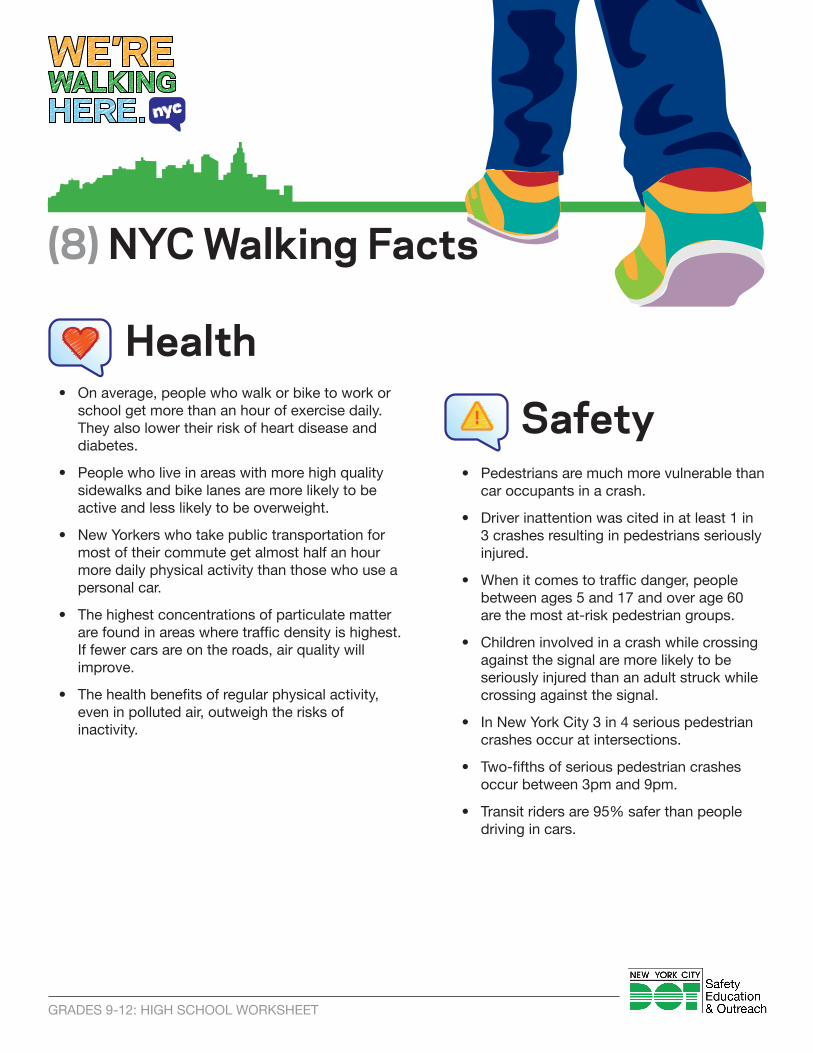
(8) NyC Walking facts
On average, people who walk or bike to work or • school get more than an hour of exercise daily. They also lower their risk of heart disease and diabetes.
People who live in areas with more high quality • sidewalks and bike lanes are more likely to be active and less likely to be overweight.
New Yorkers who take public transportation for • most of their commute get almost half an hour more daily physical activity than those who use a personal car.
The highest concentrations of particulate matter • are found in areas where traffic density is highest. If fewer cars are on the roads, air quality will improve.
The health benefits of regular physical activity, • even in polluted air, outweigh the risks of inactivity.
Health
Pedestrians are much more vulnerable than • car occupants in a crash.
Driver inattention was cited in at least 1 in • 3 crashes resulting in pedestrians seriously injured.
When it comes to traffic danger, people • between ages 5 and 17 and over age 60 are the most at-risk pedestrian groups.
Children involved in a crash while crossing • against the signal are more likely to be seriously injured than an adult struck while crossing against the signal.
In New York City 3 in 4 serious pedestrian • crashes occur at intersections.
Two-fifths of serious pedestrian crashes • occur between 3pm and 9pm.
Transit riders are 95% safer than people • driving in cars.
Safety
GRADES 9-12: HIGH SCHOOL WORKSHEET
(8) NyC Walking facts (continued)
Going GreenNew York is considered one of the • greenest cities in the country because so many people use walking, cycling, the subway, and buses to get around town.
Getting to work, only 23% of New Yorkers • drive; the rest take public transit, walk, or bike.
One in every four transit trips in the US is • made in New York.
New York is considered one of the • greenest cities in the country because so many people use walking, cycling, the subway, and buses to get around town.
Getting to work, only one in four New • Yorkers drive; the rest take public transit, walk, or bike.
One in every four transit trips in the US is • made in New York.
Transportation is the largest single source • of air pollution in the United States.
Walking produces NO pollution•
New York’s mass transit system moves • approximately 40% of all people traveling by motorized transportation on a typical weekday (excluding heavy trucks), while resulting in only 12% of transportation CO2 emissions, and 3% of overall CO2 emissions.
Without efforts to limit carbon emissions, • the United States could warm 7 to 11 degrees Fahrenheit by the end of the century. Cutting emissions could hold that increase to just 4 to 6.5 degrees Fahrenheit.