Embed Size (px)
Citation preview
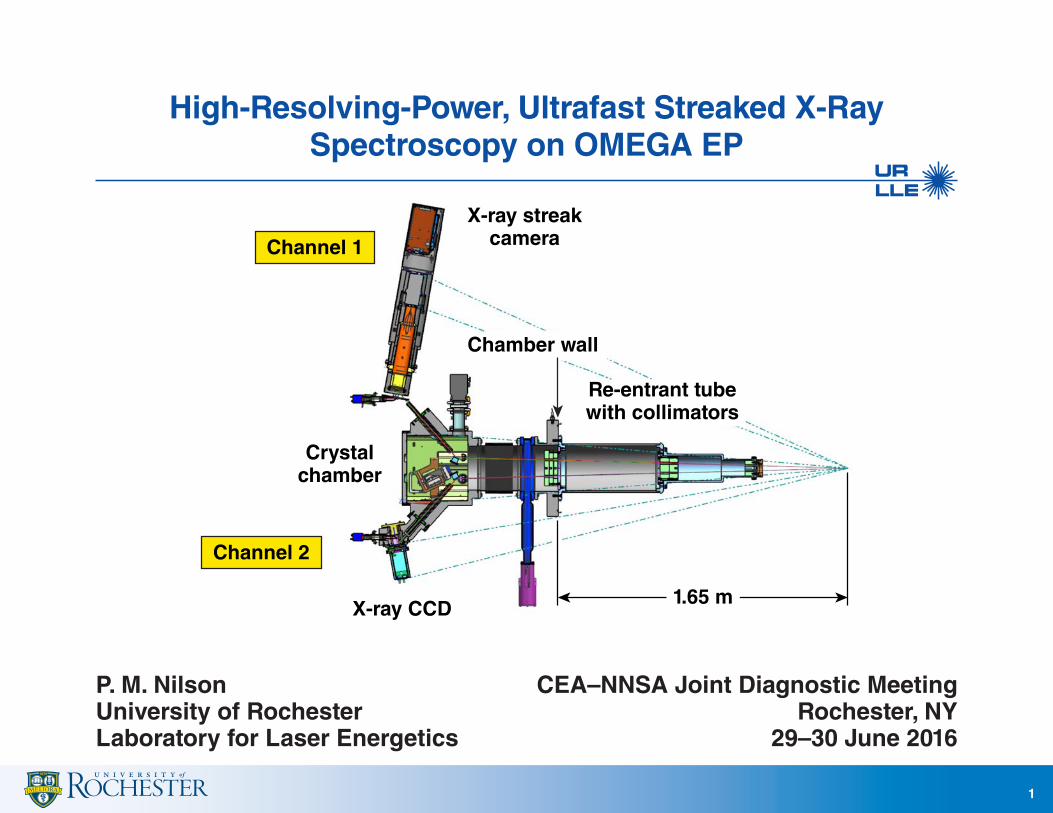
Channel 1
Crystalchamber
X-ray streakcamera
X-ray CCD
Channel 2
Re-entrant tubewith collimators
Chamber wall
1.65 m
P. M. NilsonUniversity of RochesterLaboratory for Laser Energetics
CEA–NNSA Joint Diagnostic MeetingRochester, NY
29–30 June 2016
High-Resolving-Power, Ultrafast Streaked X-Ray Spectroscopy on OMEGA EP
1
Summary
2
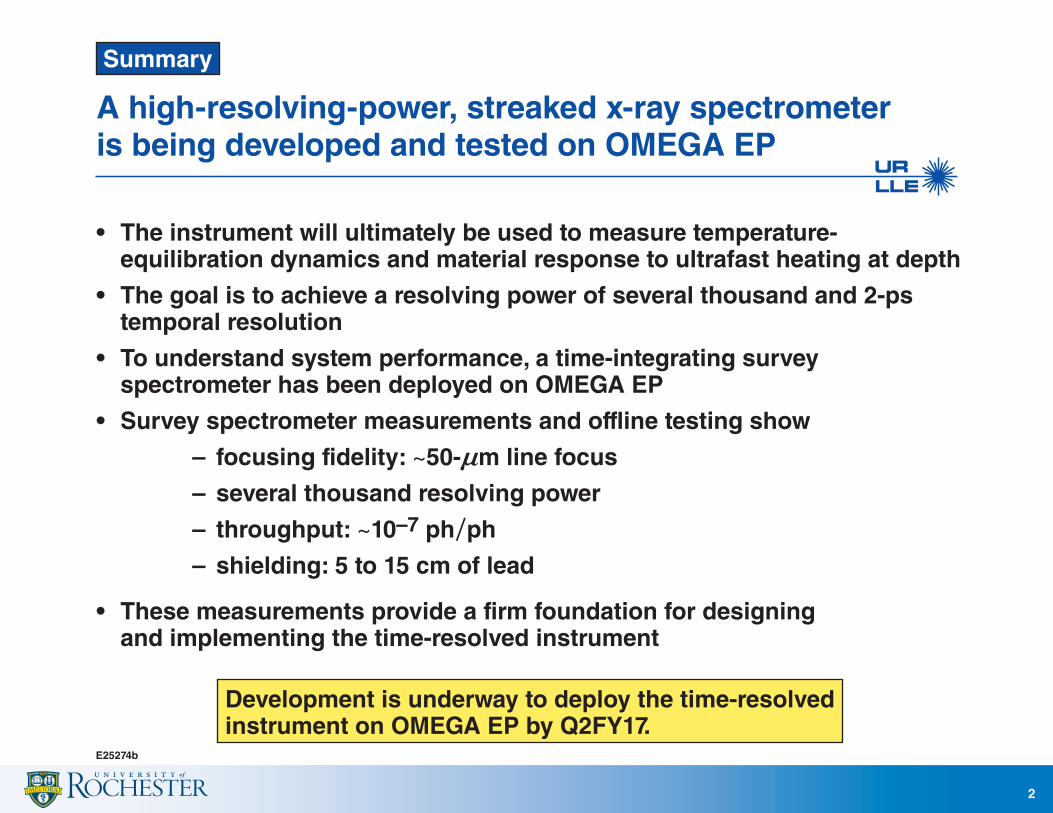
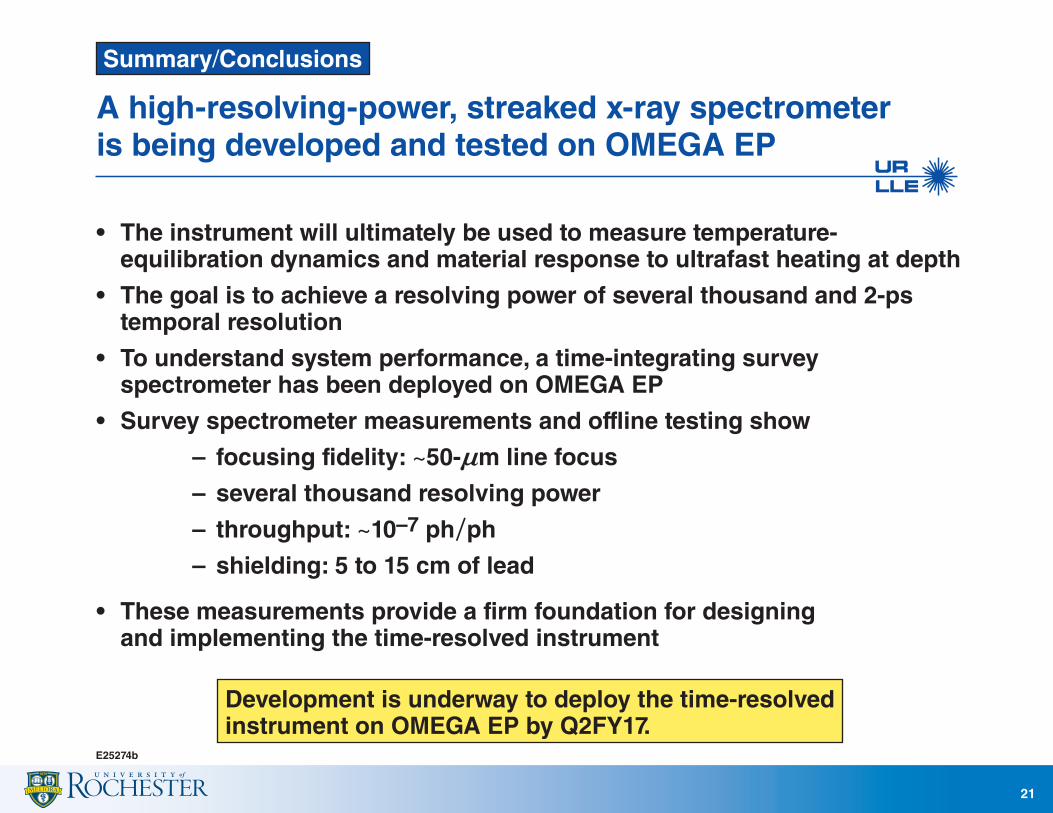
A high-resolving-power, streaked x-ray spectrometer is being developed and tested on OMEGA EP
• The instrument will ultimately be used to measure temperature-equilibration dynamics and material response to ultrafast heating at depth
• The goal is to achieve a resolving power of several thousand and 2-ps temporal resolution
• To understand system performance, a time-integrating survey spectrometer has been deployed on OMEGA EP
• Survey spectrometer measurements and offline testing show
– focusing fidelity: ~50-nm line focus
– several thousand resolving power
– throughput: ~10–7 ph/ph
– shielding: 5 to 15 cm of lead
• These measurements provide a firm foundation for designing and implementing the time-resolved instrument
E25274b
Development is underway to deploy the time-resolved instrument on OMEGA EP by Q2FY17.
Collaborators
3
F. Ehrne, C. Mileham, D. Mastrosimone, R. K. Jungquist, C. Taylor, R. Boni, J. Hassett, C. R. Stillman, S. T. Ivancic, D. J. Lonobile, R. W. Kidder, M. J. Shoup III, A. A. Solodov, C. Stoeckl, and D. H. Froula*
University of RochesterLaboratory for Laser Energetics
*also Department of Physics
K. M. Hill, L. Gao, M. Bitter, and P. Efthimion
Princeton Plasma Physics Laboratory
D. D. Meyerhofer
Los Alamos National Laboratory
Outline
E25089
• Motivation
– temperature-equilibration dynamics
– material response to ultrafast heating at depth
• Conceptual design
– high-resolution spectrometer (HiResSpec)
• Phase I
– time-integrating x-ray spectrometer
• Phase II
– time-resolved x-ray spectrometer
4
E21173h
Motivation
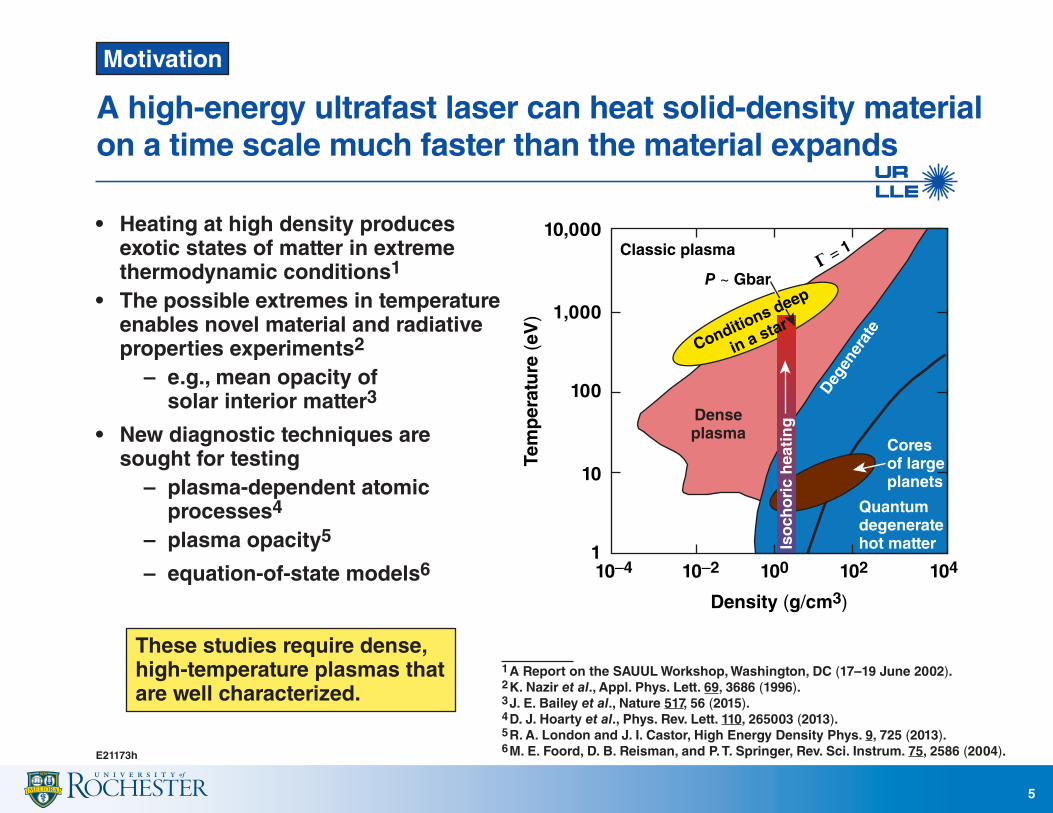
A high-energy ultrafast laser can heat solid-density material on a time scale much faster than the material expands
These studies require dense, high-temperature plasmas that are well characterized.
• Heating at high density produces exotic states of matter in extreme thermodynamic conditions1
• The possible extremes in temperature enables novel material and radiative properties experiments2
– e.g., mean opacity of solar interior matter3
• New diagnostic techniques are sought for testing
– plasma-dependent atomic processes4
– plasma opacity5
– equation-of-state models6
Classic plasma
Coresof largeplanets
Degen
erat
e
Quantumdegeneratehot matter
Denseplasma
10–41
10
100
1,000
10,000
10–2
Density (g/cm3)
Tem
per
atu
re (
eV)
100 102 104
C = 1
Iso
cho
ric
hea
tin
g
P ~ Gbar
Conditions deep
in a star
1 A Report on the SAUUL Workshop, Washington, DC (17–19 June 2002).2 K. Nazir et al., Appl. Phys. Lett. 69, 3686 (1996).3 J. E. Bailey et al., Nature 517, 56 (2015).4 D. J. Hoarty et al., Phys. Rev. Lett. 110, 265003 (2013). 5 R. A. London and J. I. Castor, High Energy Density Phys. 9, 725 (2013).6 M. E. Foord, D. B. Reisman, and P. T. Springer, Rev. Sci. Instrum. 75, 2586 (2004).
5
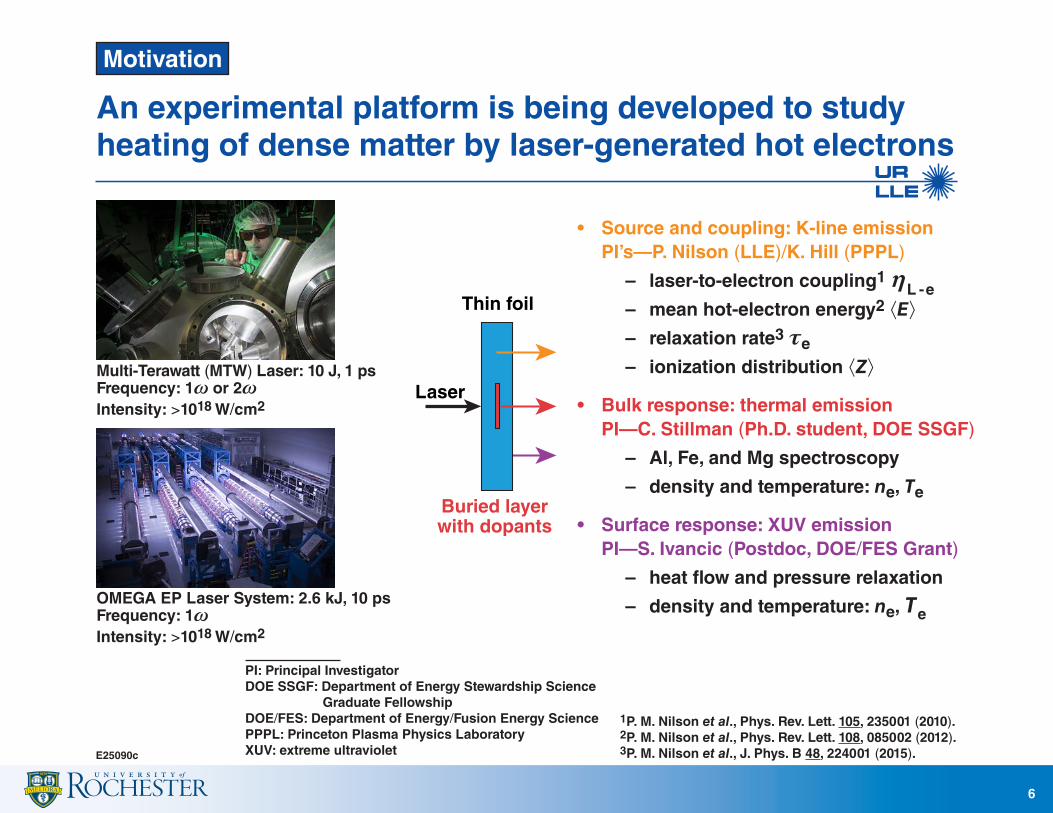
An experimental platform is being developed to study heating of dense matter by laser-generated hot electrons
E25090c
6
Motivation
• Source and coupling: K-line emission PI’s—P. Nilson (LLE)/K. Hill (PPPL)
– laser-to-electron coupling1 L eh -– mean hot-electron energy2 GEH– relaxation rate3 xe
– ionization distribution GZH
• Bulk response: thermal emission PI—C. Stillman (Ph.D. student, DOE SSGF)
– Al, Fe, and Mg spectroscopy
– density and temperature: ne, Te
• Surface response: XUV emission PI—S. Ivancic (Postdoc, DOE/FES Grant)
– heat flow and pressure relaxation
– density and temperature: ne, Te
Multi-Terawatt (MTW) Laser: 10 J, 1 psFrequency: 1~ or 2~Intensity: >1018 W/cm2
OMEGA EP Laser System: 2.6 kJ, 10 psFrequency: 1~Intensity: >1018 W/cm2
PI: Principal InvestigatorDOE SSGF: Department of Energy Stewardship Science Graduate FellowshipDOE/FES: Department of Energy/Fusion Energy SciencePPPL: Princeton Plasma Physics LaboratoryXUV: extreme ultraviolet
1P. M. Nilson et al., Phys. Rev. Lett. 105, 235001 (2010).2P. M. Nilson et al., Phys. Rev. Lett. 108, 085002 (2012). 3P. M. Nilson et al., J. Phys. B 48, 224001 (2015).
Thin foil
Laser
Buried layerwith dopants
E18508c
7
Motivation
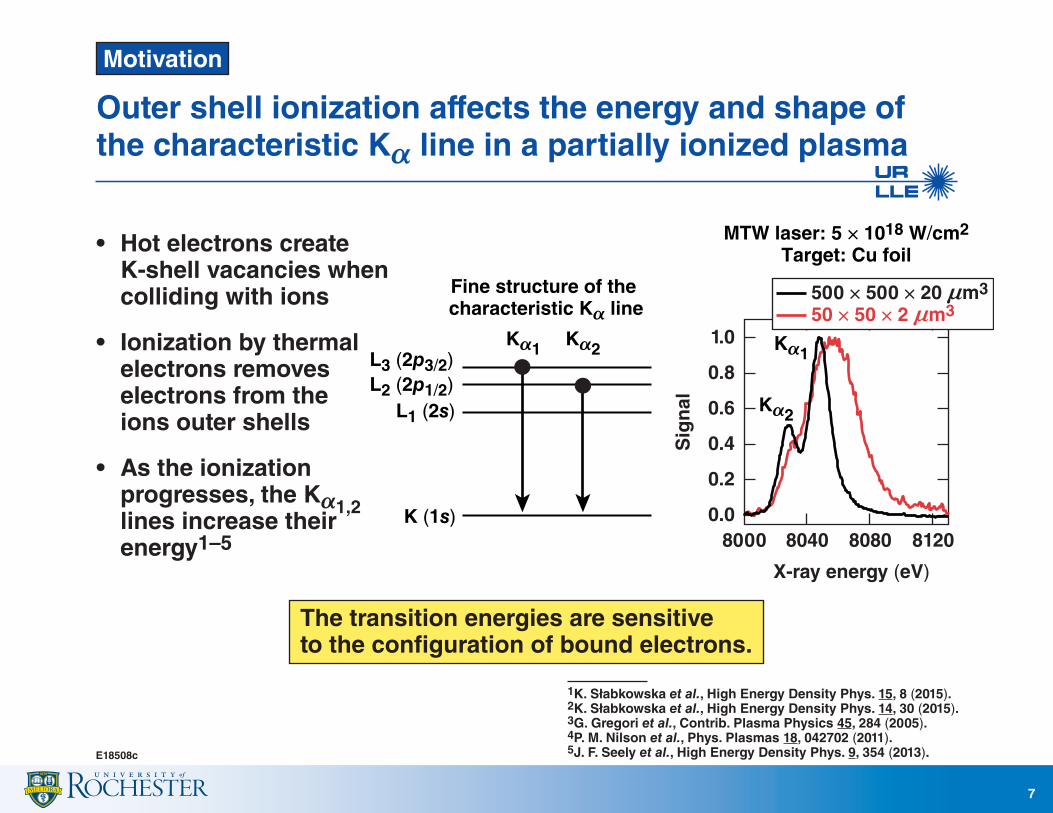
Outer shell ionization affects the energy and shape of the characteristic Ka line in a partially ionized plasma
• Hot electrons create K-shell vacancies when colliding with ions
• Ionization by thermal electrons removes electrons from the ions outer shells
• As the ionization progresses, the Ka1,2 lines increase their energy1–5
1K. Słabkowska et al., High Energy Density Phys. 15, 8 (2015).2K. Słabkowska et al., High Energy Density Phys. 14, 30 (2015).3G. Gregori et al., Contrib. Plasma Physics 45, 284 (2005).4P. M. Nilson et al., Phys. Plasmas 18, 042702 (2011).5J. F. Seely et al., High Energy Density Phys. 9, 354 (2013).
The transition energies are sensitive to the configuration of bound electrons.
K (1s)
L1 (2s)L2 (2p1/2)L3 (2p3/2)
Fine structure of the characteristic Ka line
Ka1Ka1 Ka2
Ka2
1.0
0.8
0.6
Sig
nal
X-ray energy (eV)
0.4
0.2
0.08000 8040 8080 8120
500 × 500 × 20 nm3
50 × 50 × 2 nm3
MTW laser: 5 × 10¹⁸ W/cm2
Target: Cu foil
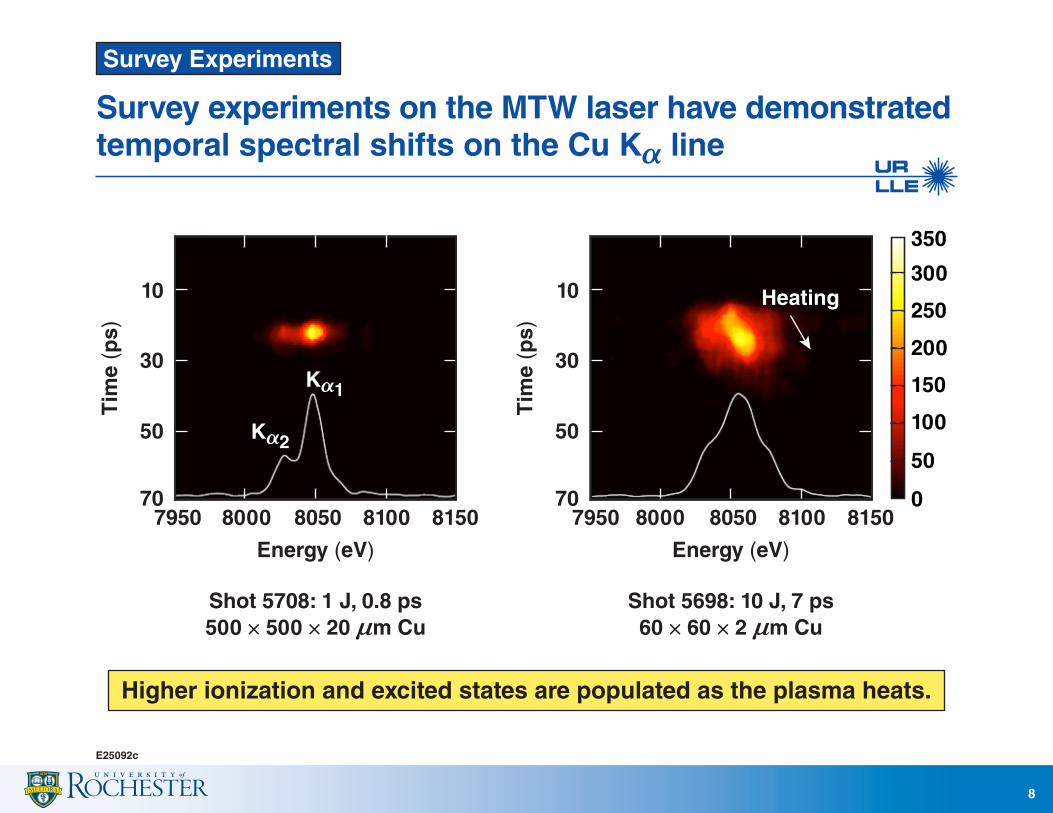
Survey experiments on the MTW laser have demonstrated temporal spectral shifts on the Cu Ka line
Survey Experiments
E25092c
8
Higher ionization and excited states are populated as the plasma heats.
Ka1
Heating
Ka2
350
300
250
200
150
100
50
07950
70
50
30
10
8000 8050
Energy (eV)
Shot 5708: 1 J, 0.8 ps500 × 500 × 20 nm Cu
Tim
e (p
s)
8100 8150 795070
50
30
10
8000 8050
Energy (eV)
Shot 5698: 10 J, 7 ps60 × 60 × 2 nm Cu
Tim
e (p
s)8100 8150
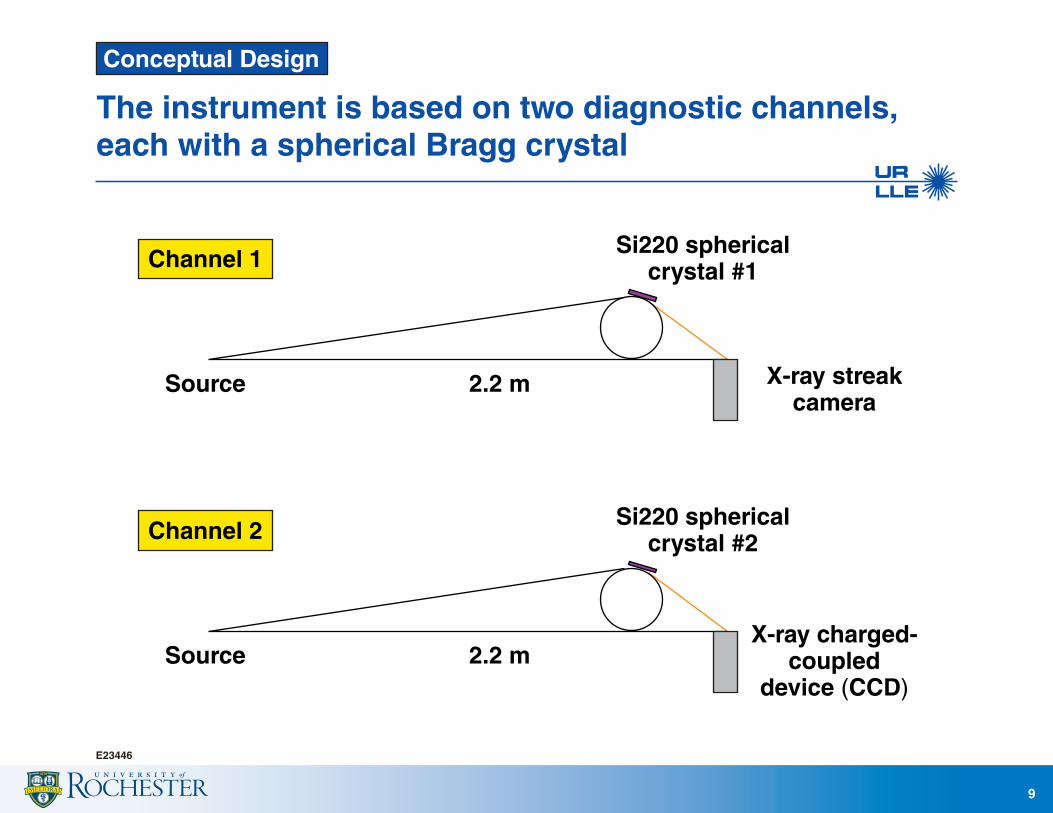
The instrument is based on two diagnostic channels, each with a spherical Bragg crystal
E23446
Conceptual Design
Channel 1
Source 2.2 m
Si220 sphericalcrystal #1
X-ray streakcamera
Channel 2
Source 2.2 m
Si220 sphericalcrystal #2
X-ray charged-coupled
device (CCD)
9
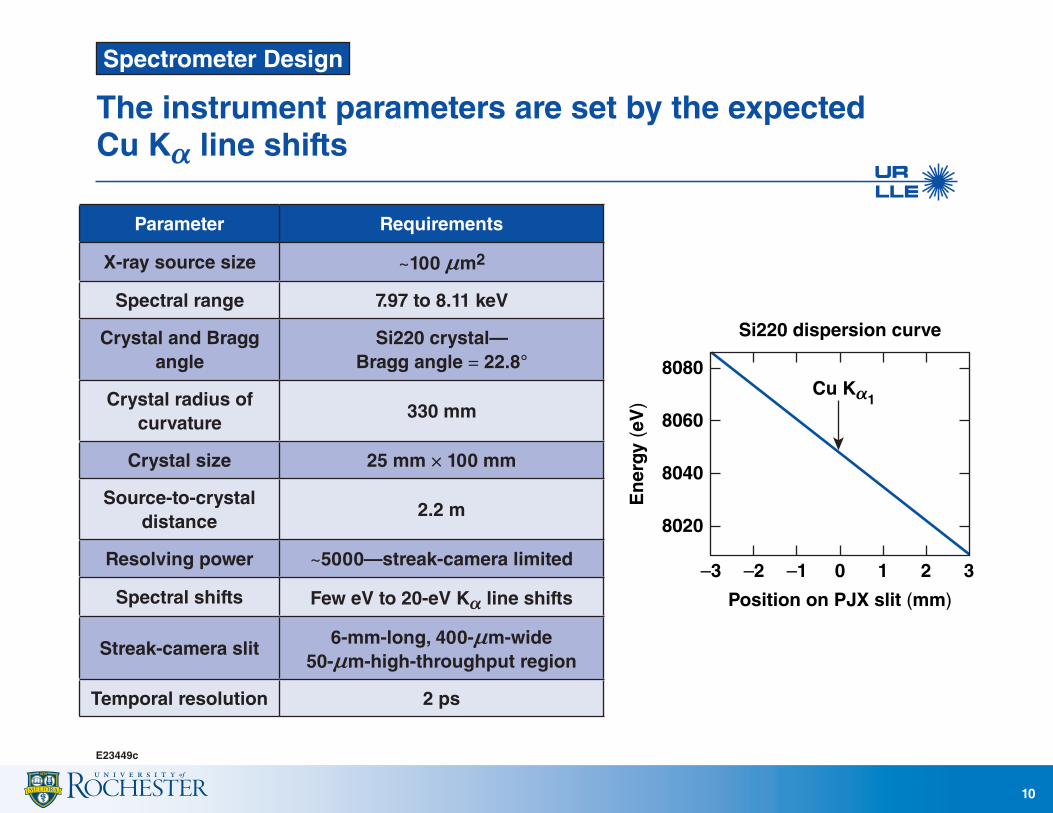
The instrument parameters are set by the expected Cu Ka line shifts
E23449c
Spectrometer Design
10
Parameter Requirements
X-ray source size ~100 nm2
Spectral range 7.97 to 8.11 keV
Crystal and Bragg angle
Si220 crystal— Bragg angle = 22.8°
Crystal radius of curvature
330 mm
Crystal size 25 mm × 100 mm
Source-to-crystal distance
2.2 m
Resolving power ~5000—streak-camera limited
Spectral shifts Few eV to 20-eV Ka line shifts
Streak-camera slit 6-mm-long, 400-nm-wide50-nm-high-throughput region
Temporal resolution 2 ps
–3 –2 –1 0
8040
8020
8060
8080Cu Ka
Si220 dispersion curve
Position on PJX slit (mm)
En
ergy
(eV
)
1 2 3
1
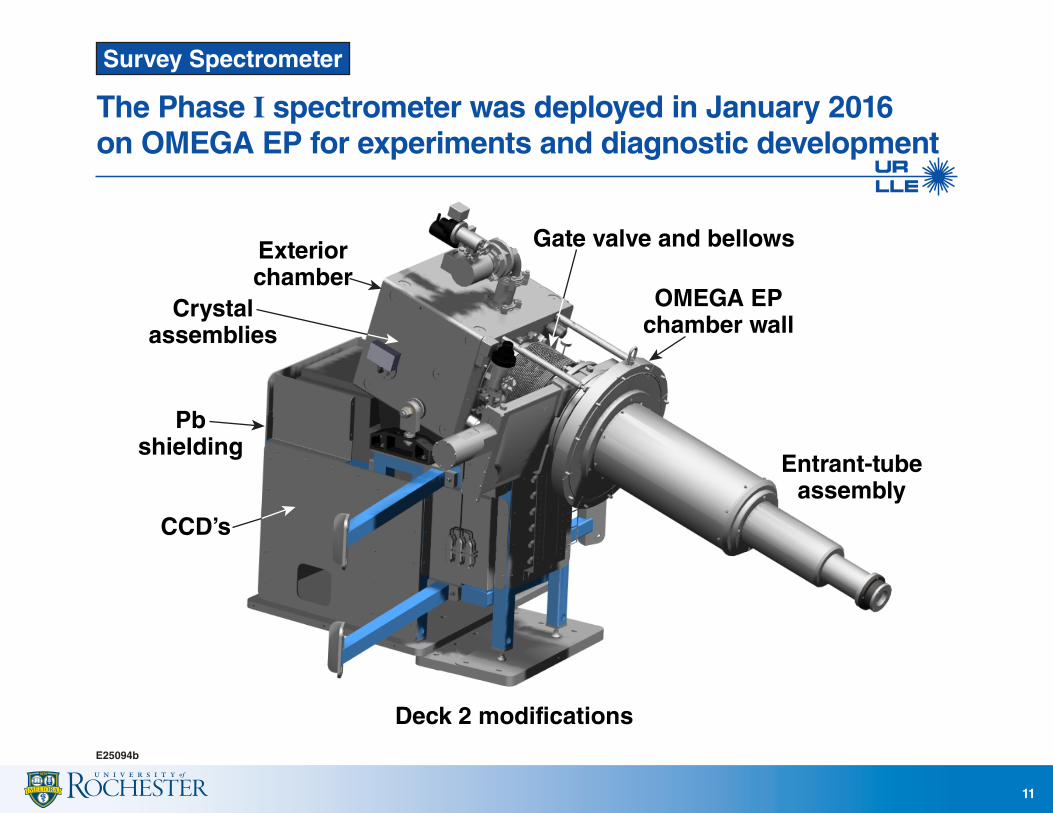
Exteriorchamber
Gate valve and bellows
OMEGA EPchamber wall
Entrant-tubeassembly
Deck 2 modifications
Crystalassemblies
Pbshielding
CCD’s
The Phase I spectrometer was deployed in January 2016 on OMEGA EP for experiments and diagnostic development
Survey Spectrometer
E25094b
11
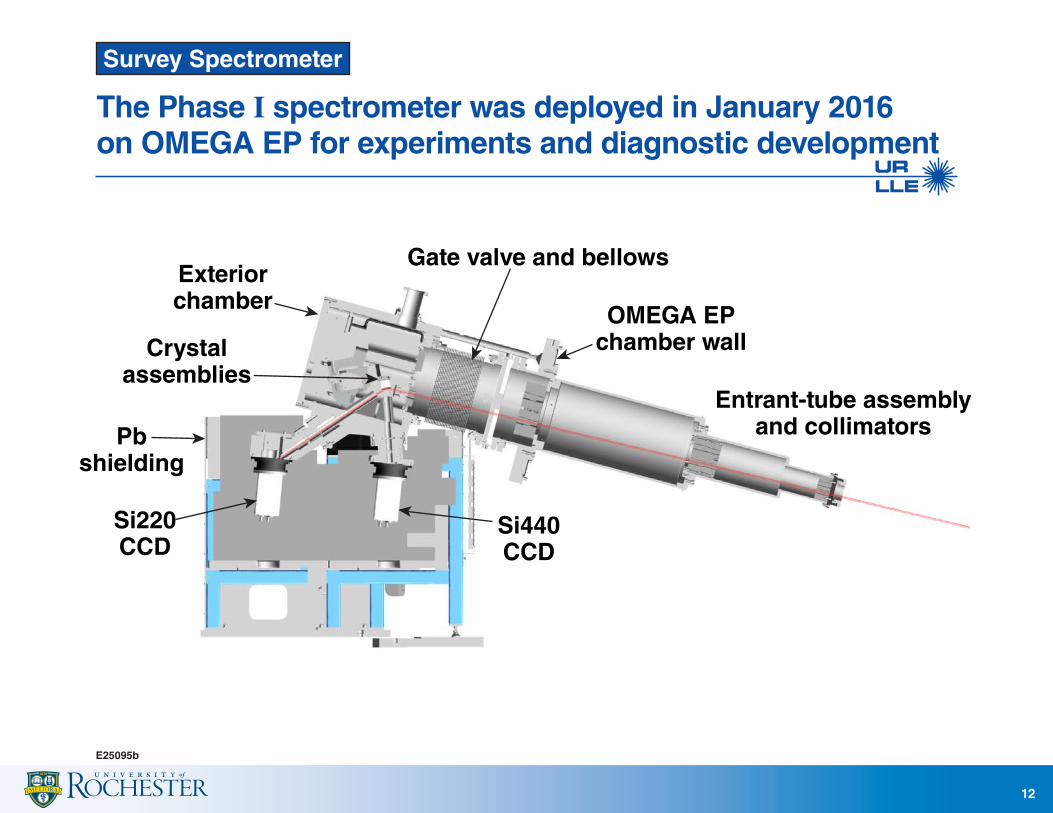
The Phase I spectrometer was deployed in January 2016 on OMEGA EP for experiments and diagnostic development
Survey Spectrometer
E25095b
12
Exteriorchamber
Gate valve and bellows
OMEGA EPchamber wall
Entrant-tube assemblyand collimators
Si440CCD
Crystalassemblies
Pbshielding
Si220CCD
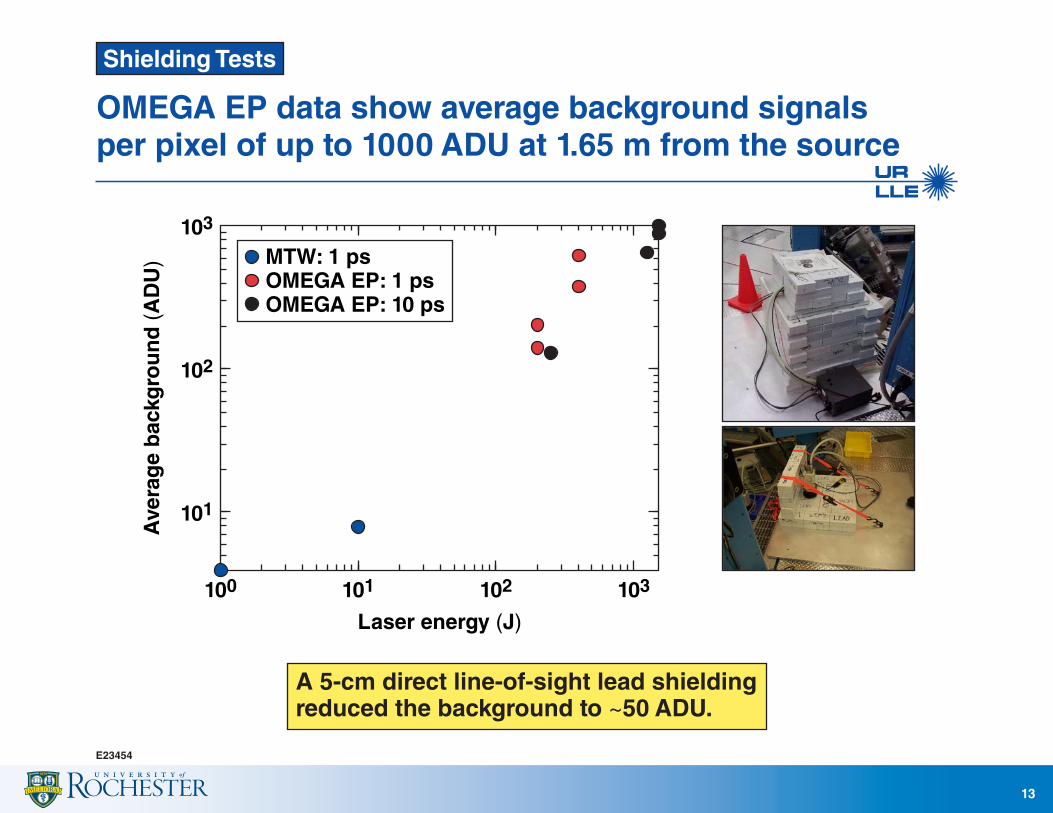
OMEGA EP data show average background signals per pixel of up to 1000 ADU at 1.65 m from the source
E23454
Shielding Tests
A 5-cm direct line-of-sight lead shielding reduced the background to ~50 ADU.
100 101
101
Laser energy (J)
Ave
rag
e b
ackg
rou
nd
(A
DU
)
102
102
103
103
MTW: 1 psOMEGA EP: 1 psOMEGA EP: 10 ps
13
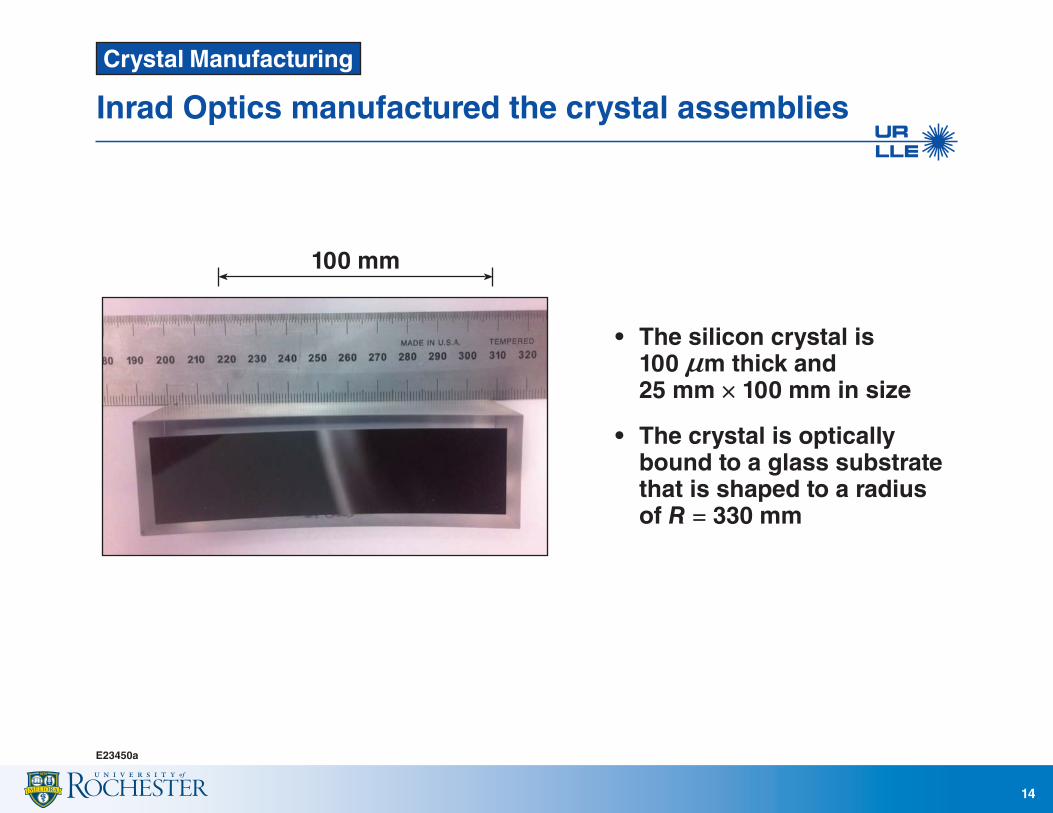
Inrad Optics manufactured the crystal assemblies
E23450a
• The silicon crystal is 100 nm thick and
25 mm × 100 mm in size
• The crystal is optically bound to a glass substrate that is shaped to a radius of R = 330 mm
Crystal Manufacturing
14
100 mm
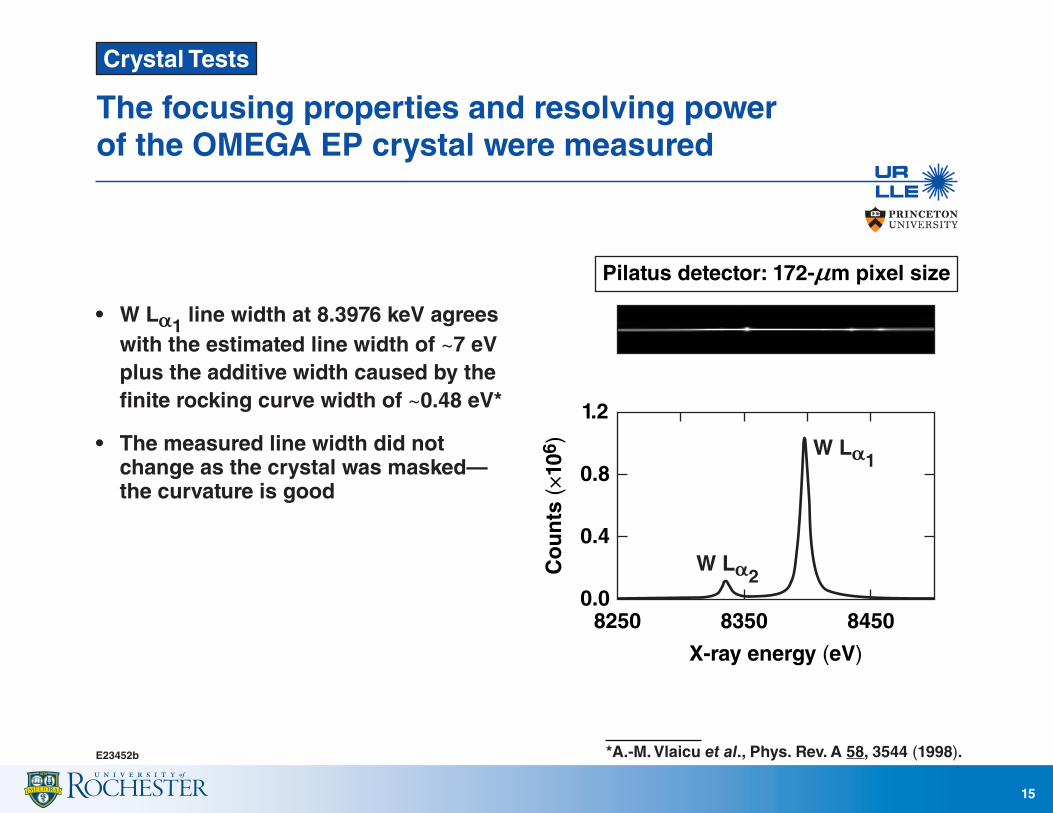
The focusing properties and resolving power of the OMEGA EP crystal were measured
E23452b
• W La1 line width at 8.3976 keV agrees with the estimated line width of ~7 eV
plus the additive width caused by the finite rocking curve width of ~0.48 eV*
• The measured line width did not change as the crystal was masked—
the curvature is good
Crystal Tests
8250 8350
X-ray energy (eV)
Pilatus detector: 172-nm pixel size
Co
un
ts (
×10
6 )
0.0
0.4
0.8
1.2
8450
*A.-M. Vlaicu et al., Phys. Rev. A 58, 3544 (1998).
15
W La1
W La2
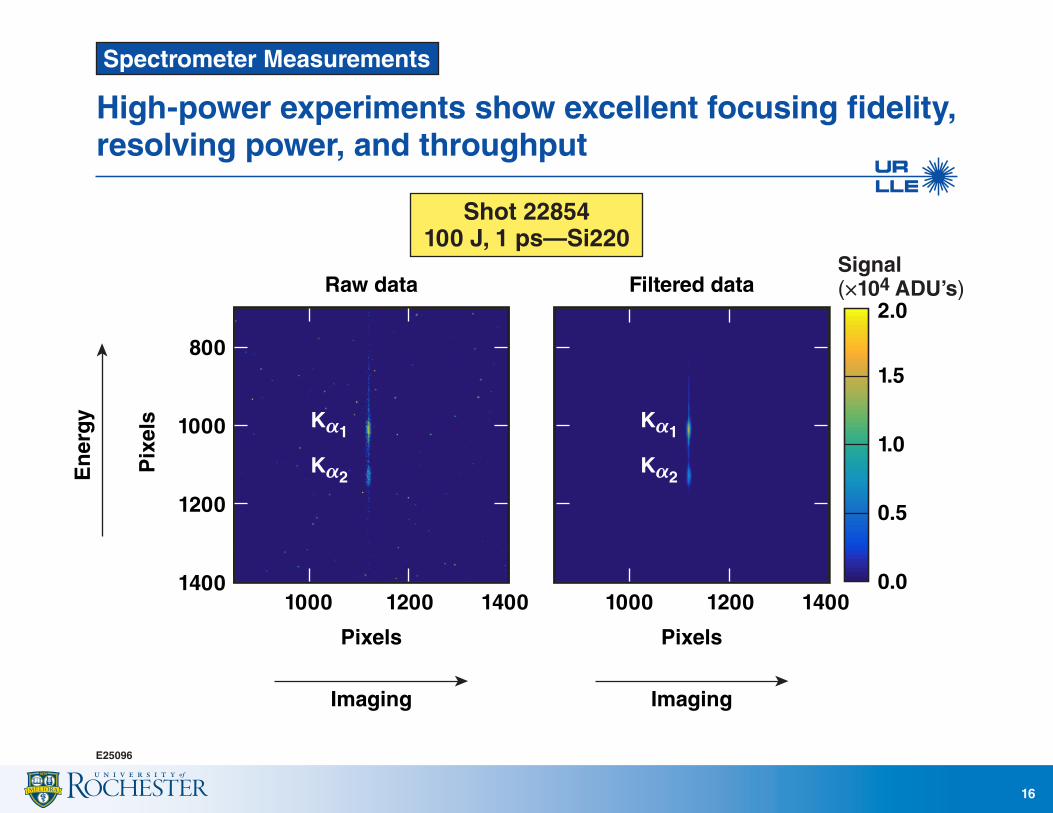
High-power experiments show excellent focusing fidelity, resolving power, and throughput
Spectrometer Measurements
E25096
16
Shot 22854100 J, 1 ps—Si220
1000
Raw data Filtered data
1400
1200
1000
800
Ka1
Ka2
Ka1
Ka2
1200
Pixels
Imaging
Pix
els
En
ergy
Pixels
1400 1000 12000.0
0.5
1.0
1.5
2.0
Signal(×104 ADU’s)
1400
Imaging
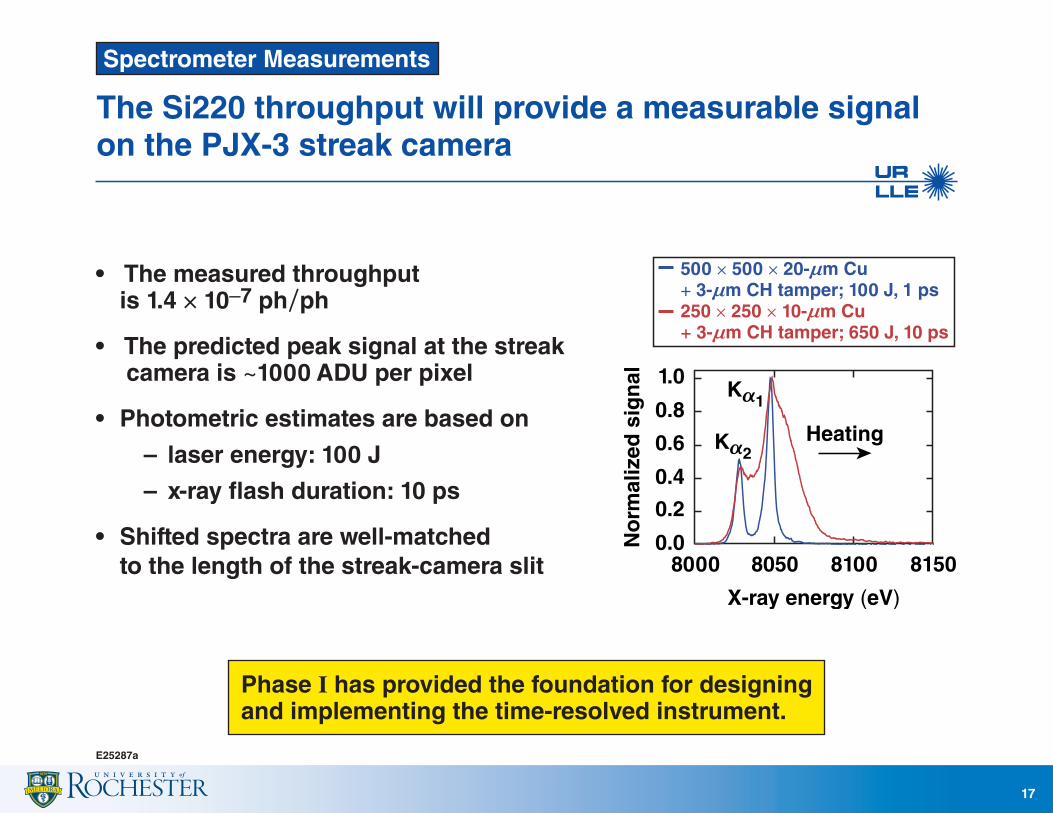
The Si220 throughput will provide a measurable signal on the PJX-3 streak camera
E25287a
17
Spectrometer Measurements
• The measured throughput is 1.4 × 10⁻⁷ ph/ph
• The predicted peak signal at the streak camera is ~1000 ADU per pixel
• Photometric estimates are based on
– laser energy: 100 J
– x-ray flash duration: 10 ps
• Shifted spectra are well-matched to the length of the streak-camera slit
Phase I has provided the foundation for designing and implementing the time-resolved instrument.
X-ray energy (eV)
8000 8050 8100 8150
1.0
0.8
0.6
0.4
0.2
0.0No
rmal
ized
sig
nal
500 # 500 # 20-nm Cu+ 3-nm CH tamper; 100 J, 1 ps 250 # 250 # 10-nm Cu+ 3-nm CH tamper; 650 J, 10 ps
Ka1
Ka2Heating
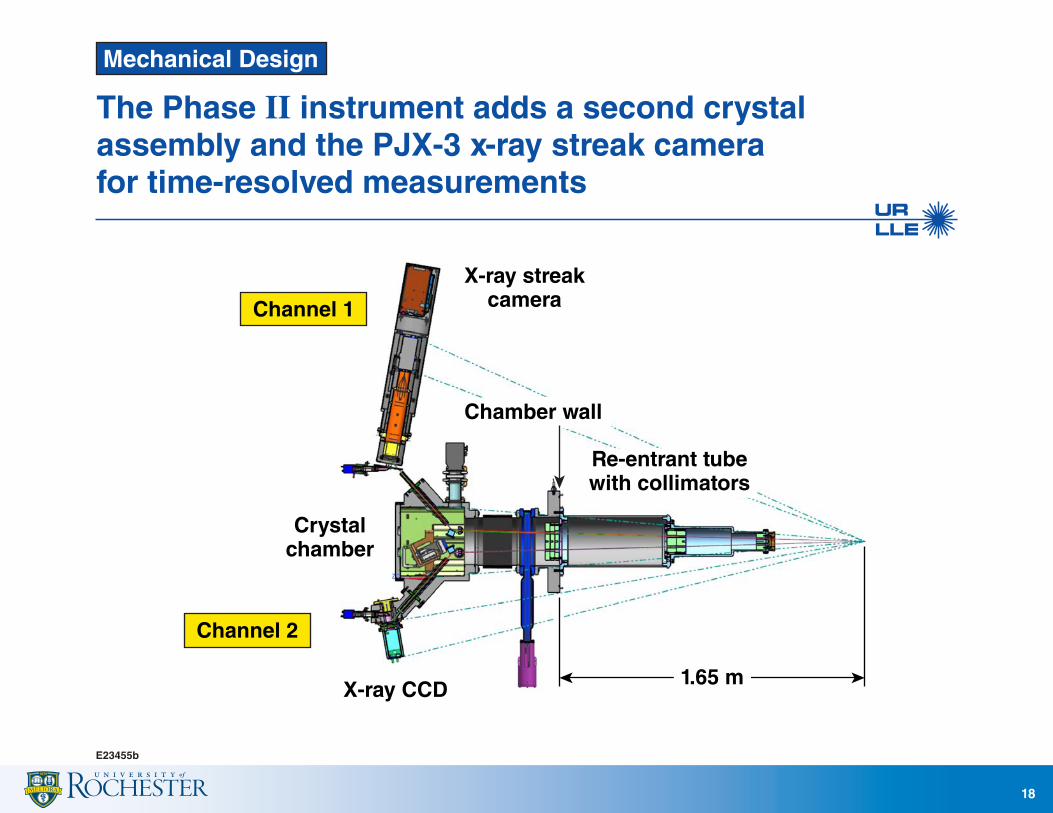
The Phase II instrument adds a second crystal assembly and the PJX-3 x-ray streak camera for time-resolved measurements
E23455b
18
Mechanical Design
Channel 1
Crystalchamber
X-ray streakcamera
X-ray CCD
Channel 2
Re-entrant tubewith collimators
Chamber wall
1.65 m
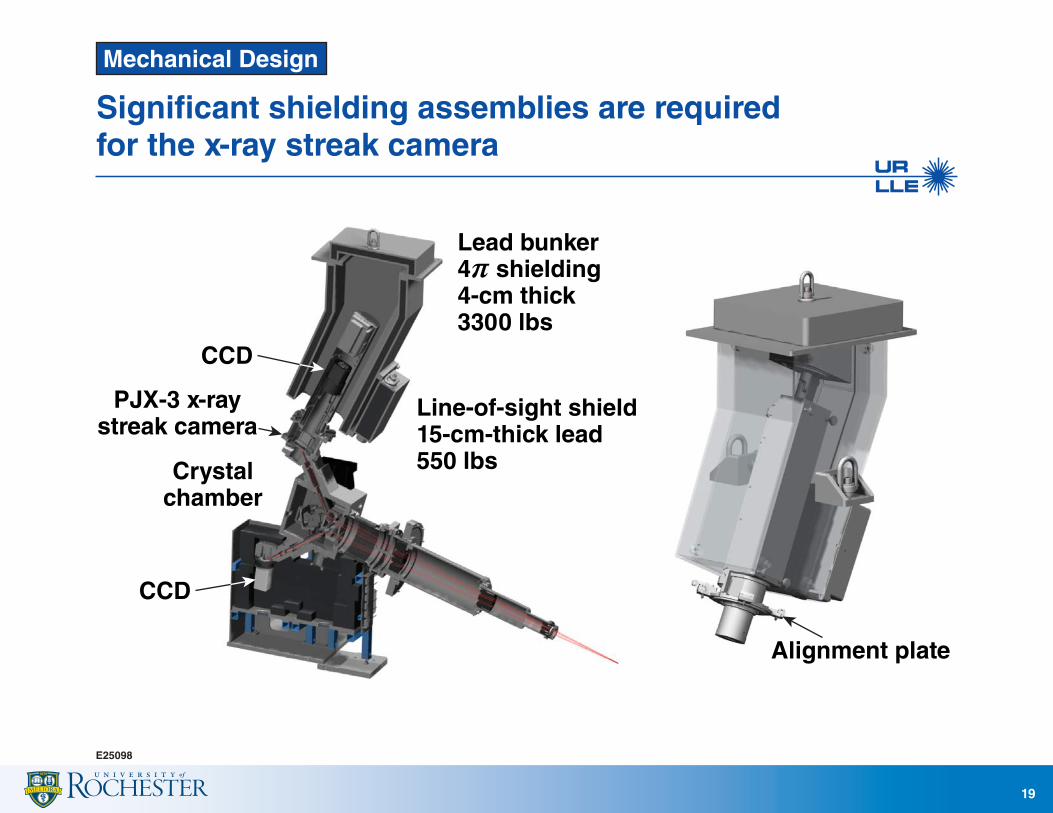
Significant shielding assemblies are required for the x-ray streak camera
E25098
19
Mechanical Design
CCD
CCD
Lead bunker4r shielding4-cm thick3300 lbs
Line-of-sight shield15-cm-thick lead550 lbs
Alignment plate
PJX-3 x-raystreak camera
Crystalchamber
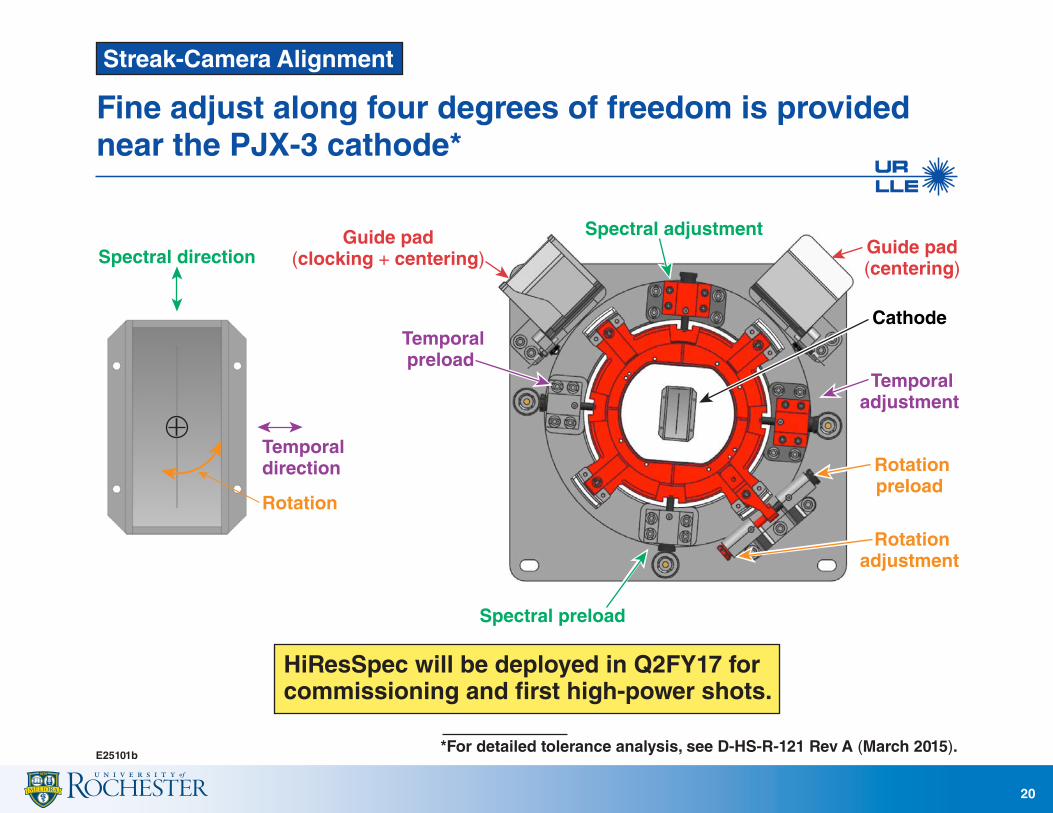
Fine adjust along four degrees of freedom is provided near the PJX-3 cathode*
E25101b
20
Streak-Camera Alignment
*For detailed tolerance analysis, see D-HS-R-121 Rev A (March 2015).
Temporaladjustment
Spectral adjustment
Spectral preload
Rotationpreload
Rotationadjustment
Cathode
Guide pad(clocking + centering)
Guide pad(centering)
Spectral direction
Temporaldirection
Rotation
Temporalpreload
HiResSpec will be deployed in Q2FY17 for commissioning and first high-power shots.
Summary/Conclusions
21
A high-resolving-power, streaked x-ray spectrometer is being developed and tested on OMEGA EP
• The instrument will ultimately be used to measure temperature-equilibration dynamics and material response to ultrafast heating at depth
• The goal is to achieve a resolving power of several thousand and 2-ps temporal resolution
• To understand system performance, a time-integrating survey spectrometer has been deployed on OMEGA EP
• Survey spectrometer measurements and offline testing show
– focusing fidelity: ~50-nm line focus
– several thousand resolving power
– throughput: ~10–7 ph/ph
– shielding: 5 to 15 cm of lead
• These measurements provide a firm foundation for designing and implementing the time-resolved instrument
E25274b
Development is underway to deploy the time-resolved instrument on OMEGA EP by Q2FY17.
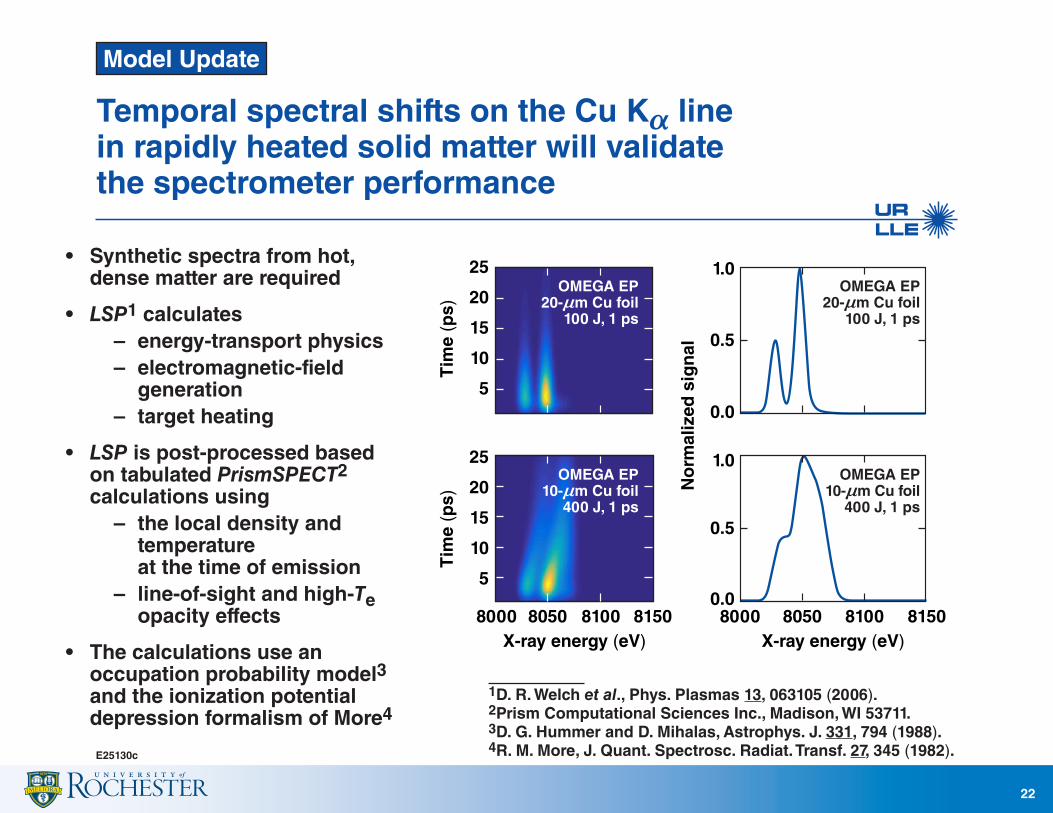
Temporal spectral shifts on the Cu Ka line in rapidly heated solid matter will validate the spectrometer performance
E25130c
• Synthetic spectra from hot, dense matter are required
• LSP1 calculates– energy-transport physics– electromagnetic-field
generation– target heating
• LSP is post-processed based on tabulated PrismSPECT2 calculations using
– the local density and temperature at the time of emission
– line-of-sight and high-Te opacity effects
• The calculations use an occupation probability model3 and the ionization potential depression formalism of More4
22
8000
5
10
15
20
25
8050X-ray energy (eV)
Tim
e (p
s)
5
10
15
20
25
Tim
e (p
s)
0.0
0.0
0.5
1.0
No
rmal
ized
sig
nal
8100 8150 8000 8050X-ray energy (eV)
8100 8150
OMEGA EP20-nm Cu foil
100 J, 1 ps
OMEGA EP20-nm Cu foil
100 J, 1 ps
OMEGA EP10-nm Cu foil
400 J, 1 ps
OMEGA EP10-nm Cu foil
400 J, 1 ps0.5
1.0
Model Update
1D. R. Welch et al., Phys. Plasmas 13, 063105 (2006).2Prism Computational Sciences Inc., Madison, WI 53711.3D. G. Hummer and D. Mihalas, Astrophys. J. 331, 794 (1988). 4R. M. More, J. Quant. Spectrosc. Radiat. Transf. 27, 345 (1982).
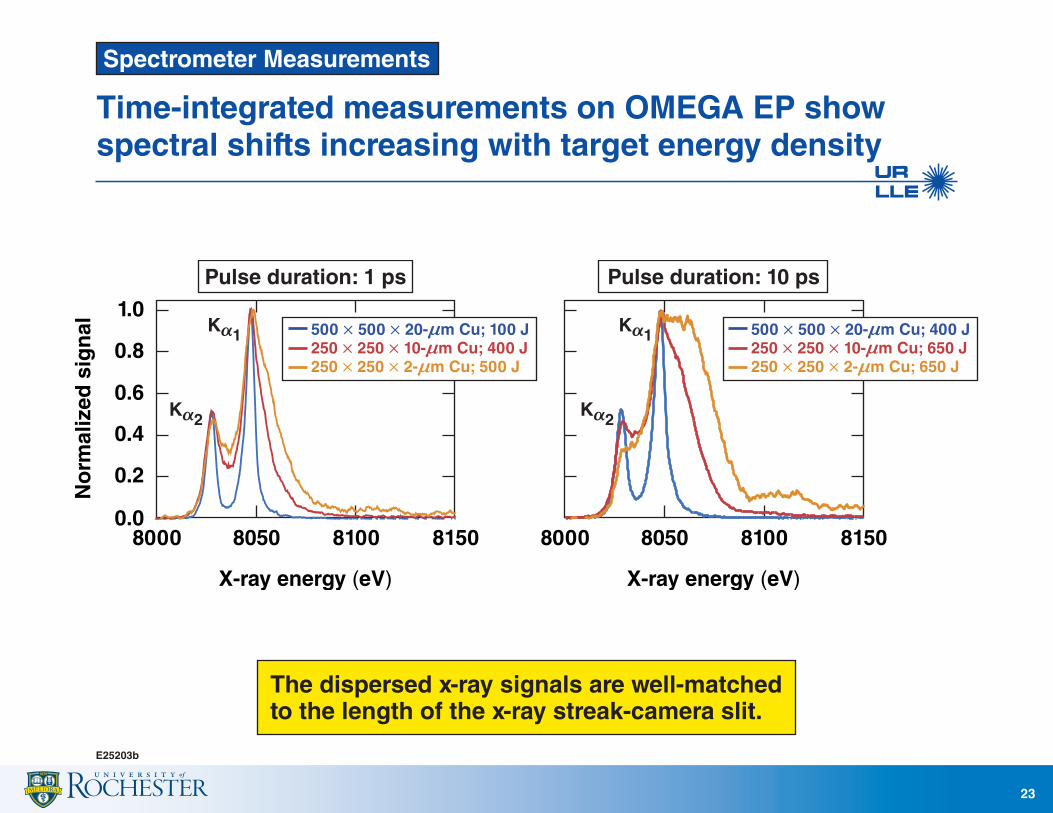
Time-integrated measurements on OMEGA EP show spectral shifts increasing with target energy density
E25203b
23
Spectrometer Measurements
The dispersed x-ray signals are well-matched to the length of the x-ray streak-camera slit.
X-ray energy (eV)
8000 8050 8100 8150
Pulse duration: 10 ps
X-ray energy (eV)
8000 8050 8100 8150
1.0
0.8
0.6
0.4
0.2
0.0
No
rmal
ized
sig
nal 500 # 500 # 20-nm Cu; 100 J
250 # 250 # 10-nm Cu; 400 J250 # 250 # 2-nm Cu; 500 J
500 # 500 # 20-nm Cu; 400 J250 # 250 # 10-nm Cu; 650 J250 # 250 # 2-nm Cu; 650 J
Pulse duration: 1 ps
Ka2
Ka1
Ka2
Ka1