Embed Size (px)
Citation preview

High-resolution P- and S-wave reflection to detect a shallow gas sand in southeast Kansas Deidra K. Begay,* Richard D. Miller, W. Lynn Watney, and Jianghai Xia, Kansas Geological Survey Introduction Shallow seismic reflection techniques have proven effective at imaging shallow and relatively small targets in a variety of geologic settings (Pullan and Hunter, 1990; Jongerius and Hel-big, 1988; Miller et al., 1989; Miller et al., 1995; Shtivelman et al., 1998). Laterally extensive zones of shallow gas have been easy targets to detect but a hindrance to many shallow high-resolution seismic reflection surveys (Pullan et al., 1998). High amplitude reflections associated with the boundary between gas-bearing zones (sands) and cap rocks (shale) are routinely referred to as “bright spots” (Khattri et al., 1979). Offset dependent reflection amplitude (Amplitude Versus Offset [AVO]) characteristics for gas rich sediments can vary significantly with geologic setting, gas concentrations, and lithology (Ostrander, 1982). Three unique types of reservoirs or classes of gas deposits have been described that incorporate geology setting and lithology with seismic attributes (Ruther-ford and Williams, 1989). Lithologically, the encasing med-ium or mechanism and reservoir rock distinguish these classes while seismically, a distinct impedance range aids in classify-ing each type of gas sand. High impedance contacts between encasement and sand, termed class 1, are mature sand that have been exposed to moderate to high compaction (Rutherford and Williams, 1989). Seismically, reflection amplitudes decrease with offset and may result in a polarity reversal if sufficient offsets are recorded. As a result, on stacked sections amplitude dimming, termed “dim outs,” is apparent due to the cancellation of amplitudes caused by the polarity reversal. At first glance, logs and continuous core samples from the site studied here suggest a geologic setting consistent with a class 1 sand reservoir. Class 2 sand reservoirs possess near-zero impedance contrast between the sand and encasing materials and are moderately compacted sands (Rutherford and Williams, 1989). This type of gas sand has very low amplitude reflections at near offsets and significantly higher amplitude reflections at far offsets. This offset-dependent seismic response is opposite from a “normal” seismic response, therefore processing flows designed for average earth materials are rarely effective in detecting the unique characteristics of class 2 gas reservoirs. The third class of gas sands has a lower impedance than the encasing medium and is usually unconsolidated (Rutherford and Williams, 1989). Seismically, reflections appear at all off-set ranges and without polarity changes. In some cases, deeper layers are not imaged due to limited or no transmission of
energy through the base of the confining layer (Pullan et al., 1998). High-resolution seismic reflection data collected over a cyclic sequence of limestones, shales, and sandstone provided an unusual opportunity to observe the effects of gas trapped in a shallow consolidated sand with a gradational boundary. Given that the logs and core samples at this site support a class 1 sand reservoir classification, “dim outs” should be observed on CMP stacked sections. However, the seismic P-wave data possess high amplitude reflections, “bright spots,” on CMP stacked data opposite what is expected. Reflections on S-wave shot gathers do not appear to exhibit the amplitude anomaly associated with the gas sand. These high amplitude reflections on the P-wave CMP stacked section have been confirmed by drilling to correlate it with a shallow gas zone within a con-solidated sandstone, shale, and limestone sequence. Geology This north-south seismic section was acquired along the Chautauqua-Montgomery County line in SE Kansas (Figure 1). A 300 m continuous core (KGS #1 Pitts) originating at the surface and penetrating through Missourian Pennsylvanian strata was taken near the center of this 1.2 km seismic profile. Wireline logs were used to correlate and calibrate lithologies to nearby wells and the outcrops of these strata located within 60 km to the east of the corehole.
Figure 1. Site map of seismic section along the Chautauqua- Montgomery county line in southeastern Kansas.
SEG 2000 Expanded Abstracts Main MenuSEG 2000 Expanded Abstracts Main Menu
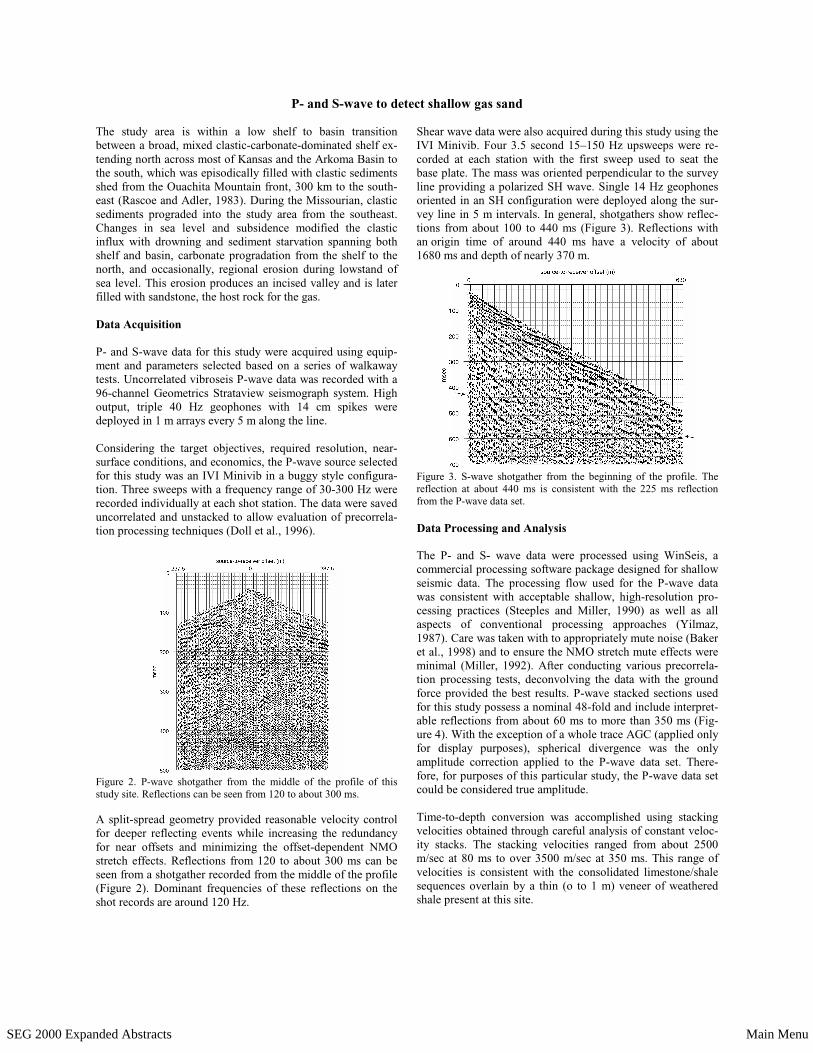
P- and S-wave to detect shallow gas sand The study area is within a low shelf to basin transition between a broad, mixed clastic-carbonate-dominated shelf ex-tending north across most of Kansas and the Arkoma Basin to the south, which was episodically filled with clastic sediments shed from the Ouachita Mountain front, 300 km to the south-east (Rascoe and Adler, 1983). During the Missourian, clastic sediments prograded into the study area from the southeast. Changes in sea level and subsidence modified the clastic influx with drowning and sediment starvation spanning both shelf and basin, carbonate progradation from the shelf to the north, and occasionally, regional erosion during lowstand of sea level. This erosion produces an incised valley and is later filled with sandstone, the host rock for the gas. Data Acquisition P- and S-wave data for this study were acquired using equip-ment and parameters selected based on a series of walkaway tests. Uncorrelated vibroseis P-wave data was recorded with a 96-channel Geometrics Strataview seismograph system. High output, triple 40 Hz geophones with 14 cm spikes were deployed in 1 m arrays every 5 m along the line. Considering the target objectives, required resolution, near-surface conditions, and economics, the P-wave source selected for this study was an IVI Minivib in a buggy style configura-tion. Three sweeps with a frequency range of 30-300 Hz were recorded individually at each shot station. The data were saved uncorrelated and unstacked to allow evaluation of precorrela-tion processing techniques (Doll et al., 1996).
Figure 2. P-wave shotgather from the middle of the profile of this study site. Reflections can be seen from 120 to about 300 ms. A split-spread geometry provided reasonable velocity control for deeper reflecting events while increasing the redundancy for near offsets and minimizing the offset-dependent NMO stretch effects. Reflections from 120 to about 300 ms can be seen from a shotgather recorded from the middle of the profile (Figure 2). Dominant frequencies of these reflections on the shot records are around 120 Hz.
Shear wave data were also acquired during this study using the IVI Minivib. Four 3.5 second 15–150 Hz upsweeps were re-corded at each station with the first sweep used to seat the base plate. The mass was oriented perpendicular to the survey line providing a polarized SH wave. Single 14 Hz geophones oriented in an SH configuration were deployed along the sur-vey line in 5 m intervals. In general, shotgathers show reflec-tions from about 100 to 440 ms (Figure 3). Reflections with an origin time of around 440 ms have a velocity of about 1680 ms and depth of nearly 370 m.
Figure 3. S-wave shotgather from the beginning of the profile. The reflection at about 440 ms is consistent with the 225 ms reflection from the P-wave data set. Data Processing and Analysis The P- and S- wave data were processed using WinSeis, a commercial processing software package designed for shallow seismic data. The processing flow used for the P-wave data was consistent with acceptable shallow, high-resolution pro-cessing practices (Steeples and Miller, 1990) as well as all aspects of conventional processing approaches (Yilmaz, 1987). Care was taken with to appropriately mute noise (Baker et al., 1998) and to ensure the NMO stretch mute effects were minimal (Miller, 1992). After conducting various precorrela-tion processing tests, deconvolving the data with the ground force provided the best results. P-wave stacked sections used for this study possess a nominal 48-fold and include interpret-able reflections from about 60 ms to more than 350 ms (Fig-ure 4). With the exception of a whole trace AGC (applied only for display purposes), spherical divergence was the only amplitude correction applied to the P-wave data set. There-fore, for purposes of this particular study, the P-wave data set could be considered true amplitude. Time-to-depth conversion was accomplished using stacking velocities obtained through careful analysis of constant veloc-ity stacks. The stacking velocities ranged from about 2500 m/sec at 80 ms to over 3500 m/sec at 350 ms. This range of velocities is consistent with the consolidated limestone/shale sequences overlain by a thin (o to 1 m) veneer of weathered shale present at this site.
SEG 2000 Expanded Abstracts Main MenuSEG 2000 Expanded Abstracts Main Menu

P- and S-wave to detect shallow gas sand
At 120 ms on the P-wave stacked section between about CMPs 1060 and 1150, the reflection amplitude appears higher than any other location on the line (Figure 4). Some dimming in the 150 ms reflection can be observed directly beneath the higher amplitude segment of the 120 ms reflection. Contin-uous core data acquired 100 m offline and adjacent to station 1130 encountered a thick sand sequence and free gas at a depth of around 130 m (Figure 5). The amplitude characteris-tics previously described are consistent with a gas induced bright spot. Reflections on the P-wave stacked section that can be corre-lated to gas reservoirs in this apparent type 1 environment should be characterized by amplitude dimming. However, re-flections from at or within the gas reservoir have high ampli-tudes, inconsistent with a class 1 model. There were sufficient offsets acquired at the time/depth of interest to observe a phase reversal if present as would be expected for high imped-ance gas reservoirs. P-wave shot gathers over the gas-rich portion of the sand possess AVO effects consistent with a near-zero impedance gas sand reservoir (class 2) (Figure 2). Zero impedance reser-voirs are characterized by gradational upper contacts, usually in moderately consolidated environments. This was not ex-pected in this setting, which, based on the local geology alone, should be considered a mature highly compacted sand. High amplitude reflections associated with this 130 m deep reflec-tor, located at 120 ms, become quite pronounced at offsets greater than 150 m. This observation is completely consistent with the geologic interpretations made from the core and log data from the well drilled near CMP 1130. A reflection at 440 ms on the shear wave shotgather translates to a depth of 370 m using a stacking velocity calculated to be 1680 m/sec (Figure 3). This reflection directly correlates to the 225 ms reflection on the P-wave section. This P-wave reflec-tion has a stacking velocity of about 3200 m/sec. This 2 to 1 velocity ratio is expected for this general geologic setting (Carmichael, 1989). Conclusions The seismic response of the gas reservoir imaged with this high-resolution reflection survey was consistent with the expectations based on core and log analysis but completely the opposite of the response predicted based on the general geo-logic setting alone. High amplitude bright spots are indicative of gas in this mature, consolidated geologic setting. Grada-tional contacts between the sand and shale provided the near-zero impedance contrast consistent with class 2 gas reservoirs. Amplitude versus offset changes observed on the P-wave shot
gathers provide astounding evidence for the trapping mechan-ism, which, after reexamination of the borehole data, was inconsistent with theory for this particular geologic setting. References Baker, G.S., D.W. Steeples, and M. Drake, 1998, Muting the noise
cone in near-surface reflection data: An example from south-eastern Kansas: Geophysics, v. 63, p. 1332-1338.
Carmichael, R.S., 1989, Practical Handbook of Physical Properties of Rocks and Minerals: CRC Press, Inc.
Doll, W.E., R.D. Miller, and J. Xia, 1996, Enhancement of swept source near-surface seismic reflection data at a hazardous waste site: 66th Annual Internat. Mtg., Soc. Expl. Geophys., Expanded Abstracts, p. 877-879.
Jongerius, P., and K. Helbig, 1988, Onshore high-resolution seismic profiling applied to sedimentology: Geophysics, v. 53, p. 1276-1283.
Khattri, K., R. Mithal, and V. Gaur, 1979, Pattern space of seismic anomalies associated with hydrocarbon deposits: Geophysical Prospecting, v. 27, p. 339-359.
Miller, R.D., D.W. Steeples, and M. Brannan, 1989, Mapping a bedrock surface under dry alluvium with shallow seismic reflec-tions: Geophysics, v. 54, p. 1528-1534.
Miller, R.D., 1992, Normal moveout stretch mute on shallow-reflection data: Geophysics, v. 57, p. 1502-1507.
Miller, R.D., N.L. Anderson, H.R. Feldman, and E.K. Franseen, 1995, Vertical resolution of a seismic survey in stratigraphic sequences less than 100 m deep in Southeastern Kansas: Geophysics, v. 60, p. 423-430.
Ostrander, W.J., 1982, Plane-wave reflection coefficients for gas sands at nonnormal angles-of-incidence: Geophysics, v. 49, p. 1637-1648.
Pullan, S.E., and J.A. Hunter, 1990, Delineation of buried bedrock valleys using the optimum offset shallow seismic reflection tech-nique: Soc. Explor. Geophys. Investigations in Geophysics no. 5, S.H. Ward, ed., Volume 3: Geotechnical, p. 75-87.
Pullan, S.E., J.A. Hunter, H.M. Jol, M.C. Roberts, R.A. Burns, and J.B. Harris, 1998, Seismostratigraphic investigations of the south-ern Fraser River delta: In Geology and Natural Hazards of the Fraser River Delta, British Columbia, ed. J.J. Clague, J.L. Luter-nauer, and D.C. Mosher. Geological Survey of Canada, Bulletin 525, p. 91-122.
Rascoe, B. Jr., and F.J. Adler, 1983, Permo-carboniferous hydro-carbon accumulations, Mid-Continent, U.S.A.: American Associ-ation of Petroleum Geologists Bulletin, v. 67, no. 6, p. 979-1001.
Rutherford, S.R., and R.H. Williams, 1989, Amplitude-versus-offset variations in gas sands: Geophysics, v. 54, p. 680-688.
Shtivelman, V., U. Frieslander, E. Zilberman, and R. Amit, 1998, Mapping shallow faults at the Evrona playa site using high-resolution reflection method: Geophysics, v. 63, p. 1257-1264.
Steeples, D.W., and R.D. Miller, 1990, Seismic reflection methods applied to engineering, environmental, and groundwater prob-lems: Soc. Explor. Geophys. Investigations in Geophysics no. 5, Stan H. Ward, ed., Volume 1: Review and Tutorial, p. 1-30.
Yilmaz, O., 1987, Seismic data processing, in S.M. Doherty, ed., E.B. Neitzel, series ed., Series: Investigations in geophysics no. 2: Soc. Expl. Geophys.
SEG 2000 Expanded Abstracts Main MenuSEG 2000 Expanded Abstracts Main Menu

P- and S- wave to detect shallow gas sand
Figure 4. P-wave stacked section with a nominal 48-fold. The reflection associated with the gas is located at 120 ms.
Figure 5. P-wave depth section. Core data was acquired 100 m offline at CMP station 1130 and encountered a thick sand sequence including free gas at around a depth of 130 m.
SEG 2000 Expanded Abstracts Main MenuSEG 2000 Expanded Abstracts Main Menu