Embed Size (px)
Citation preview

MATEC Web of Conferences 14, 11002 (2014)DOI: 10.1051/matecconf/20141411002c© Owned by the authors, published by EDP Sciences, 2014
High resolution orientation mapping of secondary phases inATI 718Plus R© alloy
Robert Krakow1, Mark C. Hardy2, Catherine M.F. Rae1,a, and Paul A. Midgley1,a
1 Department of Materials Science and Metallurgy, University of Cambridge, 27 Charles Babbage Road, CB3 0FSCambridge, UK
2 Rolls-Royce plc, PO Box31, Derby DE24 8BJ, UK
Abstract. The polycrystalline superalloy ATI 718Plus R©(hereafter 718Plus) has been developed to replace theestablished alloy Inconel 718 by offering higher temperature capability for applications in gas turbines. Thealloy exhibits two secondary phases in the austenitic matrix; it is strengthened by the γ ′-phase with η-phasediscontinuously precipitated at the grain boundaries. It can be utilized to control grain growth during forging.Generally, hexagonal η phase has been reported to possess a defined crystallographic orientation with the matrix.However, the material studied here exhibits blocky η-phase that has been precipitated and grown during thermo-mechanical processing. Therefore a measurable change in orientation relationship is expected. The standardtechnique for orientation mapping is electron back-scattered diffraction with spatial resolution of 100 nm. That isinsufficient for studying η-phase in 718Plus. By applying high resolution orientation mapping in the transmissionelectron microscope (Philips CM 300 FEGTEM) equipped with a Nanomegas ASTARTM system a resolution of3 nm was achieved. The indexed diffraction data was analysed using the Matlab Toolbox Mtex. The analysisincluded grain reconstruction and exclusion of low confidence measurements. The data set allows generatingphase boundary maps indicating interfaces characteristics. Quantitative assessment shows that only 19% of theγ -η-interfaces fulfil the orientation relationship.
1. Introduction
Nickel base alloys are a complex class of materialswith up to 40 wt.% of added alloying elements.The intricate chemistry facilitates their application athigh homologous temperatures by providing the basisfor different strengthening mechanisms [1]. Precipitatestrengthening is probably the most important mechanismutilizing coherent secondary phases [2–4]. The aim ofthis study is to be able to discern phase boundaries ofdifferent types in order to be able to quantify them andto understand their influence on mechanical properties andmaterials behaviour in the long term [5].
The superalloy 718Plus is an excellent candidateto study phase boundaries since it exhibits multiplesecondary phases and different morphologies dependingon thermo-mechanical history of the material [6]. Oneexample is the boundary between the matrix phase anddisc-shaped η phase in 718Plus. The hexagonal η phasecan occur as fine colony of needles or in a moreblocky morphology, compared to the first. While theblocky η can be studied using conventional electronbackscattered electron diffraction, this is not possiblefor the thin lamellar morphology. The ASTARTM systemallows reliable mapping of nm-sized objects [7,8].
a Corresponding authors: Catherine M.F. Rae - [email protected], Paul A. Midgley - [email protected]
2. Acquisition conditions
The phase and orientation mapping experiments wereconducted on a Philips CM300 FEGTEM with retrofittedASTARTM system (NanoMEGAS). The optimal acqui-sition conditions depend on the specimen material andpreparation and should be adjusted to deliver diffractionpatterns which can be recognized unambiguously by theindexation software. For the herein discussed 718Plussample from forged and heat treated material theparameters in Table 1 were found to work best.
Detailed description of the ASTARTM system can befound elsewhere [9–12]. In brief, a map is generated froma site of interest which is scanned using a focussed electronbeam. The generated diffraction pattern is recorded foreach point of the scanned area and is subsequentlycompared to a set of diffraction pattern templates in a semi-automatic process that yields the orientation and phaseinformation for each pixel.
The condenser aperture is essential in defining thecollection angle of the beam at the condenser lens. For themapping experiment an aperture size must be chosen thatallows a high beam current for a satisfactory signal to noiseratio.
The step and spot size need to be chosen such that themap resolution can be used to reveal details of the featuresstudied. The spot size defines the area (volume) of excitedmaterial for each pixel. The step size is the distance been
This is an Open Access article distributed under the terms of the Creative Commons Attribution License 4.0, which permits unrestricted use, distribution,and reproduction in any medium, provided the original work is properly cited.
Article available at http://www.matec-conferences.org or http://dx.doi.org/10.1051/matecconf/20141411002
MATEC Web of Conferences
Table 1. TEM/ASTAR acquisition parameters for high resolutionorientation mapping of 718Plus specimens.
RecommendedParameter valueAcceleration voltage, kV 300Condenser aperture, µm 50Spot size, nm 10Camera Length L, cm (as per TEM screen) 15Step size, nm 12.5Precession angle (◦) 0.5
individual scans. Careful consideration is required to avoiddouble or under sampling. A step size of 3 nm deliveredacceptable results, however 7 nm were preferred due to theshorter acquisition times.
2.1. Precession electron diffraction (PED)
The Digistar unit is used for the scanning of the area ofinterest. In addition, it can be used to apply precessionelectron diffraction (PED), first used by Vincent andMidgley in 1993 [13]. For PED the electron beam is tiltedand rotated at a constant angle around the optical axisabove the specimen to give a hollow cone illumination.This is compensated by an equal and opposite action belowthe specimen. Combined, the double-conical scanning isequivalent to the precession of the sample.
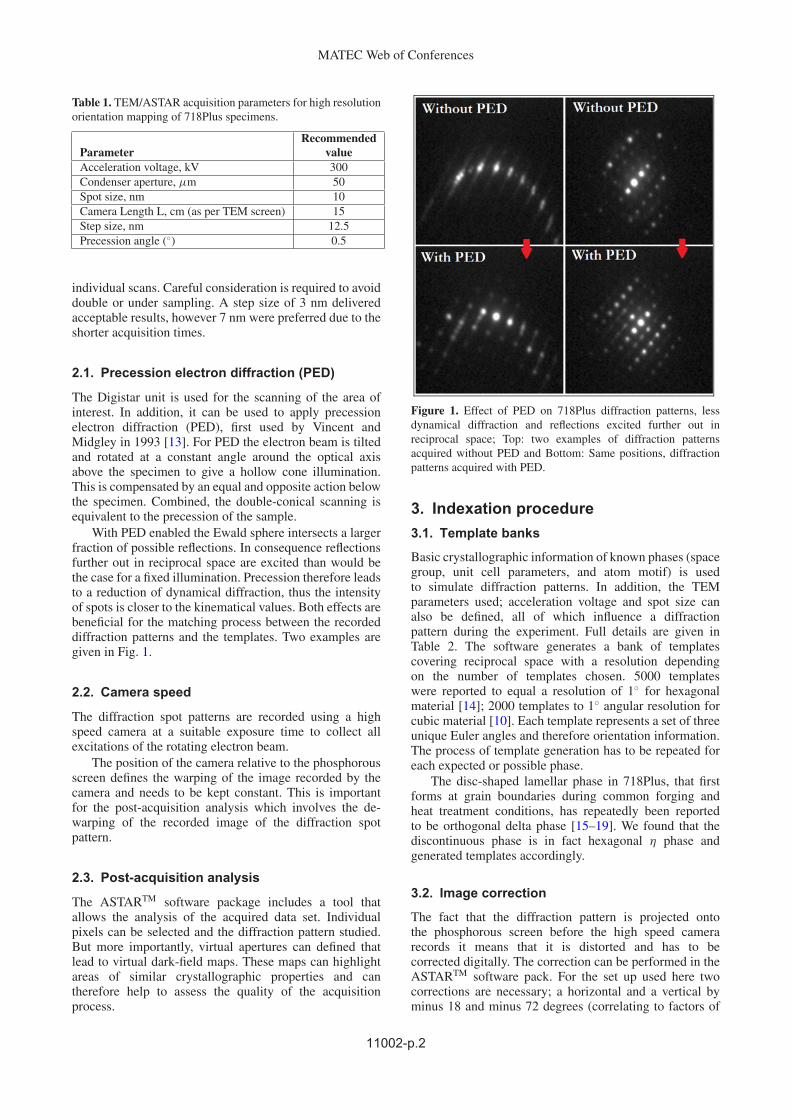
With PED enabled the Ewald sphere intersects a largerfraction of possible reflections. In consequence reflectionsfurther out in reciprocal space are excited than would bethe case for a fixed illumination. Precession therefore leadsto a reduction of dynamical diffraction, thus the intensityof spots is closer to the kinematical values. Both effects arebeneficial for the matching process between the recordeddiffraction patterns and the templates. Two examples aregiven in Fig. 1.
2.2. Camera speed
The diffraction spot patterns are recorded using a highspeed camera at a suitable exposure time to collect allexcitations of the rotating electron beam.
The position of the camera relative to the phosphorousscreen defines the warping of the image recorded by thecamera and needs to be kept constant. This is importantfor the post-acquisition analysis which involves the de-warping of the recorded image of the diffraction spotpattern.
2.3. Post-acquisition analysis
The ASTARTM software package includes a tool thatallows the analysis of the acquired data set. Individualpixels can be selected and the diffraction pattern studied.But more importantly, virtual apertures can defined thatlead to virtual dark-field maps. These maps can highlightareas of similar crystallographic properties and cantherefore help to assess the quality of the acquisitionprocess.
Figure 1. Effect of PED on 718Plus diffraction patterns, lessdynamical diffraction and reflections excited further out inreciprocal space; Top: two examples of diffraction patternsacquired without PED and Bottom: Same positions, diffractionpatterns acquired with PED.
3. Indexation procedure
3.1. Template banks
Basic crystallographic information of known phases (spacegroup, unit cell parameters, and atom motif) is usedto simulate diffraction patterns. In addition, the TEMparameters used; acceleration voltage and spot size canalso be defined, all of which influence a diffractionpattern during the experiment. Full details are given inTable 2. The software generates a bank of templatescovering reciprocal space with a resolution dependingon the number of templates chosen. 5000 templateswere reported to equal a resolution of 1◦ for hexagonalmaterial [14]; 2000 templates to 1◦ angular resolution forcubic material [10]. Each template represents a set of threeunique Euler angles and therefore orientation information.The process of template generation has to be repeated foreach expected or possible phase.
The disc-shaped lamellar phase in 718Plus, that firstforms at grain boundaries during common forging andheat treatment conditions, has repeatedly been reportedto be orthogonal delta phase [15–19]. We found that thediscontinuous phase is in fact hexagonal η phase andgenerated templates accordingly.
3.2. Image correction
The fact that the diffraction pattern is projected ontothe phosphorous screen before the high speed camerarecords it means that it is distorted and has to becorrected digitally. The correction can be performed in theASTARTM software pack. For the set up used here twocorrections are necessary; a horizontal and a vertical byminus 18 and minus 72 degrees (correlating to factors of
11002-p.2

EUROSUPERALLOYS 2014
Table 2. Analysis conditions for semi-automatic patternmatching (indexation).
Setting Recommendedtype valueCamera Length L, cm (analysis parameter) 16.35Horizontal distortion 18Vertical distortion 62Number of templates (eta) 5151Number of templates (nickel) 1326
1.07619 and 1.55556), respectively. The other importantvalue for the image correction is camera length. Duringthe course of the experiment it was found that there canbe a notable difference between camera length values asdisplayed in the TEM and the recorded image.
3.3. Matching process
During the matching process the recorded image of eachscanned point is compared to all templates of eachtemplate bank. A matching function defines the similaritybetween template and pattern and attributes a value, calledthe confidence index. The highest confidence index foundis automatically chosen to be the best solution for that pixelof the scanned area. The confidence index is thus a measurefor the quality of the matching process and can be usedto improve the subsequent generation of orientation andphase maps similar to the MAD (mean angular deviation)in other software solutions.
The second quality measure is the reliability index.It symbolizes the uniqueness of the best matching result.The value will be high if only one good solution has beenfound. It will be lower if the second best solution is almostas good as the best.
3.4. Data processing
For the generation of orientation and phase maps as wellas maps for confidence and reliability index the Matlabtoolbox Mtex [20,21] was used. The data transfer was donevia the .ang export format.
The quality values can be used in order to clean up thedata set. During this process incorrectly indexed points canbe eliminated. Due to the setup of the indexation processthere is no pixel which is left unindexed.
4. ResultsThe clean data set can further be processes. Classicaldisorientation angles are meaningful for describing grainboundary characteristics with the same crystal system[22,23]. For the case of hexagonal eta phase (P63/mmc)[24] which can precipitate with a known orientationrelationship (Blackburn orientation relationship) in cubicgamma matrix (Fm3m) [25], there is no predefinedsolution available in Mtex. However, an algorithm wasprogrammed that highlighted those phase boundaries thatfulfilled the Blackburn orientation relationship (1).
{111}γ ‖(0001)η
〈11r〉γ ‖(2110)η. (1)
Figure 2. Virtual bright field image of complex 718Plusmicrostructure showing the analysed area of interest with severaleta particles (η) surrounded by gamma matrix (γ ). Several phasenot annotated to aid clarity.
4.1. Semi-quantitative results
High resolution orientation mapping was applied to arepresentative area of 2237.5 × 2237.5 nm2 of 718Plusforged microstructure. The area was selected based on theoccurrence of several precipitates that partially resided atgrain boundaries, partially in the grain interior (see Fig. 2).The precipitates were several 100 nm in length and rangedfrom 50 to 300 nm in diameter. A separate paper describingthe disc shape of the η phase is in preparation.
Figures 3A and B represent maps of quality values,reliability and confidence index, for the acquired data set.Both maps were generated using a similar colour code withdark blue values correlating to low and yellow/red correlat-ing to high quality values. When looking at them in detailit can be concluded that reliability values drop at grainand phase boundaries, mainly due to overlaying diffractionpatterns of either side of the boundary. Moreover, lowreliability values can be found for orientations that are lessunique.
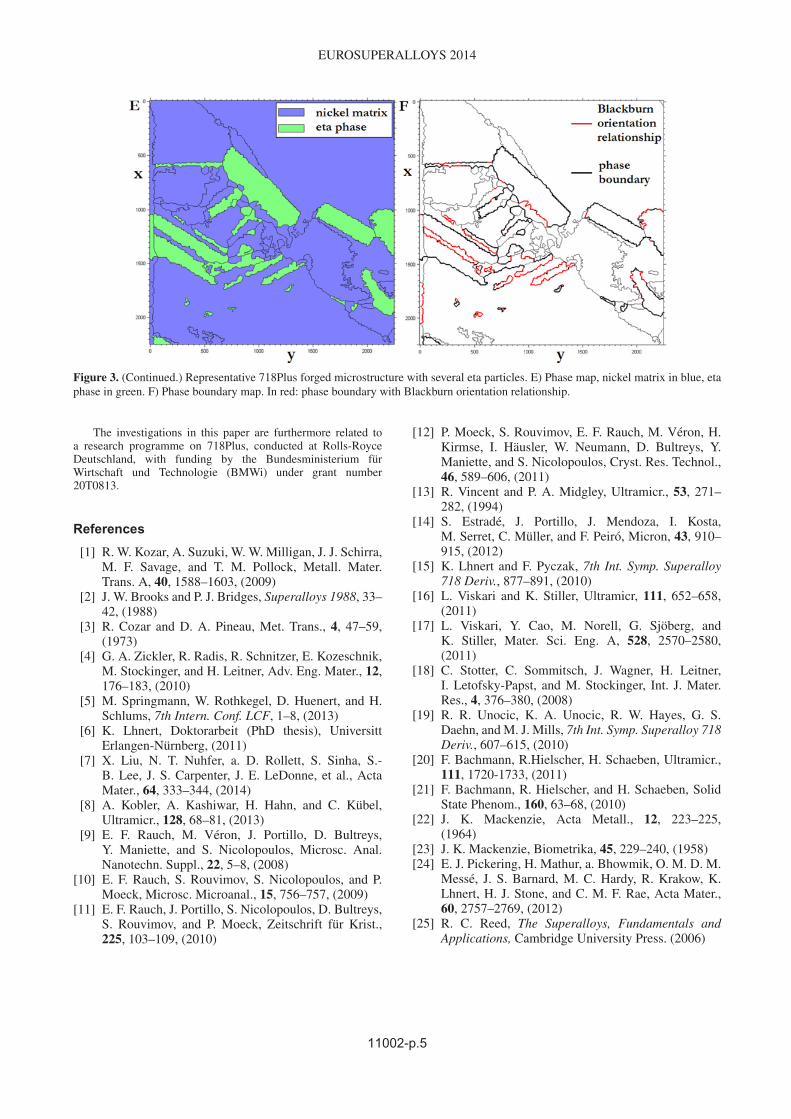
A useful way of depicting a data set is to plot phasemap and orientation maps. In Fig. 3E eta is depictedin light green and gamma is shown in light purple. A phasemap is clearly easier interpretable then a bright field image,with varying brightness values from very bright to verydark, depending on their orientation. A virtual bright fieldimage is given in Fig. 2. The orientation map can also giveuseful insight into the forged microstructure. Annealingtwins, known to occur in nickel alloys, can thus moreeasily be identified than tilting onto a suitable diffractioncondition. In order to study the specific orientationrelationship of eta phase and matrix, the Mtex toolbox wasused to combine boundary maps.
Firstly, phase boundaries were identified using thephase information in the data set. Secondly, a unique dis-orientation angle was found, that represents the Blackburnorientation relationship and a disorientation angle plot wasgenerated, highlighting these boundaries.
11002-p.3

MATEC Web of Conferences
Figure 3. Representative 718Plus forged microstructure with several eta particles. A) Map of confidence index for values above 130.B) By using A as source: Map of reliability index for values above 8, high confidence in yellow and red, low in blue. C) map depictingHROM raw data. D) orientation map indicating grain orientation.
A combined plot (Fig. 3F) highlights boundariesthat most likely represent boundaries with Blackburnorientation relationship. Finally, for the limited number ofboundaries the validity of the results were checked andconfirmed. The software furthermore allows the readoutof boundary length. For the depicted data set in Fig. 3it was found that 19% of boundaries fulfil the Blackburnorientation relationship. It is important to note that thisdoes not mean that 19% of eta phase are lamellar ratherthan blocky since blocky eta phase can also have one ormore phase boundaries fulfilling the requirements.
This analysis can be a first step in understandingthe effect of discontinuously precipitated phase at grainboundaries on fatigue crack propagation. Coherent etaphase residing in the cubic gamma matrix is likely toexhibit stronger phase boundaries and a low misfit between
the phases, making them more desirable than high misfitboundaries. For a more applied discussion the location ofthe phase also needs to be considered. If discontinuous etaphase, for example, has grown into the grain interior anddoes not cover the grain boundary, it cannot act as potentialbarrier for intergranular cracks. These considerations arenot covered in this approach.
The authors acknowledge and thank Rolls-Royce plc for theirfinancial support in the completion of this work. Permission topublish this article has been given by Rolls-Royce Deutschlandand the University of Cambridge. The authors would like to thankDr A.S. Eggeman and Dr J. Potillo for their assistance during theproject. This work was supported by Rolls-Royce and the EPSRCunder EP/H022309/1 and EP/H500375/1. We would like to thankNanomegas for the provision of the ASTAR system under theauspices of EC FP7 grant ESTEEM2.
11002-p.4
EUROSUPERALLOYS 2014
Figure 3. (Continued.) Representative 718Plus forged microstructure with several eta particles. E) Phase map, nickel matrix in blue, etaphase in green. F) Phase boundary map. In red: phase boundary with Blackburn orientation relationship.
The investigations in this paper are furthermore related toa research programme on 718Plus, conducted at Rolls-RoyceDeutschland, with funding by the Bundesministerium furWirtschaft und Technologie (BMWi) under grant number20T0813.
References
[1] R. W. Kozar, A. Suzuki, W. W. Milligan, J. J. Schirra,M. F. Savage, and T. M. Pollock, Metall. Mater.Trans. A, 40, 1588–1603, (2009)
[2] J. W. Brooks and P. J. Bridges, Superalloys 1988, 33–42, (1988)
[3] R. Cozar and D. A. Pineau, Met. Trans., 4, 47–59,(1973)
[4] G. A. Zickler, R. Radis, R. Schnitzer, E. Kozeschnik,M. Stockinger, and H. Leitner, Adv. Eng. Mater., 12,176–183, (2010)
[5] M. Springmann, W. Rothkegel, D. Huenert, and H.Schlums, 7th Intern. Conf. LCF, 1–8, (2013)
[6] K. Lhnert, Doktorarbeit (PhD thesis), UniversittErlangen-Nurnberg, (2011)
[7] X. Liu, N. T. Nuhfer, a. D. Rollett, S. Sinha, S.-B. Lee, J. S. Carpenter, J. E. LeDonne, et al., ActaMater., 64, 333–344, (2014)
[8] A. Kobler, A. Kashiwar, H. Hahn, and C. Kubel,Ultramicr., 128, 68–81, (2013)
[9] E. F. Rauch, M. Veron, J. Portillo, D. Bultreys,Y. Maniette, and S. Nicolopoulos, Microsc. Anal.Nanotechn. Suppl., 22, 5–8, (2008)
[10] E. F. Rauch, S. Rouvimov, S. Nicolopoulos, and P.Moeck, Microsc. Microanal., 15, 756–757, (2009)
[11] E. F. Rauch, J. Portillo, S. Nicolopoulos, D. Bultreys,S. Rouvimov, and P. Moeck, Zeitschrift fur Krist.,225, 103–109, (2010)
[12] P. Moeck, S. Rouvimov, E. F. Rauch, M. Veron, H.Kirmse, I. Hausler, W. Neumann, D. Bultreys, Y.Maniette, and S. Nicolopoulos, Cryst. Res. Technol.,46, 589–606, (2011)
[13] R. Vincent and P. A. Midgley, Ultramicr., 53, 271–282, (1994)
[14] S. Estrade, J. Portillo, J. Mendoza, I. Kosta,M. Serret, C. Muller, and F. Peiro, Micron, 43, 910–915, (2012)
[15] K. Lhnert and F. Pyczak, 7th Int. Symp. Superalloy718 Deriv., 877–891, (2010)
[16] L. Viskari and K. Stiller, Ultramicr, 111, 652–658,(2011)
[17] L. Viskari, Y. Cao, M. Norell, G. Sjoberg, andK. Stiller, Mater. Sci. Eng. A, 528, 2570–2580,(2011)
[18] C. Stotter, C. Sommitsch, J. Wagner, H. Leitner,I. Letofsky-Papst, and M. Stockinger, Int. J. Mater.Res., 4, 376–380, (2008)
[19] R. R. Unocic, K. A. Unocic, R. W. Hayes, G. S.Daehn, and M. J. Mills, 7th Int. Symp. Superalloy 718Deriv., 607–615, (2010)
[20] F. Bachmann, R.Hielscher, H. Schaeben, Ultramicr.,111, 1720-1733, (2011)
[21] F. Bachmann, R. Hielscher, and H. Schaeben, SolidState Phenom., 160, 63–68, (2010)
[22] J. K. Mackenzie, Acta Metall., 12, 223–225,(1964)
[23] J. K. Mackenzie, Biometrika, 45, 229–240, (1958)[24] E. J. Pickering, H. Mathur, a. Bhowmik, O. M. D. M.
Messe, J. S. Barnard, M. C. Hardy, R. Krakow, K.Lhnert, H. J. Stone, and C. M. F. Rae, Acta Mater.,60, 2757–2769, (2012)
[25] R. C. Reed, The Superalloys, Fundamentals andApplications, Cambridge University Press. (2006)
11002-p.5